Abstract
The physical and chemical characteristics of the microwave discharge in petroleum solvent during hydrogen production processes involving Ar, He, and CO2 barbotage were studied. Gas chromatography, emission spectroscopy, high-speed photography, and shadow photography were used for diagnosis. The results demonstrated the dependence of hydrogen yield on the flow rates of Ar, He, and CO2. The maximum yield values of hydrogen were 791 mL/min and 811 mL/min, while the maximum energy efficiency reached 135.6 NL/kWh and 162.2 NL/kWh in Nefras with Ar and He barbotage, respectively. The dynamics of discharge structure and the rotational and vibrational temperatures of C2 molecules were studied.
1. Introduction
Recently, there have been many publications devoted to the production of hydrogen. Hydrogen should become a source of energy for sustainable development, which would allow for a number of environmental problems to be solved. Whether hydrogen can meet the world’s energy needs is an issue that is still being debated. Detailed analysis of this problem was provided in [1]. It is concluded that, at present, the most realistic method of hydrogen energy development is low-tonnage hydrogen production in the place of consumption.
Extensive research is underway to utilize hydrogen in place of traditional energy sources. In addition to environmental safety, hydrogen has the highest calorific value compared to other fuels (hydrogen combustion provides 142 kJ g−1 of energy, while for gasoline, ethanol, wood, coal, and natural gas these energy values are 47 kJ g−1, 29.7 kJ g−1, 15 kJ g−1, 27 kJ g−1, and 54 kJ g−1, respectively [2]). Steam reforming, carbon dioxide reforming, partial oxidation, and pyrolysis are the conventional methods for producing hydrogen from hydrocarbons [3,4,5]. Low-temperature plasma provides new methods of hydrogen production [6,7,8,9,10,11,12,13,14,15,16,17,18,19,20,21,22,23]. Almost all types of gas discharge are used to produce plasma, including barrier, radio frequency, microwave, and arc discharges in gas media containing hydrocarbons or alcohol vapors.
Microwave discharge (MD) in liquids is a new type of discharge that can be used in many applications, in particular for producing hydrogen through MD in liquid hydrocarbons and alcohol solutions [24,25,26,27,28,29,30,31,32,33,34,35,36,37,38,39,40]. The discharge occurs at the tip of a microwave antenna in a gas bubble created in a volume of liquid. The discharge initiates plasma chemical reactions in the bubble. The maximum size of a gas bubble is determined by the equality to zero of the resultant action of gravitational, Archimedes, and surface tension forces. After that, the bubble is detached from the antenna, and the plasma decays due to the decreased strength of the microwave field as it moves away from the antenna. As mentioned previously, microwave discharge is ignited in a gas bubble inside the liquid. This means that the surface of the bubble is in contact with the high-temperature plasma zone; therefore, the inflow rate of liquid molecules into the bubble filled with plasma is very high. Thus, the densities of active plasma particles (atoms, radicals, and charged particles) are also high. All of this leads to highly efficient physicochemical processes and, accordingly, high formation rates for the reaction products.
The main task of this article was to study the possibilities of controlling the chemical activity of MD in liquid hydrocarbons for hydrogen production using various bubbling gases (Ar, He, and CO2). The criterion for the change in chemical activity was a change in the yield of various components of the gas mixture. The use of gas additives will provide additional information and enable a better understanding of the physics of processes in this little-studied type of discharge.
2. Experimental Setup
A detailed description of the experimental setup was provided in [41,42], and the setup is schematically shown in Figure 1. It consists of a magnetron generator (2.45 GHz) and a system for controlling and measuring the microwave power entering the reactor (200–350 W). A waveguide-to-coaxial junction was used to introduce energy into the reactor. The center stainless steel conductor with an external diameter of 2.0 mm serves as the microwave antenna. The quartz reactor with a diameter of 55 mm was filled with 40 mL of liquid hydrocarbon. A metal mesh was used to prevent microwave radiation from the reactor. The antenna was immersed in the liquid during the experiments at atmospheric pressure above the liquid surface.
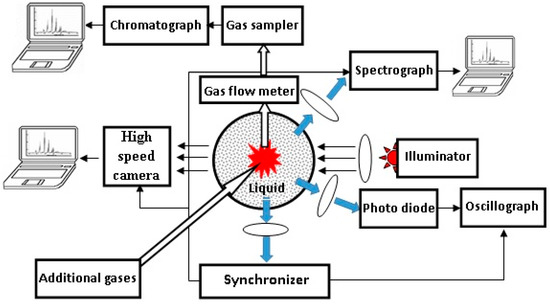
Figure 1.
Schematic of the experimental setup.
Different optical methods in the visible wavelength range were used to study the discharge: a BS520 photodiode for visible light was used to study the total intensity of discharge radiation (the signal was measured using an AKIP-4126/3A-X 4-channel oscilloscope), and an AvaSpec-3628 gated spectrograph (wavelength range of 172–744 nm, spectral resolution of 1 nm, and shutter speed of ≥1 ms) was used to study the time-resolved discharge emission [41,42]. The “Specair-3.0” program was used to analyze the measured spectra [43].
Time-resolved visualization of the discharge was provided with a K-011 video camera. This camera gives nine successive photos with nanosecond resolution. A white light emission diode was used as a source of illumination of the discharge to obtain the shadow photographs [41]. Using shadow photography, the image of the object was distorted in the radial direction when radiation passed through a vertically arranged discharge tube with liquid, which was a cylindrical lens (the image was stretched in the radial direction). To compensate for the distortion, a cylindrical tube with liquid with a diameter equal to the diameter of the discharge tube was placed in front of the illuminator. Its axis was directed along the normal to the axis of the discharge.
An optical sensor was used for synchronization of all measuring devices with the moment of discharge ignition [41,42].
Petroleum solvent Nefras S2 80/120 was used as a liquid medium [41]. This solvent is a mixture of light hydrocarbons with boiling temperatures ranging between 80 and 120 °C (the composition of Nefras is presented in Table 1). This solvent can be considered as representative of non-polar liquid alkanes (CnH2n+2, n < 8). Alkanes were chosen because they have a small loss tangent in the microwave range of wavelengths so that all the energy is absorbed by plasma, and heating of the liquid is negligibly small.

Table 1.
Composition of Nefras S2 80/120.
Why did we use Nefras rather than pure individual alkanes ? The determining factor here was that Nefras is much cheaper than alkanes. It should be noted that a comparative study of the emission spectra and main gas products in Nefras showed than they were the same as in other non-polar hydrocarbons [44,45]. These products are H2, CH4, C2H2, C2H4, and C2H6.
Additional bubbling gases, Ar (with a flow rate of 400–800 mL/min), CO2 (with a flow rate of 0–74 mL/min), and He (the flow rates were 600 and 800 mL/min), were introduced to the plasma zone through the channel in the antenna. A water cooler was used to prevent the vaporized hydrocarbon from entering the sample. The total flow of gas components at the reactor outlet was measured by a flow meter.
A portable back flush gas chromatograph (NPF MEMS, Samara, Russia) with argon as a carrier gas was used to measure the main gas composition in the discharge products. The chromatograph contains thermal conductivity detectors and two columns filled with Hayesep N and 13F molecular sieves.
The main determining parameters for process characterization in this study were the flow rates of products. These flows were determined from the measured total gas flow and the content of a particular component, determined by gas chromatography.
3. Results and Discussion
The main gas products of MD in most liquid hydrocarbons, as noted above, are H2, CH4, C2H2, C2H4, and C2H6, and the maximum volume concentration is achieved for H2 (up to 60 vol. %). Therefore, the criterion of the effectiveness of gas additives on the discharge will be the hydrogen yield. The effect of noble and molecular gas additives on the yield of the main product is considered sequentially below.
3.1. Bubbling with Ar
Argon is often used as an additional gas to dilute liquid vapor in a gas bubble. This leads both to easier conditions of discharge ignition and to a decrease in the rate of soot formation in the discharge. The latter, as applied to the MD in n-heptane, is considered in Ref. [44].
Figure 2 shows the variation in H2 yield as a function of the volumetric rate of Ar supply to the discharge. The yield decreases with the increasing Ar feed rate. This may be due to several reasons.
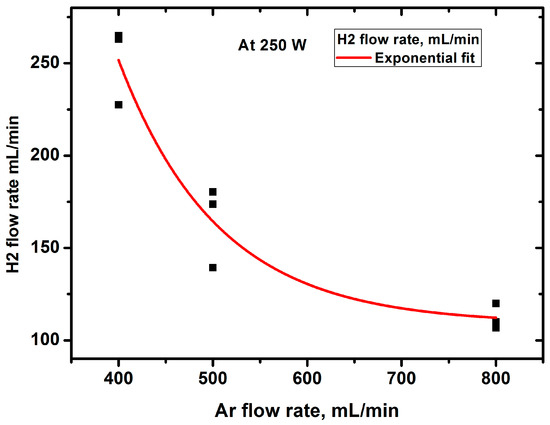
Figure 2.
Dependence of hydrogen yield on the argon flow rate.
The first of these reasons is obvious and is related to the dilution of hydrocarbon vapor with argon in the plasma. This should lead to a decrease in the share of energy for gas and, consequently, a decrease in its temperature. Measuring the emission of the Swan bands at different Ar flow rates and modeling them with the SpecAir code [43] allowed us to obtain the rotational and, equal to it, gas temperature (~4000 K) under the experimental conditions [46]. It does not depend on the Ar flow rate. The reasons for this are analyzed in detail in [44]. Briefly, they summarize that the reduction in the share energy loss for heating due to dilution with argon can be compensated for by a decrease in the thermal conductivity of the medium and a decrease in the thermal effect of chemical reactions. Since at such temperatures the kinetics of chemical processes is controlled by thermal processes [47] and the temperature does not change, we can argue that the product yield will decrease due to the dilution of hydrocarbon vapor with argon. Figure 3 and Figure 4 show the change in the total gas flow rate and product concentration at the reactor outlet when the argon feed rate is changed.
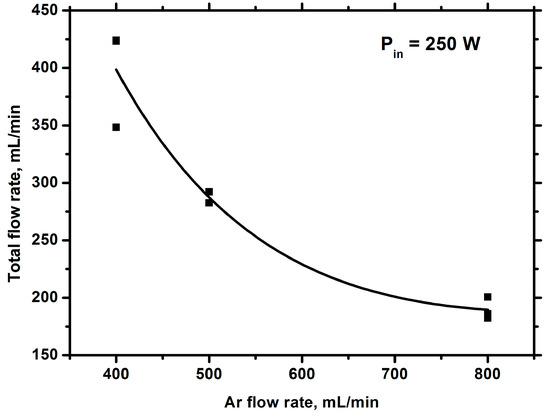
Figure 3.
Total flow rate of gas against the argon flow rate.

Figure 4.
Concentrations of hydrocarbon products against the Ar flow rate.
The second reason can be related to the peculiarities of the processes in the discharge in a gas bubble in a liquid. Indeed, when the Ar feed rate increases, the lifetime of the bubble with plasma at the tip of the antenna before its detachment decreases. The residence time of hydrocarbons in the plasma decreases and, as a consequence, the rate of hydrogen generation decreases. However, the increase in the argon flow rate increases the frequency of bubble generation with plasma, which should lead to an increase in product yield.
From the experimental results obtained, it can be concluded that, when adding argon, the dilution of hydrocarbon vapor with argon is the determining factor affecting the product yield, and an increase in the frequency of gas bubbles cannot compensate for this effect. Note that when the argon content decreases, the hydrogen yield increases, but the soot yield also increases, which is a disadvantage. Therefore, when developing technology, it is necessary to find a compromise between these processes. Product yields increase with increasing incident power (Figure 5, Figure 6 and Figure 7).
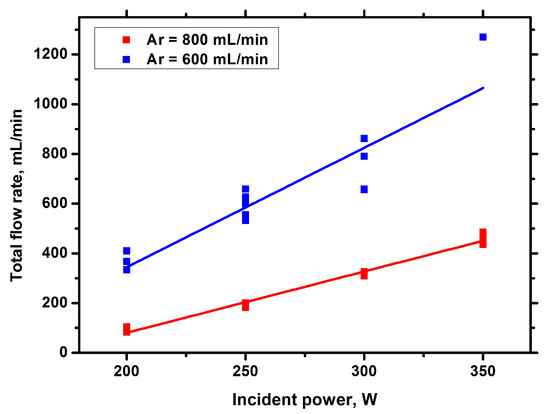
Figure 5.
Total flow rate of gas against the incident power.
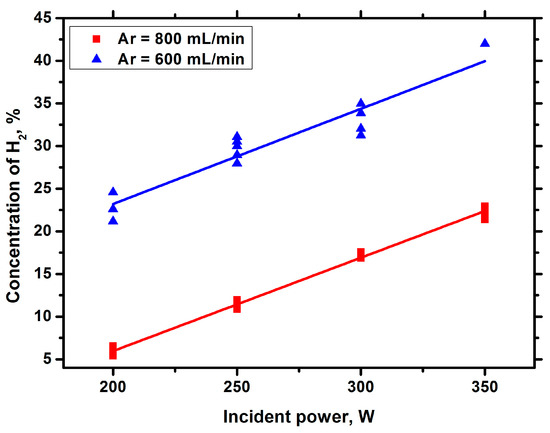
Figure 6.
Hydrogen concentration against the incident power with Ar bubbling.
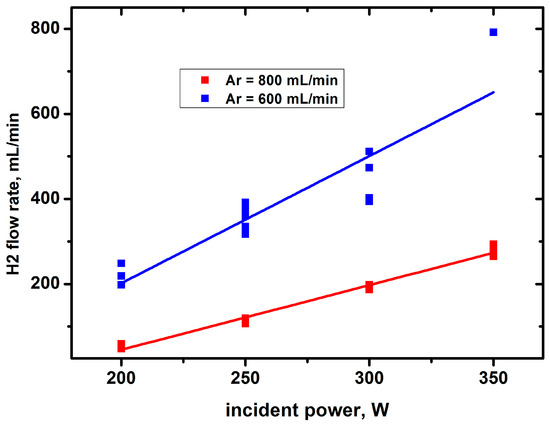
Figure 7.
Hydrogen yield against the incident power with Ar bubbling.
As has already been mentioned in previous works, the MD in liquids is a set of random discharge pulses [41]. An example of a signal from a photodiode illustrating this is shown in Figure 8. The dynamics of solitary discharge development are presented in Figure 9. Figure 9 shows the time variation of the discharge emission intensity obtained with the K-011 camera. The change in the size of a gas bubble with plasma is difficult to determine from conventional discharge photographs. Reliable information about it is provided by shadow photographs. An example of such photographs for a solitary discharge pulse (Figure 10) under argon barbotage is shown in Figure 11.

Figure 8.
Oscillogram of integral discharge emission in the time scale of 5 ms/division.
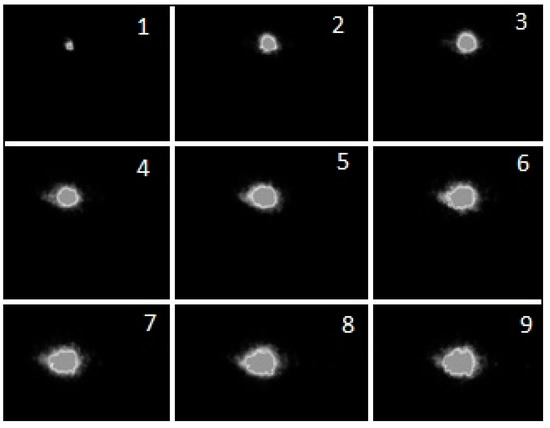
Figure 9.
Sequential photographs of the luminosity of the discharge in Nefras without barbotage of additional gases at an incident power of 175 W with a 0.1 μs frame duration and a 50 μs pause.
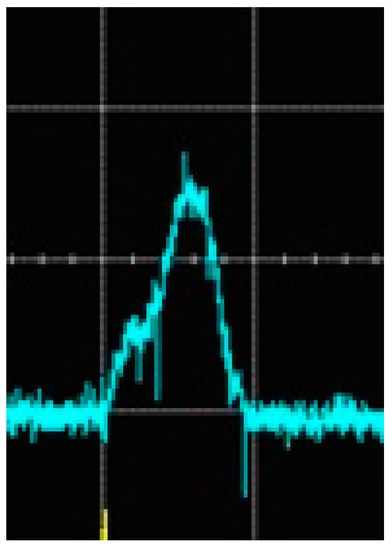
Figure 10.
Oscillogram of the solitary discharge pulse in the time scale of 1 ms/division to which the shadow photos in Figure 11 correspond.

Figure 11.
Sequence of shadow photos of a microwave discharge in Nefras at 200 W incident power with argon barbotage (flow rate 20 mL/min) with a 10 μs frame duration and a 100 μs pause. A cylindrical antenna with a diameter of 2 mm can be seen in the lower part of the pictures.
The dark regions in Figure 11 correspond to the gas bubbles that appeared in the discharge chamber before the discharge occurred during barbotage. They look static because the time of their motion to the liquid surface is much longer than the total time of the shadow photos’ exposition and the growth of the gas bubble in the presence of plasma. The end of a cylindrical antenna with a diameter of 2 mm can be seen at the bottom, which can serve as a scale for measuring the size of the gas bubble. The bright luminous region is the active region of the discharge. It is surrounded by a dark contour, the outer size of which is equal to the size of the gas bubble, which increases as the discharge burns. The last frame shows the extinguishing of the discharge, which corresponds to the oscillogram of its glow in Figure 10. The average growth rate of the bubble with plasma, calculated from the time from the first to the eighth frame, is of the order of 1 × 104 mm/s. It should be noted that the duration of the solitary discharge and its intensity are of random character [41]. Therefore, the above value is only of an evaluative nature.
It is of interest to show another frame of the shadow photographs (Figure 12), which can be jokingly called “Gaze of Plasma Spirit”, which has a simple physical interpretation, however.
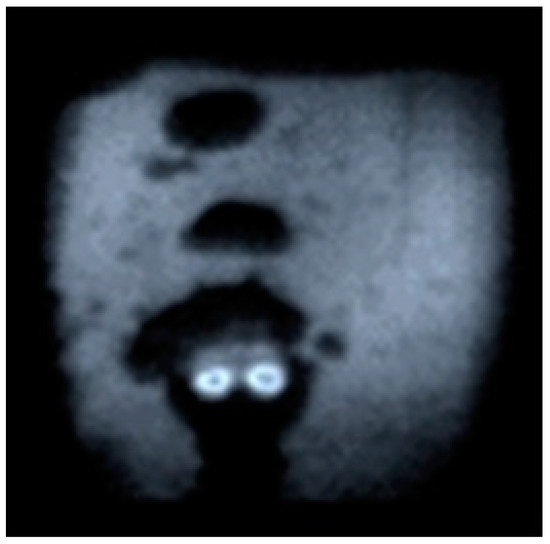
Figure 12.
“Gaze of Plasma Spirit”.
To explain the figure, we recall that the antenna is a tube, and the maximum microwave field is created at its beginning. It is there that the discharge is excited, which is depicted in the figure. As the discharge develops, the central area closes, the “eye” effect disappears, and the impression is created that the discharge burns through the whole diameter of the tube.
Additional information about the properties of the discharge is given by emission spectroscopy of the discharges. These results are presented in Figure 13 and Figure 14.
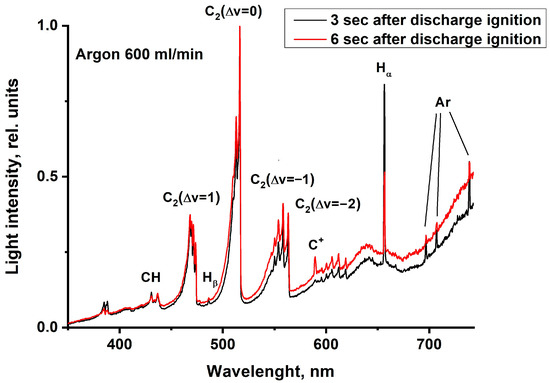
Figure 13.
Optical emission spectra of MD in Nefras with barbotage of argon at different times from discharge ignition at an incident power of 250 W.
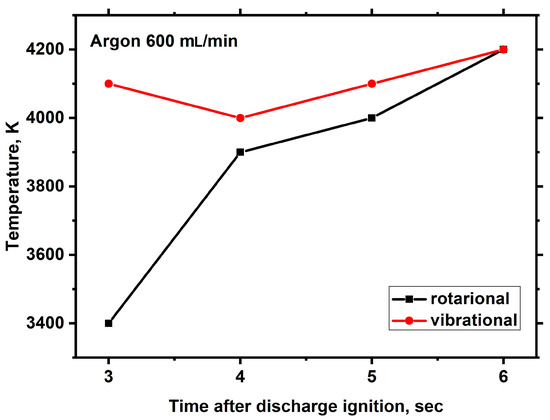
Figure 14.
Time dependencies of the rotational and vibrational temperatures of C2 molecules in the microwave discharge in Nefras with barbotage of argon at an incident power of 250 W.
The spectra were measured at different time instants from the moment of discharge ignition and show the dynamics in the spectra change in time. One spectrum was recorded for a time of 250 μs. The spectrum contains strong Swan bands, CH emissions, and hydrogen and argon atomic lines. These bands are superimposed on the continuum emission due to the presence of soot particles, with the intensity of continuum radiation increasing as the discharge burns.
The processing of the emission spectra of C2 radicals using the SpecAir package [43] allows us to determine their rotational and vibrational temperatures. In [46], it was shown that under the experimental conditions with atmospheric pressure above the liquid surface, the rotational temperature may be considered as the gas temperature. The changes in rotational and vibrational temperatures during discharge burning are shown in Figure 14.
Figure 14 shows that the rotational and vibrational temperatures are significantly different at the initial moment, and with time, they come to an equilibrium value of around 4000 K.
3.2. Bubbling with He
The analysis of hydrocarbon decomposition processes in MD in liquids showed that the main mechanism of decomposition is thermal decomposition, and the electron impact contributes to the decomposition process only at the starting stage of discharge development, when the gas temperature is still low (<1200 K) [47]. When noble gases are added, collisions of hydrocarbon molecules with noble gas atoms in metastable states can promote decomposition. To determine the role of these collisions in the case of MD in Nefras, experiments were carried out with the barbotage of helium through the discharge zone, and the results were compared with those presented in the previous section of the paper for argon bubbling. The excitation potentials of the metastable states of these atoms significantly differed, and, if the role of such atoms is essential, the results for the formation efficiency of all gas products using both gases should be different. The experiments were performed at the same flow rates of the barbotaged gases and in the same ranges of incident power.
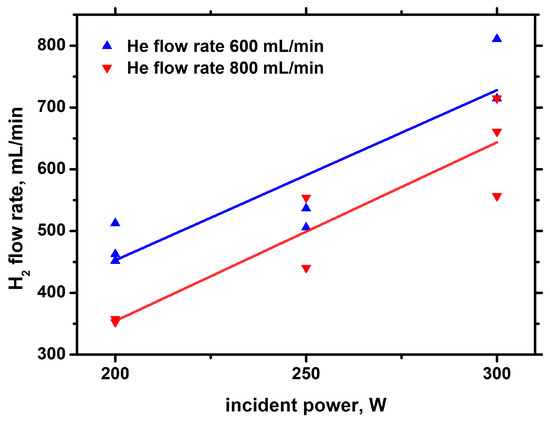
Figure 15.
Hydrogen yield against the incident power with He bubbling.
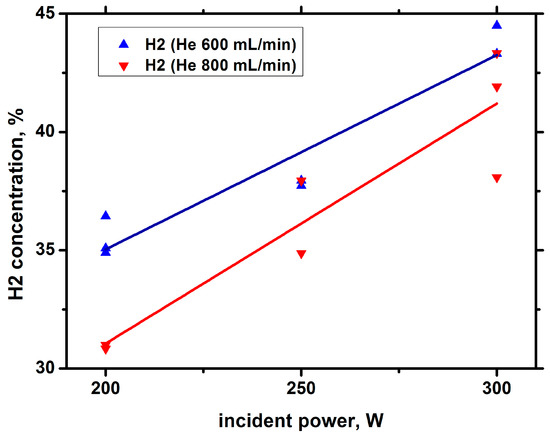
Figure 16.
Concentration of hydrogen in the sample against the incident power with He bubbling.

Figure 17.
Concentrations of hydrocarbon products against the incident power with He bubbling.
Comparison of the results shown in Figure 15, Figure 16 and Figure 17 with those obtained in argon barbotage shows that, in argon and helium barbotage, the composition of the main products is the same; however, in helium barbotage, the concentration and yield of hydrogen are higher than in argon barbotage.
Additional information on the discharge properties is provided by discharge emission spectroscopy. These results for the case of helium are shown in Figure 18 and Figure 19. As in argon, the measurements were carried out at different moments from the moment of discharge ignition.
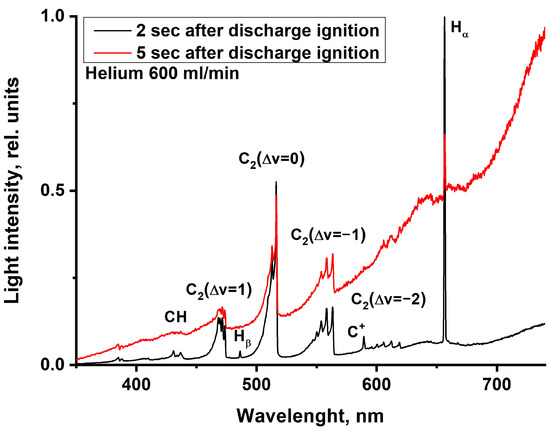
Figure 18.
Optical emission spectra of MD in Nefras with barbotage of helium at different times from discharge ignition at an incident power of 250 W.
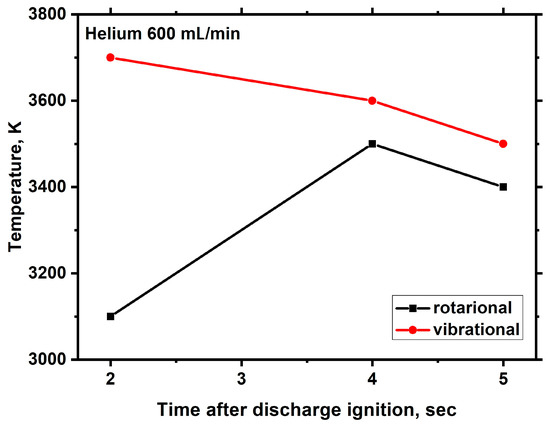
Figure 19.
Time dependencies of the rotational and vibrational temperatures of C2 molecules in the microwave discharge in Nefras with barbotage of helium at an incident power of 250 W.
Comparison with the results obtained for argon barbotage shows significant differences.
Firstly, in the spectrum shown in Figure 17, the broadband continuum plays a much larger role in the discharge emission than in Figure 13. This is indirectly confirmed by the results of the chromatographic analysis, which showed a higher rate of hydrogen formation and a higher rate of hydrocarbon decomposition in helium barbotage. This leads to an increase in the rate of formation of carbon-containing solids.
Second, the gas temperature in helium barbotage is lower than in argon barbotage at the same incident power and noble gas flow rates. The decrease in the gas temperature may be due to the fact that the thermal conductivity of helium is much higher than that of argon. Note that, despite the lower temperature, the hydrogen yield in helium is greater than in argon. Hence, an important conclusion follows that diluent gas plays an important role in the process of hydrogen production under MD conditions in liquid hydrocarbons. The main reason for this is the participation of metastable noble gas atoms in the hydrocarbon decomposition process. For helium and argon, the energies of the metastable atoms are significantly different (20 and 11 eV, respectively), which leads to a difference in the hydrogen yield.
Thus, this comparison shows the role of metastable noble gas atoms in the process of hydrogen production with their additives.
3.3. Bubbling with Ar+CO2
The addition of CO2 to the MD in liquid Nefras was investigated earlier in the framework of the problem of carbon dioxide decomposition [48]. It was shown that this method can be useful, because, in addition to the decomposition of carbon dioxide, it is possible to obtain the synthesis gas required in various chemical syntheses. Here, we investigate in detail the influence of the addition of carbon dioxide on the process of hydrogen production in MD in liquid hydrocarbons and the reasons for this influence.
Figure 20 shows the change in H2 yield when the volumetric rate of CO2 supply to the discharge is changed. The argon feed volume rate was kept constant and equal to 600 mL/min.
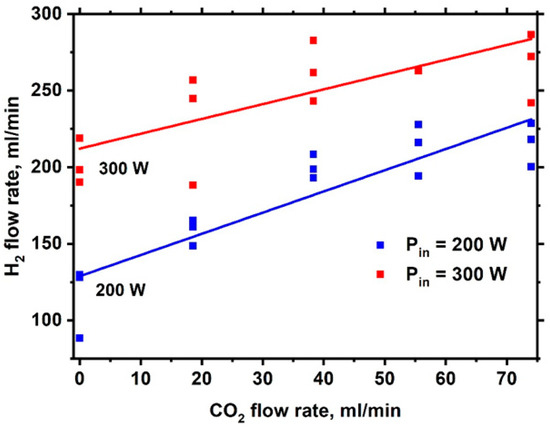
Figure 20.
Dependence of the H2 flow rate on the CO2 flow rate.
Figure 21 shows the dependence of the yields of various gas products on the flow rate of carbon dioxide at an incident power of 200 W. The addition of CO2 increases the yields of all gas products of the discharge. The reasons for such an influence are not obvious and may be due to either the separate or combined effects of several factors. One of the reasons can be change in the kinetics of plasma processes when CO2 is added. Another reason can be the influence of CO2 addition on discharge parameters and structure.
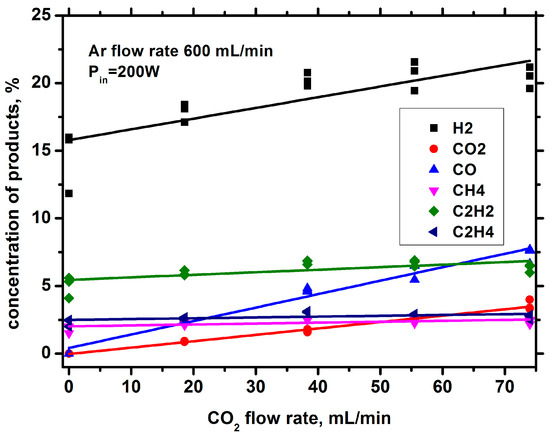
Figure 21.
Dependence of the flow rates of gas components on the CO2 flow rate.
To elucidate the reasons for the influence of CO2 addition on the discharge structure, the shadow photos of the discharge with and without additions were investigated. The results are shown in Figure 22 and Figure 23. The experiments were conducted at an argon flow rate of 600 mL/min and an incident power of 300 W. A large argon flow rate was chosen because under these conditions, the changes in the discharge structure when adding CO2 are more obvious.
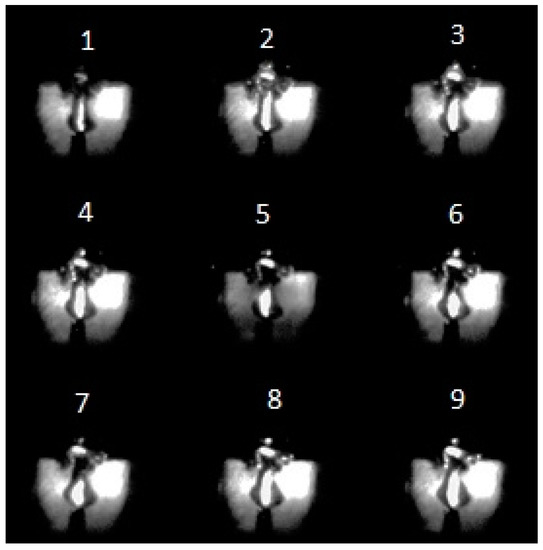
Figure 22.
Sequential series of shadow photos of the discharge without adding CO2 with a frame duration of 10 µs and a pause of 200 µs. A cylindrical antenna with a diameter of 2 mm can be seen in the lower part of the pictures.

Figure 23.
Sequential series of shadow photos of the discharge with adding CO2 (60 mL/min) with a frame duration of 10 µs and a pause of 200 µs.
Figure 22 shows a plasma column with dark walls at the center of the image, surrounded by a gas bubble at the base near the antenna. The channel is formed at high flow rates of argon. The actual size of the gas channel can be determined by the outer diameter of the dark walls. A cylindrical antenna with a diameter of 2 mm can be seen at the bottom of the photos. From the photographs, it is evident that the diameter of the channel is close to the diameter of the antenna under the experimental conditions. Comparison of the pictures in Figure 22 shows that, with time, the luminous area of the discharge expands due to gas heating. If at the moment of ignition of the discharge (the first photo) the diameter of the luminous region is approximately equal to the diameter of the channel in the tubular antenna, then, in the last photo, its diameter is already approximately equal to the diameter of the antenna.
The shadow photos in Figure 23 show the structure of the discharge when CO2 is added. The other parameters are the same as in Figure 22. It can be seen that, in contrast with Figure 22, the luminous channel is absent, and the discharge is concentrated at the tip of the antenna, although the gas channel is preserved in the first frames (the dark cylindrical area in the upper part of the photographs).
The addition of molecular gas to argon increases electron energy losses and electromagnetic field absorption [44]. In addition, molecular gas effectively quenches the metastable states of argon, through which ionization and excitation of radiative states occur. This means that, under unchanged external conditions, the discharge column shortens and concentrates near the antenna tip where the electromagnetic field reaches its maximum. Figure 23 describes the situation where the discharge can exist only at the end of the antenna. As the discharge develops, the glowing and gas bubble regions increase. The glowing area disappears when the single discharge goes out, which can be seen in the last frame of Figure 23. Through analysis of the discharge structure at different CO2 feed rates, the minimum rate of CO2 at which the columnar structure of the discharge is preserved (the argon flow rate was kept constant and equal to 600 mL/min) was determined. It turned out that at the CO2 flow rate of 30 mL/min, the discharge shrunk to the end of the antenna, and at the flow rate of 15 mL/min, the discharge initially existed in the form of a plasma column (Figure 24).

Figure 24.
Set of three consecutive shadow photos of discharge at an incident power of 300 W with different CO2 flow rates with a 10.0 μs frame duration and a 200 μs pause. The argon flow rate was 600 mL/min. A cylindrical antenna with a diameter of 2 mm can be seen in the lower part of the pictures.
Thus, with the addition of molecular gas, the absorbed power in the discharge should grow with the unchanged incident power. This is confirmed by the results obtained with the photodiode registering the integral radiation of the discharge. It was found that the total intensity of the discharge emission obtained at the same time in the case of CO2 addition is higher than without CO2 addition. This can be seen from the comparison of curves (a) and (b) in Figure 25. Thus, the relative change in the absorbed power can be judged from the time integral results of the photodiode measurements. The increase in the plasma absorbed power is explained by the increase in H2 yield with the addition of CO2 (Figure 20).
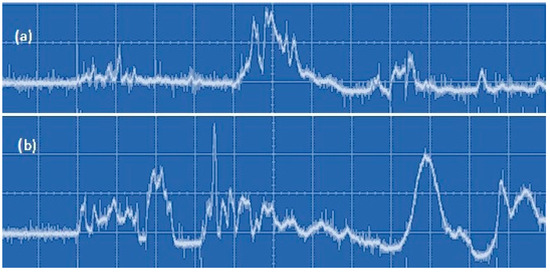
Figure 25.
Oscillogram of integral discharge emission in the time scale of 5 ms/division: (a) without the addition of CO2 and (b) with the addition of CO2 (60 mL/min).
It should be noted that a similar situation was observed without adding CO2 but when liquid hydrocarbon vapor enters the discharge zone. The discharge is initially ignited in argon and the discharge jet is visible. At subsequent moments, due to the addition of vapors, the discharge is pulled down to the tip of the antenna.
Taking into account what was said above about the dependence of the discharge structure on the rate of CO2 addition, it is possible to estimate from below the evaporation rate of liquid hydrocarbon during discharge burning. The discharge at ignition has a columnar structure upon CO2 addition of 15 mL/min. But already after 200 µs, it shrinks to the end of the antenna. If we make a sufficiently strong assumption that the influence of the molecular additive is independent of the type of gas, then the impurity flux should be at least 30 mL/min (the columnar structure is absent at the initial moment as well). Considering that in this flow 15 mL/min is the artificially set flow, the flow of evaporated hydrocarbon should be at least 15 mL/min.
Another conclusion that follows from the results obtained in this section is related to a possible change in the matching of the discharge with the microwave transmitted line. When an molecular additive is added to argon, the ratio of the active and reactive components of the plasma impedance changes, and this ratio depends on the incident power. Since, as a rule, matching is achieved by moving the short-circuiting piston, then at constant geometry of the discharge system (piston position) when the incident power and composition of the gas medium change, both improvement and deterioration of matching as compared to the initial state is possible. Since the efficiency of the discharge device is determined by the power dissipated in the plasma, it is desirable to control this parameter.
It is known that the determination of absorbed power from the balance of incident and reflected power has a number of difficulties, because not all power determined in this way can be attributed to plasma [49]. A clear way of relative indication of the absorbed power is the information obtained using a photodiode, which registers the integral of discharge radiation in time and plasma volume. Since the discharge is a set of randomly distributed in time single discharges of different structure, time averaging should be carried out for a sufficiently long period.
Thus, the study of the impact of CO2 addition allowed us to obtain fundamental information about the processes in the MD in liquid hydrocarbon.
3.4. Comparison of Efficiency of Different Discharges in the Process of Hydrogen Production
Since the process of hydrogen production is of practical interest, it is reasonable to compare the results obtained in the present study with the results known from the literature. Such data are given in Table 2. For comparison, data on electrolysis are also given there.

Table 2.
Comparison of efficiency of different discharges for hydrogen production.
Comparison of the data in Table 1 shows that the results obtained in this work for hydrogen production in liquid hydrocarbons are at the level of known results. Naturally, it is too early to talk about technological applications and optimization of the process is required. Moreover, it is necessary to study the properties of the solid carbon-containing product in detail. It is possible that it has attractive consumer qualities, which may increase interest in the technological application of MD in liquid hydrocarbons.
4. Conclusions
The results of this experimental study on the physical and chemical characteristics of the process of hydrogen production in MD in liquid hydrocarbons with Ar, He, and CO2 barbotage are presented. The discharge was initiated at incident powers of 200–350 W at atmospheric pressure over the liquid surface. Petroleum solvent Nefras S2 80/120 (a mixture of light hydrocarbons with boiling points of 80–120 °C, Nefras includes up to 71% of heptane and its isomers, was used as a representative of liquid hydrocarbons. The methods of gas chromatography, emission spectroscopy, high-speed photography, and shadow photography methods were used for diagnosis.
It was shown that:
- -
- The hydrogen yield decreases with the increasing nobble gas feed rate into the discharge, which is caused by the dilution of hydrocarbon vapor in the discharge by noble gas.
- -
- When a noble gas is added to the discharge, hydrogen decomposition occurs with the participation of metastable atoms of inert gas. The hydrogen yield is higher when helium is added at the same incident power and noble gas flow rates.
- -
- The hydrogen yield increases when CO2 is added to the discharge zone, which is due to the increase in the absorbed power at constant incident power.
- -
- The maximum values of hydrogen yields were 791 mL/min and 811 mL/min, and the maximum energy efficiencies were 135.6 NL/kWh and 162.2 NL/kWh in Nefras with Ar and He barbotage, respectively.
Considerable attention in this paper was paid to the study of the change in the discharge structure with time in the presence of various additional gases. The average growth rate of a gas bubble size with plasma is about 1 × 104 mm/s. The dynamics of changes in the discharge emission spectra were investigated. The rotational and vibrational temperatures of the C2 molecule when helium and argon were added to the discharge were determined from the Swan bands. It was shown that if these temperatures differ in the initial moment of time, an equilibrium in these temperatures is reached after a few seconds.
The presented results on the physical and chemical properties of the MD in liquid hydrocarbons can be useful in determining the prospects for using this type of discharge in various applied problems.
Author Contributions
Conceptualization and writing Y.A.L.; formal analysis, I.V.B.; chromatography, T.S.B.; optical measurements, G.V.K. All authors have read and agreed to the published version of the manuscript.
Funding
This research received no external funding.
Data Availability Statement
The data presented in this study are available from the corresponding author upon request. The data are not publicly available due to privacy restrictions.
Acknowledgments
This study was fulfilled in the frame of the State Plan of TIPS RAS.
Conflicts of Interest
The authors declare no conflict of interest.
References
- Arutyunov, V.S. Problems and challenges of hydrogen energy. Combust. Plasma Chem. 2021, 19, 245–255. [Google Scholar]
- Holladay, J.D.; Hu, J.; King, D.L.; Wang, Y. An overview of hydrogen production technologies. Catal. Today 2009, 139, 244–260. [Google Scholar] [CrossRef]
- Abbas, H.F.; Daud, W.M.A.W. Hydrogen production by methane decomposition: A review. Int. J. Hydrogen Energy 2010, 35, 1160–1190. [Google Scholar] [CrossRef]
- Dincer, I.; Acar, C. Review and evaluation of hydrogen production methods for better sustainability. Int. J. Hydrogen Energy 2015, 40, 11094–11111. [Google Scholar] [CrossRef]
- Nikolaidis, P.; Poullikkas, A. A comparative overview of hydrogen production processes. Renew. Sustain. Energy Rev. 2017, 67, 597–611. [Google Scholar] [CrossRef]
- Slovetskii, D.I. Plasma-chemical processes for the preparation of pure hydrogen. High Energy Chem. 2006, 40, 86–92. [Google Scholar] [CrossRef]
- Burlica, R.; Shih, K.Y.; Hnatiuc, B.; Locke, B.R. Hydrogen generation by pulsed gliding arc discharge plasma with sprays of alcohol solutions. Indust. Eng. Chem. Res. 2011, 50, 9466–9470. [Google Scholar] [CrossRef]
- Mizeraczyk, J.; Urashima, K.; Jasiński, M.; Dors, M. Hydrogen production from gaseous fuels by plasmas—A review. Int. J. Plasma Environ. Sci. Technol. 2014, 8, 89–97. [Google Scholar]
- Mizeraczyk, J.; Jasiński, M. Plasma processing methods for hydrogen production. Eur. Phys. J. Appl. Phys. 2016, 75, 24702. [Google Scholar] [CrossRef]
- Nedybaliuk, O.A.; Chernyak, V.Y.; Fedirchyk, I.I.; Demchina, V.P.; Bortyshevsky, V.A.; Korzh, R.V. Plasma-catalytic reforming of ethanol: Influence of air activation rate and reforming temperature. Quest. At. Sci. Technol. 2016, 6, 276. [Google Scholar]
- Lian, H.Y.; Liu, J.L.; Li, X.S.; Zhu, X.; Weber, A.Z.; Zhu, A.M. Plasma chain catalytic reforming of methanol for on-board hydrogen production. Chem. Eng. J. 2019, 369, 245–252. [Google Scholar] [CrossRef]
- Wang, B.; Lü, Y.; Zhang, X.; Hu, S. Hydrogen generation from steam reforming of ethanol in dielectric barrier discharge. J. Nat. Gas Chem. 2011, 20, 151–154. [Google Scholar] [CrossRef]
- Henriques, J.; Bundaleska, N.; Tatarova, E.; Dias, F.M.; Ferreira, C.M. Microwave plasma torches driven by surface wave applied for hydrogen production. Int. J. Hydrogen Energy 2011, 36, 345–354. [Google Scholar] [CrossRef]
- Bundaleska, N.; Tsyganov, D.; Saavedra, R.; Tatarova, E.; Dias, F.M.; Ferreira, C.M. Hydrogen production from methanol reforming in microwave “tornado”-type plasma. Int. J. Hydrogen Energy 2013, 38, 9145–9157. [Google Scholar] [CrossRef]
- Wang, Y.F.; You, Y.S.; Tsai, C.H.; Wang, L.C. Production of hydrogen by plasma-reforming of methanol. Int. J. Hydrogen Energy 2010, 35, 9637–9640. [Google Scholar] [CrossRef]
- Hrycak, B.; Czylkowski, D.; Miotk, R.; Dors, M.; Jasinski, M.; Mizeraczyk, J. Hydrogen production from ethanol in nitrogen microwave plasma at atmospheric pressure. Open Chem. 2015, 13, 317–324. [Google Scholar] [CrossRef]
- Miotk, R.; Hrycak, B.; Czylkowski, D.; Dors, M.; Jasinski, M.; Mizeraczyk, J. Liquid fuel reforming using microwave plasma at atmospheric pressure. Plasma Sources Sci. Technol. 2016, 25, 035022. [Google Scholar] [CrossRef]
- Bardos, L.; Baránková, H.; Bardos, A. Production of hydrogen-rich synthesis gas by pulsed atmospheric plasma submerged in mixture of water with ethanol. Plasma Chem. Plasma Process. 2017, 37, 115. [Google Scholar] [CrossRef]
- Yan, J.; Du, C. Hydrogen Generation from Ethanol Using Plasma Reforming Technology; Springer: Berlin/Heidelberg, Germany; Zhejiang University Press: Hangzhou, China, 2017. [Google Scholar]
- Bundaleska, N.; Tsyganov, D.; Tatarova, E.; Dias, F.M.; Ferreira, C.M. Steam reforming of ethanol into hydrogen-rich gas using microwave Ar/water “tornado”–Type plasma. Int. J. Hydrogen Energy 2014, 39, 5663. [Google Scholar] [CrossRef]
- Levko, D.S.; Tsymbalyuk, A.N.; Shchedrin, A.I. Plasma kinetics of ethanol conversion in a glow discharge. Plasma Phys. Rep. 2012, 38, 913. [Google Scholar] [CrossRef]
- Shchedrin, A.I.; Levko, D.S.; Chernyak, V.Y.; Yukhimenko, V.V.; Naumov, V.V. Effect of air on the concentration of molecular hydrogen in the conversion of ethanol by a nonequilibrium gas-discharge plasma. JETP Lett. 2008, 88, 99. [Google Scholar] [CrossRef]
- Wang, W.; Zhu, C.; Cao, Y. DFT study on pathways of steam reforming of ethanol under cold plasma conditions for hydrogen generation. Int. J. Hydrogen Energy 2010, 35, 1951–1956. [Google Scholar] [CrossRef]
- Adamovich, I.; Agarwal, S.; Ahedo, E.; Alves, L.L.; Baalrud, S.; Babaeva, N.; Bogaerts, A.; Bourdon, A.; Bruggeman, P.J.; Canal, C.; et al. The 2022 Plasma Roadmap: Low temperature plasma science and technology. J. Phys. D Appl. Phys. 2022, 55, 373001. [Google Scholar] [CrossRef]
- Malik, M.A.; Ghaffar, A.; Malik, S.A. Water purification by electrical discharges. Plasma Sources Sci. Technol. 2001, 10, 82. [Google Scholar] [CrossRef]
- Foster, J.E. Plasma-based water purification: Challenges and prospects for the future. Phys. Plasmas 2017, 24, 055501. [Google Scholar] [CrossRef]
- Rezaei, F.; Vanraes, P.; Nikiforov, A.; Morent, R.; Geyter, N. Applications of plasma-liquid systems: A review. Materials 2019, 12, 2751. [Google Scholar] [CrossRef]
- Locke, B.R. Environmental applications of electrical discharge plasma with liquid water: A mini review. Int. J. Plasma Environ. Sci. Technol. 2012, 6, 194–203. [Google Scholar]
- Rybkin, V.V.; Shutov, D.A. Atmospheric-pressure electric discharge as an instrument of chemical activation of water solutions. Plasma Phys. Rep. 2017, 43, 1089–1113. [Google Scholar] [CrossRef]
- Vanraes, P.; Bogaerts, A. Plasma physics of liquids—A focused review. Appl. Phys. Rev. 2018, 5, 031103. [Google Scholar] [CrossRef]
- Lebedev, Y.A. Microwave discharges in liquid dielectrics. Plasma Phys. Rep. 2017, 43, 676. [Google Scholar] [CrossRef]
- Horikoshi, S.; Serpone, N. In-liquid plasma: A novel tool in the fabrication of nanomaterials and in the treatment of wastewaters. RSC Adv. 2017, 7, 47196–47218. [Google Scholar] [CrossRef]
- Lebedev, Y.A. Microwave discharges in liquids: Fields of applications. High Temp. 2018, 56, 811. [Google Scholar] [CrossRef]
- Lebedev, Y.A. Microwave Discharges in Liquid Hydrocarbons: Physical and Chemical Characterization. Polymers 2021, 13, 1678. [Google Scholar] [CrossRef] [PubMed]
- Nomura, S.; Toyota, H.; Mukasa, S.; Yamashita, H.; Maehara, T.; Kawashima, A.J. Production of hydrogen in a conventional microwave oven. J. Appl. Phys. 2009, 106, 073306. [Google Scholar] [CrossRef]
- Nomura, S.; Toyota, H.; Tawara, M.; Yamashota, H. Fuel gas production by microwave plasma in liquid. Appl. Phys. Lett. 2006, 88, 231502. [Google Scholar] [CrossRef]
- Liu, J.L.; Zhu, T.H.; Sun, B. Understanding the chemical kinetics for plasma in liquid: Reaction mechanism of ethanol reforming in microwave discharge. Int. J. Hydrogen Energy 2022, 47, 12841. [Google Scholar] [CrossRef]
- Sun, B.; Zhao, X.; Xin, Y.; Zhu, X. Large capacity hydrogen production by microwave discharge plasma in liquid fuels ethanol. Int. J. Hydrogen Energy 2017, 42, 24047–24054. [Google Scholar] [CrossRef]
- Lebedev, Y.A.; Tatarinov, A.V.; Epshtein, I.L.; Titov, A.Y. Zero-Dimensional Simulation of Microwave Discharge in Aqueous Ethanol Solution. High Energy Chem. 2022, 56, 448. [Google Scholar] [CrossRef]
- Batukaev, T.S.; Bilera, I.V.; Krashevskaya, G.V.; Lebedev, Y.A.; Epstein, I.L. Hydrogen production in microwave discharge in water solutions of ethanol at atmospheric pressure. Plasma Process. Polym. 2023, 20, e2300015. [Google Scholar] [CrossRef]
- Lebedev, Y.A.; Krashevskaya, G.V.; Batukaev, T.S.; Epstein, I.L. Light emission from microwave discharges in liquid hydrocarbons at the initial stages of their development. Plasma Process. Polym. 2021, 18, 2100051. [Google Scholar] [CrossRef]
- Lebedev, Y.A.; Krashevskaya, G.V.; Batukaev, T.S.; Mikhaylyuk, A.V. Time resolved study of ignition of microwave discharge in liquid hydrocarbons. Plasma Process. Polym. 2022, 19, e2100215. [Google Scholar] [CrossRef]
- Software for Calculating and Fitting Plasma Spectra. Available online: http://www.specair-radiation.net (accessed on 30 June 2023).
- Averin, K.A.; Bilera, I.V.; Lebedev, Y.A.; Shakhatov, V.A.; Epstein, I.L. Microwave discharge in liquid n-heptane with and without bubble flow of argon. Plasma Process. Polym. 2019, 16, 1800198. [Google Scholar] [CrossRef]
- Lebedev, Y.A.; Averin, K.A.; Tatarinov, A.V. Main gaseous products of microwave discharge in various liquid hydrocarbons. High Energy Chem. 2019, 53, 331–335. [Google Scholar] [CrossRef]
- Lebedev, Y.A.; Shakhatov, V.A. Optical emission spectra of microwave discharge in different liquid hydrocarbons. Plasma Process. Polym. 2020, 17, 2000003. [Google Scholar] [CrossRef]
- Lebedev, Y.A.; Tatarinov, A.V.; Epstein, I.L.; Averin, K.A. The formation of gas bubbles by processing of liquid n-heptane in the microwave discharge. Plasma Chem. Plasma Process. 2016, 36, 535–552. [Google Scholar] [CrossRef]
- Batukaev, T.S.; Bilera, I.V.; Krashevskaya, G.V.; Lebedev, Y.A.; Nazarov, N.A. CO2 Decomposition in Microwave Discharge Created in Liquid Hydrocarbon. Plasma 2023, 6, 115–126. [Google Scholar] [CrossRef]
- Lebedev, Y.A. Some properties of the tunable cavity microwave plasma source. Plasma Sources Sci. Technol. 1995, 4, 475. [Google Scholar] [CrossRef]
- Ursua, A.; Gandia, L.M.; Sanchis, P. Hydrogen production from water electrolysis: Current status and future trends. Proc. IEEE 2011, 100, 410–426. [Google Scholar] [CrossRef]
- Lü, Y.J.; Yan, W.J.; Hu, S.H.; Wang, B.W. Hydrogen production by methanol decomposition using gliding arc gas discharge. J. Fuel Chem. Technol. 2012, 40, 698. [Google Scholar] [CrossRef]
- Tanabe, S.; Matsuguma, H.; Okitsu, K.; Matsumoto, H. Generation of hydrogen from methanol in a dielectric-barrier discharge-plasma system. Chem. Lett. 2000, 29, 1116. [Google Scholar] [CrossRef]
- Sarmiento, B.; Brey, J.J.; Viera, I.G.; González-Elipe, A.R.; Cotrino, J.; Rico, V.J. Hydrogen production by reforming of hydrocarbons and alcohols in a dielectric barrier discharge. J. Power Sources 2007, 169, 140. [Google Scholar] [CrossRef]
- Reddy, E.L.; Biju, V.M.; Subrahmanyam, C. Production of hydrogen from hydrogen sulfide assisted by dielectric barrier discharge. Int. J. Hydrogen Energy 2012, 37, 2204. [Google Scholar] [CrossRef]
- Ulejczyk, B.; Nogal, Ł.; Młotek, M.; Krawczyk, K. Hydrogen production from ethanol using dielectric barrier discharge. Energy 2019, 174, 261–268. [Google Scholar] [CrossRef]
- Hrycak, B.; Czylkowski, D.; Miotk, R.; Dors, M.; Jasinski, M.; Mizeraczyk, J. Application of atmospheric pressure microwave plasma source for hydrogen production from ethanol. Int. J. Hydrogen Energy 2014, 39, 14184. [Google Scholar] [CrossRef]
- Czylkowski, D.; Hrycak, B.; Miotk, R.; Jasiński, M.; Dors, M.; Mizeraczyk, J. Hydrogen production by conversion of ethanol using atmospheric pressure microwave plasmas. Int. J. Hydrogen Energy 2015, 40, 14039. [Google Scholar] [CrossRef]
- Rincón, R.; Marinas, A.; Muñoz, J.; Calzada, M.D. Hydrogen production from ethanol decomposition by microwave plasma TIAGO torch. Int. J. Hydrogen Energy 2014, 39, 11441–11453. [Google Scholar] [CrossRef]
- Lin, K.C.; Lin, Y.C.; Hsiao, Y.H. Microwave plasma studies of Spirulina algae pyrolysis with relevance to hydrogen production. Energy 2014, 64, 567–574. [Google Scholar] [CrossRef]
- Zhang, X.; Cha, M.S. Tailored reforming of n-dodecane in an aqueous discharge reactor. J. Phys. D Appl. Phys. 2016, 49, 175201. [Google Scholar] [CrossRef]
- Taghvaei, H.; Jahanmiri, A.; Rahimpour, M.R.; Shirazi, M.M.; Hooshmand, N. Hydrogen production through plasma cracking of hydrocarbons: Effect of carrier gas and hydrocarbon type. Chem. Eng. J. 2013, 226, 384–392. [Google Scholar] [CrossRef]
- Wang, B.; Sun, B.; Zhu, X.; Yan, Z.; Liu, Y.; Liu, H.; Liu, Q. Hydrogen production from alcohol solution by microwave discharge in liquid. Int. J. Hydrogen Energy 2016, 41, 7280–7291. [Google Scholar] [CrossRef]
- Zhu, T.; Sun, B.; Zhu, X.; Wang, L.; Xin, Y.; Liu, J. Mechanism analysis of hydrogen production by microwave discharge in ethanol liquid. J. Anal. Appl. Pyrolysis 2021, 156, 105111. [Google Scholar] [CrossRef]
Disclaimer/Publisher’s Note: The statements, opinions and data contained in all publications are solely those of the individual author(s) and contributor(s) and not of MDPI and/or the editor(s). MDPI and/or the editor(s) disclaim responsibility for any injury to people or property resulting from any ideas, methods, instructions or products referred to in the content. |
© 2023 by the authors. Licensee MDPI, Basel, Switzerland. This article is an open access article distributed under the terms and conditions of the Creative Commons Attribution (CC BY) license (https://creativecommons.org/licenses/by/4.0/).