Abstract
With the development of international cooperation, South Africa (SA) has been China’s largest trading partner in Africa for several consecutive years. China and SA can build the digital “Belt and Road” to modernize the manufacturing system locally and optimize process control by benchmarking with the best-in-class manufacturers in each country. In this research, an evaluation technology of manufacturer intelligence regarding the selection of decision support system (DSS) of smart manufacturing technologies, analyzing China–South Africa relations, is described. Firstly, the three keys aspects that enable the technologies of DSS are discussed in detail. Then, one key technology, the manufacturers’ intelligent evaluation system with 15 indexes, was built. The indexes and their measurements are also proposed. Finally, a fusion method based on boosting with multi-kernel function (online sequential extreme learning machine based on boosting, Boosting-OSELM) is introduced. The purpose of Boosting-OSKELM is to combine several weak learners into a strong learner (lower mean square error, MSE) through an acceptable time delay. Finally, the case study is presented to demonstrate the improvement on the MSE and process time, showing a relative MSE improvement of 96.19% and a relative time delay ratio of 31.46%. Totally, the largest contribution of the proposed evaluation method in this study is the conversion of the history data saved by the manual scoring method into knowledge in accessible MES and resealable time delay, which will free up the expert workforce in the entire process. We expect this paper will help future research in this field.
1. Introduction
1.1. The Background of South Africa
As other countries, considerable economic progress to reduce poverty and income inequality [1] is needed in South Africa (SA). The SA gross domestic product (GDP) was reduced by 0.7% in the second quarter of 2022, and poverty/unemployment is a continuous challenge for the nation [2]. Based on a literature review, the implementation of smart manufacturing technology (SMT) is lacking in most SA manufacturers [3]. Conventional manufacturing technologies, which are costly and inflexible [4], are used in these companies. As a result, the growth of the SA industry is limited. According to previous studies, the positive adoption of SMT can positively impact the manufacturing industry through increased flexibility, efficiency, sustainable business models, improved product quality, and reduced environmental impact.
Most manufacturing companies in SA are aware of the potential and impact of SMT. However, most studies have revealed the need for a technology selection strategy to provide guidance in developing a SMT roadmap while considering technological, social factors, and business needs [5]. Based on previous studies, a systematic approach with optimum integration into the existing manufacturing systems is required for the adaptation of SMT [6]. Many manufacturers are often faced with the dilemma of selecting a cost-effective technology that is more beneficial considering their business objectives. Additionally, it is challenging to establish a proper implementation and evaluation plan for the technology.
SA manufacturers are at different levels of modernization. Some outdated technologies are still used by some manufacturers, while others have made considerable attempts towards the modernization of their manufacturing system [7]. The study in [3] revealed that no SA manufacturer is fully modernized. Only about 8% of the manufacturers have made considerable attempts to modernize their factories, while 47% are at an intermediate level of modernization. A total of the industries are making initial efforts to become modernized, while 11% of the industries have not made any attempts. In 2018, a tripartite strategic framework for adopting SMT was proposed, as defined by the fourth industrial revolution [8]. The lack of modernization appears to contribute to the low competitiveness of SA manufacturers on a global scale. Some researchers through the World Economic Forum noted that SA’s level of global competitiveness is 32 points behind China. This implies that China–SA partnerships can improve the competitiveness of SA manufacturers through modernization [9]. Additionally, researchers from the World Economic Forum have also reported that the skills level of SA graduates reduced by 10% in the period between 2016 and 2020.
1.2. The Background of China
China’s manufacturing is currently undergoing significant changes and is seeking in-depth cooperation at the industrial level with other countries around the world. Supported by emerging information technologies, such as the industrial network, big data, and cloud computing, China has accumulated rich and advanced knowledge in decision support systems [10], and has deeply integrated various factors, such as technology, economy, society, and culture. From the perspective of national development strategy, diplomatic needs, and technological maturity, China possesses all the conditions to attain advanced achievements [11].
From a national strategy perspective, SA holds an important position in China’s diplomatic and economic relations with Africa. SA is also the first African country to establish a people-to-people exchange mechanism with China. In recent years, deepening cooperation has increasingly become an important example of building even closer ties with other nations [12]. With the emerging convergence of their strategic implementation, the governments, manufacturers, and universities of both countries have fully comprehended the necessity and importance of cooperation.
From a diplomatic perspective, SA has been China’s largest trading partner in Africa for 12 consecutive years, since 2010. It is expected that, in the next three years, China’s imports from SA will exceed USD 100 billion. China and SA capitalize on the opportunity of building the digital “Belt and Road” of connectivity to strengthen cooperation and promote diplomatic diversification in the form of industry–university–research combination, which conforms to the fundamental interests of both sides, taps into new potential for China–SA cooperation, and helps to strengthen their diplomatic cooperative relations [13].
1.3. State of the Art of Smart Manufacturer Evaluation
In recent years, scholars have discussed and analyzed the evaluation system of SMT, focusing on three aspects: the expert scoring method, the fuzzy comprehensive evaluation method, and the data-driven evaluation method.
The expert scoring method is especially suitable for fields that require professional knowledge and experience. It relies on subjective judgment or specific index systems. One well-known method is the analytic hierarchy process (AHP). A comprehensive set of manufacturer evaluation criteria in utilizing AHP was constructed by Hossein [14], aiming to allocate different weight proportions to eight evaluation indicators. Qin [15], who conducted research on the green operation benefits of power generation enterprises, proposed an intuitionistic fuzzy comprehensive analytic hierarchy process based on improved dynamic hesitation degree (D-IFAHP) and an improved extreme learning machine algorithm optimized by the RBF (radial basis function) kernel function (RELM), which simplifies the manufacturing evaluation process. Another expert scoring method is the Delphi method, which has been mentioned in the context of smart shipping [16] and smart health [17], but has not been applied to smart manufacturer evaluation.
In terms of the fuzzy comprehensive evaluation method, it quantifies the fuzzy degree of each evaluation index by establishing a fuzzy mathematical model and performs fuzzy comprehensive operations to derive comprehensive evaluation results. Feng [18], based on the fuzzy comprehensive evaluation method, proposed a further comprehensive screening of indicators aiming to reduce the influence of highly overlapping information and constructws a multi-dimensional evaluation index system for smart electricity consumption with a wider range and scale of adaptation. Combining both the fuzzy method and AHP, fuzzy comprehensive AHP was applied to lean green manufacturing by Zhu [19] in the context of Industry 4.0, and the evaluation index system was divided into four levels to determine the importance of the driving factors, starting with endogenous and exogenous drivers.
Data-driven evaluation is a method based on data and statistical analysis, which can lead to an assessment of a project based on quantitative characteristics and data models. The basic approach involves using data analysis methods, such as machine learning, to extract key features, build models, and conduct evaluations. Mahmoud [20] combined digital twins and proposed a three-phase evaluation framework for selecting the optimal configuration of SMT systems. Xiao [21] proposed an 18-dimensional evaluation index for manufacturers considering inter-manufacturer cooperation and used multi-attribute decision analysis and BP neural networks to prioritize cooperation. Shafiq [22] employed the support vector machine (SVM) method to evaluate and control the manufacturing process in the context of smart industries.
Although traditional methods (mainly expert grading and fuzzy comprehensive evaluation) have evolved over the years, they still have some disadvantages: (i) heavy reliance on manual experience, (ii) inability to fully use historical data for effective knowledge formation, (iii) the large amount of human and material resources required in the evaluation, and (iv) the lack of connection between evaluation indicators and smart manufacturing, especially in terms of measurement methods and scoring basis.
Data-driven methods are still being refined and evolving, with the following trends: (i) shallow machine learning techniques, such as SVM and neural networks, exhibit high efficiency but limited accuracy; and (ii) deep machine learning techniques, such as deep learning and reinforcement learning, have high computational complexity and operational inefficiency. Therefore, there is an urgent need to propose an algorithm that combines high efficiency and accuracy.
The aim of this study is to utilize historical evaluation results to train the model and encapsulate the existing knowledge to achieve autonomous evaluation. The online sequential extreme learning machine based on the boosting method (Boosting-OSELM) proposed in this study achieves a combination of several shallow machine learning methods, which can be trained and fitted several times by using residuals as the optimization target, and can simultaneously consider training speed and prediction accuracy. The rest of the paper is organized as follows: In the second section, the architecture of SMT evaluation and selection of the decision support system is described. The third section presents the manufacturers’ intelligent evaluation system and the evaluation method. In the fourth section, a case study and result analysis are discussed. The last section concludes the paper and considers future work.
2. The Architecture of SMT Evaluation and Selection of the Decision Support System
This section describes the architecture of the evaluation and selection of the decision support system in a general way, as shown in Figure 1.
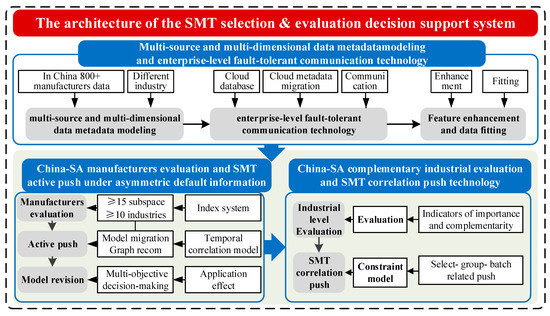
Figure 1.
The architecture of SMT evaluation and selection of the decision support system.
- (1)
- Multi-source and multi-dimensional data metadata modeling and enterprise-level fault-tolerant communication technology. In view of the difficulties in cross-platform and cross-level fault-tolerant communication between China and SA, especially the serious default of data in SA (those that have not worked with SA companies before, but have contacts with Chinese companies), research on multi-source and multi-dimensional data metadata modeling at the enterprise and industrial levels was conducted in China. The aim was to store the structured and modelized dataset of the complete information about Chinese manufacturers in the Chinese cloud. With the assistance of the public networks of the two countries, especially the complete 5G network in China, an enterprise-level fault-tolerant communication platform was constructed. The completion of defaulted data based on edge computing and information fitting can be achieved. This platform can be used to ensure data consistency between the two countries under different technical conditions, cultural contexts, and operation habits. The details can be observed in Figure 2.
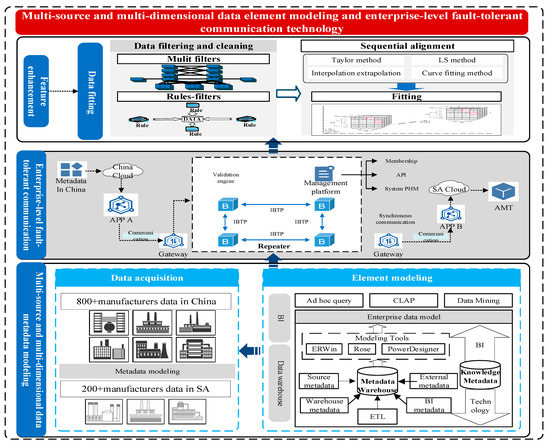 Figure 2. Data metadata modelling and enterprise-level fault-tolerant communication technology.
 - (2)
- Manufacturers’ smart evaluation and SMT active push technology under asymmetric default information. In view of the existing problems, such as the lack of an intelligent evaluation of manufacturers and the delayed push of SMT in SA, research on intelligent evaluation of manufacturers was firstly conducted. Then, using deep learning techniques, the active push technology for SMT was constructed to establish an orderly correlation between the manufacturers’ demand, technical competence, and spatio-temporal sequence. The regularity of SMT introduced in different stages among Chinese manufacturers was revealed. Through cross-industry and transnational transfer learning, the active push technology in China was transformed into that in SA. Finally, the multi-objective decision-making and model revision technology for SMT application were studied, and the effectiveness model and feedback mechanism of SMT application in manufacturers were explored, as shown in Figure 3.
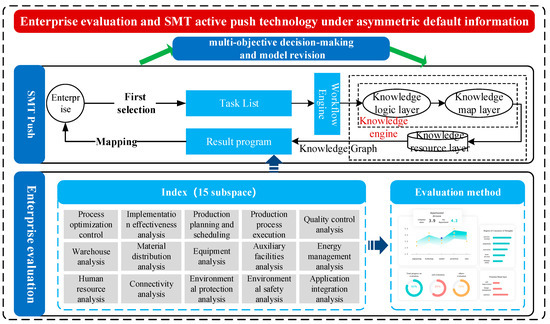 Figure 3. Enterprise evaluation and SMT active push technology under asymmetric default information.
 - (3)
- China–SA, complementary, industrial-level evaluation and advanced technology correlation push technology. Firstly, the evaluation technology for assessing the critical importance and complementarity at the industrial level in China and SA was studied, with special evaluation indexes being determined, including developmental, strategic, emerging, and resource–environment matching. Secondly, the correlation push technology for SMT at the industrial level was investigated. Constrained by the demand of downstream products and the functional and development demands, it promotes the combination of industries that are strong and the complementarity of advantages and disadvantages. Finally, the knowledge transfer of SMT and the complementary development of industries between China and SA were achieved, as shown in Figure 4.
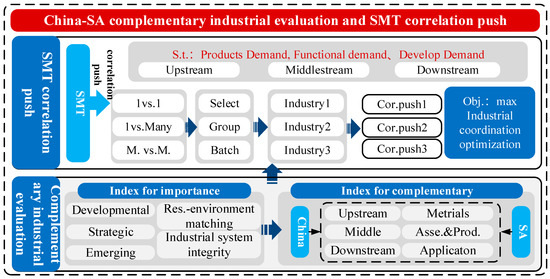 Figure 4. China–SA complementary industrial-level evaluation and SMT correlation push technology.
3. Manufacturers’ Intelligent Evaluation System and Evaluation Method
This section presents the basic aspects of the evaluation system and evaluation method (i.e., one key method to enable technology, as mentioned in Section 2, to help manufacturers to know themselves well and support future SMT selection). The system and method are built by Chinese manufacturer data and transferred/corrected in SA, and provide a scoring basis for the active push technology. The specific implementation steps are as follows: Firstly, data for 15 evaluation indexes and the overall results of Chinese manufacturers were obtained. Then, the OSKELM algorithm was employed to obtain data from Chinese enterprises. If the index data of SA are subsequently obtained, the overall result can be directly fitted. Finally, based on this model, decisions can be made regarding whether to push SMT and which specific SMT technologies to promote.
3.1. Manufacturers’ Intelligent Evaluation System
A manufacturers’ intelligent evaluation system with 15 indexes was built. Table 1 provides a detailed introduction to these indexes and their measurements. The indexes are categorized in different levels, ranging from Level 1 to Level 5, indicating varying degrees of intelligence for each index, with Level 5 representing the highest level. While quality is not the primary focus of the evaluation system, it is still an important aspect. Quality is divided into three subcategories: qualification rate, parameter variability and consistency, and quality performance. Among these subcategories, the qualification rate and parameter variability and consistency are the main concerns of the company, as mentioned in Table 1 under index A5.

Table 1.
The manufacturers’ intelligent evaluation indexes and their measurement.
3.2. Evaluation Method
- (1)
- The Online Sequential Extreme Learning Machine (OSELM)
In recent years, many algorithms for evaluation purposes have been published. Among them, the OSELM is well known for its high speed in training and excellent generalization ability [23,24]. OSELM was derived from the extreme learning machine (ELM) method [25], and the incremental learning formula of the new samples was derived. Its advantages are as follows:
- High speed in training, which avoids the disadvantage of slow upgrade operations present in traditional backward gradient update methods in the neural network.
- Easy attainment of the global optimal solution, which uses the optimization model, namely the least squares method, to solve the network weight.
- Fewer parameters in the model compared to those in the neural network, which avoids the great influence of learning parameters on the evaluation performance.
- Compatibility with samples and suitability for online learning.
Despite the numerous advantages of OSELM, one challenge remains, namely determining the optimal number of hidden layers. The kernelized extreme learning machine (KELM) method solves this problem effectively. KELM is a variation of the ELM algorithm that incorporates kernel methods. While ELM employs a simple linear activation function in the hidden layer, KELM utilizes a kernel function to map the input data into a higher-dimensional feature space. This allows KELM to handle nonlinear relationships between inputs and outputs. Consequently, KELM not only avoids the problem of the curse of dimensionality but also improves generalization and stability, which can be negatively affected by the random assignment of hidden neurons. KELM demonstrates great potential in handling nonlinear relationships in the evaluation process.
Commonly used kernel functions include:
Linear Kernel: It computes the inner product between the input samples in the original feature space. It is equivalent to not using a kernel and represents a linear relationship between the data points, according to Equation (1):
Polynomial Kernel: It computes the similarity based on the polynomial expansion of the input samples. It introduces nonlinearity by considering higher-order interactions between the features, according to Equation (2):
Gaussian Kernel: It calculates the similarity based on the radial basis function. It measures the similarity between the samples as a decaying exponential function of the Euclidean distance between them, according to Equation (3):
- (2)
- The fusion method based on boosting with a multi-kernel function
According to the integrated learning theory, through a special combination method, several weak learners can obtain the same performance as the strong learners. Among them, boosting is a commonly used integrated learning technique [26]. Its basic idea is to correct the wrong classifications or predictions made by weak learners through other weak learners.
Based on the boosting idea, this study integrated multiple ELMs with different kernels, and the Boosting-OSKELM (boosting online sequential kernelized extreme learning machine) method was introduced, as shown in Figure 5. Firstly, a kernel OSKELM was used for learning and training. Secondly, the difference 1 between the labels and the results 1 can be calculated, which act as new labels in the next round of training. Then, another kernel OSKELM with the difference 2 (between the new labels and the results 2) can be trained again. Generally speaking, after 3 rounds of training with 3 kernel functions (different or the same), an evaluation with a good performance can be obtained.
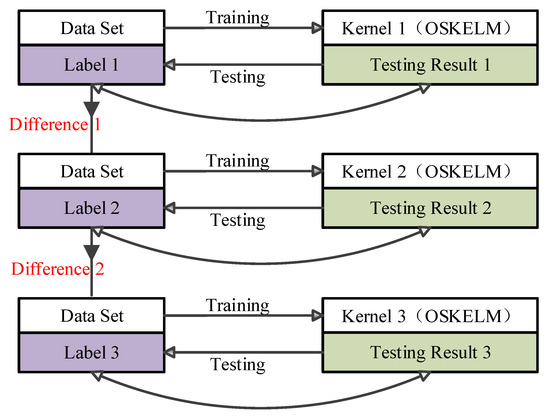
Figure 5.
The fusion method based on boosting with a multi-kernel function.
The pseudocode of Boosting-OSKELM (Algorithm 1) is shown below. In a practical operation, the same kernel can be used repeatedly, such as several times of Gaussian kernel. No more than three kernel functions were used in this paper, which comprehensively considered the combined explosion and performance accuracy.
| Algorithm 1. Pseudocode of Boosting-OSKELM |
| Input: Dataset D = {x, y} N, |
| Output: Integrates ELM |
|
4. Case Study and Result Analysis
Section 3 presented the evaluation index system and the evaluation method regarding the selection of the decision support system of smart manufacturing technologies, analyzing China–South Africa relation. In Section 4, the research content from Section 3 is elaborated with examples to enhance its presentation.
4.1. Case Study
In order to reflect the differentiation of each level, (Level 1, Level 2, Level 3, Level 4, and Level 5) were represented by (1, 3, 6, 10, and 15), respectively. The examples of 50 manufacturers are shown in Appendix A. This study collected data from more than 50 manufacturers in Suzhou, China. For each manufacturer, scores were attributed based on the weights of 0, 1, 3, 6, 10, and 15 for Levels 1 to 5, respectively (where 0 indicates that level 1 is not met). Then, 20 professors and experts provided different weighting coefficients based on their knowledge, which were used to accumulate a result value. If coefficients are all 1, it equals to the summation of A1 to A15. The scores provided by each professor were then averaged to obtain the result in Appendix A, Table A1. The inputs were 0, 1, 3, 6, 10, and 15, and the output was the result. In the middle, the proposed Boosting-OSKELM model was used to achieve approximation training. Finally, the polynomial kernel function, the Gaussian kernel function, and the linear kernel function in the Boosting-OSKELM model were selected. Some parameter values of the polynomial kernel function and the Gaussian kernel function are shown in Table 2.
Table 2.
Some parameter values of the kernel function.
Based on the selectable parameter values, 39 selectable sequences of the kernel function and each mean square error (MSE) are shown in Table 3. L, G, and P represent the linear, Gaussian, and polynomial kernel functions, respectively.
Table 3.
The MES of the 39 selectable sequences.
4.2. Result Analysis
- (1)
- The purpose of Boosting-OSKELM is to combine several weak learners into a strong learner (lower MSE) through an acceptable time delay. Therefore, the smallest single kernel MES, G, was chosen as the benchmark. Because G is the best MSE of the single kernel, it is best to use a single G if the MSE with two or three cores is larger than G. This makes it easier to exclude data with an MSE that is too large and reduce the amount of computation. The sequence combinations with a lower MSE value than the benchmark can be considered for future inclusion in Table 4. Secondly, a two-index (MSE and time delay) evaluation function was needed. Within the fluctuation range, the higher the MSE and the lower the time delay, compared with the benchmark, the better the combination. So, the MSE–time delay evaluation function was built as Equation (4) (Ref. the signal noise Ratio).
Table 4. Objective function of the 8 selectable sequences.
MSE and T present the independent variables. MSEb and Tb are the MSE and time delay of the benchmark. MSEmax, MSEmin, Tmax, and Tmin show the max and min values of MSE and time delay, respectively. The results are presented in Table 4.
According to Table 4, the P–G sequence combination shows a great performance, with values of 0.00258484135900025 for MSE and 0.0487431 for the process time. Within the fluctuation range, MSE relative improvement is 96.19% and the relative time delay ratio is only 31.46%. This high precision can meet the manufacturing system and process needs. The objective function is 3.056564, which is much higher than that of other combinations.
- (2)
- Sample size is small. Although small samples can be processed by Boosting-OSKELM, the higher the number of samples, the more accurate the evaluation effect. More samples, and an even larger data set, are needed.
- (3)
- Unbalance dataset. All 50 samples were from manufacturers in Suzhou, China. Suzhou is one of the most developed cities in China’s manufacturing industry, and those manufacturers have relatively high development levels (according to the Chinese national standard GB/T 39116-2020, most of them are in the second and third levels, while few are in the first and fourth levels, and there are almost no manufacturers in the fifth level). This imbalance in the distribution of samples may pose challenges when migrating the evaluation method from China to SA, as the context and characteristics of SA manufacturers may differ significantly from those in Suzhou.
4.3. Practicability Discussion
The practicability of the evaluation system can be discussed in three areas, as follows:
- (1)
- Self-awareness of intelligent degree: The evaluation system provides meaningful insights to manufacturers, helping them to understand their current level of intelligence. This self-awareness is crucial for manufacturers to identify their strengths, weaknesses, and areas for improvement. For example, if Manufacturer 1 lacks quality control analysis (A5), the evaluation system can recommend the implementation of control-based zero-defect manufacturing (ZDM) [27] technologies to address this weakness. Advanced manufacturing processes, such as surface topography [28] and surface quality [29], can also be used to overcome the quality problem from a process perspective. This approach can be applied in both China and South Africa, promoting knowledge transfer and complementary development in SMT between two countries.
- (2)
- Achieving autonomous evaluation: The evaluation system allows the continuous updating of the model as new data become available, eliminating the need for the extensive retraining of the model with each update. This avoids the resource-intensive process of involving multiple expert professors in retraining the model. For example, if Manufacturer 1 implements ZDM and improves product quality through SMT and online monitoring, the score for A5 can be updated from 1 to 15, and the result is changed from 35.7 to 48.1228. This enables fast fitting without requiring a complete model retraining.
- (3)
- Facilitating the determination of manufacturers’ direction: By comparing the evaluation results with those of peer competitors, manufacturers can gain insights into how competitors apply SMT. This helps them to identify their own development direction, maintain competitive advantages, and achieve continuous innovation and growth.
5. Conclusions
SA has been China’s largest trading partner in Africa for several consecutive years. At present, China and SA can build the digital “Belt and Road”, which conforms to the fundamental interests of both sides, taps into new potential for China–SA cooperation, and helps both sides to further enhance diplomatic cooperative relations. The aim of this study was to develop an evaluation technology of manufacturer intelligence regarding the selection of the decision support system of smart manufacturing technologies, analyzing China–South Africa relations. Three key aspects that enable the technologies of DSS were discussed in detail (Section 2). As a key aspect that enables technology, a manufacturers’ intelligent evaluation system with 15 indexes was built. The indexes and their measurements were discussed. A fusion method based on boosting with the multi-kernel function (Boosting-OSKELM) was introduced (Section 3). The purpose of Boosting-OSKELM was to combine several weak learners into a strong learner (lower MSE) through an acceptable time delay. A case study was presented to show the improvement in the relative MSE (96.19%) and the relative time delay ratio (31.46%). It is helpful to determine, subsequently, whether to push SMT and which SMTs to push actively.
Future work will concentrate on the following aspects:
- (1)
- The unbalanced dataset. In the near future, more than 800 China manufacturers and more than 200 SA manufacturers will contribute to the research. A complete and balance database will be established.
- (2)
- Some other key enabling technologies will be studied in the future: multi-source and multi-dimensional data metadata modelling and enterprise-level fault-tolerant communication technology, SMT active push technology under asymmetric default information, and China–SA complementary industrial-level evaluation and advanced technology correlation push technology.
- (3)
- The integration of the SMT evaluation and selection decision system. The configuration of the definition method and the microservice integration method will be conducted in the integration technology to avoid the tight coupling problems of all modules in one single system (which shows poor scalability and difficult maintenance).
Author Contributions
Conceptualization, F.P., M.Y., F.H. and B.Y.; methodology, F.P.; software, F.P. and J.Z.; validation, F.P. and J.Z.; formal analysis, F.P.; investigation, F.P.; resources, F.P.; data curation, F.P.; writing—original draft preparation, F.P.; writing—review and editing, J.Z.; visualization, F.P.; supervision, F.P.; project administration, F.P.; funding acquisition, F.P., M.Y. and B.Y.. All authors have read and agreed to the published version of the manuscript.
Funding
This research was funded by the Ministry of Education of Humanities and Social Science project (21YJCZH112 and 21YJA630111), the Changzhou Sci&Tech Program (CJ20210058 and CM20223014), the Fundamental Research Funds for the Central Universities (B220202027), and National Natural Science Foundation of China (NSFC) (grant 51875171).
Data Availability Statement
Where no new data were created.
Conflicts of Interest
The authors declare no conflict of interest.
Appendix A
Table A1.
Examples of the 50 manufacturers.
Table A1.
Examples of the 50 manufacturers.
| A1 | A2 | A3 | A4 | A5 | A6 | A7 | A8 | A9 | A10 | A11 | A12 | A13 | A14 | A15 | Result * | |
|---|---|---|---|---|---|---|---|---|---|---|---|---|---|---|---|---|
| Manufacturer 1 | 6 | 3 | 3 | 3 | 1 | 1 | 1 | 1 | 1 | 0 | 0 | 1 | 3 | 1 | 10 | 35.7 |
| Manufacturer 2 | 6 | 3 | 6 | 6 | 10 | 6 | 6 | 6 | 10 | 3 | 0 | 10 | 3 | 6 | 3 | 88.3 |
| Manufacturer 3 | 6 | 6 | 3 | 6 | 10 | 6 | 6 | 6 | 10 | 3 | 10 | 10 | 3 | 3 | 1 | 90.7 |
| Manufacturer 4 | 6 | 6 | 10 | 6 | 10 | 6 | 6 | 6 | 10 | 3 | 3 | 6 | 3 | 15 | 10 | 110.5 |
| Manufacturer 5 | 6 | 3 | 6 | 3 | 10 | 6 | 6 | 6 | 6 | 6 | 1 | 10 | 6 | 10 | 6 | 94.1 |
| Manufacturer 6 | 6 | 3 | 6 | 6 | 10 | 6 | 10 | 6 | 3 | 6 | 1 | 6 | 10 | 1 | 3 | 84.6 |
| Manufacturer 7 | 6 | 3 | 3 | 3 | 1 | 3 | 3 | 6 | 1 | 6 | 0 | 6 | 10 | 1 | 0 | 52.8 |
| Manufacturer 8 | 6 | 10 | 10 | 10 | 10 | 6 | 6 | 15 | 10 | 6 | 3 | 10 | 6 | 6 | 6 | 125.5 |
| Manufacturer 9 | 15 | 10 | 10 | 10 | 10 | 10 | 10 | 15 | 15 | 10 | 6 | 10 | 10 | 10 | 10 | 166.8 |
| Manufacturer 10 | 6 | 3 | 6 | 6 | 3 | 6 | 6 | 6 | 6 | 10 | 3 | 6 | 3 | 6 | 10 | 90 |
| Manufacturer 11 | 3 | 3 | 3 | 1 | 3 | 3 | 6 | 3 | 1 | 3 | 0 | 6 | 3 | 1 | 0 | 41 |
| Manufacturer 12 | 6 | 3 | 10 | 6 | 10 | 6 | 6 | 6 | 1 | 6 | 1 | 6 | 3 | 1 | 3 | 78.3 |
| Manufacturer 13 | 6 | 3 | 6 | 6 | 3 | 6 | 3 | 6 | 1 | 3 | 0 | 6 | 3 | 3 | 6 | 63.8 |
| Manufacturer 14 | 6 | 10 | 10 | 6 | 6 | 6 | 3 | 6 | 1 | 3 | 0 | 6 | 6 | 1 | 6 | 79 |
| Manufacturer 15 | 6 | 3 | 3 | 3 | 6 | 3 | 10 | 6 | 1 | 3 | 0 | 10 | 3 | 1 | 0 | 55.4 |
| Manufacturer 16 | 6 | 3 | 6 | 1 | 3 | 3 | 10 | 6 | 3 | 3 | 1 | 6 | 3 | 1 | 6 | 64.7 |
| Manufacturer 17 | 6 | 3 | 3 | 1 | 3 | 3 | 6 | 3 | 3 | 6 | 0 | 6 | 3 | 3 | 3 | 54.5 |
| Manufacturer 18 | 6 | 3 | 10 | 6 | 10 | 3 | 6 | 6 | 6 | 6 | 1 | 6 | 3 | 6 | 1 | 83.8 |
| Manufacturer 19 | 15 | 10 | 10 | 10 | 15 | 10 | 10 | 6 | 10 | 1 | 1 | 10 | 6 | 10 | 6 | 131.4 |
| Manufacturer 20 | 6 | 3 | 3 | 1 | 3 | 3 | 6 | 6 | 1 | 3 | 0 | 6 | 3 | 1 | 0 | 47.3 |
| Manufacturer 21 | 6 | 1 | 3 | 1 | 1 | 3 | 1 | 3 | 1 | 1 | 0 | 1 | 3 | 1 | 1 | 27.8 |
| Manufacturer 22 | 6 | 3 | 6 | 1 | 1 | 3 | 1 | 6 | 1 | 6 | 1 | 6 | 3 | 1 | 1 | 48 |
| Manufacturer 23 | 6 | 3 | 6 | 1 | 1 | 3 | 1 | 6 | 1 | 6 | 3 | 6 | 3 | 1 | 1 | 49.6 |
| Manufacturer 24 | 6 | 3 | 3 | 1 | 1 | 3 | 1 | 6 | 1 | 6 | 0 | 6 | 3 | 1 | 1 | 43.6 |
| Manufacturer 25 | 6 | 3 | 3 | 1 | 1 | 3 | 1 | 3 | 1 | 3 | 1 | 6 | 3 | 0 | 0 | 35.8 |
| Manufacturer 26 | 15 | 15 | 3 | 3 | 6 | 6 | 3 | 6 | 10 | 3 | 3 | 6 | 6 | 10 | 10 | 106.6 |
| Manufacturer 27 | 6 | 3 | 6 | 3 | 3 | 3 | 6 | 6 | 3 | 3 | 1 | 6 | 3 | 3 | 6 | 64.1 |
| Manufacturer 28 | 6 | 3 | 3 | 6 | 3 | 6 | 10 | 6 | 6 | 1 | 3 | 10 | 10 | 6 | 0 | 82.6 |
| Manufacturer 29 | 3 | 1 | 6 | 1 | 3 | 0 | 3 | 0 | 3 | 0 | 3 | 0 | 3 | 0 | 3 | 30.9 |
| Manufacturer 30 | 3 | 1 | 3 | 3 | 6 | 3 | 3 | 3 | 6 | 1 | 0 | 6 | 2 | 3 | 1 | 45.8 |
| Manufacturer 31 | 3 | 3 | 3 | 3 | 6 | 3 | 3 | 3 | 6 | 1 | 6 | 6 | 1 | 1 | 1 | 51.6 |
| Manufacturer 32 | 3 | 3 | 6 | 3 | 6 | 3 | 3 | 3 | 6 | 1 | 1 | 3 | 1 | 10 | 6 | 60.7 |
| Manufacturer 33 | 3 | 1 | 3 | 1 | 6 | 3 | 3 | 3 | 3 | 3 | 1 | 6 | 3 | 6 | 3 | 48.8 |
| Manufacturer 34 | 3 | 1 | 3 | 3 | 6 | 3 | 6 | 3 | 1 | 3 | 1 | 3 | 6 | 1 | 1 | 44.8 |
| Manufacturer 35 | 3 | 1 | 1 | 1 | 1 | 1 | 1 | 3 | 1 | 3 | 0 | 3 | 6 | 1 | 0 | 25.1 |
| Manufacturer 36 | 3 | 6 | 6 | 6 | 6 | 3 | 3 | 10 | 6 | 3 | 1 | 6 | 3 | 3 | 3 | 70.9 |
| Manufacturer 37 | 10 | 6 | 6 | 6 | 6 | 6 | 6 | 10 | 10 | 6 | 3 | 6 | 6 | 6 | 6 | 101.9 |
| Manufacturer 38 | 3 | 1 | 3 | 3 | 1 | 3 | 3 | 3 | 3 | 6 | 1 | 3 | 1 | 3 | 6 | 43.8 |
| Manufacturer 39 | 1 | 1 | 1 | 1 | 1 | 1 | 3 | 1 | 1 | 1 | 0 | 3 | 1 | 1 | 0 | 16.6 |
| Manufacturer 40 | 3 | 1 | 6 | 3 | 6 | 3 | 3 | 3 | 1 | 3 | 1 | 3 | 1 | 1 | 1 | 40.5 |
| Manufacturer 41 | 3 | 1 | 3 | 3 | 1 | 3 | 1 | 3 | 1 | 1 | 0 | 3 | 1 | 1 | 3 | 29.2 |
| Manufacturer 42 | 3 | 6 | 6 | 3 | 3 | 3 | 1 | 3 | 1 | 1 | 0 | 3 | 3 | 1 | 3 | 41.2 |
| Manufacturer 43 | 3 | 1 | 1 | 1 | 3 | 1 | 6 | 3 | 1 | 1 | 0 | 6 | 1 | 1 | 0 | 29.8 |
| Manufacturer 44 | 3 | 1 | 3 | 1 | 1 | 1 | 6 | 3 | 1 | 1 | 1 | 3 | 1 | 1 | 3 | 30.2 |
| Manufacturer 45 | 3 | 3 | 3 | 3 | 3 | 3 | 6 | 3 | 3 | 3 | 1 | 6 | 3 | 3 | 3 | 48.9 |
| Manufacturer 46 | 3 | 1 | 6 | 3 | 6 | 1 | 3 | 3 | 3 | 3 | 1 | 3 | 1 | 3 | 1 | 41.2 |
| Manufacturer 47 | 10 | 6 | 6 | 6 | 10 | 6 | 6 | 3 | 6 | 1 | 1 | 6 | 3 | 6 | 3 | 82.2 |
| Manufacturer 48 | 6 | 3 | 3 | 3 | 3 | 3 | 6 | 6 | 3 | 3 | 3 | 6 | 3 | 3 | 1 | 57.1 |
| Manufacturer 49 | 10 | 6 | 6 | 6 | 6 | 6 | 6 | 6 | 6 | 6 | 3 | 6 | 6 | 6 | 6 | 93.1 |
| Manufacturer 50 | 3 | 6 | 3 | 6 | 6 | 1 | 1 | 10 | 1 | 10 | 1 | 10 | 1 | 6 | 1 | 66.4 |
* Note: The results are based on the Chinese National Standard GB/T 39116-2020 and provided by the Productivity Center of Jiangsu Province.
References
- Bekun, F.; Emir, F.; Sarkodie, S. Another Look at the Relationship Between Energy Consumption, Carbon Dioxide Emissions, and Economic Growth in South Africa. Sci. Total Environ. 2019, 655, 759–765. [Google Scholar] [CrossRef]
- Akadiri, S.; Bekun, F.; Sarkodie, S. Contemporaneous Interaction Between Energy Consumption, Economic Growth and Environmental Sustainability in South Africa: What Drives What? Sci. Total Environ. 2019, 686, 468–475. [Google Scholar] [CrossRef]
- Maisiri, W.; Van, L. Industry 4.0 Readiness Assessment for South African Industries. S. Afr. J. Ind. Eng. 2019, 30, 134–148. [Google Scholar] [CrossRef]
- Binge, L.; Boshoff, W. Economic Uncertainty in South Africa. Econ. Model. 2020, 88, 113–131. [Google Scholar] [CrossRef]
- Mandeya, S.; Ho, S. Inflation, Inflation Uncertainty and the Economic Growth Nexus: An Impact Study of South Africa. Methodsx 2021, 8, 101501. [Google Scholar] [CrossRef]
- Anon. National Development Plan Vision 2030. South Africa National Planning Commission. Available online: http://hdl.handle.net/123456789/941 (accessed on 1 February 2023).
- Andreoni, A.; Tregenna, F. Escaping the Middle-income Technology Trap: A Comparative Analysis of Industrial Policies in China, Brazil and SA. Struct. Chang. Econ. Dyn. 2020, 54, 324–340. [Google Scholar] [CrossRef]
- Mukwawaya, G. Assessing the Readiness of South Africa for Industry 4.0-analysis of Government Policy, Skills, and Education. Proc. Int. Conf. Ind. Eng. Oper. Manag. 2018, 1, 1587–1604. [Google Scholar]
- Maama, H.; Doorasamy, M.; Rajaram, R. Cleaner Production, Environmental and Economic Sustainability of Production Firms in South Africa. J. Clean. Prod. 2021, 298, 126707. [Google Scholar] [CrossRef]
- Sun, J.B.; Yang, T.; Xu, Z.Y. Assessing the Implementation Feasibility of Intelligent Production Systems Based on Cloud Computing, Industrial Internet of Things and Business Social Net-works. Kybernetes Int. J. Syst. Cybern. 2022, 51, 2044–2064. [Google Scholar] [CrossRef]
- Torreggiani, S.; Andreoni, A. Rising to the Challenge or Perish? Chinese Import Penetration and Its Impact on Growth Dynamics of Manufacturing Firms in South Africa. Struct. Chang. Econ. Dyn. 2023, 64, 199–212. [Google Scholar] [CrossRef]
- Liu, L.; Li, J.; Wang, J.; Liu, F.; Cole, J.; Sha, J.; Jiao, Y.; Zhou, J. The Establishment of an Eco-environmental Evaluation Model for Southwest China and Eastern South Africa Based on the Dpsir Framework. Ecol. Indic. 2022, 145, 109687. [Google Scholar] [CrossRef]
- Bhagwan, N.; Evans, M. A Review of Industry 4.0 Technologies Used in the Production of Energy in China, Germany, and South Africa. Renew. Sustain. Energy Rev. 2023, 173, 113075. [Google Scholar] [CrossRef]
- Hossein, G.; Hamid, G.; Mir, S.P. Green supplier evaluation in manufacturing systems: A novel interval valued hesitant fuzzy group outranking approach. Soft Comput. 2018, 12, 10–12. [Google Scholar]
- Qin, Y.; Li, M.; De, G.; Huang, L.; Yang, S.; Tan, Q.; Tan, Z.; Zhou, F. Research on Green Management Effect Evaluation of Power Generation Enterprises in China Based on Dynamic Hesitation and Improved Extreme Learning Machine. Processes 2019, 7, 474. [Google Scholar] [CrossRef]
- Xiao, Y.; Chen, Z.; McNeil, L. Digital empowerment for shipping development: A framework for establishing a smart shipping index system. Marit. Policy Manag. 2022, 49, 850–863. [Google Scholar] [CrossRef]
- Deng, J.; Huang, S.; Wang, L.; Deng, W.; Yang, T. Conceptual Framework for Smart Health: A Multi-Dimensional Model Using IPO Logic to Link Drivers and Outcomes. Int. J. Environ. Res. Public Health 2022, 19, 16742. [Google Scholar] [CrossRef]
- Feng, M.C.; Ding, Y.D.; Jin, Q.; Zhang, Y.; Zheng, Z.X. Power Grid Evaluation Method Considering the Development of New Business of Smart Electricity Consumption. Control Eng. China 2022, 29, 374–384. [Google Scholar]
- Zhu, X.Y.; Xiao, Y.M.; Xiao, G.W.; Deng, X.J. Research on Driving Factors of Collaborative Integration Implementation of Lean-Green Manufacturing System with Industry 4.0 Based on Fuzzy AHP-DEMATEL-ISM: From the Perspective of Enterprise Stakeholders. Processes 2022, 10, 2714. [Google Scholar] [CrossRef]
- Mahmoud, M.A.; Grace, J. A generic evaluation framework of smart manufacturing systems. Procedia Comput. Sci. 2019, 161, 1292–1299. [Google Scholar] [CrossRef]
- Xiao, G.P.; Wang, Y.X.; Ni, P.; Chen, D.; Zhang, Z.H. Research on Evaluation System of Alliance Enterprises in Intelligent Manufacturing Environment Based on BP Neural Network. J. Phys. Conf. Ser. 2020, 1605, 012041. [Google Scholar] [CrossRef]
- Shafiq, M.; Thakre, K.; Krishna, K.R.; Robert, N.J.; Kuruppath, A.; Kumar, D. Continuous quality control evaluation during manufacturing using supervised learning algorithm for Industry 4.0. Int. J. Adv. Manuf. Technol. 2023. [Google Scholar] [CrossRef]
- Zhou, X.; Huang, J.Q.; Lu, F.; Zhou, W.X.; Liu, P.F. A Novel Compound Fault-tolerant Method Based on Online Sequential Extreme Learning Machine with Cycle Reservoir for Turbofan Engine Direct Thrust Control. Aerosp. Sci. Technol. 2023, 132, 108059. [Google Scholar] [CrossRef]
- Montazeri-Gh, M.; Nekoonam, A. Gas Path Component Fault Diagnosis of an Industrial Gas Turbine Under Different Load Condition Using Online Sequential Extreme Learning Ma-chine. Eng. Fail. Anal. 2022, 135, 106115. [Google Scholar] [CrossRef]
- Mozaffari, A.; Vajedi, M.; Azad, N. A Robust Safety-oriented Autonomous Cruise Control Scheme for Electric Vehicles Based on Model Predictive Control and Online Sequential Extreme Learning Machine with a Hyper-level Fault Tolerance-based Supervisor. Neurocomputing 2015, 151, 845–856. [Google Scholar] [CrossRef]
- Manoharan, A.; Begam, K.; Aparow, V.; Sooriamoorthy, D. Artificial Neural Networks, Gradient Boosting and Support Vector Machines for Electric Vehicle Battery State Estimation: A Review. J. Energy Storage 2022, 55, 105384. [Google Scholar] [CrossRef]
- Psarommatis, F.; May, G.; Dreyfus, P.A.; Kiritsis, D. Zero defect manufacturing: State-of-the-art review, shortcomings and future directions in research. Int. J. Prod. Res. 2020, 58, 1–17. [Google Scholar] [CrossRef]
- Shao, Y.P.; Xu, F.C.; Chen, J.; Lu, J.S.; Du, S.C. Engineering surface topography analysis using an extended discrete modal decomposition. J. Manuf. Process. 2023, 90, 367–390. [Google Scholar] [CrossRef]
- Shao, Y.P.; Du, S.C.; Tang, H.T. An extended bi-dimensional empirical wavelet transform based filtering approach for engineering surface separation using high definition metrology. Measurement 2021, 178, 109259. [Google Scholar] [CrossRef]
Disclaimer/Publisher’s Note: The statements, opinions and data contained in all publications are solely those of the individual author(s) and contributor(s) and not of MDPI and/or the editor(s). MDPI and/or the editor(s) disclaim responsibility for any injury to people or property resulting from any ideas, methods, instructions or products referred to in the content. |
© 2023 by the authors. Licensee MDPI, Basel, Switzerland. This article is an open access article distributed under the terms and conditions of the Creative Commons Attribution (CC BY) license (https://creativecommons.org/licenses/by/4.0/).