Abstract
For decades, the benefits of utilizing hollow fiber bioreactors for continuous cell culture to produce monoclonal antibodies have been widely recognized. However, the suitability of this technology for laboratories or centers with limited resources and expertise seeking to expand their production capacity is uncertain, mainly due to unknown cost-effectiveness. In this study, a hollow fiber bioreactor with a 4.7-mL culture volume was used to culture a hybridoma clone producing immunoglobulin G antibody specific to hemoglobin F (HbF). The antibody reached a maximum concentration of 1.22 g/L and totaled 21 mg over a 44-day culture period. This preliminary production data was used to estimate the cost of consumables required for using the hollow fiber bioreactor to produce 130 mg of monoclonal antibodies, which was found to be THB35.8k (£880). The cost was slightly more expensive than batch cultivation in typical culture dishes, which ranged from THB27.8 to 30.2k (£680 to 740). Despite the advantages in terms of reduced hands-on time, shorter production duration, and highly concentrated products, the primary challenges associated with using hollow fiber bioreactors were the cost and availability of the cartridges.
1. Introduction
Monoclonal antibodies (mAbs) are widely used in research, disease diagnosis, and targeted immunotherapies due to their ability to bind to specific antigens [,]. The amount of mAbs required depends on the stage of product development and the intended applications. Regulatory agencies recommend or enforce the use of in vitro methods to produce mAbs instead of in vivo methods to reduce the use of laboratory animals and the risk of immunogenicity in humans []. The in vitro methods are also preferred in the industry due to their practicality, scalability, and ease of quality control. In developing nations, accessibility to cell culture technology and availability of resources, such as instruments, infrastructure, and experienced technicians, pose critical challenges to innovation in medical product production. Outsourcing the production of mAbs can also be expensive and time-consuming, partly due to import fees and regulations associated with biological products. For laboratories and centers looking to increase their production capacity, there are many in vitro cell culture technologies to choose from, such as roller bottles, stirred tank bioreactors, packed bed systems, wave bioreactors, and hollow fiber (HF) bioreactors [,]. The deciding factors are cost-effectiveness, the requirements for variety, amount, concentration, purity, and quality of the desired antibody, speed of production, space for equipment, equipment investment, and labor [,,].
The HF bioreactors were developed in 1972 to grow cells at high density in vitro []. The primary mechanism for achieving high cell density is through the separation of cells and nutrient supply. The HF cartridge consists of small tubes made of filtration membrane, which divides the cartridge into two compartments, the intracellular space (ICS) and the extracellular space (ECS). Usually, cells are cultured in the ECS, while the media from the reservoir is supplied to the cells through the ICS and semipermeable membrane. This unique design not only allows for the delivery of nutrients to the cells but also facilitates the removal of waste products from their surroundings. The high surface area of the membrane enables a high-density cell culture that can be sustained for months in a continuous mode. Over time, the HF bioreactor has undergone several improvements, including the use of new materials to improve filtration rates, fiber distribution within the housing, and oxygen mass transfer limits [,]. The HF bioreactors have been used to produce biomolecules such as mAbs, viral vectors, and therapeutic cells, as well as for tissue engineering []. In mAb production, the filtration membrane traps the antibody on the cell side, resulting in highly concentrated products that require a smaller footprint, simplifying or eliminating the need for concentration and purification processes. Additionally, since the cells are in a separate compartment from the nutrient supply, they experience low shear stress, and the need for expensive nutrient-rich media is reduced.
The yield obtained from HF bioreactors can vary depending on several factors, such as the type of cells used [,], the size and properties of the HF membrane [,], the media compositions [,,], and process parameters such as nutrient and waste product concentrations, flow rates [], and harvest rates []. In general, the yield of products scales with the culture volume in the HF bioreactor. A yield of 205 mg/month has been reported using an HF bioreactor with a 12 mL ECS volume, though up to 500 mg/month was claimed by the manufacturer [,,]. Large systems, such as those with 120–160 mL of culture volume, can produce 10–25 g/month [,]. Further scaling up is accomplished by running multiple cartridges in parallel. The largest off-the-shelf HF bioreactor currently has an ECS volume of 3.2 L. Compared to other perfusion systems for antibody production, the HF bioreactor has advantages in producing concentrated products in compact instruments (Table 1). The culture in HF bioreactors can remain stable for 2–3 months, although the duration is often limited by membrane clogging due to cells and cell debris over time, equipment failure, or the loss of binding activity of mAb []. In practice, the optimization of cells or processes is more critical for long-term cultivation (>3 months) and large-scale production [].

Table 1.
Perfusion systems for hybridoma cultivation for mAb production.
For a production scale of 0.1–10 g, which is typical for most labs and centers, including ours, the HF bioreactor appears to be an appropriate option. However, despite the availability of commercial systems, there are challenges associated with their investment and implementation due to uncertainties surrounding cost-effectiveness, integration into existing infrastructure, and the availability of experienced technicians. Moreover, most published work is based on older commercial systems or focused on the economics of large-scale production [,]. In this study, we aim to evaluate the performance of an HF bioreactor with a 4.7 mL culture volume for culturing a mouse hybridoma clone to produce an immunoglobulin G (IgG) antibody specific to hemoglobin F (HbF). This mAb could be used to develop diagnostic kits for screening and monitoring blood diseases such as thalassemia []. Additionally, the hybridoma serves as a model for other clones used in our lab. The scope of our study is to use commercially available parts to assemble the bioreactor in-house, gather preliminary production data, and estimate the scale-up production and cost of using the HF bioreactor compared to a batch culture in a typical cell culture dish.
2. Materials and Methods
2.1. Materials
Tissue culture (TC) treated plates, Iscove’s Modified Dulbecco’s Medium (IMDM), fetal bovine serum (FBS), and Penicillin-Streptomycin (PS) were from Gibco™, Thermo Fisher Scientific, UK. Bovine serum albumin (BSA) and other chemicals were from Sigma-Aldrich, UK. Purified HbF and HbA were from the Biomedical Technology Research Center, Faculty of Associated Medical Sciences, Chiang Mai University, Chiang Mai, Thailand. The HF cartridges of size M (20 kDa, polysulfone, outer surface area of fibers 0.053 m2, ECS volume of 4.7 mL) were purchased from Cellab GmbH, Radeberg, Germany. The pump tubes were made of Marprene from Watson Marlow, Marlow, UK. The silicone tubes (with a thickness of 1/16” and an inner diameter of 1/8”) and all tube connectors were purchased from Cole Parmer, Saint Neots, UK.
2.2. Cells
Mouse hybridoma producing mAb (isotype IgG) specific to HbF clone Thal N/B [] was produced as described elsewhere [] at the Biomedical Technology Research Center, Faculty of Associated Medical Sciences, Chiang Mai University, Thailand. Cells were cultured in TC-treated plates at 37 °C and 5% CO2, in IMDM media supplemented with 10% FBS and antibiotics, at a density of 1.4 × 10⁵ cells per 0.3 mL per cm2. Cells were separated and added to new containers every 2–3 days. Cell number and viability were quantified using an automated cell counter (Bio-Rad Laboratories, Inc., Watford, UK) and the trypan blue dye exclusion method.
2.3. HF Bioreactor Setup
The HF bioreactor was set up as shown in Figure 1. A 1 L media reservoir was utilized, which was linked to the ICS of the HF cartridge via silicone tubing and a peristaltic pump. To facilitate oxygen replenishment in the media, the overall length of the silicone tubes was approximately 3 m, providing a total inner-tube surface area of 380 cm2. Furthermore, the media bottle was filter-vented, and the circulating media was directed to drip back from the tubing into the reservoir. To generate circulation in the ECS, the ECS was connected to another set of silicone tubes and a peristaltic pump. The HF cartridge was sterilized using gamma irradiation by the manufacturer. Before cell inoculation, the HF bioreactor was rinsed with circulating PBS followed by cell culture media for 24 h each. All other non-sterile components were autoclaved for sterilization. All manipulations that exposed the inside of the HF system to air were conducted in a biosafety cabinet with aseptic techniques.
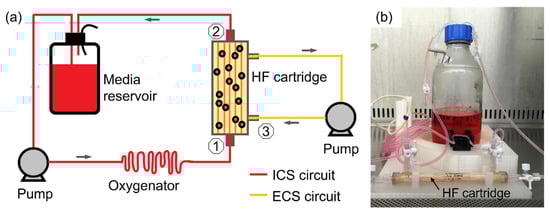
Figure 1.
Hollow fiber (HF) reactor setup. (a) Diagram of the in-house assembly of the HF bioreactor, which consists of commercially available parts. The media reservoir, peristaltic pump, and an extra-long silicone tube, acting as an oxygenator, are connected to the intracellular space (ICS) of the HF cartridge. Another circuit comprises the extracellular space (ECS) connected to a silicone tube and a peristaltic pump. Sample collection points are the inlet and outlet ports of the ICS, and the ECS port as indicated by the numbers 1 to 3, respectively. (b) A photo of the HF bioreactor equipped with a Cellab® size-M cartridge (ECS volume of 4.7 mL). During the cultivation process, this setup was placed inside a standard table-top CO2 incubator and connected to pumps (not shown).
2.4. Continuous Cell Culture in HF Bioreactor
Cells in 5 mL of IMDM with 10% FBS were inoculated in the ECS of the HF bioreactor using syringes. In the first run, 11 × 106 (85% viability) and 50 × 106 (88% viability) viable cells were added on days 0 and 17, respectively. In the second run, 50 × 106 (88% viability) cells were added on day 0. The media reservoir was filled with 500 mL of IMDM without FBS. Circulation rates in the ICS were 20 mL/min most of the time, while the ECS had a rate between 0.3–0.9 mL/min (Figure 2a,b). The media color was checked daily by eyes. Once the color change in the media was observable, “small” collections of 0.5 mL were taken every 1–3 days from the ICS inlet and outlet, as well as the ECS (numbers 1–3 respectively, in Figure 1a) to measure glucose, lactate, and mAb concentrations. When the glucose concentration in the ICS dropped to ~3 g/L, a new media bottle containing fresh media (glucose ~4.5 g/L) was switched in. “Large” collections of 5.0 mL were taken from the ECS to harvest mAb on days 5, 17, 25, and 44 for run 1 (Figure 2c). Any removed media from the ECS was replaced with an equal volume of fresh media (containing 10% FBS) through the other ECS port using a syringe. The procedures were conducted slowly to minimize disturbances to cells. The culture was maintained for 44 days in run 1 and 17 days in run 2. The recorded time was in hours but plotted in days for ease of visualization and discussion.
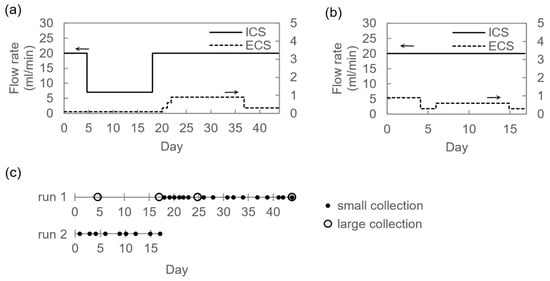
Figure 2.
Flow rates and sample collection. Flow rates of media circulation in the ICS and the ECS in (a) run 1 and (b) run 2. The arrows indicate the y-axis that corresponds to the data. (c) Time of the sample collections.
2.5. Batch Culture in Cell Culture Dishes
Cells were seeded into 24-well plates in a fixed volume of 500 µL at three different concentrations: 0.14, 1.03, and 1.94 × 10⁶ cells/mL corresponding to “low,” “medium,” and “high” conditions, respectively. The experiment was of the destructive type, meaning that triplicates of each condition were sacrificed daily for 4–6 days, and the collected samples were analyzed. For ease of visualization and discussion, time was recorded in hours but plotted in days.
2.6. Glucose and L-Lactic Acid Measurements and Calculations
Enzymatic assays were performed on the collected samples to measure the levels of glucose and L-lactic acid using commercial reagent kits (Randox GL3881 and LC3980) and a chemical analyzer (Randox, Crumlin, UK). To isolate cells and debris, all samples were first centrifuged at 10,000× g for 3 min. Before measurements, the supernatant was diluted 1:3 v/v with normal saline (0.9% w/v). The glucose uptake rate (GUR) and lactate production rate (LPR) was computed by dividing the change in the amount of glucose or lactate by time using the interval between consecutive media exchanges or a shorter period as indicated in the plots.
2.7. Quantification of mAbs
The concentration of mAbs in the samples was determined using an indirect ELISA following a previously published protocol []. Firstly, high-binding 96-well ELISA plates were coated with 0.01% PLL and then with 10 µg/mL of purified HbF (the targeted antigen) or HbA (used as a negative control for specificity). A 2% BSA in PBS solution was used in the blocking step. Before quantitative analysis, the collected samples were centrifuged for 3 min at 10,000× g and diluted with wash buffer (PBS + 0.4% tritonX). Subsequently, 50 µL of the prepared samples were added to each well after the blocking step and incubated at 37 °C for 1 h. Rabbit anti-mouse IgG conjugated with peroxidase (A9044, Sigma, 1:10,000 v/v) and 3,3′,5,5′-Tetramethylbenzidine (TMB) were used for colorimetric detection of mAb. A typical plate reader was used to measure absorbance at 450 nm. The purified mAb clone Thal N/B, which was the clone used in this study, was utilized as a calibrator. To obtain the purified mAb clone Thal N/B, the culture supernatant was purified by affinity chromatography using a HiTrap Protein G column (GE Healthcare, US), and the mAb concentration was determined by measuring absorbance at 280 nm using a Nanodrop spectrophotometer. The absorbance of the calibrators was fitted to a four-parameter logistic curve, which was then used to calculate the mAb concentration in the samples.
2.8. Estimation of Scale-Up Production and Cost
The resources required to produce 130 mg of mAbs were estimated by assuming a linear scale-up with the cell culture volume, i.e., the same average mAb concentration could be achieved []. An HF cartridge of 15.5 mL ECS volume (e.g., Cellab size L) and the 10-cm dishes filled with 10 mL of the serum-containing media were employed. The maximum number of HF bioreactors or dishes that could be run in parallel was determined based on the capacity of a typical 180-L laboratory incubator or the number of units that one full-time technician could handle in a 4 h/day, whichever was lower. The time was assigned to each task and summed according to each culture scenario to determine the total hands-on time. The production duration was determined based on the culture time for each run, assuming no break between runs. The cost was calculated for consumables and reagents, such as basic media, media supplements, cell culture containers, tubes, and connectors (the latter two for the HF bioreactor). For the seed preparation phase, the resources and cost were analyzed based on batch cultivation in 10-cm dishes, where cells reached a maximum density of 1.6 × 10⁶ cells/mL. The time required to prepare the cell inoculum was calculated based on a starting cell number of one million (e.g., from a cell bank) and a doubling time of 22 h (computed from experimental data).
3. Results and Discussion
3.1. Evaluation of Cell Culture in the HF Bioreactor
At the start of continuous culture, 11 × 106 cells were inoculated into the ECS of the HF bioreactor. The viability of the cells was indirectly accessed by measuring the glucose concentration in the cell media. From the ICS inlet samples, glucose concentration decreased slowly at the beginning, as observed on days 5 and 17 of the culture (Figure 3a). While the depletion of glucose suggested that there were viable cells in the bioreactor, more cells (50 × 106) were added into the ECS on day 17 to increase production capacity. Consequently, the glucose concentrations decreased more rapidly. The concentration of lactic acid was also measured from the collected samples, which increased relatively slowly in the first 17 days and became faster after the addition of cells (Figure 3b). From day 17 to the end of the culture duration on day 44, the media reservoir was changed every 4 to 7 days to keep the glucose level above 3 g/L. As a result, the lactic acid was cleared out of the system, and its concentration in the ICS media remained below 0.6 g/L for the entire culture duration.
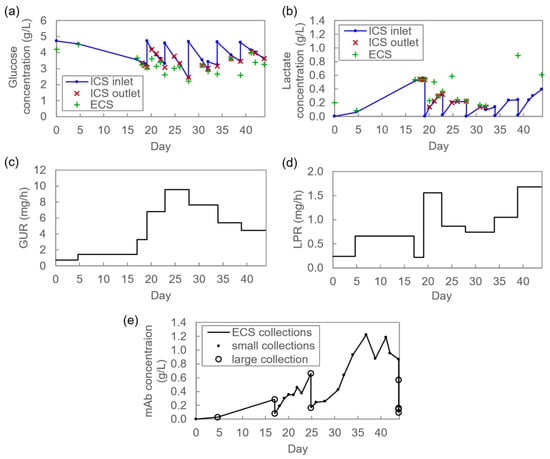
Figure 3.
Continuous culture of 44 days in the HF bioreactor. Concentrations of (a) glucose and (b) lactic acid, (c) glucose uptake rate (GUR), and (d) lactate production rate (LPR). (e) The concentration of monoclonal antibodies (mAbs) in the ECS samples. Samples were collected once a day except on a few occasions when two or more collections were obtained, as apparent from multiple data points on the same day.
The glucose and lactate concentrations in samples collected from the ICS outlet were found to be similar to those collected from the ICS inlet (Figure 3a,b). However, the glucose concentration in the samples collected from the ECS was generally lower than in the ICS inlet samples, with an average difference of 0.37 g/L and a maximum difference of 0.88 g/L on day 39. Conversely, the concentration of lactate, which is expected to diffuse from the ECS to the ICS, was higher in the ECS than in the ICS inlet, with an average difference of 0.12 g/L and a maximum difference of 0.65 g/L on day 39. These differences in concentrations between the two compartments suggest that the rates of glucose uptake and lactate production by cells were higher than the diffusion rates through the semi-permeable membrane. Despite this, the concentration of lactic acid in the ECS remained below 0.9 g/L throughout the run, which is relatively low compared to another study []. Importantly, the trend in concentrations for both glucose and lactic acid in all locations was consistent throughout the culture period, indicating reliable permeability of the membrane.
The glucose concentrations from the ICS inlet samples were used to calculate the GUR, a metabolic parameter linked to cell viability and growth. During the initial 17 days, the average GUR remained relatively low, ranging between 0.7 and 1.4 mg/h (Figure 3c). However, after the addition of more cells on day 17, the GUR increased dramatically, peaking at an average of around 9.5 mg/h between days 23 and 28 before gradually decreasing towards the end of the run. Additionally, the LPR, which was calculated using lactate concentrations from the inlet samples, was found to be between 0.24 and 0.66 mg/h initially and increased to 0.74 and 1.7 mg/h between days 19 and 44 (Figure 3d). These rates suggested that the cells likely reached their maximum viable concentration in the bioreactor before plateauing or possibly decreasing towards the end of the culture period.
3.2. Quantification of Antibody Production
The produced mAb was quantified using ELISA, where the purified antigen (HbF) was used as the coating antigen. As expected, the mAbs were detected only in the ECS samples, confirming the effective retention of antibodies by the 20 kDa membrane (data not shown). The concentrations of mAbs in the ECS samples increased gradually over time (Figure 3e). Notably, the antibody concentrations dropped on days 17, 25, and 44 due to the “large” collection of 5 mL. The mAb reached its peak concentration of 1.22 g/L on day 37, after which it fluctuated between 0.87 and 1.19 g/L until the end of the culture period. In total, 21 mg of mAbs was produced in 44 days.
3.3. Effect of Cell Number in the Inoculum
To speed up the mAb production, an increase in the number of inoculated cells was examined. A total of 50 × 106 cells—a 4.5-fold increase from the previous run—were added to the ECS of a new HF bioreactor. The culture duration was 17 days so that the results could be compared to those of run 1 in the first 17 days before the second addition of cells. Similar to run 1, the glucose and lactate concentrations in the ICS and the ECS in run 2 were slightly different but relative to each other (Figure 4a,b). Over 12 days, glucose decreased from 4.7 to 3.0 g/L in the ICS, which was faster than in run 1 where glucose decreased from 4.7 to 3.2 g/L in 19 days. The lactate concentration also increased more rapidly in run 2 compared to run 1. The GUR reached a maximum average of 8.9 mg/h between day 12 and the end of the run on day 17 (Figure 4c), while the average LPR was between 1.0 and 1.2 throughout the culture period (Figure 4d). For run 2, the average GUR and LPR over 17 days were 5.3 and 1.1 mg/h, respectively (Table 2). These average rates were higher than run 1, suggesting a higher cell density in the bioreactor. Normalizing the rates with the number of cells in the inoculum revealed that the average GUR per inoculated cell was similar for both runs. However, the normalized LPR was lower by approximately twofold in run 2 compared to run 1. A lower LPR in run 2 may be attributed to a higher average flow rate in the ICS, which likely improved oxygen delivery to cells [].
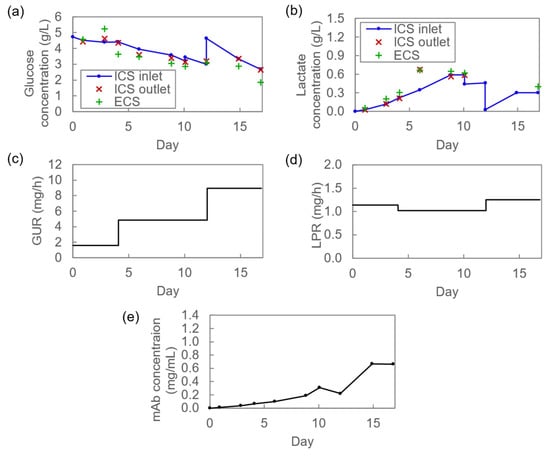
Figure 4.
Continuous culture of 17 days in the HF bioreactor. Concentrations of (a) glucose and (b) lactate, (c) GUR, (d) LPR, and (e) concentration of mAb over time.
Table 2.
Comparisons of results from cell culturing in HF bioreactors for 17 days.
Regarding antibody production, the mAb concentration in the ECS increased over time and peaked at 0.67 g/L on day 15 (Figure 4e). The total yield from the 17-day culture period was 5.9 mg, compared to 1.6 mg from run 1. Normalization with the number of inoculated cells indicated comparable yields per cell in both runs (Table 2). These results suggested that increasing the number of inoculated cells resulted in a somewhat proportional increase in cell numbers and yield in the bioreactor. However, more repetitions would be necessary for statistical analysis.
3.4. Cell Culture in Tissue Culture Plate Operated in Batch Mode
In this study, we aimed to collect preliminary data on the performance data of the HF bioreactor culture and compare it with the conventional production method, which involved batch cultivation in a standard cell culture dish. The production data for the batch culture was obtained from experiments using three different initial cell concentrations. In the case of a “low” starting cell density, the number of viable cells increased with time and peaked at 2.02 × 10⁶ cells/mL around day 4 before decreasing to zero by day 6 (Figure 5a,b). Meanwhile, in the “medium” and “high” conditions, cell growth was observed for a shorter period, with the viable cell density reaching 2.86 × 10⁶ and 2.18 × 10⁶ cells/mL around days 1 and 2, respectively. As expected, the concentrations of glucose and lactate in the culture media changed over time in line with the number of viable cells (Figure 5c,d).
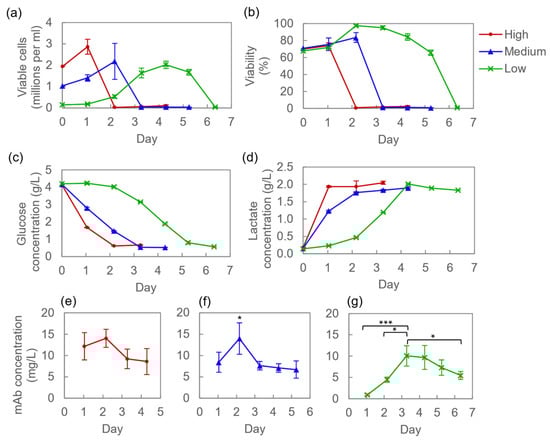
Figure 5.
Batch culture in cell culture dishes with “low,” “medium,” or “high” inoculation cell density. (a) Concentrations of viable cells. (b) Percent cell viability. Concentrations of (c) glucose, (d) lactic acid, and (e–g) mAb in the cell culture supernatant over time, with the average values and standard deviations plotted. Statistical analysis was performed using one-way ANOVA with the Sidak post hoc test to compare the means of mAb concentrations. The significant levels of the comparisons between the maximum point and other points are indicated as * for p < 0.05 and *** for p < 0.0005.
In terms of mAb production, the highest concentration in the “high” cell condition was 12.2 ± 26% mg/L, achieved around day 1 (Figure 5e). For the “medium” and “low” conditions, the highest mAb concentrations were observed at 14.0 ± 27% mg/L around day 2 and 10.1 ± 24% mg/L around day 3, respectively (Figure 5f,g). After reaching the maximum, the mAb concentration decreased over time, with statistical significance found in the “medium” and “low” conditions. The decrease in mAb concentration was likely due to the degradation of antibodies in the deteriorating culture environment as cells died off. The culture conditions were further evaluated by the space-time yield (STY), defined as the mass of produced mAb per culture volume and time, and the productivity per cell, defined as yield normalized with culture volume and the number of cells in the inoculum (Figure 6). The highest STY of 11.2 mg/L/day was achieved with a 1-day culture at “high” cell density (“H1”). However, the productivity per cell was the lowest in this condition since the cells quickly died due to nutrient depletion. Other culture methods such as fed-batch or perfusion culture should be considered in this case. The highest productivity of 145.2 ng/L/cell was obtained from a 3-day culture of “low” cell inoculum (“L3”). However, the STY for “low” conditions was lower than in “medium” and “high” conditions since the low starting cell number resulted in a lower yield and a longer production duration. Overall, “M2” and “L3” appeared to be the most reasonable conditions for the time and materials requirements.
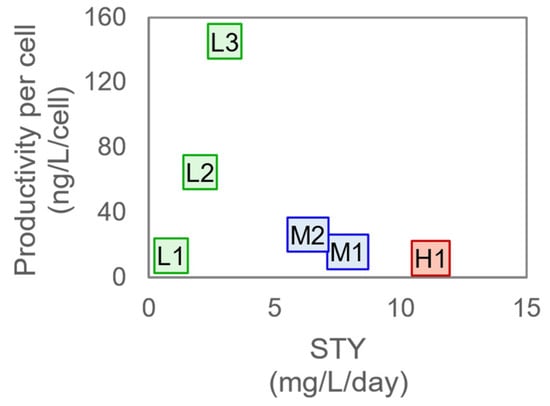
Figure 6.
Productivity per cell and STY of the production by batch cultivation of various starting cell densities (L: low, M: medium, and H: high) and culture duration (indicated by days).
3.5. Scale-up Estimation and Cost Analysis
The resources needed to produce 130 mg of mAbs, which is sufficient for producing diagnostic kits for multi-center testing, were estimated based on the experimental data from the HF bioreactor (run 1) and “M2” and “L3” batch conditions. The cell culture was scaled up to the HF cartridge with 15.5-mL ECS volume (3.3-fold larger than the one used in the experiments) or 10-cm dishes (20-fold larger than the one used in the experiments). To produce the required amount of mAbs, two HF bioreactors would need to be operated concurrently in a continuous mode for 44 days, requiring 30 h of hands-on time (Table 3). In our case, the total cost of consumables and reagents for the production phase using the HF bioreactors was estimated to be THB35.3k, with 60% of that cost coming from the HF cartridges. Alternatively, batch culture would require more than 950 dishes, with 40 dishes being handled at a time (i.e., per run) by one full-time technician. The production durations were 72 and 132 days for M2 and L3, respectively. In the production phase, M2 required less hands-on time and was cheaper than L3, which was expected since M2 yielded a higher mAb concentration and required fewer runs and serum media. In the batch culture case, the cost of serum-containing media accounted for approximately 72% of the total cost.
Table 3.
A summary of estimated resources for a production of 130 mg using the HF bioreactors in continuous mode compared to the standard cell culture dishes in batch mode. The colors green, yellow, and red indicate relative performance of the three conditions from best to worst for each indicator.
In terms of cell preparation requirements, the HF bioreactor required 4.6- and 25-fold fewer total cells than L3 and M2, respectively (Table 3). The number of required cells per run was similar in the HF bioreactor and M2, and less in L3. Although the difference in seed culture preparation duration among the three cases was relatively small compared to the production time, the HF bioreactor would only require one round of cell preparation. In terms of downstream processing, 130 mg of mAb collected from the HF bioreactors would be concentrated in 0.3 L, which is significantly less than the 9.5 L or more for the batch culture. This difference in volume would impact storage space, downstream processing time, labor, and ultimately cost, all of which favor the use of the HF bioreactor over the batch method.
The cost analysis revealed that the HF bioreactor had the highest total cost of consumables for both the seed preparation and production phases (THB35.8k), followed by M2 (THB30.2k) and L3 (THB27.8). The primary contributor to the higher cost of the HF bioreactor was the imported HF cartridges. Furthermore, using the HF bioreactor would require additional capital investment in instruments such as peristaltic pumps or a commercial HF bioreactor system. However, despite the higher upfront and consumable material cost, the HF bioreactor system could be more cost-effective than the batch method in the long run, given gains in labor intensity, production duration, and factors related to downstream processing. As for infrastructure requirements, the compact size of the HF bioreactor made it easy to fit into a tabletop incubator, facilitating integration into an existing cell culture facility. Setting up a small in-house HF bioreactor and operating it for mAb production could be initially complicated, however, it was straightforward with existing publications and instruction manuals providing adequate guidance, at least for a simple bioreactor configuration. Nonetheless, optimizing the conditions could be expensive due to the cartridges’ cost and the number of conditions that could be tested concurrently. Hence, an HF bioreactor may be cost-effective only for cases such as repeated production from the same cells or when a large quantity is required in a short period.
The cost estimation in this study has some limitations due to the assumptions made during scale-up. For instance, the average mAb concentration in the larger HF cartridge (15 mL) was assumed to be equal to that in the smaller cartridge (4.7 mL). This assumption may be reasonable given the modest 3.3-fold scale-up and similarity in membrane surface area to ECS volume ratio between both cartridges (0.011 and 0.016 m2/mL for the small and large cartridges, respectively). A previous study reported equal mAb concentrations from using HF bioreactors of 12-mL and 2 × 60-mL ECS volume []. However, the study used additional supplements (low-concentration serum and ferric citrate) in the ICS media, which shorten the production time but would increase the cost. The cost analysis in our study also assumed the same 44 days culture duration as in the experiment. A longer culture period is possible, which would increase the STY and yield per cartridge, ultimately reducing the cost. Nevertheless, further experiments are needed to verify these scale-up scenarios.
To improve the yield from the HF bioreactor, further optimization is required. In another study using the same HF cartridge (4.7-mL ECS volume), low- and high-hybridoma producers yielded 7.27 or 25 mg of mAb, respectively, in 12 days (Cellab GmbH application note published in 2014). Other studies using different HF bioreactors of similarly small culture volume estimated an average production of 3–5 mg/day from a 2.5-mL ECS volume at an optimum condition [], and 0.91–7.19 mg/h from a 4-mL cartridge []. Media compositions and running parameters such as flow rates could be explored to increase the yield. Moreover, a longer culture period would allow for more harvest time. In our experiments, the transport of molecules through the membrane appeared uncompromised after 44 days. However, fluctuating mAb concentrations after day 37 and a decrease in GUR after day 32 observed in the HF bioreactor (run 1) may indicate a decline in the number of viable cells or mAb productivity. These may be due to the accumulation of cells and cell debris over time [,], as no “large” collections from the ECS were made between days 25 and 44. Hence, future improvements could include optimizing schedules for “flushing” the ECS to clear out cells and cell debris.
4. Conclusions
The HF bioreactor of 4.7 mL culture volume produced 21 mg of mAb against HbF in 44 days of continuous culture. Based on the preliminary experimental data, the estimated cost of consumable materials for producing 130 mg mAbs was THB35.8k (£880) using the HF bioreactors, while typical culture dishes in batch mode would cost between THB27.8 and 30.2k (£680 and 740). Further optimization could improve the cost-effectiveness and production duration of the HF bioreactor, but the expenses associated with optimizing the process could be high due to the cost of the HF cartridges. Integrating the HF bioreactor into an existing cell culture facility may pose some initial challenges, but the benefits in terms of reduced production duration and labor requirement are clear. Ultimately, the suitability of the HF bioreactor for laboratories or centers seeking to expand their production capacity will depend on the availability and cost of the HF cartridges.
Author Contributions
Conceptualization, F.T., W.K. and A.H.-B.; Data curation, F.T.; Formal analysis, F.T.; Funding acquisition, F.T., W.K. and A.H.-B.; Methodology, F.T., S.P. and W.L.; Project administration, F.T.; Resources, F.T., S.P., W.L., W.K. and A.H.-B.; Visualization, F.T.; Writing—original draft, F.T.; Writing—review & editing, F.T., S.P., W.L., W.K. and A.H.-B. All authors have read and agreed to the published version of the manuscript.
Funding
This work was supported by the Office of the Higher Education Commission and the Thailand Research Fund (TRF) (grant no. MRG6080185 to FT), the Distinguished Research Professor Grant (grant no. NRCT808/2563 to WK), the UK Department for Business, Energy and Industrial Strategy and the Thailand Research Fund (a Researcher Links grant ID 2017-RLTG8-10143 and PDG61W0009 to FT, under the Newton UK-Thailand Research and Innovation Partnership Fund delivered by the British Council), and partially supported by Chiang Mai University.
Institutional Review Board Statement
This study does not involve human participants. For the production of hybridoma cells, BALB/C mice were used, and the mice were handled according to the Guide for the Care and Use of Laboratory Animals, published by the National Research Council (US). However, the animal experiment and the production of hybridoma cells used in this study were done before the establishment of the Institutional Animal Care and Use Committee (IACUC) at Chiang Mai University. Therefore, the approval of the ethics committee for animal use is not applicable.
Data Availability Statement
The data presented in this study are available from the corresponding author upon request.
Conflicts of Interest
The authors declare no conflict of interest.
References
- Gao, Y.; Huang, X.; Zhu, Y.; Lv, Z. A brief review of monoclonal antibody technology and its representative applications in immunoassays. J. Immunoass. Immunochem. 2018, 39, 351–364. [Google Scholar] [CrossRef]
- Ecker, D.M.; Jones, S.D.; Levine, H.L. The therapeutic monoclonal antibody market. MAbs 2015, 7, 9–14. [Google Scholar] [CrossRef] [PubMed]
- Jackson, L.R.; Trudel, L.; Lipman, N. Small-Scale Monoclonal Antibody Production in Vitro: Methods and Resources. Lab Anim. 1999, 28, 38–50. [Google Scholar]
- Jyothilekshmi, I.; Jayaprakash, N.S. Trends in Monoclonal Antibody Production Using Various Bioreactor Syst. J. Microbiol. Biotechnol. 2021, 31, 349–357. [Google Scholar] [CrossRef] [PubMed]
- Jain, E.; Kumar, A. Upstream processes in antibody production: Evaluation of critical parameters. Biotechnol. Adv. 2008, 26, 46–72. [Google Scholar] [CrossRef]
- Dewar, V.; Voet, P.; Denamur, F.; Smal, J. Industrial implementation of in vitro production of monoclonal antibodies. ILAR J. 2005, 46, 307–313. [Google Scholar] [CrossRef] [PubMed]
- Griffiths, J.B. Animal cell culture processes--batch or continuous? J. Biotechnol. 1992, 22, 21–30. [Google Scholar] [CrossRef]
- Nagel, A.; Koch, S.; Valley, U.; Emmrich, F.; Marx, U. Membrane-based cell culture systems--an alternative to in vivo production of monoclonal antibodies. Dev. Biol. Stand. 1999, 101, 57–64. [Google Scholar]
- Knazek, R.A.; Gullino, P.M.; Kohler, P.O.; Dedrick, R.L. Cell culture on artificial capillaries: An approach to tissue growth in vitro. Science 1972, 178, 65–66. [Google Scholar] [CrossRef]
- Whitford, W.G.; Cadwell, J.J. Interest in hollow-fiber perfusion bioreactors is growing. BioProcess Int. 2009, 7, 54–63. [Google Scholar]
- Cadwell, J.J. New developments in hollow-fiber cell culture. Am. Biotechnol. Lab. 2004, 22, 14–19. [Google Scholar]
- Eghbali, H.; Nava, M.M.; Mohebbi-Kalhori, D.; Raimondi, M.T. Hollow fiber bioreactor technology for tissue engineering applications. Int. J. Artif. Organs 2016, 39, 1–15. [Google Scholar] [CrossRef] [PubMed]
- Valdés, R.; González, M.; Geada, D. Assessment of a Protein-Free Medium Performance in Different Cell Culture Vessels using Mouse Hybridomas to Produce Monoclonal Antibodies. Pharm. Anal. Acta 2012, 3, 4. [Google Scholar] [CrossRef]
- Gramer, M.J.; Britton, T.L. Selection and isolation of cells for optimal growth in hollow fiber bioreactors. Hybridoma 2000, 19, 407–412. [Google Scholar] [CrossRef] [PubMed]
- Lowrey, D.; Murphy, S.; Goffe, R.A. A comparison of monoclonal antibody productivity in different hollow fiber bioreactors. J. Biotechnol. 1994, 36, 35–38. [Google Scholar] [CrossRef] [PubMed]
- Altshuler, G.L.; Dziewulski, D.M.; Sowek, J.A.; Belfort, G. Continuous hybridoma growth and monoclonal antibody production in hollow fiber reactors-separators. Biotechnol. Bioeng. 1986, 28, 646–658. [Google Scholar] [CrossRef] [PubMed]
- Liu, C.H.; Liu, Y.X.; Kumari, M.; Wu, W.C. Multivariate analysis of metabolic parameters and optimization of antibody production using high cell density hybridoma in hollow fiber bioreactors. Biotechnol. Lett. 2019, 41, 963–977. [Google Scholar] [CrossRef]
- Valdés, R.; Gonzalez, M.; González, Y.; Gómez, H.; García, J.; Alvarez, T.; Gómez, L.; Gavilondo, J. Production of an anti-HBsAg mouse IgG-2b κ monoclonal antibody in hollow fiber bioreactors using different cell culture media and operation modes. Biotecnol. Apl. 2005, 22, 112–116. [Google Scholar]
- Lowrey, D.; Murphy, S.; Goffe, R.A. The effect of intracapillary media feed protocols on hollow fiber cell culture. Biotechnol. Lett. 1993, 15, 1025–1030. [Google Scholar] [CrossRef]
- Gramer, M.J.; Poeschl, D.M.; Conroy, M.J.; Hammer, B.E. Effect of harvesting protocol on performance of a hollow fiber bioreactor. Biotechnol. Bioeng. 1999, 65, 334–340. [Google Scholar] [CrossRef]
- Valdés, R.; Tamayo, A.; González, M.; Padilla, S.; Geada, D.; Ferro, W.; Milá, L.; Gómez, L.; Alemán, R.; Leyva, A. Production of a monoclonal antibody by ascites, hollow fiber system, and transgenic plants for vaccine production using CB. Hep-1 mAb as a study case. Biotechnol. Bioprocess Eng. 2012, 17, 145–159. [Google Scholar] [CrossRef]
- Rodrigues, M.E.; Costa, A.R.; Henriques, M.; Azeredo, J.; Oliveira, R. Technological progresses in monoclonal antibody production systems. Biotechnol. Prog. 2010, 26, 332–351. [Google Scholar] [CrossRef]
- Li, F.; Vijayasankaran, N.; Shen, A.Y.; Kiss, R.; Amanullah, A. Cell culture processes for monoclonal antibody production. MAbs 2010, 2, 466–479. [Google Scholar] [CrossRef]
- Komolpis, K.; Udomchokmongkol, C.; Phutong, S.; Palaga, T. Comparative production of a monoclonal antibody specific for enrofloxacin in a stirred-tank bioreactor. J. Ind. Eng. Chem. 2010, 16, 567–571. [Google Scholar] [CrossRef]
- Ayyildiz-Tamis, D.; Nalbantsoy, A.; Elibol, M.; Deliloglu-Gurhan, S.I. Effect of Operating Conditions in Production of Diagnostic Salmonella Enteritidis O-Antigen-Specific Monoclonal Antibody in Different Bioreactor Systems. Appl. Biochem. Biotechnol. 2014, 172, 224–236. [Google Scholar] [CrossRef] [PubMed]
- Tang, Y.-J.; Ohashi, R.; Hamel, J.-F.P. Perfusion Culture of Hybridoma Cells for Hyperproduction of IgG2a Monoclonal Antibody in a Wave Bioreactor-Perfusion Culture System. Biotechnol. Prog. 2007, 23, 255–264. [Google Scholar] [CrossRef] [PubMed]
- Nilsang, S.; Nandakumar, K.S.; Galaev, I.Y.; Rakshit, S.K.; Holmdahl, R.; Mattiasson, B.; Kumar, A. Monoclonal antibody production using a new supermacroporous cryogel bioreactor. Biotechnol. Prog. 2007, 23, 932–939. [Google Scholar] [CrossRef]
- Vermasvuori, R.; Hurme, M. Economic comparison of diagnostic antibody production in perfusion stirred tank and in hollow fiber bioreactor processes. Biotechnol. Prog. 2011, 27, 1588–1598. [Google Scholar] [CrossRef]
- Marx, U.; Embleton, M.J.; Fischer, R.; Gruber, F.P.; Hansson, U.; Heuer, J.; de Leeuw, W.A.; Logtenberg, T.; Merz, W.; Portetelle, D.; et al. Monoclonal Antibody Production. Altern. Lab. Anim. 1997, 25, 121–135. [Google Scholar] [CrossRef]
- Mosca, A.; Paleari, R.; Leone, D.; Ivaldi, G. The relevance of hemoglobin F measurement in the diagnosis of thalassemias and related hemoglobinopathies. Clin. Biochem. 2009, 42, 1797–1801. [Google Scholar] [CrossRef]
- Pata, S.; Khummuang, S.; Pornprasert, S.; Tatu, T.; Kasinrerk, W. A simple and highly sensitive ELISA for screening of the alpha-thalassemia-1 Southeast Asian-type deletion. J. Immunoass. Immunochem. 2014, 35, 194–206. [Google Scholar] [CrossRef] [PubMed]
- Whitford, W.; Cadwell, J.J. The potential application of hollow fiber bioreactors to large-scale production. BioPharm Int. 2011, 2011. [Google Scholar]
- Omasa, T.; Kobayashi, M.; Nishikawa, T.; Shioya, S.; Suga, K.-I.; Uemura, S.-I.; Kitani, Y.; Imamura, Y. Enhancement of antibody production by growth factor addition in perfusion and hollow-fiber culture systems. Biotechnol. Bioeng. 1995, 48, 673–680. [Google Scholar] [CrossRef] [PubMed]
Disclaimer/Publisher’s Note: The statements, opinions and data contained in all publications are solely those of the individual author(s) and contributor(s) and not of MDPI and/or the editor(s). MDPI and/or the editor(s) disclaim responsibility for any injury to people or property resulting from any ideas, methods, instructions or products referred to in the content. |
© 2023 by the authors. Licensee MDPI, Basel, Switzerland. This article is an open access article distributed under the terms and conditions of the Creative Commons Attribution (CC BY) license (https://creativecommons.org/licenses/by/4.0/).