Article

CFD-DEM Simulation of Slugging and Non-Slugging Fast Fluidization of Fine Particles in a Micro Riser

1
School of Mathematics and Statistics, Chongqing Three Gorges University, Chongqing 404020, China
2
Dongguan Key Laboratory of Kunpeng Computing, School of Computer Science, Guangdong University of Science & Technology, Dongguan 523083, China
3
State Key Laboratory of Plateau Ecology and Agriculture, Qinghai University, Xi’ning 810016, China
*
Author to whom correspondence should be addressed.
Processes 2023, 11(10), 2977; https://doi.org/10.3390/pr11102977
Submission received: 16 September 2023 / Revised: 7 October 2023 / Accepted: 12 October 2023 / Published: 14 October 2023
(This article belongs to the Special Issue 10th Anniversary of Processes: Women's Special Issue Series)

Abstract

:
The discrete element method (DEM) coupled with computational dynamics (CFD) has been considered one of the most sensitive ways of studying the micro fluidized bed. This article proposes a so-called particle circumstance-dependent drag model that is dependent on a particle’s complex circumstances. Slugging and non-slugging fast fluidization in a micro fluidized bed is modeled with the use of the CFD-DEM. The results show that the formation and the fragmentation of clusters in a slugging fast fluidized state are clearly captured, and both have time synchronization. However, with the increase in gas velocity, the boundary of the dense and dilute phases turns blurry and the slugs disappear. Furthermore, there exists a relatively serious backmixing of particles in the slugging fast fluidization, while the backmixing effect weakens in the non-slugging fast fluidization. Moreover, the outlet solid flux decreases compared with those in the big fluidized beds for the slugging fast fluidized bed due to the micro size effect, while the micro size effect on the solid flux is not distinct for the non-slugging fast fluidized bed. Last but not least, the radial porosity with slugging exhibits a weakened core-annulus structure compared with the correlated radial porosity in the big fluidized beds. The radial porosity without slugging tends to approach the correlated core-annulus structure.

1. Introduction

Gas-solid two-phase flow phenomena can be commonly found in nature and in industrial processes [1]. Fluidized beds were used early on for coal gasification and are currently widely used in industries such as chemical, petroleum, metallurgy, and nuclear industries. Nearly all types of two-phase flows in gas-solid fluidized beds are typical coupled complex systems and asymmetrical problems. There exist three unit sizes of single gas molecule, single particle, and bed device in a fluidized bed, corresponding to the molecule scale, the micro scale, and the macro scale, respectively. Furthermore, the interaction between the three unit scales will generate more complex fluid mesoscopic scale phenomena. The mesoscale structures include bubbles in the emulsion phase in bubbling fluidization, clusters in the cavitation in fast fluidization, and gas slugs and particle plugs in slugging fluidization. These local characteristic structures are of great importance for the cognition of the fluidization dynamics under different fluidization regimes.
The fluidization behaviors or regimes are determined by not only operation conditions and gas-solid properties, but also by bed geometry structures and sizes [2]. Sometimes, changing the geometry structure is equivalent to changing the operating conditions. For example, a fast fluidized bed usually forms an axial structure with a single increasing exponential distribution. However, when a constraint structure is set at the outlet of the fast fluidized bed, a C-shaped distribution is formed where the middle of the bed is dense and the two ends are dilute. The geometry change is essentially an additional outlet boundary condition. The geometry size factor, although not emphasized enough, has been reported in theoretical, experimental, and stimulation research. For example, the bubbling fluidization is easy to translate into the slugging fluidization when decreasing the bed diameter or increasing the aspect ratio. When maintaining the slugging operation, increasing the bed height is beneficial for converting the wall slugs and the round-nosed slugs to the square-nosed slugs [3].
Another case in point is the micro fluidized beds (MiFB), the size of which may be several orders of magnitude smaller than the big fluidized beds (MaFB) in laboratory and industrial scales. The significance of the research in the MiFB lies in at least four aspects. Firstly, the micro fluidized bed is advantageous considering its low cost, convenient construction, safe operation, and high output efficiency. It has been applied as a reaction analyzer and to produce high-value fine chemicals [4]. Secondly, the decreasing global scale is beneficial for using numerical methods to study fluidized beds. Thirdly, the number and range of interaction units are both reduced, which helps researchers to capture the most fundamental dynamic mechanisms. Last but not least, from the point of view that the MiFB and the MaFB have the statistical similarities in time process and spatial structure, one can conduct comparative research based on a fractional method. This may help to break through the difficulty of fluidization amplification laws.
The present work mainly researches on the fast fluidization in the MiFB using computational fluid dynamics (CFD) and the discrete element method (DEM). The CFD-DEM simulation [5,6,7,8] has been considered one of the most sensitive ways of studying the MiFB. Due to the very narrow bed diameter of an MiFB, one may have no choice but to use A-Type fine particles in the simulations. As is known, the A-Type fine particle is one of the most fluidizable material types and is best suitable for the fast fluidization operation. However, there are almost no simulation results of the fine particles’ fast fluidization to be referred to. In fact, the CFD-DEM simulations of fine particles in the MaFB have not been carried out for the time being, let alone in the MiFB. Furthermore, to design accompanying beds and separators while retaining the advantages of the MiFB has certain theoretical and technical difficulties, or there may be other unknown factors. Experimental research of the fast fluidization in the MiFB has not been carried out, either.
Fortunately, there still exist three kinds of references. Firstly, there has been simulation and experimental research on the micro fluidized bed of Type-A particles under conventional operations. Yu and Xu [9] once simulated and analyzed different traditional fluidization types of particles with their diameter being 30 μm, which is the finest particle size ever used in DEM simulations. Kuipers’ group modeled the fluidization of fine particles [10] and then proposed the concept of MiFB in another experimental and simulation research [11]. In the last few years, Guo et al. [12] studied the solid-like and fluid-like states in the homogeneous fluidization regime. Li et al. [13] also presented a study on a detailed analysis of bed hydrodynamics for polydisperse gas-solid flow. For more details on this, see [14,15,16,17,18]. These references about traditional MiFBs, such as fixed, homogeneous, bubbling, slugging and turbulent beds, provided preliminary insights into the micro size effect on the fine particles’ fluidization. Furthermore, some textbooks about fluidization engineering and the gas-solid two-phase flow [1,2,3] can provide the general theories of the traditional fluidized bed and the non-conventional fast fluidized bed. Moreover, there have been laboratory scale MaFB correlated results for fast fluidization, which formally do not depend on the size of the equipment and will be further referred to in the results and discussion section.
The reaction vessel of a fast fluidized bed is usually a riser with a relatively large aspect ratio. The size of a micro fluidized bed, especially the bed diameter, is very small and in the order of millimeters. Under conditions where the operating gas velocity is not large enough, the size of this container can easily promote slugging. Sometimes, even if there are obvious signs of rapid fluidization in an MiFB, such as clustering, backmixing, and the continuous transport of particles, slugging is inevitable. In order to deeply analyze the impact of micro size on fast fluidization, the present work simulates the fast fluidization with and without slugging, by using the CFD-DEM.
This article presents the two models that were used in the simulations in the following section. A total of three simulation cases employing both models show that the particle clusters, the particle backmixing, the outlet solid flux, and the radial porosity reveal different characteristics. According to these characteristics, the simulated fast fluidization regimes are divided into two types: the slugging fast fluidization and the non-slugging fast fluidization. It seems that the micro size effect is significantly weakened in the non-slugging fluidized regime.

2. Models

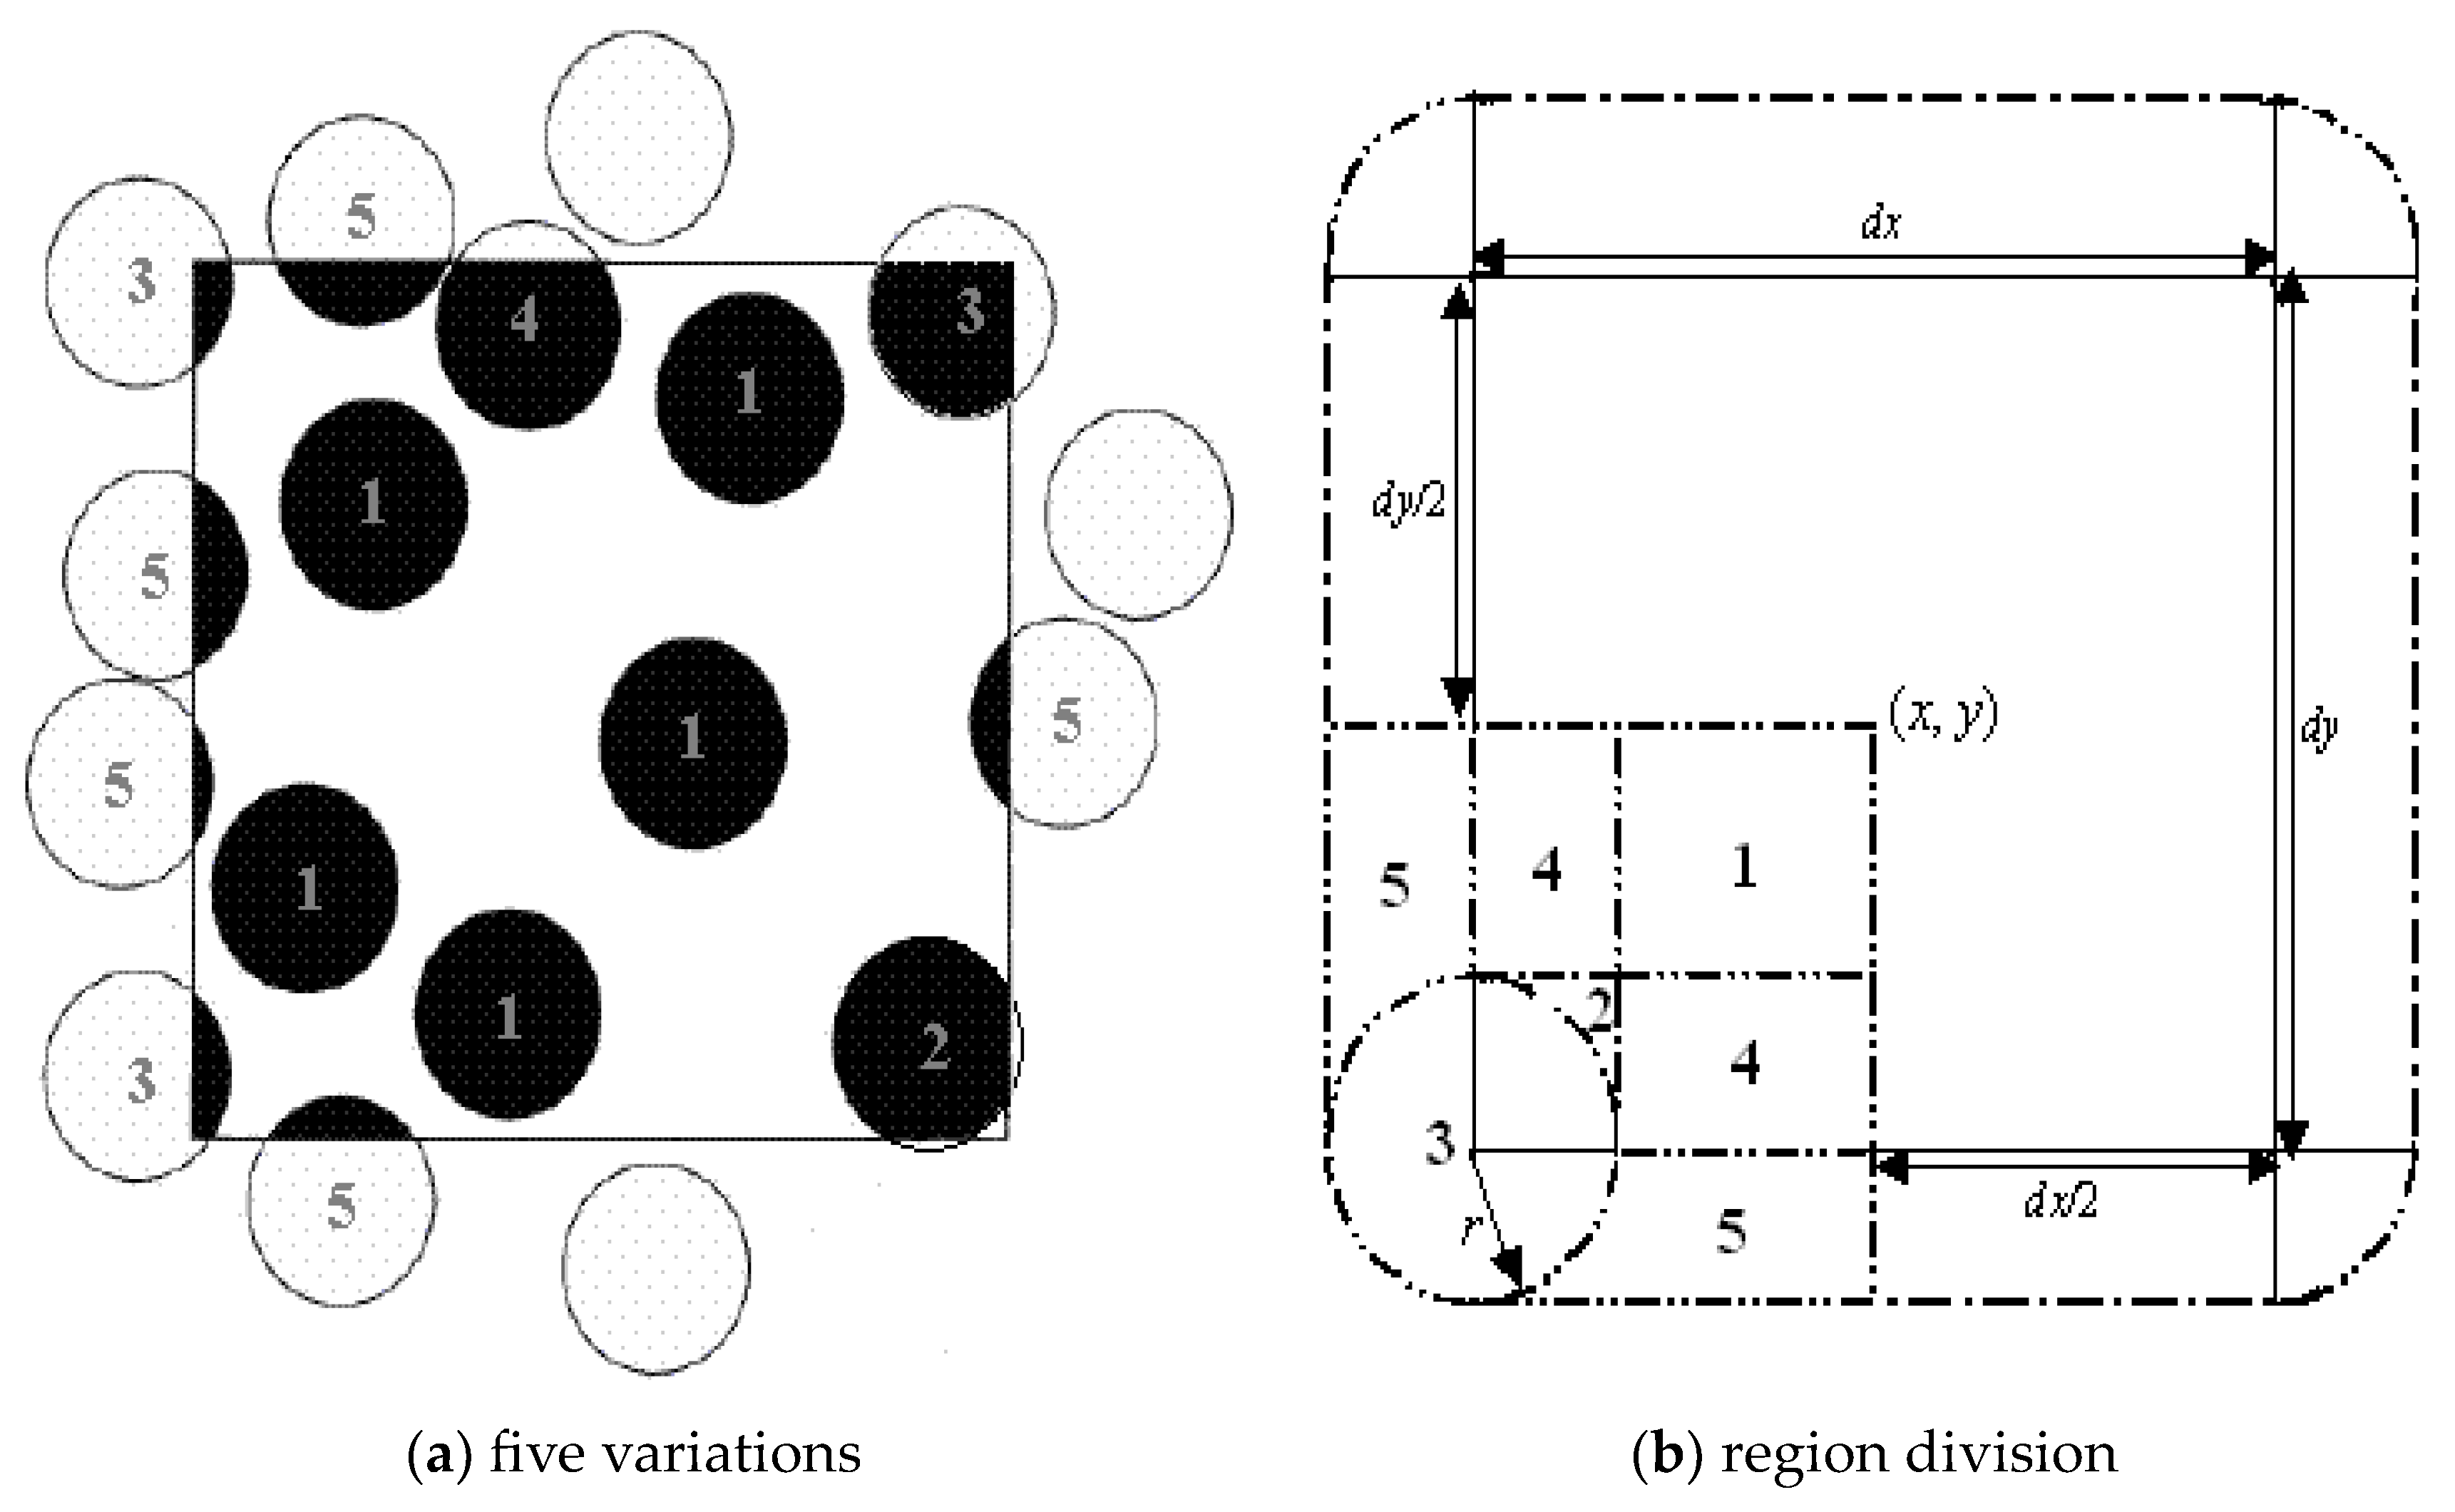
2.1. Precise Area Fraction Model

For the two-dimensional CFD-DEM simulation of the particle system, one should use the two-dimensional porosity ε 2 D to calculate the three-dimensional porosity ε 3 D . It is strongly suggested that the precise two-dimensional porosity be used to ensure sufficient accuracy. The precise area fraction (PAF) model is proposed to calculate the precise two-dimensional porosity.
Let ε 2 p be the solid area fraction, f i be the grid area fraction occupied by particle i , and N be the total number of particles overlapping with the grid. The solid area fraction ε 2 D can be expressed as
ε 2 D = 1 ε 2 p = 1 k = 1 N f i
To obtain the precise expression of f i , a detailed check of the overlap should be made as in the following.
Firstly, the variations and the region division of the particle-grid overlap are given in Figure 1 [19]. Here, let us take just the particle centroid X , Y to be closest to the bottom-left grid vertex x 1 , y 1 . Moreover, let the particle redius be R . Secondly, the overlap variation index and the corresponding formula are determined according to the location relation between the particle centroid and the grid. For example, if the location relation satisfies x 1 R < X < x , y 1 R < Y < y , and X x 1 2 + Y y 1 2 < R , it corresponds to Variation 2. Then, f i is calculated as
f i = 1 d x d y π R 2 R 2 arccos X x 1 R R 2 arccos Y y 1 R + 1 2 R 2 sin ( 2 arccos X x 1 R ) + 1 2 R 2 sin ( 2 arccos Y y 1 R )
Similarly, when the particle centroid is closest to the other vertexes of the grid, the expressions for f i in various overlapping variations can all be easily derived. Take f i into Equation (1) to calculate the precise ε 2 D ; thus, the PAF model is constructed.

2.2. Drag Model

Most of the researchers calculate drag on the particle according to the particle’s drag correlation in the unbounded uniform flow field. Let d p be the particle diameter, C d i be the apparent drag coefficient of the particle group around particle i , ρ g be the gas density, u i be the local gas velocity, v i be the local gas velocity, and ε i be the local porosity. Then, the drag on particle i in the particle group is calculated as
F d i = 1 8 π d p C d i ρ g | u i v i | ( u i v i ) ε i 2
According to Wen and Yu’ s well-known drag correlation [20] and the single-particle drag coefficient proposed by Schiller and Naumann’s drag formula of a single particle [21],
C d i = 24 μ g ε i 3.7 ρ g | u g v p | d p + 3.6 μ g 0.313 ε i 4.387 ( ρ g | u g v p | d p ) 0.313
According to Equations (3) and (4), both the drag and the drag coefficient are sensitive to the local porosity. Borrowed from the nuclear approximation idea of smooth particle dynamics and the local porosity formula of Xu et al. [22], a circumstance-dependent way of calculating ε i can be constructed.
Let N i be the number of particles in the neighborhood, h be the characteristic radius or the smooth length of the neighboring area, r i r j be the distance between particle i and j , and W ( d , h ) be the quintic normalized kernel function in SPH. The present drag model calculates ε i as
ε i = 1 λ j = 1 N i W ( r i r j , h ) 1 6 π d p 2
where λ is the introduced multiplier parameter that was not included in Xu et al.’s formula. Let ε ts be the total solid volume fraction of the bed and N be the total number of real particles that are initially randomly distributed throughout the bed. The introduced multiplier parameter λ can be determined in the initial state of randomly homogeneity as
i = 1 N j = 1 N i W ( r i r j , h ) λ 6 N π d p 2 = ε ts
By combining the above Formulas (3)–(6), the present drag model, which is called the particle circumstance-dependent drag (PCDD) model, is constructed.

3. Simulation Method

The gas motion is described by the well-known Navier-Stokes equations. Let ε g be the grid mean porosity, p be the pressure, u be the gas velocity, t be the time, τ g be the stress tensor, and S p be the momentum exchange source term [23]. The Navier-Stokes equations are expressed using the following two equations:
( ε g ρ g ) t + ( ε g ρ g u ) = 0
( ε g ρ g u ) t + ( ε g ρ g u u ) = ε g p S p ( ε g τ g ) + ε g ρ g g
So far as two-dimensional simulation is concerned, the grid mean porosity should be transformed from two dimensions to three dimensions. Firstly, the PAF model is used to calculate the two-dimensional porosity and the following formula [6] is used to convert ε 2 D to the three-dimensional porosity ε 3 D as follows:
ε 3 D = 1 2 π 3 ( 1 ε 2 D ) 3 2
As the Navier-Stokes equations are complex differential ones, there is currently no analytical solution available. Therefore, the CFD method should be used to solve them. After setting the boundary conditions of the consistent velocity inlet, the pressure outlet, and the impenetrable wall, the Navier-Stokes equations can be discretized using the well-known finite volume method. Further, the obtained algebraic equations can be solved by the SIMPLER method [24].
The particle motion is resolved into translation and rotation. Let F c i be the contact force, F v i be the van der Waals force, V p be the volume of the particle, and p i be the local pressure. The translated motion of particle is calculated using
ρ p V i d v i d t = ρ p V p g + F d i + F v i + F c i V p Δ p i
The drag force F d i is calculated by use of the PCDD model. When particle i is in contact with the other particles or the wall, the well-known soft-sphere model is applied to calculate the contact force between the particles and the wall. If the particles are not in contact, the van der Waals force between them should be considered due to the non-negligible adhesion force between the fine particles. Let H a be the Hamaker constant, e i j be the unit vector from particle i to particle j , H 0 be the cutoff distance, and d i j be the distance between particle i and particle j . The van der Waals force of particle j applied to particle i is calculated as
F v i j = H a d p e i j 24 max 2 { d i j d p , H 0 }
If particle j just represents the bed wall, the resulting viscous force is F v i w = 2 F v i j .
Let ω i be the particle angular velocity, I be the inertia of the particle, and T c i be the torque of the collision. The particle motion of rotation is calculated as
I d ω i d t = T c i
Three numerical cases are carried out on a micro riser, the size of which is D × L = 2.5 mm × 40 mm. The grid number used for the spatial discretization is 10 × 160. For all cases, there are initially a total of 8230 real particles randomly set in the riser. Then, λ is determined to be 0.948 according to Equation (6). For case 1, the real particle number in the riser is kept fixed. That is, particles are always import-and-export balanced. The inlet gas velocity is 1.7 m/s for this case. The maximal particle number used is 11,452 accounting for the virtual particles. For cases 2 and 3, the real particles increase once per CFD time step until the real number gets up to 9600. Then, the import-and-export balance condition is used as the following particle feed way. The maximal total number of particles is 13,516 and 12,807 for cases 2 and 3, accounting for the virtual particles. The inlet gas velocity is 2.1 m/s for case 2 while it is 3.0 for case 3. Other fixed parameters are given in Table 1.

4. Results and Discussion
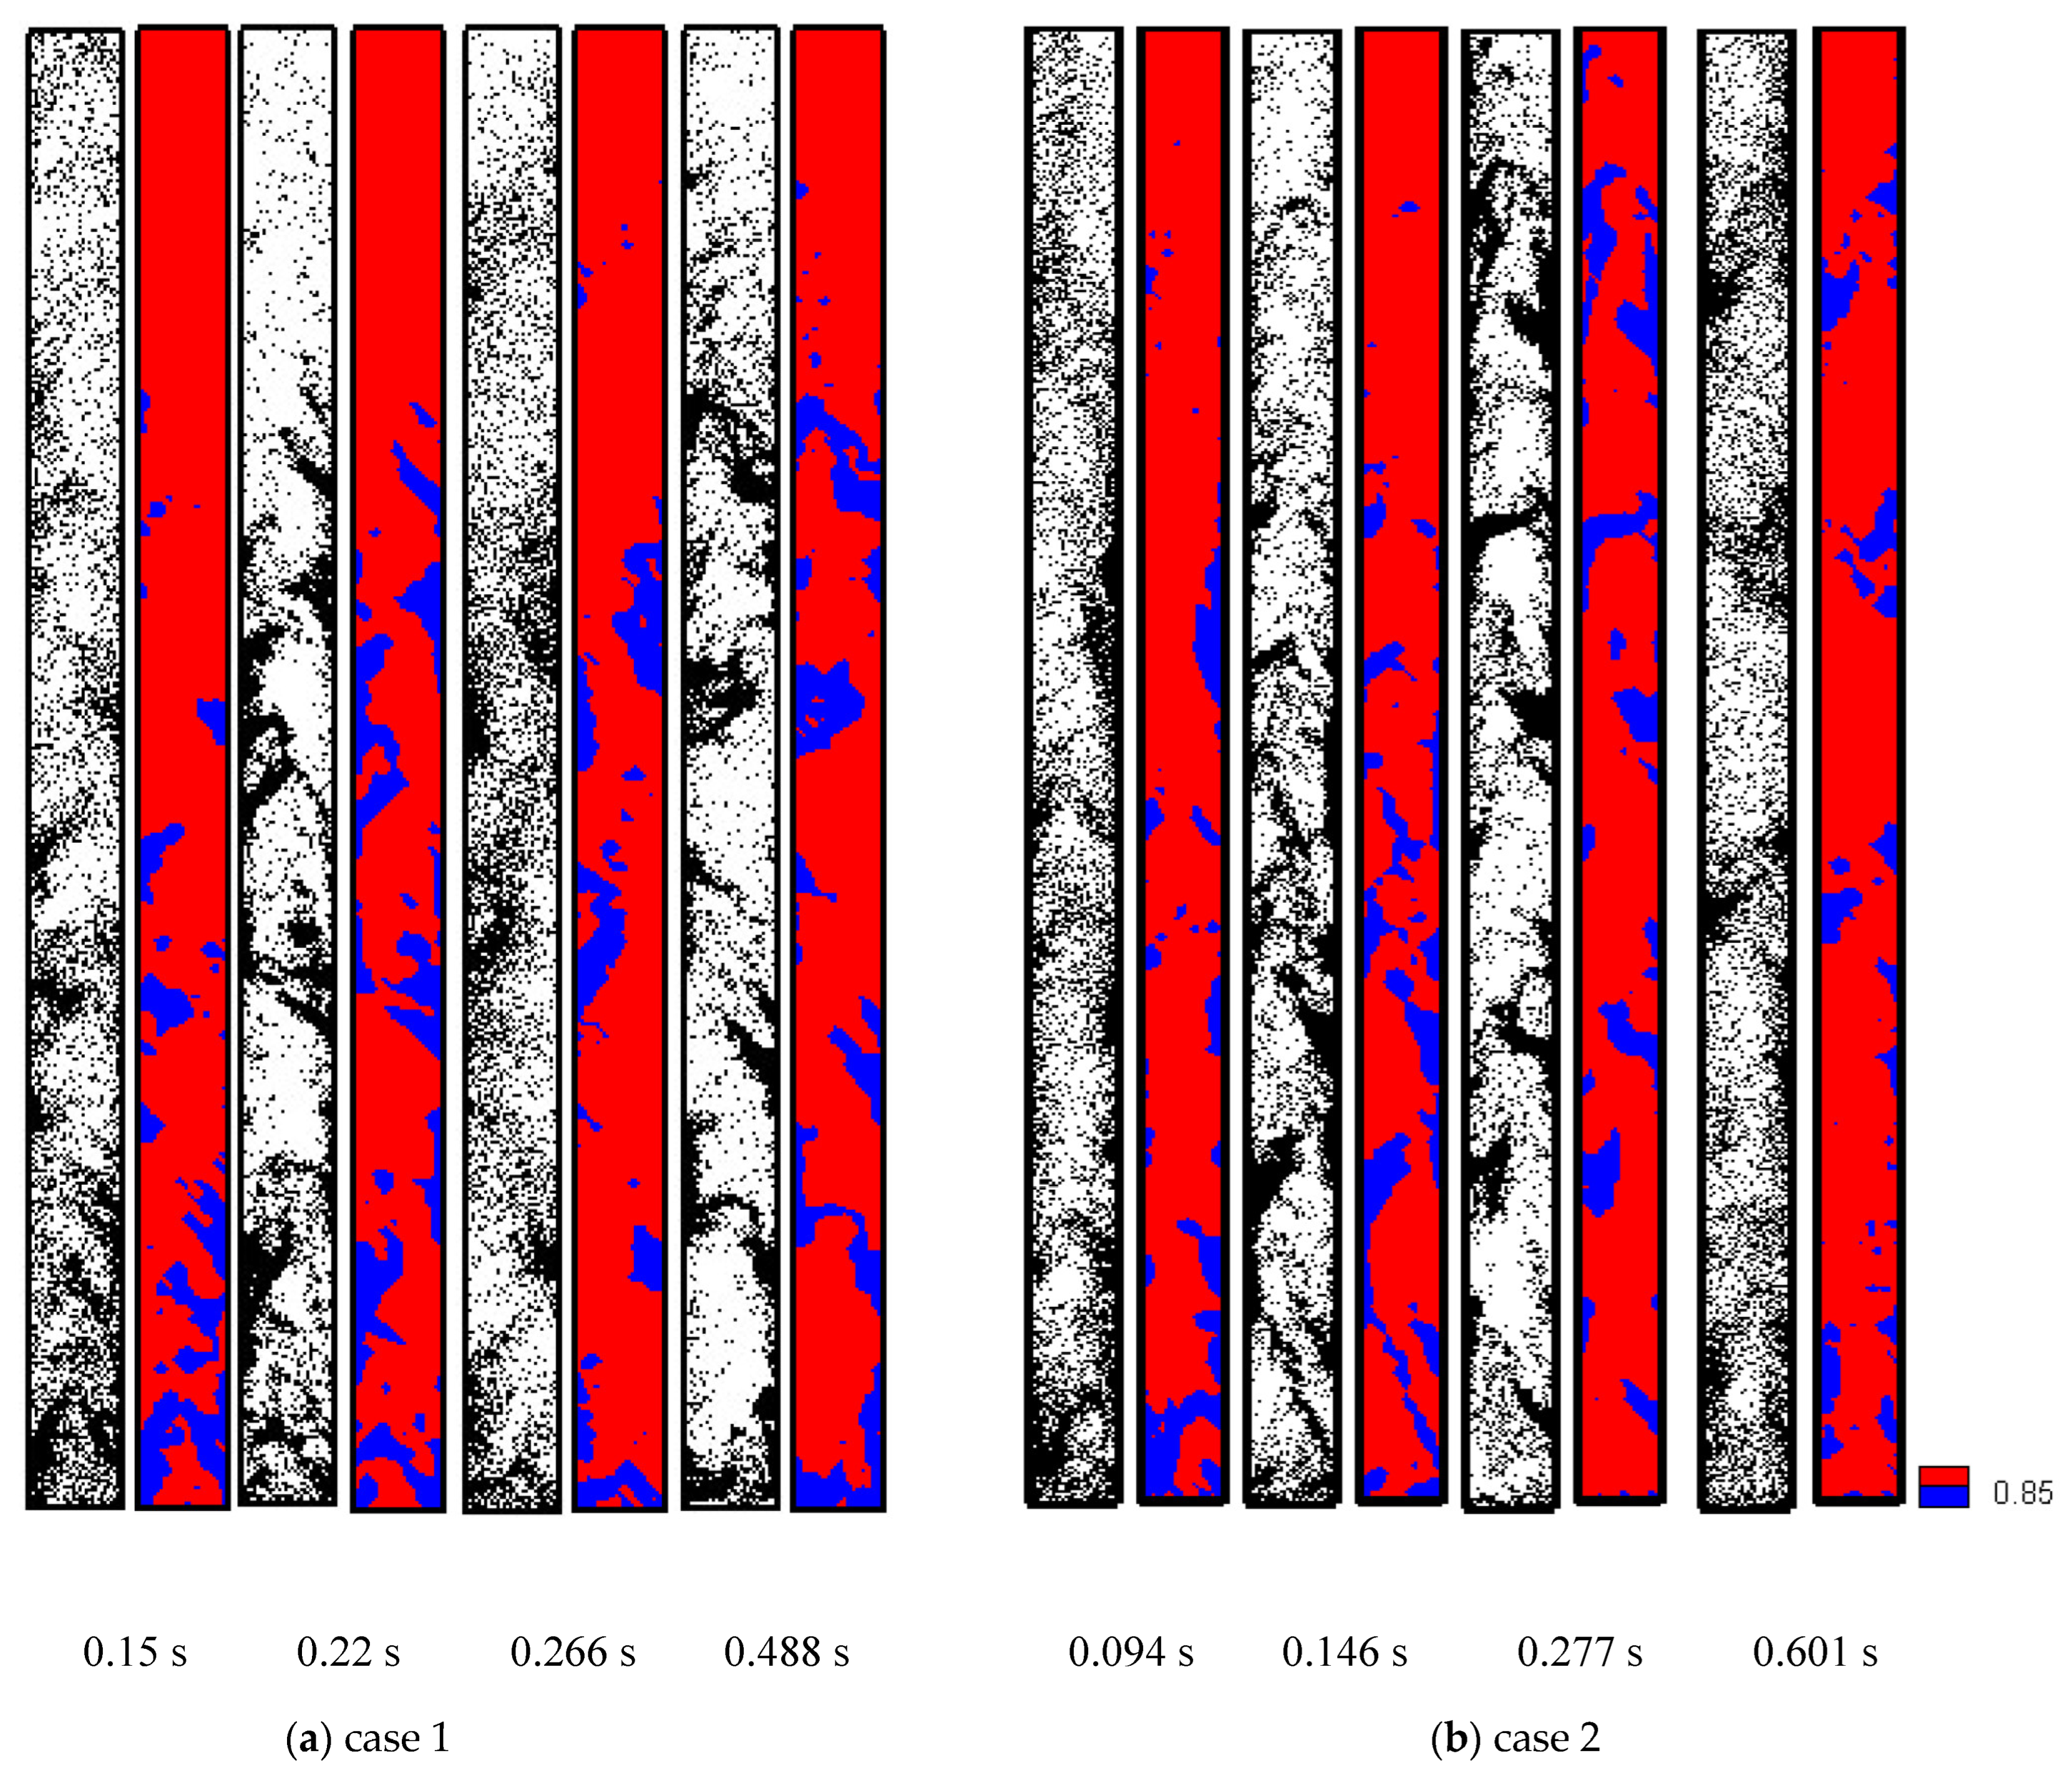
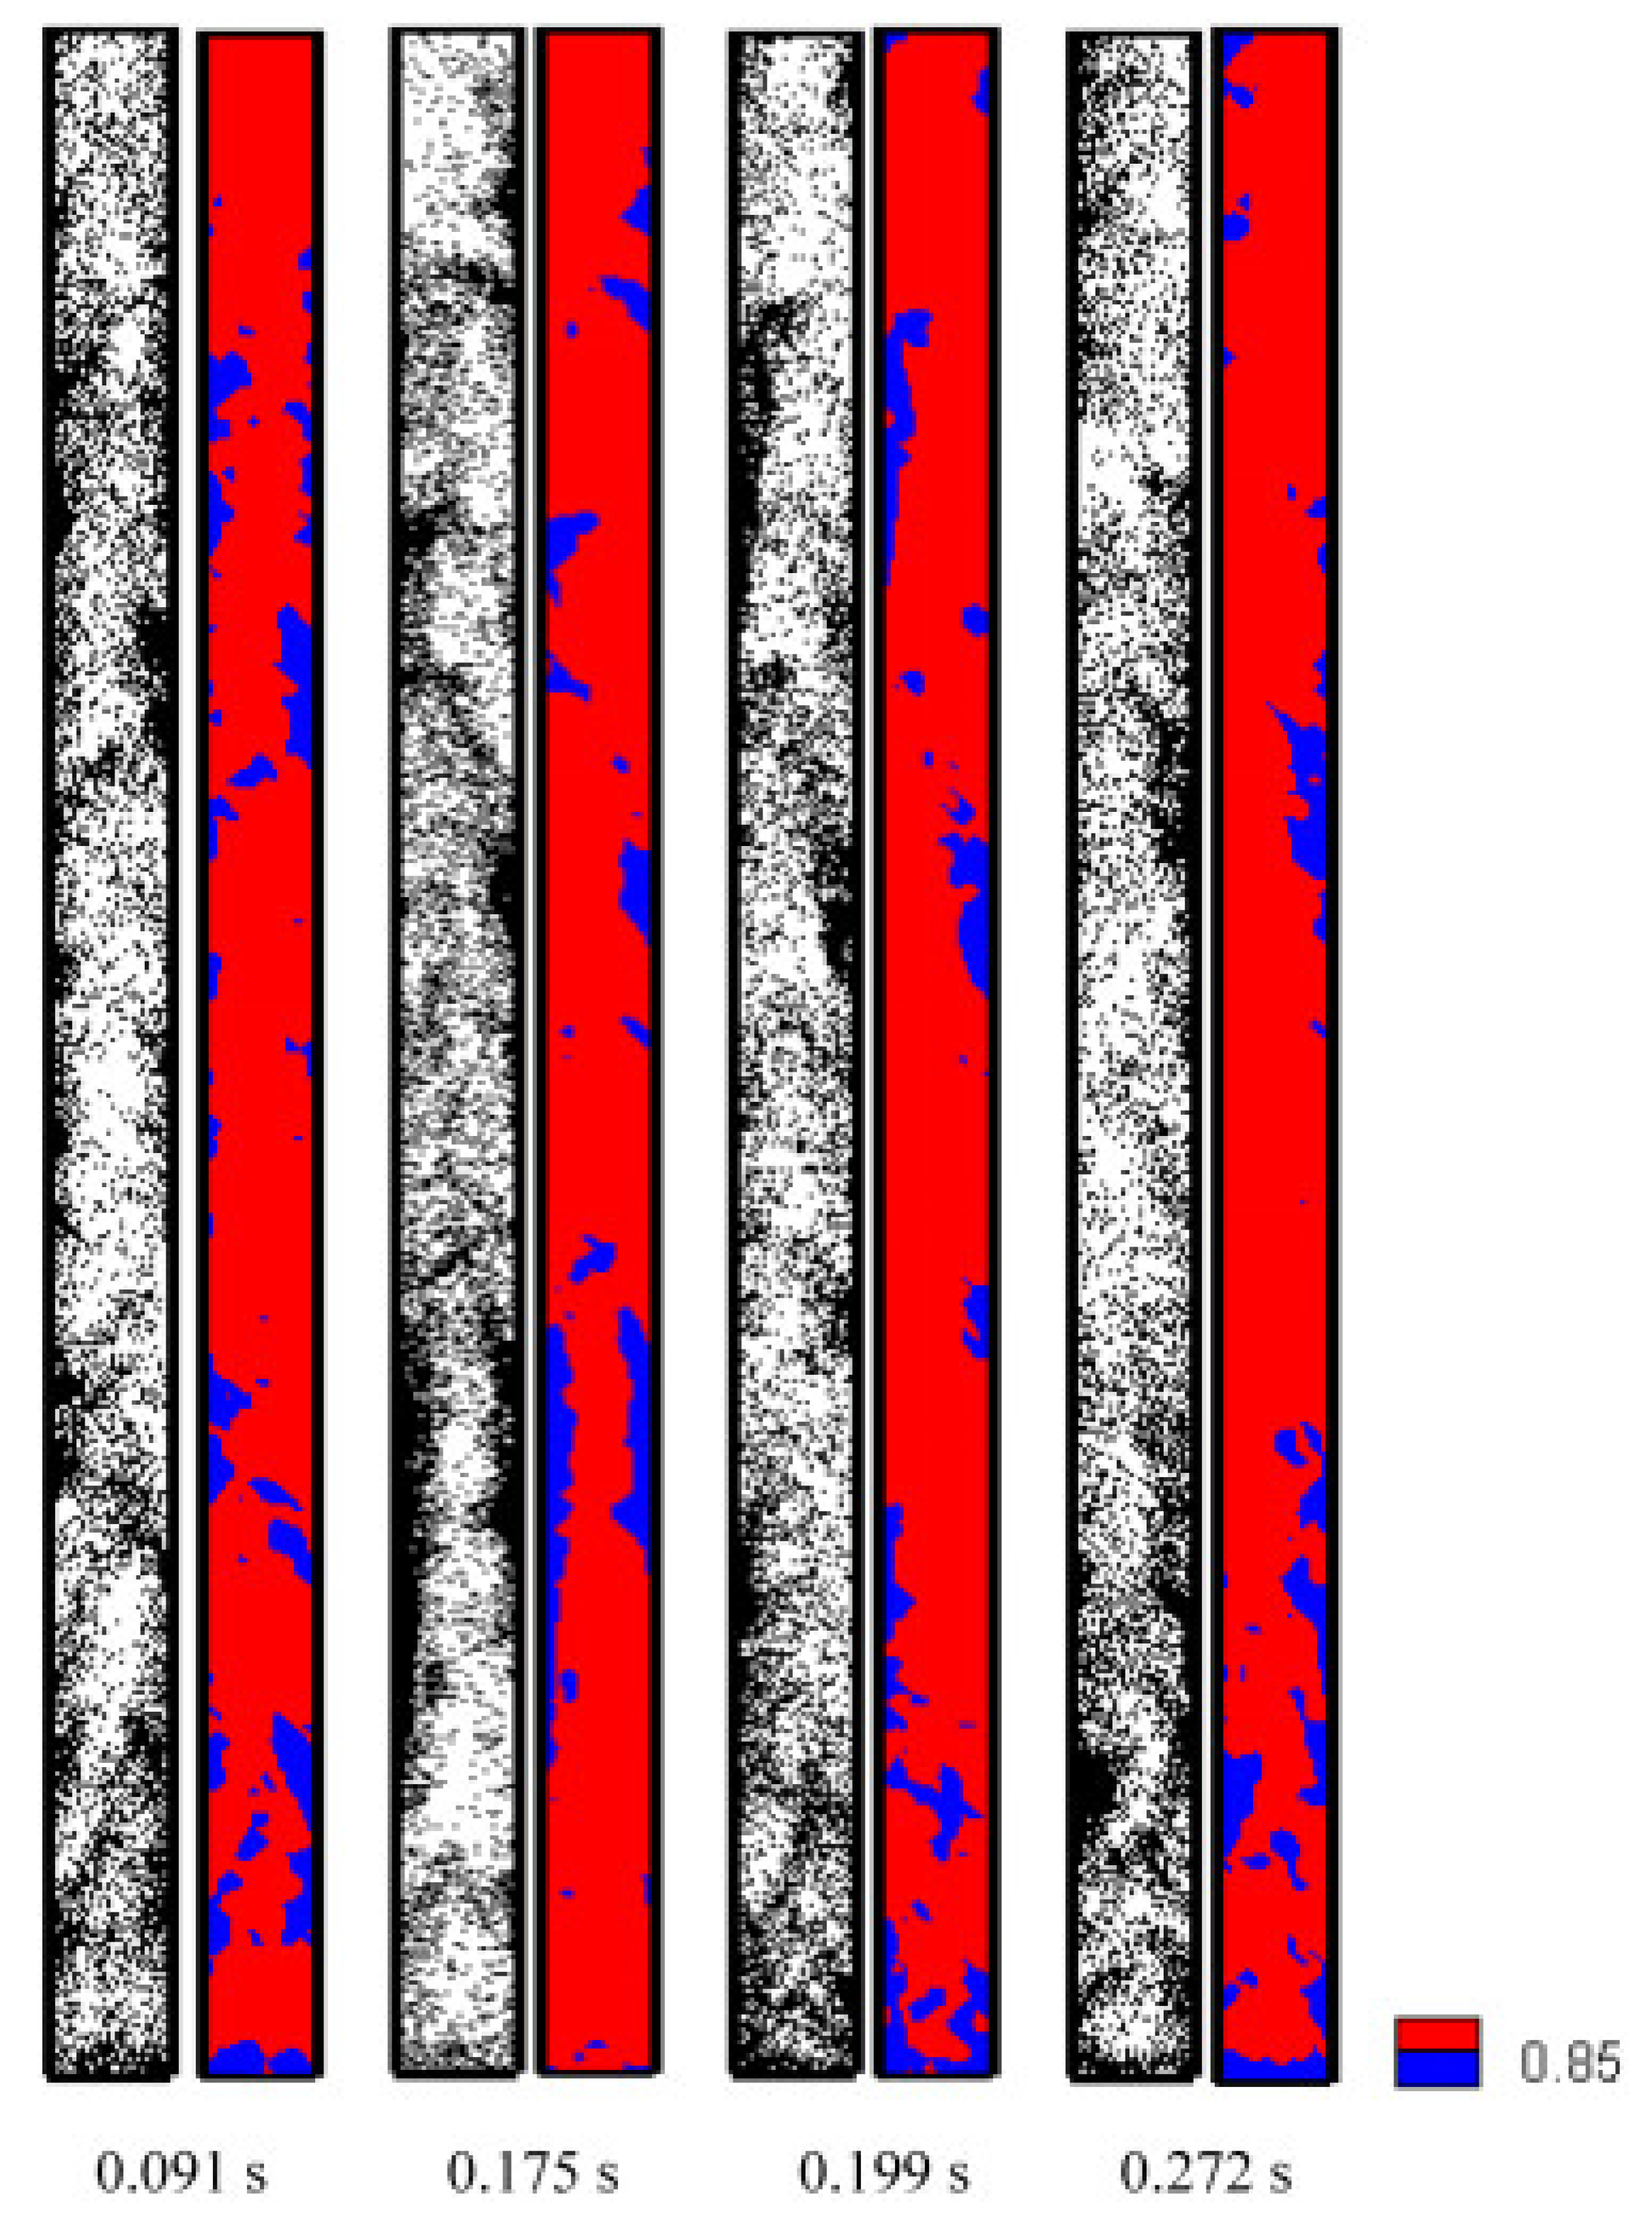
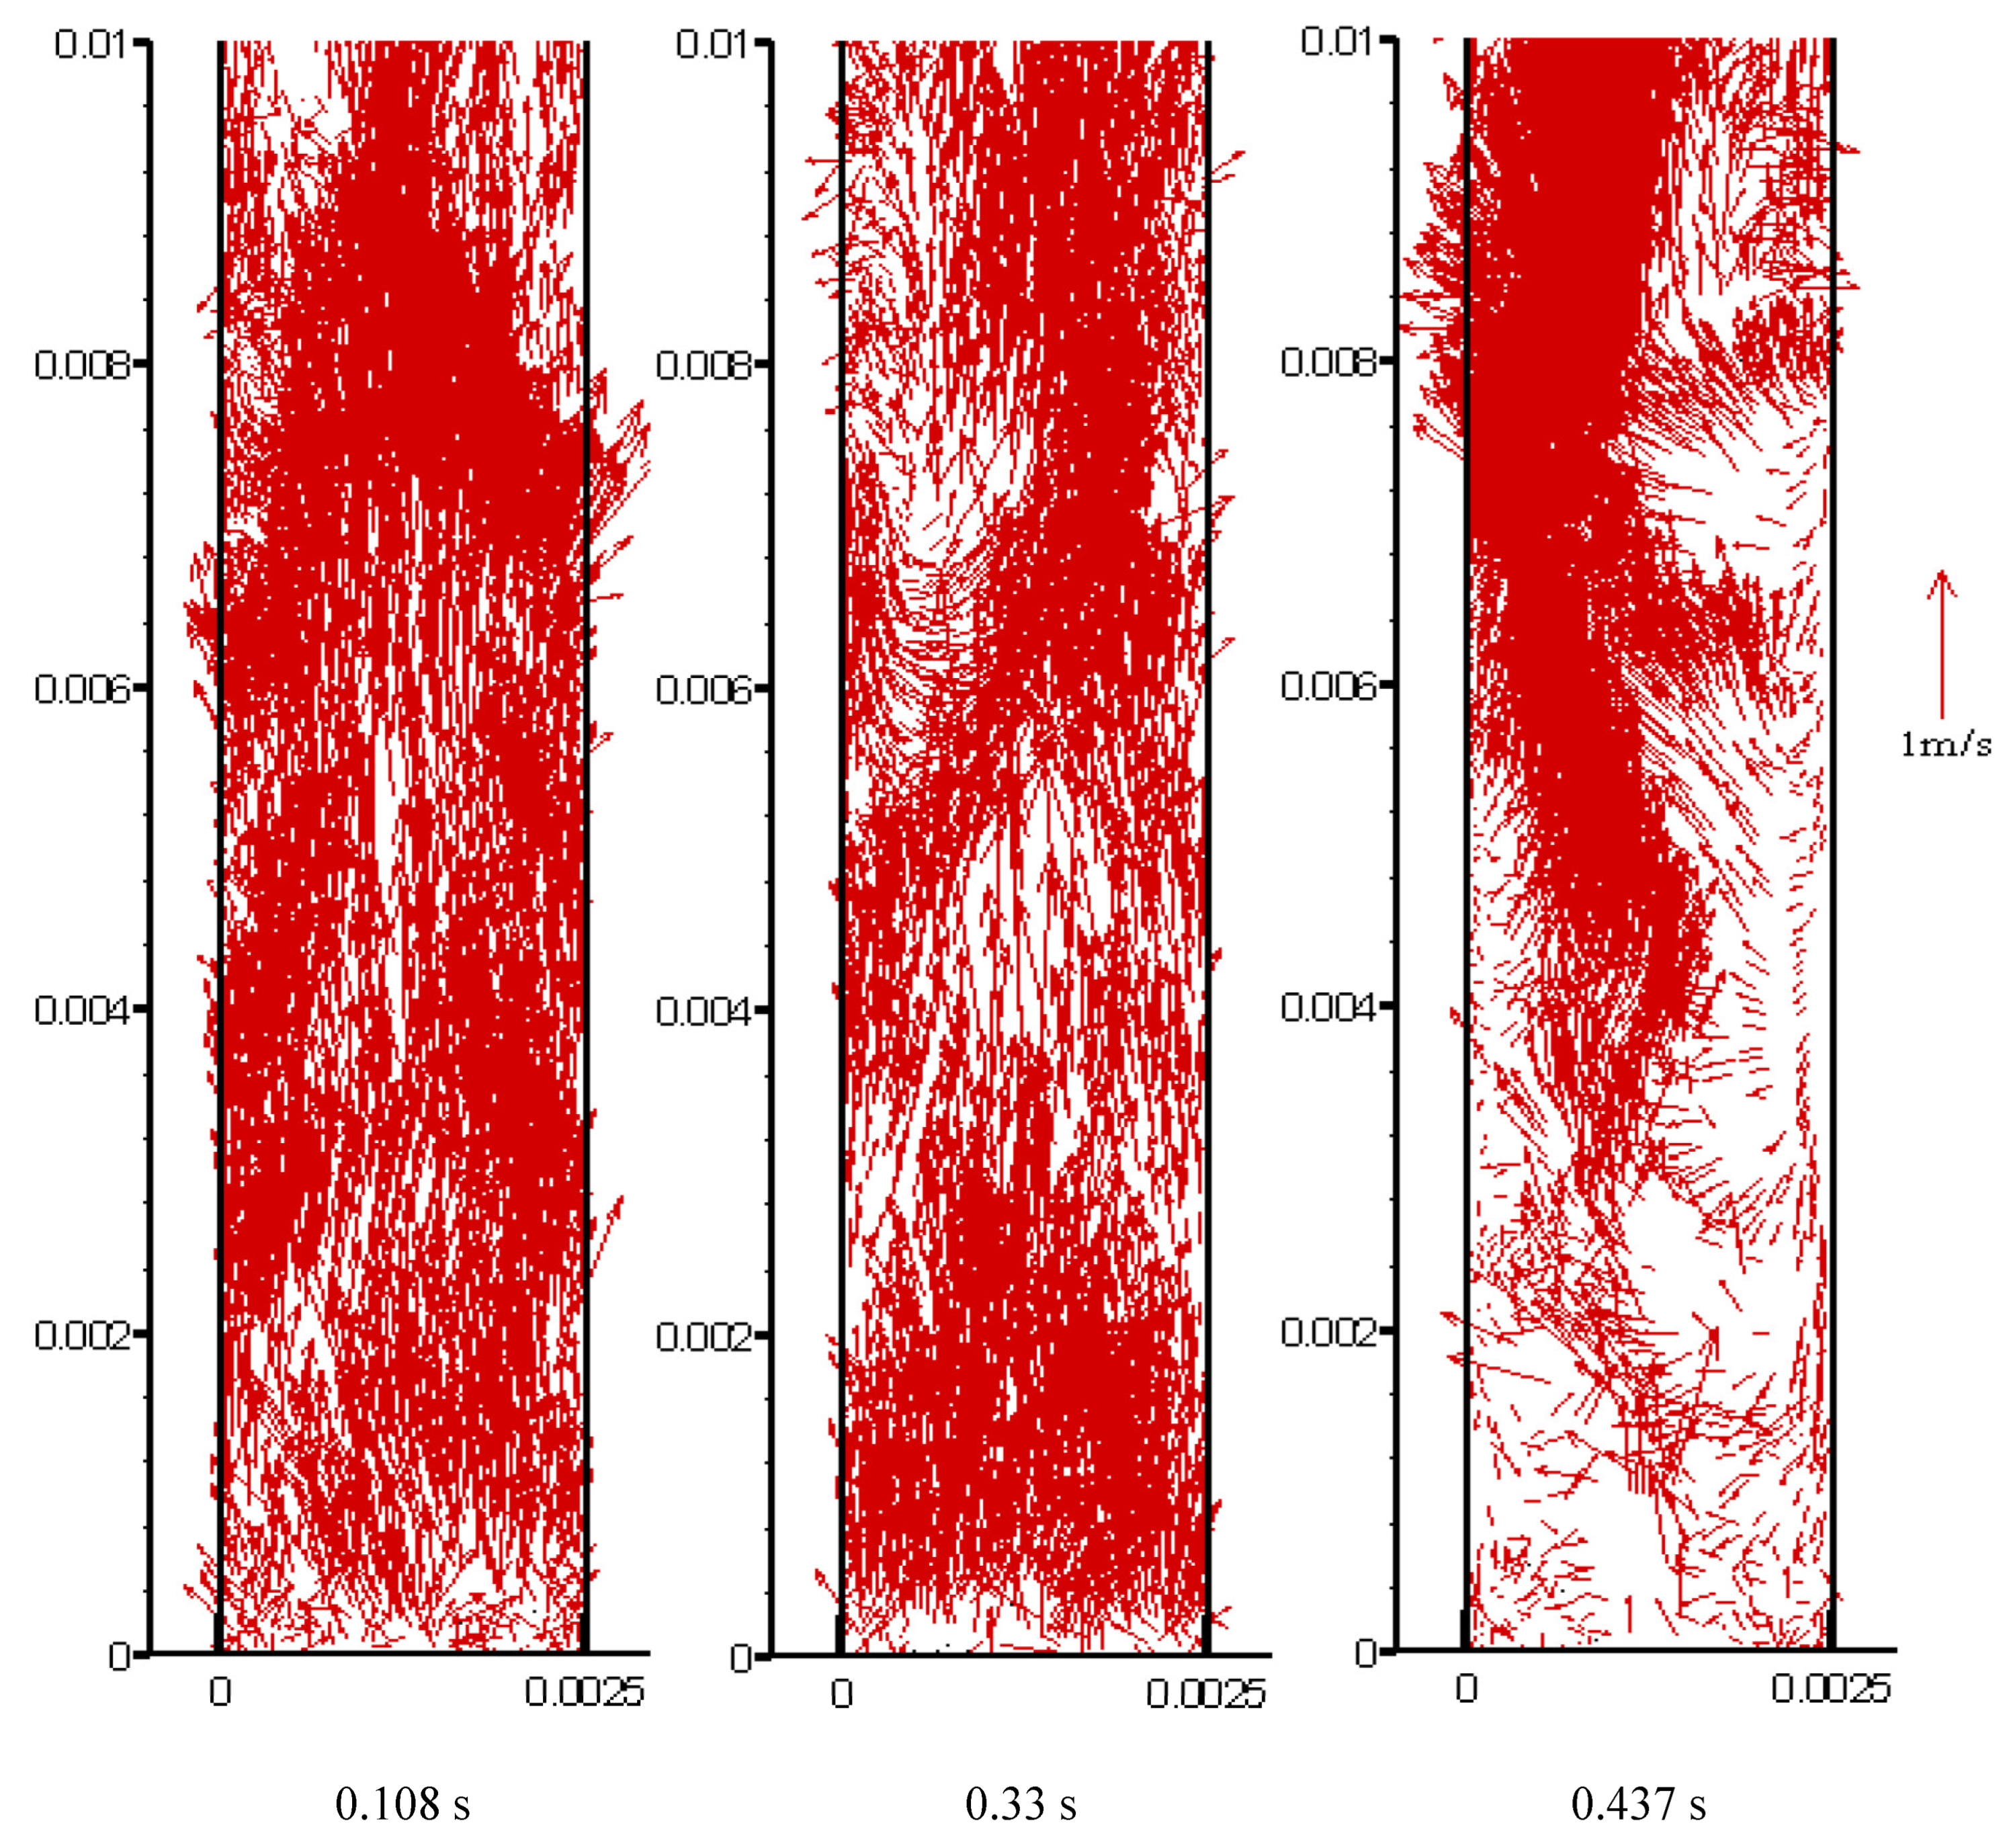
4.1. Clustering

Figure 2 shows the instantaneous distribution of the particle location and the mean porosity for cases 1 and 2. The critical value of porosity 0.85 [25] is used as a criterion to determinate dense or dilute phases in the riser. Once the radial size of a dense cluster is greater than two-thirds of the bed diameter, it is determined to be a particle slug. When clusters turn large, they tend to adhere closely to the wall, which is consistent with the results in [26]. It is noticed that for both cases, there consistently coexist the structures of the dilute phase and the dense phase or clusters. The dilute phase is continuous while the dense phase is dispersed, which is completely opposite to the observations in the bubbling fluidization. Sometimes, the clusters turn into strands stretching across the whole bed diameter, which look like particle plugs in the slugging fluidization. The figure also shows that the clusters almost form and break at the same time. When the clusters tend to form, there are more of them existing in the bed. When the clusters tend to break, the number is smaller. The temporal synchronization of the clusters’ dynamic behaviors is an interesting phenomenon that has not been reported in the MaFB research. Overall, since the DEM achieves single particle tracking, a complete description of the heterogeneous structures within any volume in the flow field can be obtained by tracking the details of the interaction between each particle and the fluid.
Figure 3 gives the instantaneous distribution of the particle location and the mean porosity for the non-slugging case 3. It shows that the cluster number and radial size both decrease. There is no sign of the formation of particle and gas slugs. Although there are dense and dilute phases in the bed, the boundary between them is always blurred. Due to the high operating gas velocity, the interaction between gas particles and particle particles is intensified, resulting in a higher frequency of particle cluster formation and fragmentation. In addition to the changes in the size and morphology of particle clusters, there are also particle groups with varying but not too low concentrations in the dilute phase. It can also be noticed that the dispersion behavior of individual particles is extremely rare. Generally, the global heterogeneity of the non-slugging fast fluidization in the bed weakens compared to that of the slugging fast fluidization.

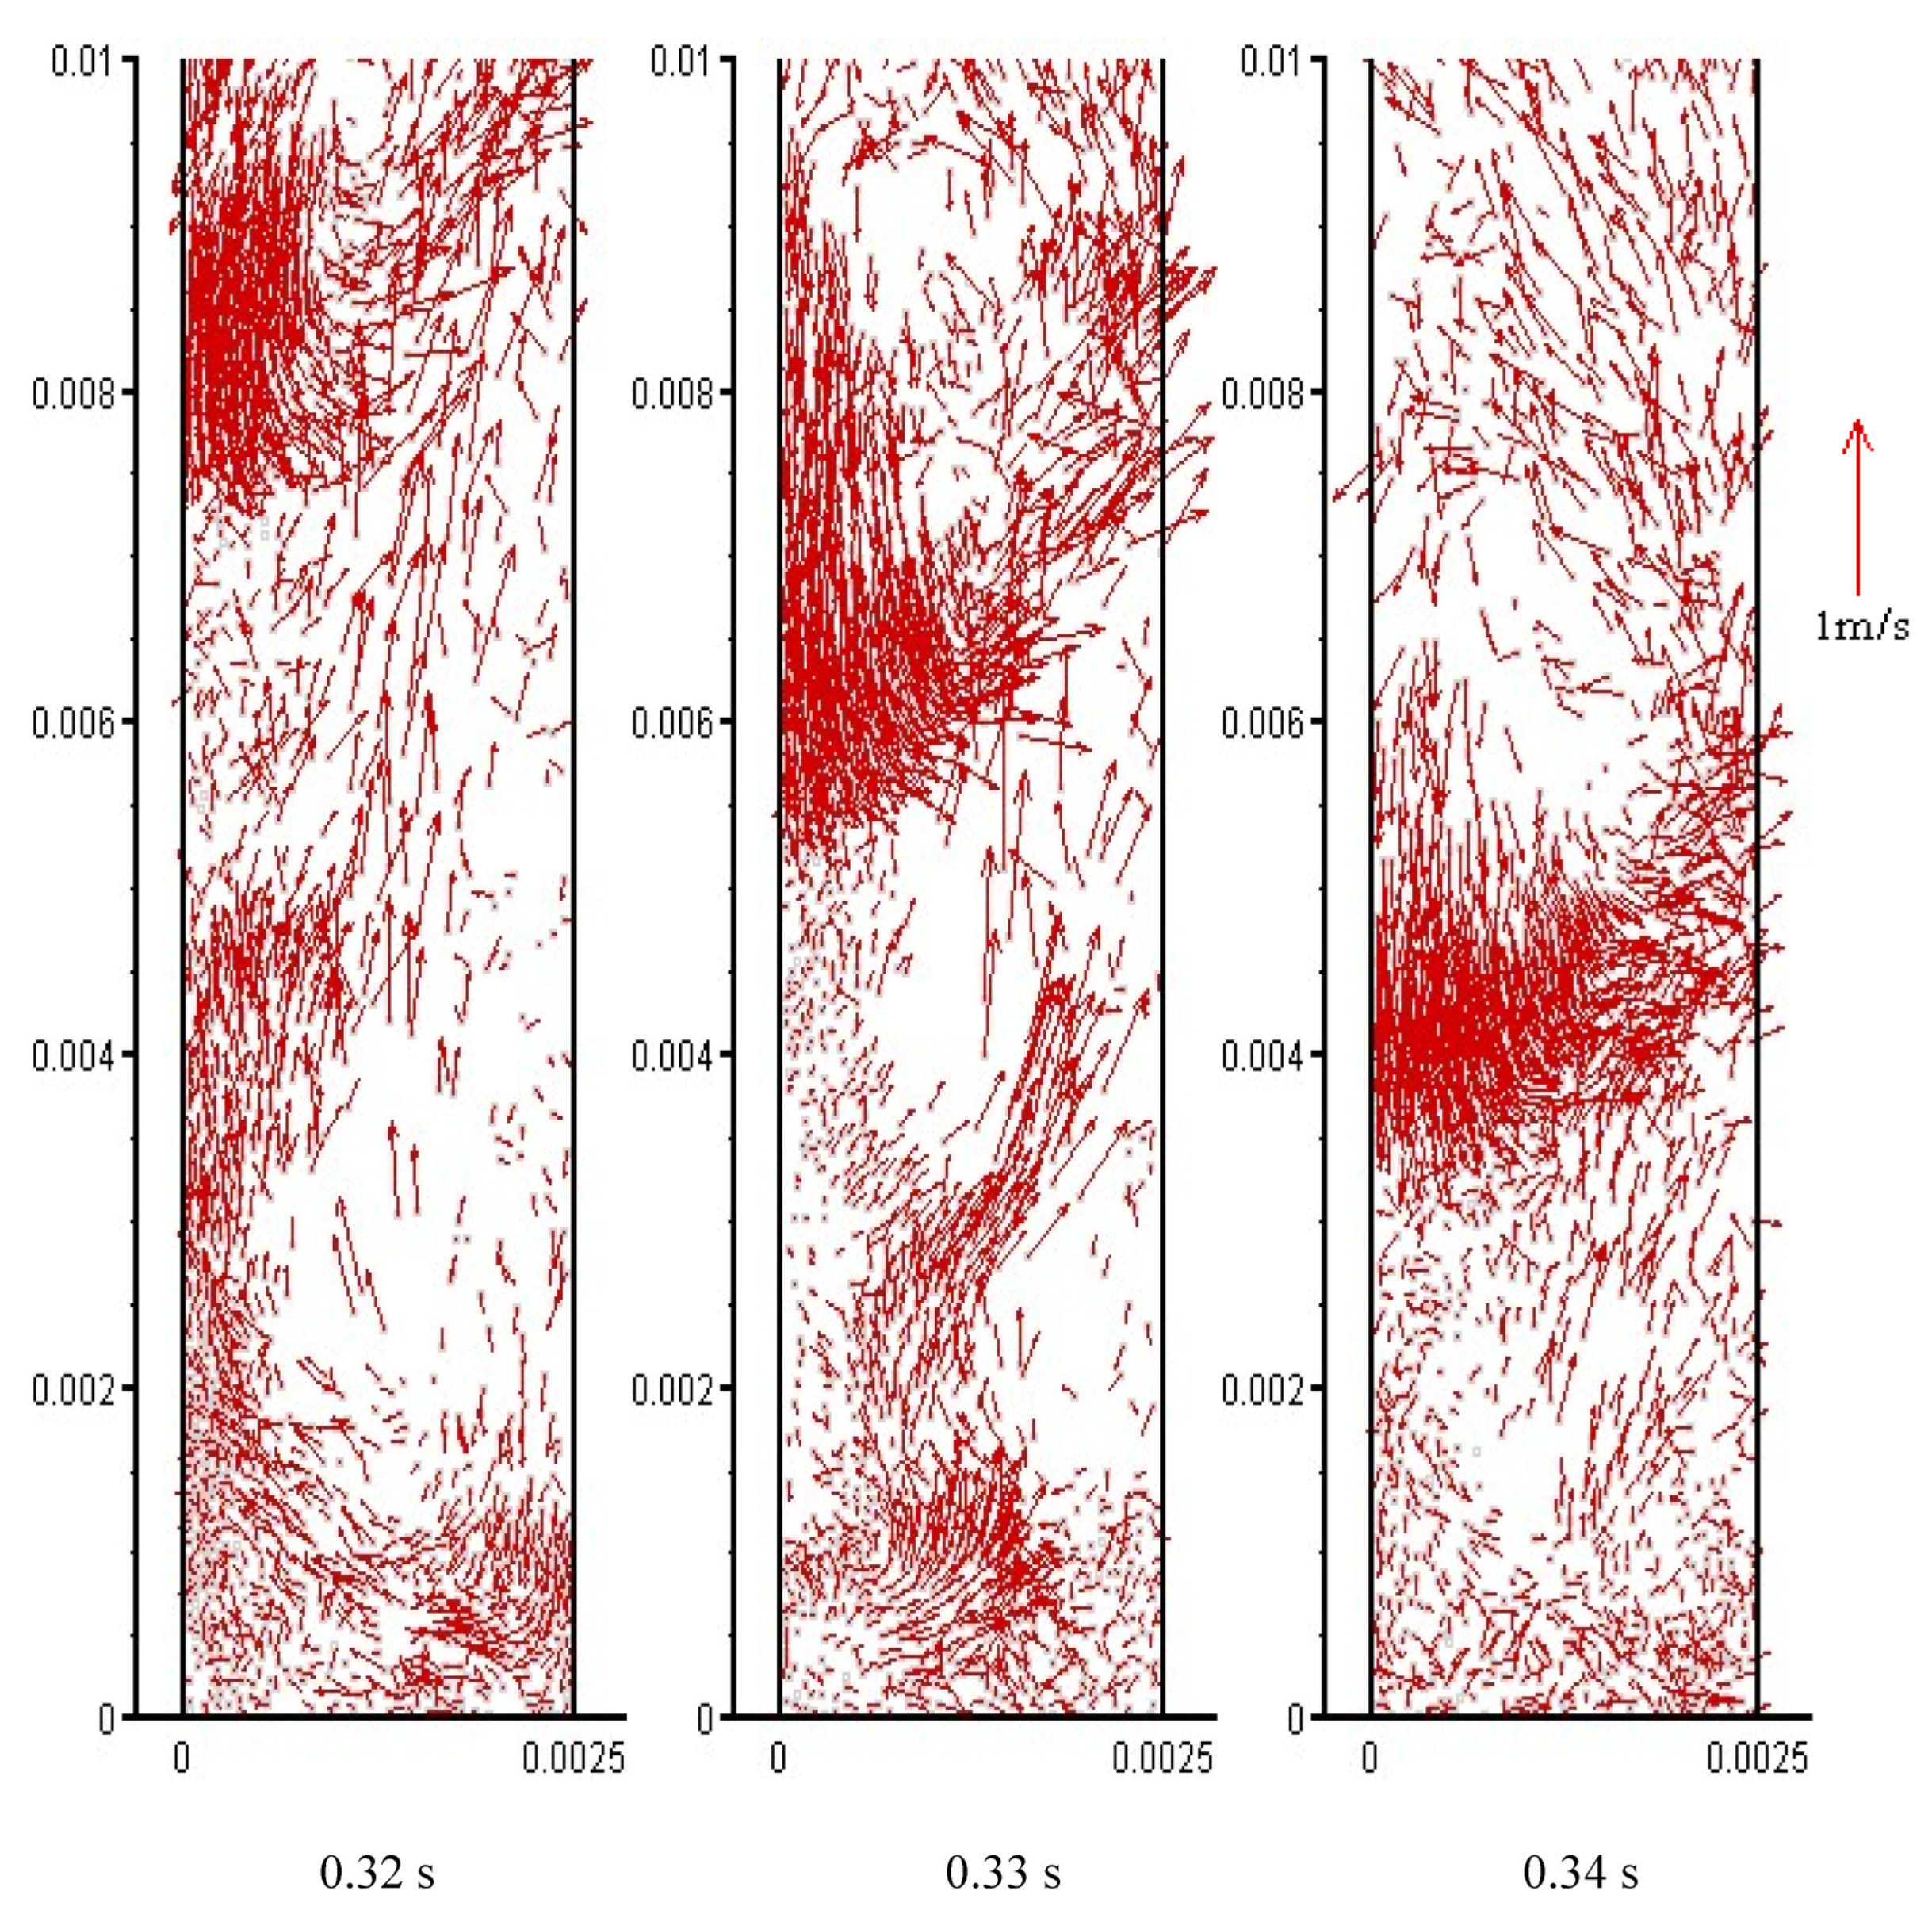
4.2. Particle Backmixing

Figure 4 gives the particle velocity below 0.01 m of the bed in slugging case 2. Particle backmixing has much to do with the residence time and the mixing behavior of solids, both of which are critical for the design, operation and scale-up of CFB reactors [2]. According to [27], the backmixing degree decreased along the height of the riser, so the selection of lower part of the riser is suitable for observing the backmixing phenomenon. It can be seen from the figure that particles backmix to a serious degree. Some particles aggregate to form a large cluster near the wall and most of them move downwards along the wall. Inside the large cluster, the axial particle velocity is relatively large compared to the radial velocity. There is a strong effect of the tail vortex so that the trailing particles can follow down with the downward cluster. Meanwhile, the head-on particles can also be captured by the cluster so that it can continuously grow larger, especially in the radial size. Eventually, the cluster even occupies the entire bed diameter like a plug in the slugging fluidized bed. However, the plug-like cluster is just a flash in the pan. Once the largest cluster forms and blocks the bed layer, it starts to disintegrate due to the gas penetration. As the gas velocity is fast, the bed layer will neither collapse nor continue to be choked by the plug-like cluster.
Figure 5 gives the particle velocity below 0.01 m of the bed in the non-slugging case 3. It shows that the particle velocity turns high with the increase in gas velocity. Although most of the particles keep the upward conveying state, it can be observed that a small amount of particle backmix. Some scholars consider the suspension and transportation of particles, the continuity of gas, and the dispersion of particles or particle clusters as criteria for fast fluidization. However, Jin et al. argued that in fast fluidization, there should be backmixing in the bed [2]. The present simulations seem to support Jin et al.’s viewpoints. Under high gas velocity conditions, even if the continuous backmixing of particle clusters is no longer captured, it is still possible to capture a small amount of the downward motion of the particles at any time and position in the flow field.

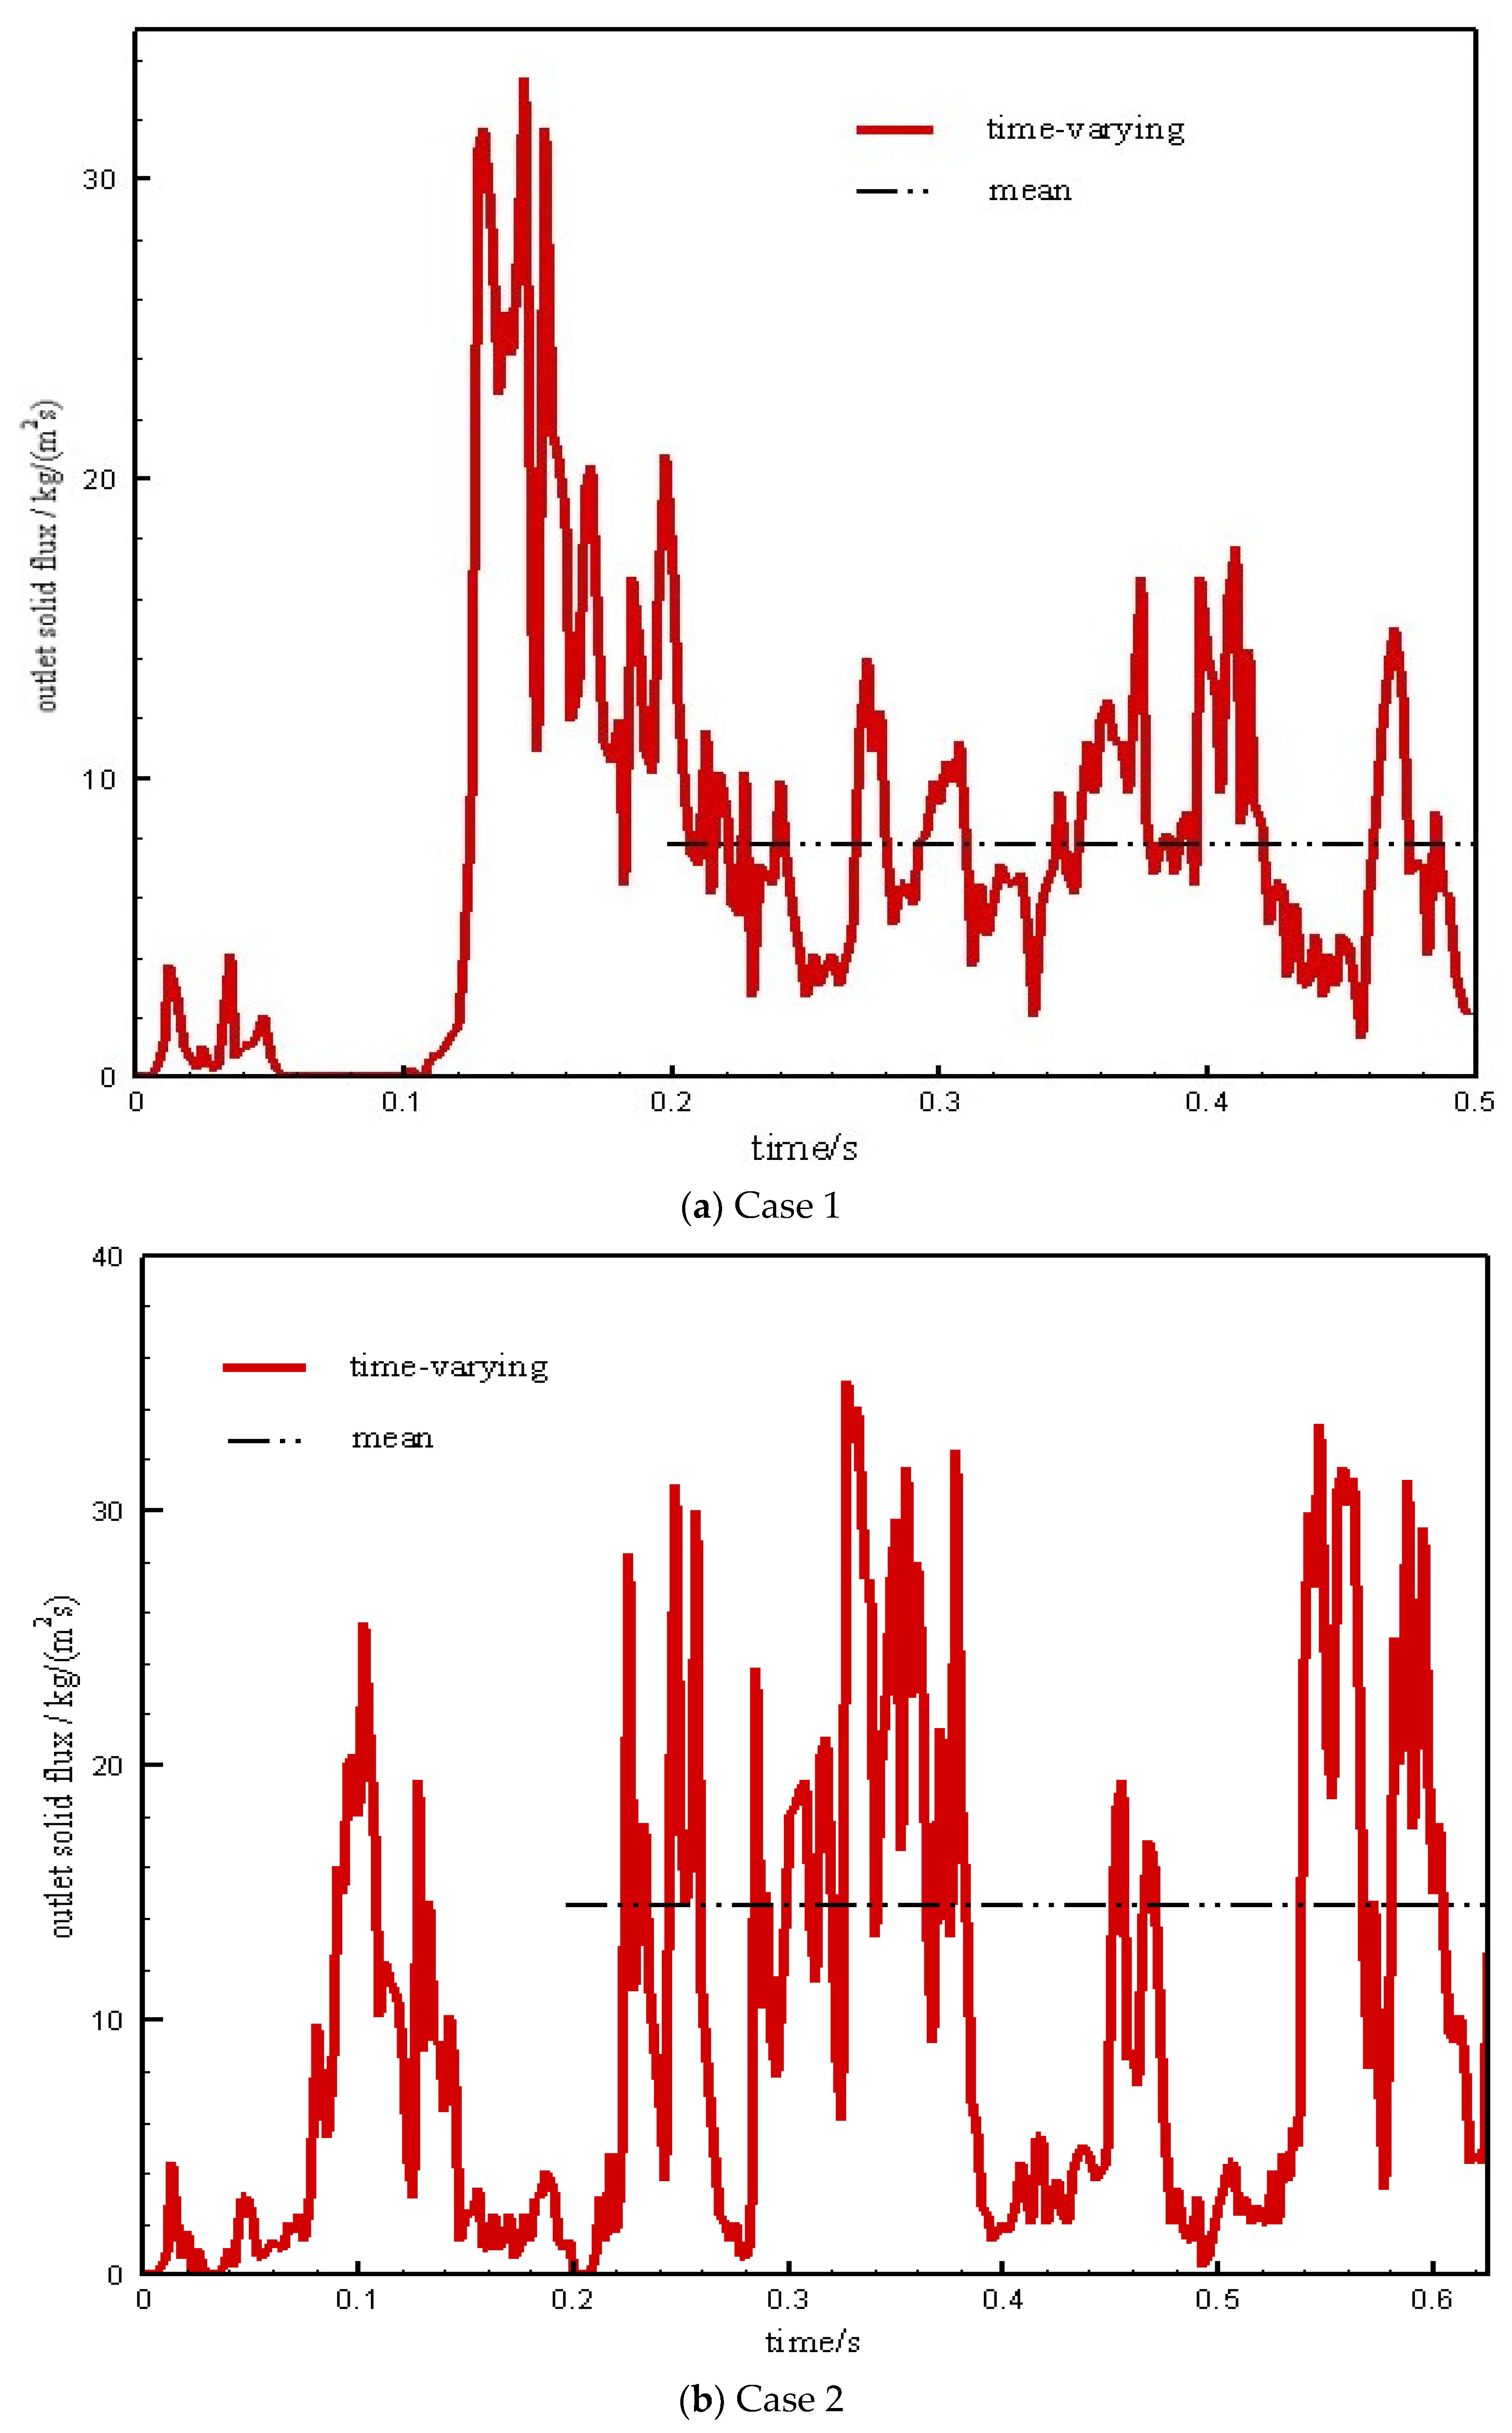
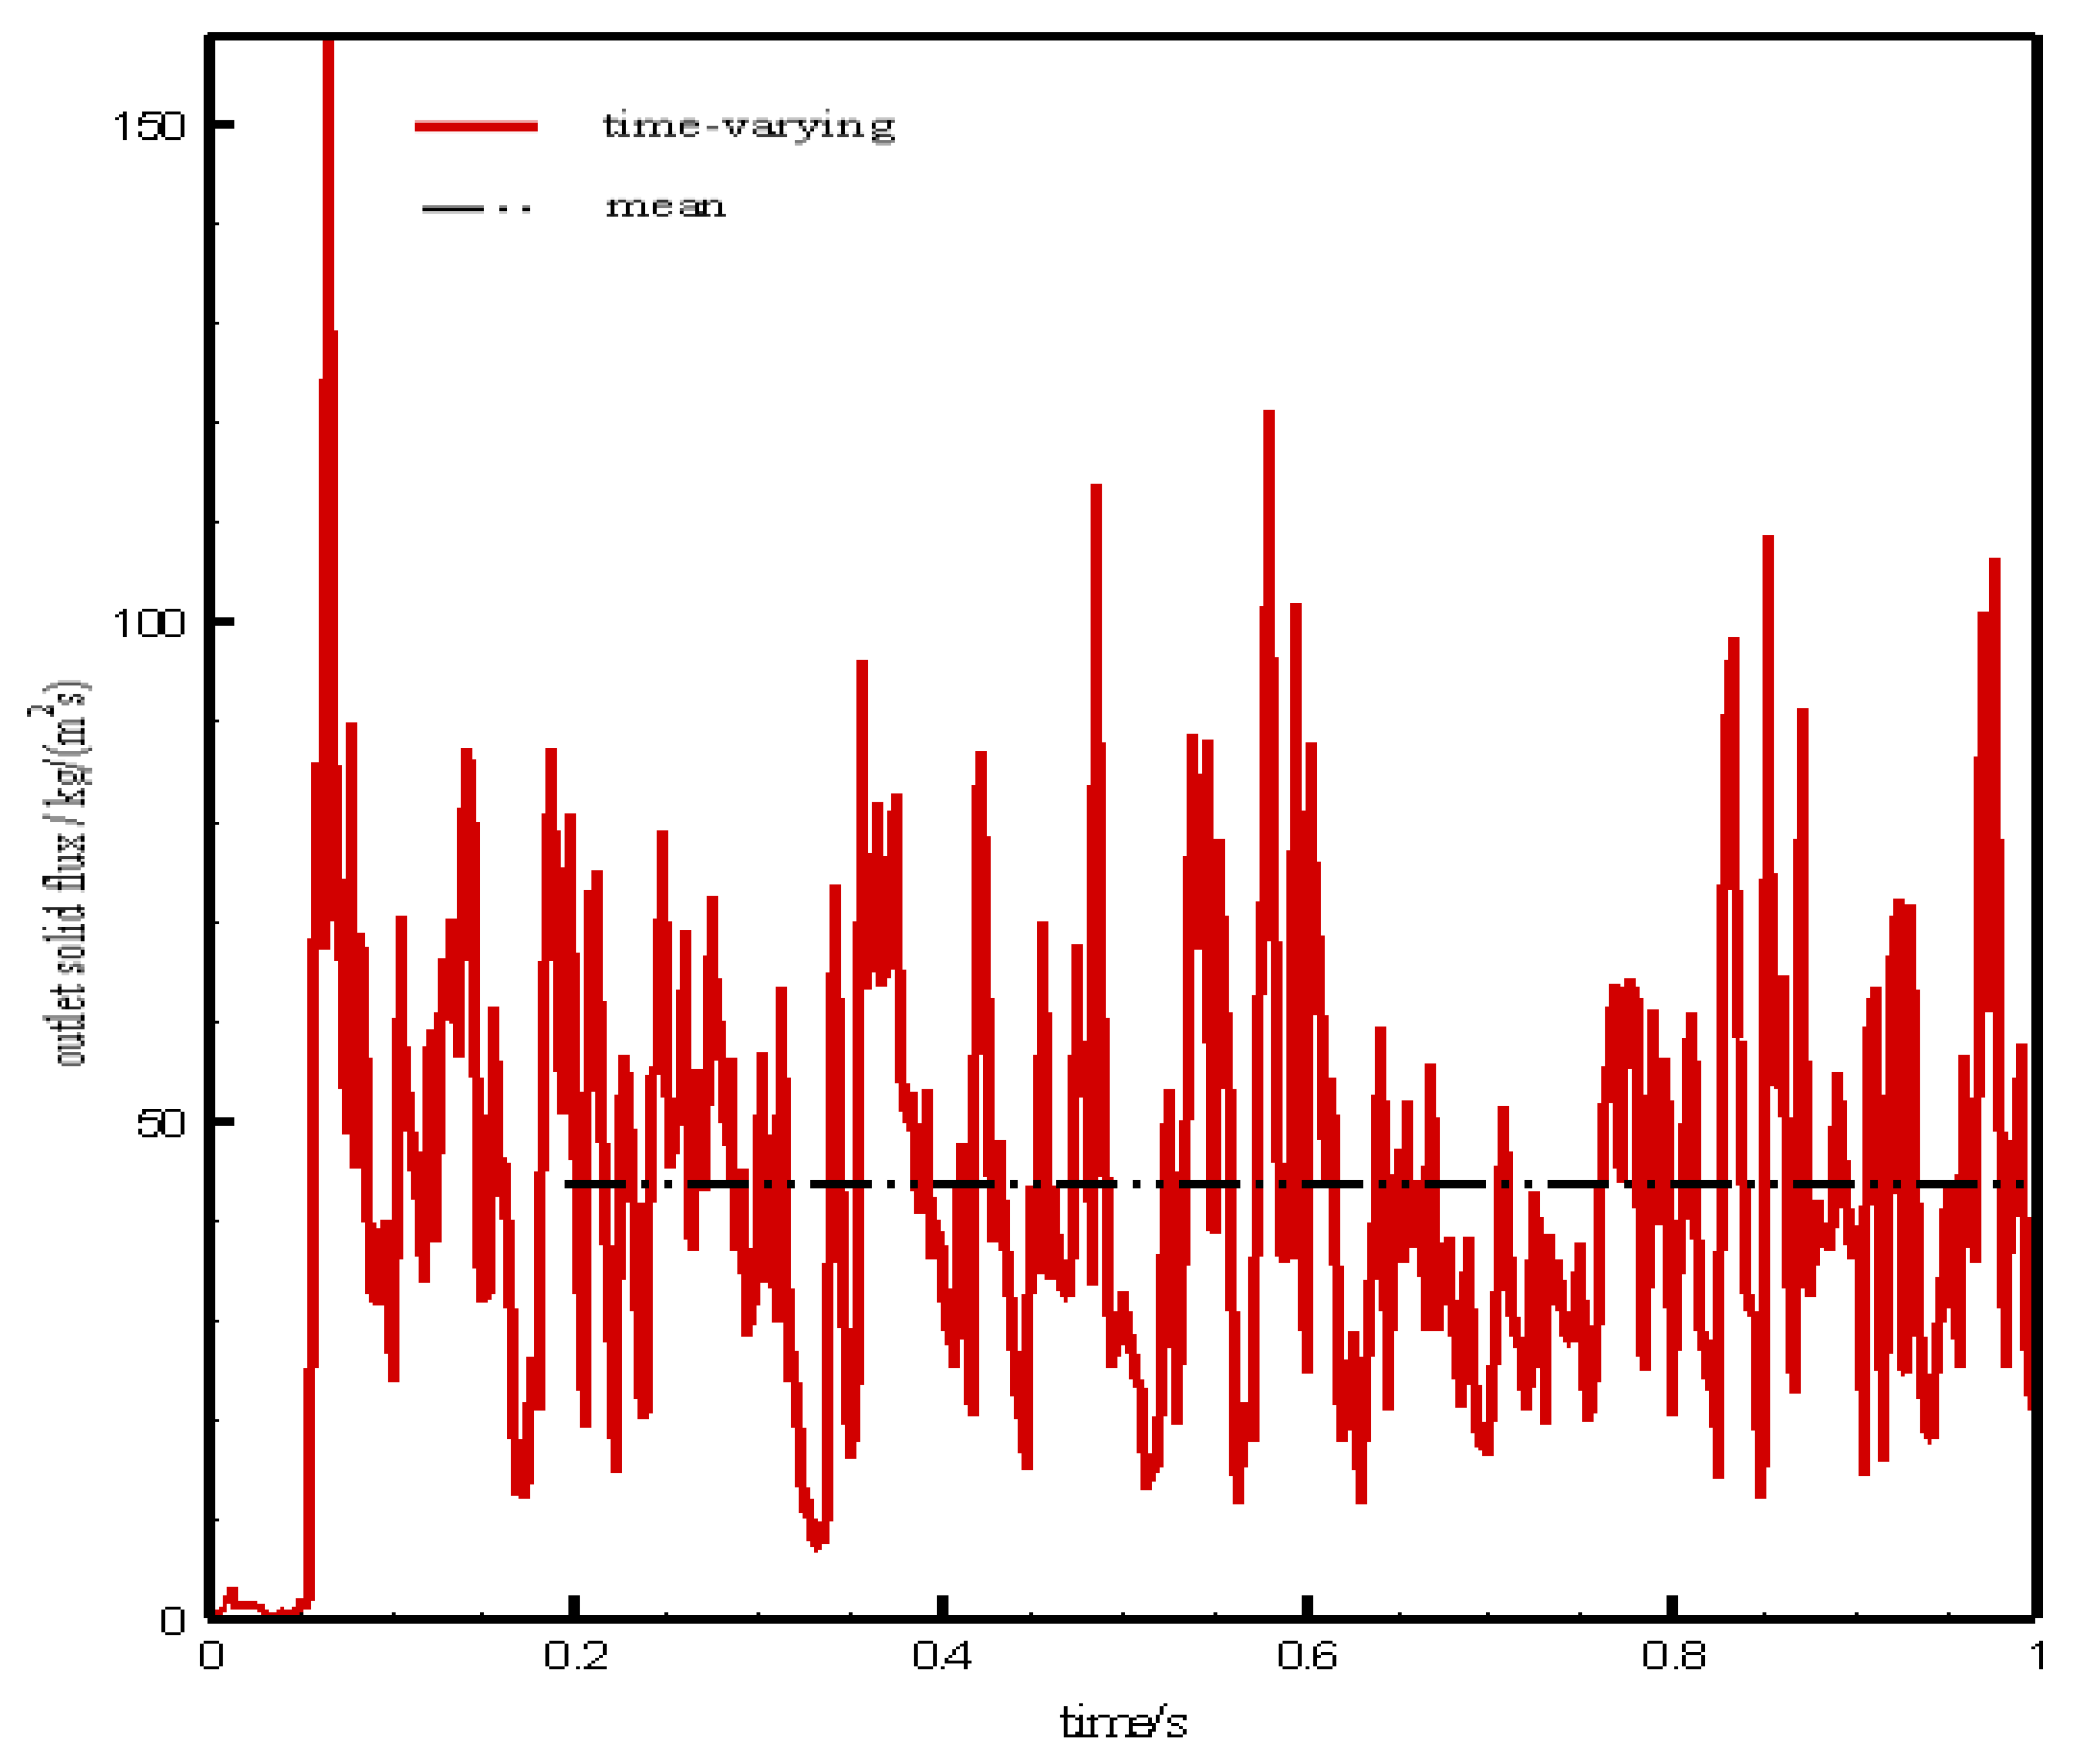
4.3. Outlet Solid Flux

Figure 6 gives the outlet solid flux G s over time with slugging. For case 1, after about 0.2 s, the two-phase flow within the MiFB can achieve a stable state, although the calculated G s still waves in large fluctuations. The time-averaged value obtained is 7.8 kg/(m2·s), which is much lower than the previously simulated 90~110 kg/(m2·s) [28]. This distinct difference shows that the present drag model significantly reduces the drag force. For case 2, after 0.2 s, the calculated G s reveals more intense fluctuations and the two-phase flow in the riser cannot achieve a stable state, although the numerical calculation may have converged. There is no evidence of physical stability even though the calculation time is extended to 0.625 s. The time-averaged value obtained is 14.7 kg/(m2·s) after 0.2 s.
Are the drag reduction and the decreased outlet solid flux rational? Consider the saturated entrainment rate of the particles G s * . This quantity in the MaFB can be correlated with the following equation [2]:
G s * d p μ g = 0.125 F r 1.85 A r 0.63 ( ρ p ρ g ρ g ) 0.44
where F r represents the Frodes number and A r represents the Archimedes number. In Li and Kwauk’s experiments [29] and Yang et al.’s simulations [30], the values of G s * were both about 14.3 kg/(m2·s) at the operating gas velocity of 1.52 m/s. The correlated value of G s * is 16.18 kg/(m2·s), indicating the good predictive ability of Equation (13). The correlated values of G s * are 19.90 kg/(m2·s) and 29.14 kg/(m2·s), corresponding to the present operating gas velocity in the simulation cases 1 and 2, respectively. The presently simulated G s valued at 7.8 kg/(m2·s) in case 1, which is lower than the correlated G s * , is reasonable, which indicates that the over-estimated drag force in [28] can be effectively improved using the present drag model. The presently simulated G s valued at 14.7 kg/(m2·s) in case 2, which is lower than the correlated G s * , is also reasonable. For case 2, the relative inventory is just equal to that used by Yang et al., while the gas velocity is higher than 1.52 m/s. However, the presently simulated G s in case 2 is almost the same as that used by Yang et al. Note that Yang et al.’s simulations were well supported by the experiment data from the MaFB. It seems that the present simulations predict the further decreased G s in the MiFB, compared with that in the MaFB.
How to explain the further decreased outlet solid flux in the MiFB? This decrease should be attributed to the micro geometry effect. From the point of view of the first type of references classified in the introduction, the micro geometry effect is focused on the friction factor. For example, Han et al. [4] insisted that in a traditional MiFB compared with an MaFB, the bed diameter is so small that for the wall, the relative area of contact with particles significantly enlarges. Due to the relatively strong wall friction, the particles near the wall cannot be transported upward, which through particle collisions can gradually be passed to the surrounding particles and even to the central area. Moreover, the gas phase needs to consume a lot of energy or the pressure drop for the suspended particles, which seriously hinders the transport of the particles. On the other hand, from the point of view of the second type of references classified in the introduction, it is focused on the slugging choking factor. For example, according to the handbooks [2,3], slugging fluidization is easy to form when decreasing the bed diameter or increasing the aspect ratio. For the present narrow bed diameter of 0.0025 m and the large aspect ratio of 16, the fast fluidization might occasionally transform into slugging fluidization, at least in some local area of the MiFB. This has also been captured in Figure 2. As the slugging fluidization is mainly the particle internal circulation flow, it will inevitably prevent the upward transport of particles and promote the backmixing of particles in the fast fluidized bed. This has also been captured in Figure 4. Therefore, the current simulations seem to be more supportive of the second viewpoint.
Figure 7 gives the outlet solid flux G s over time without slugging. For this case 3, with the increase in the gas velocity to 3 m/s, the outlet solid flux has significantly increased. After 0.2 s, the minimal time-varying flux is close to 10 kg/(m2·s), while the maximal is close to 125 kg/(m2·s). The simulated mean flux is 44.25 kg/(m2·s). According to Equation (13), the correlated value is about 53.46 kg/(m2·s). The simulated value is close to the correlated saturated entrainment rate of the particles. Note that we use a drag reduction model. If the simulated outlet flux is not overestimated, then even if the same operation is performed in a big fluidized bed, the deviation in the simulated outlet solid flux of the MiFB is at most 17%. Obviously, the simulated value likely deviates from the outlet solid flux in the MaFB to a smaller extent. Therefore, the influence of the micro device size is mainly on the slugging fast fluidization, and the influence on the non-slugging fast fluidization can almost be ignored.

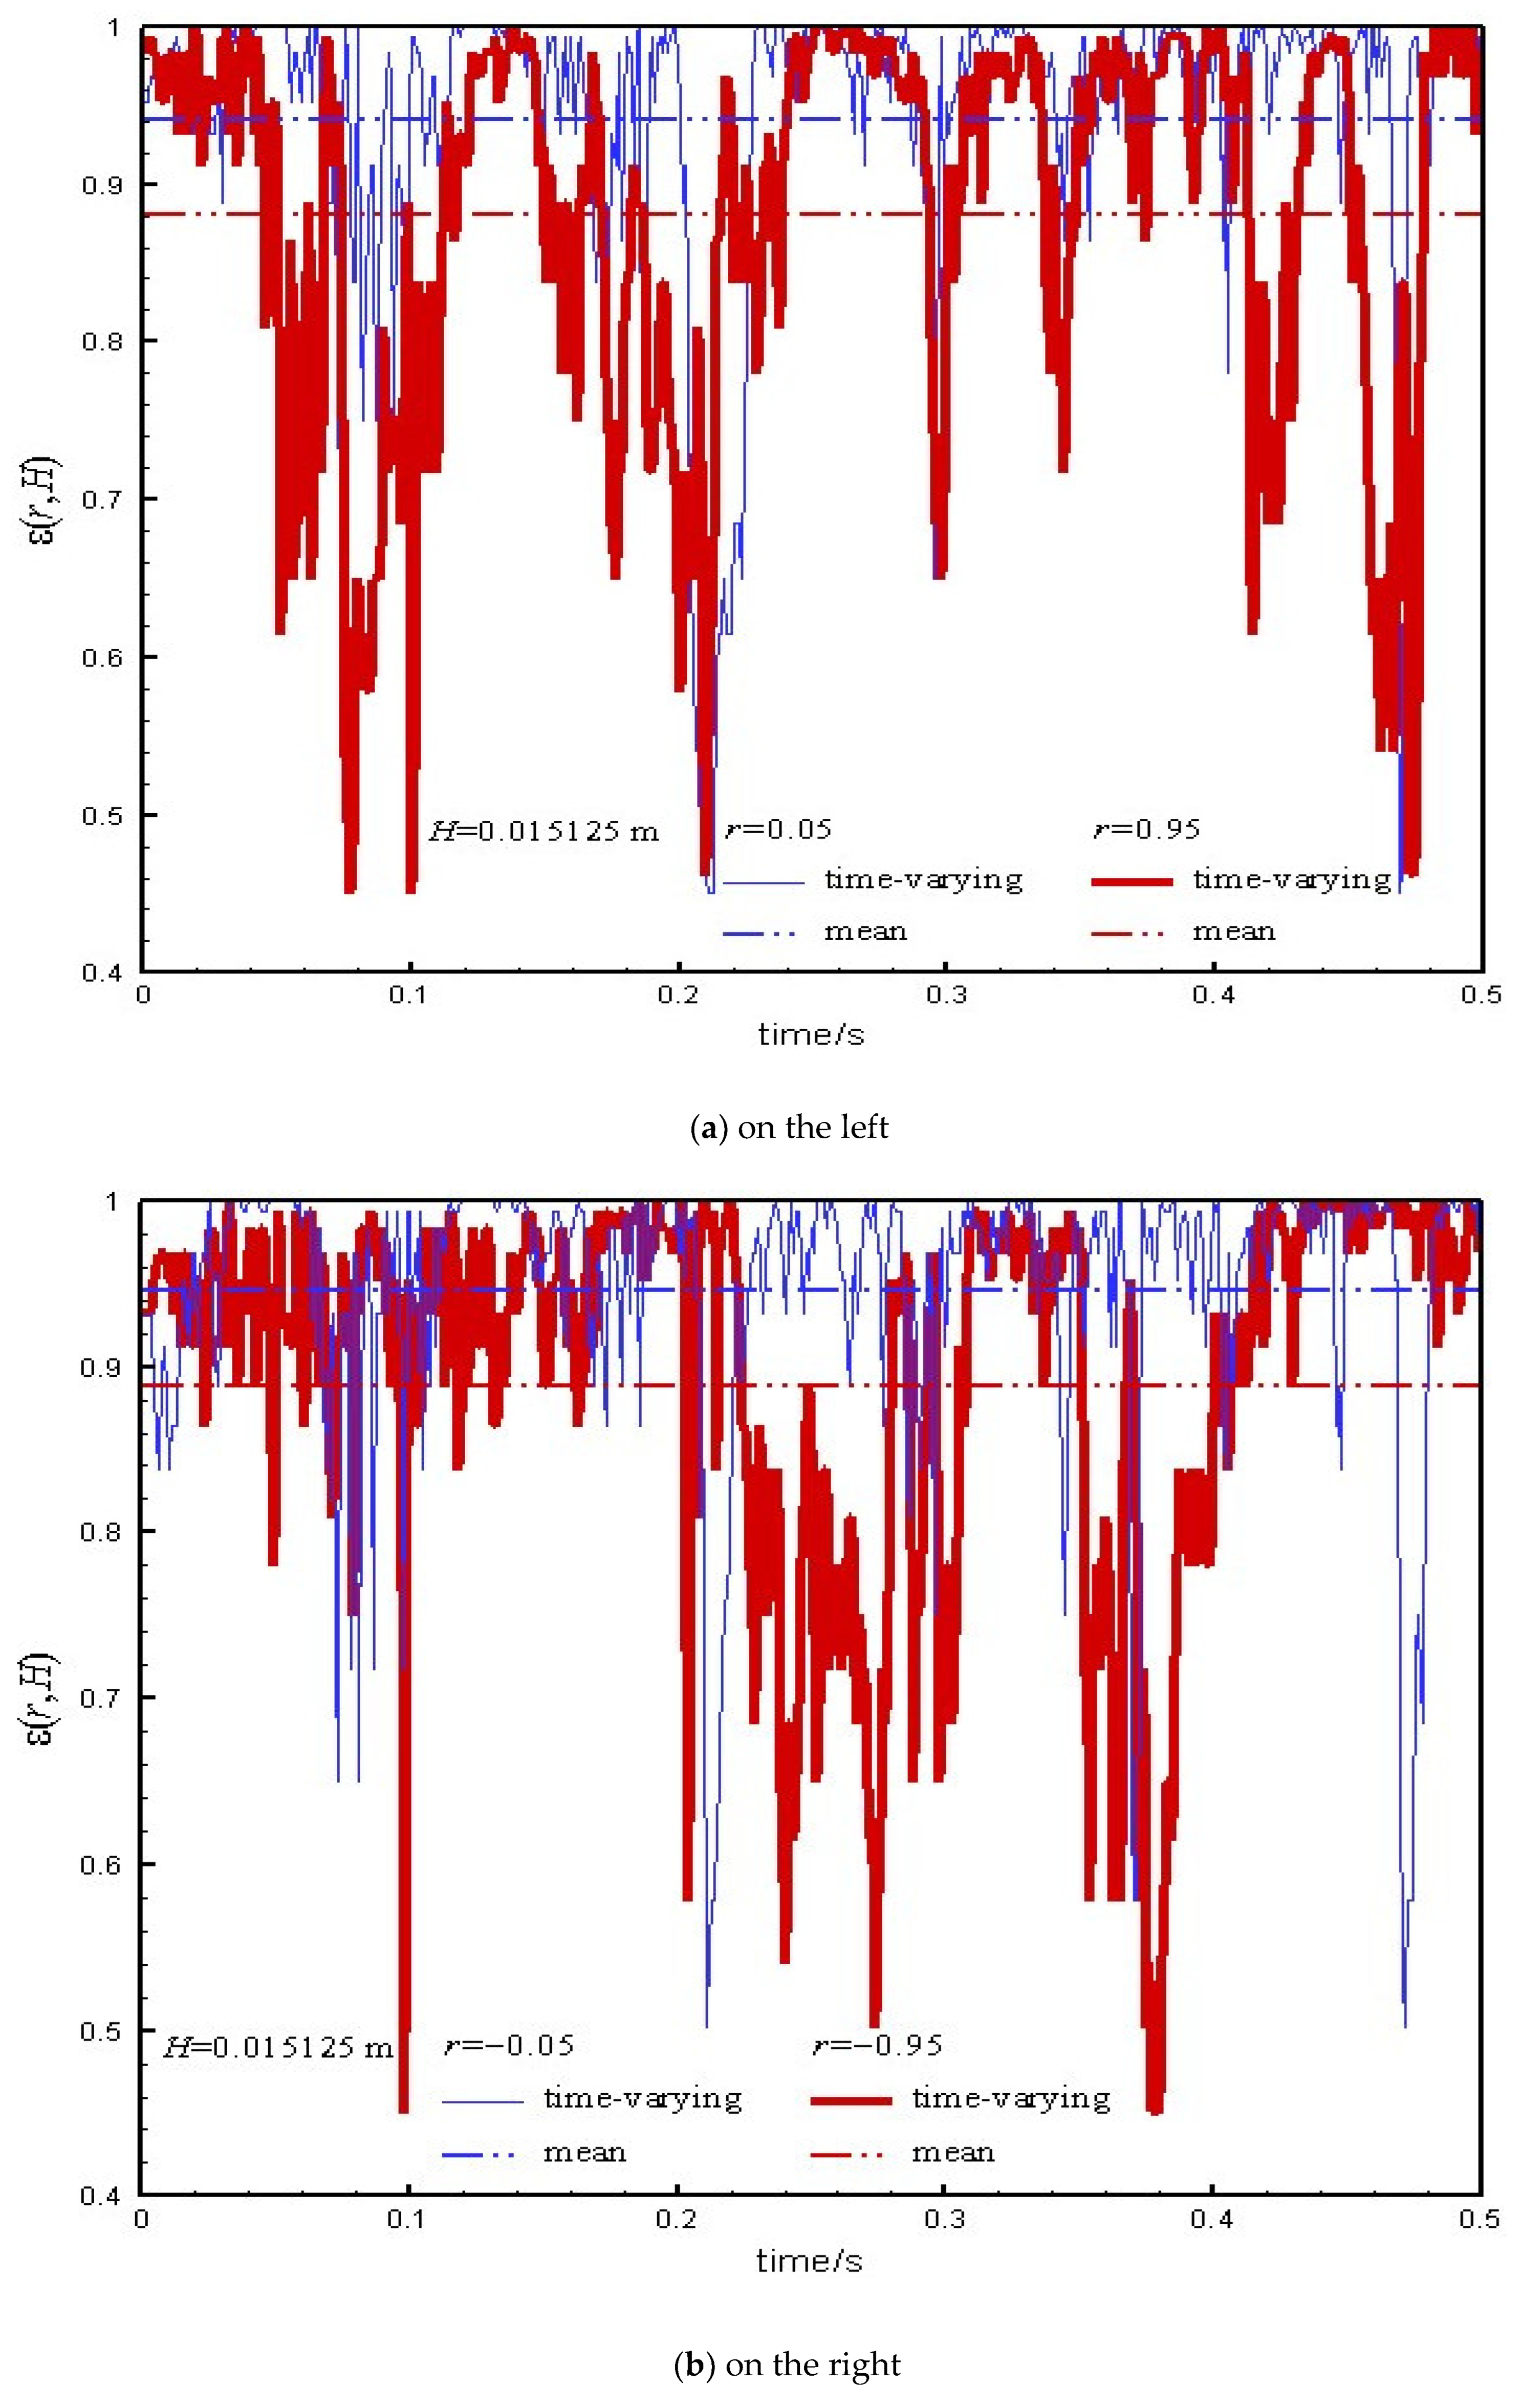
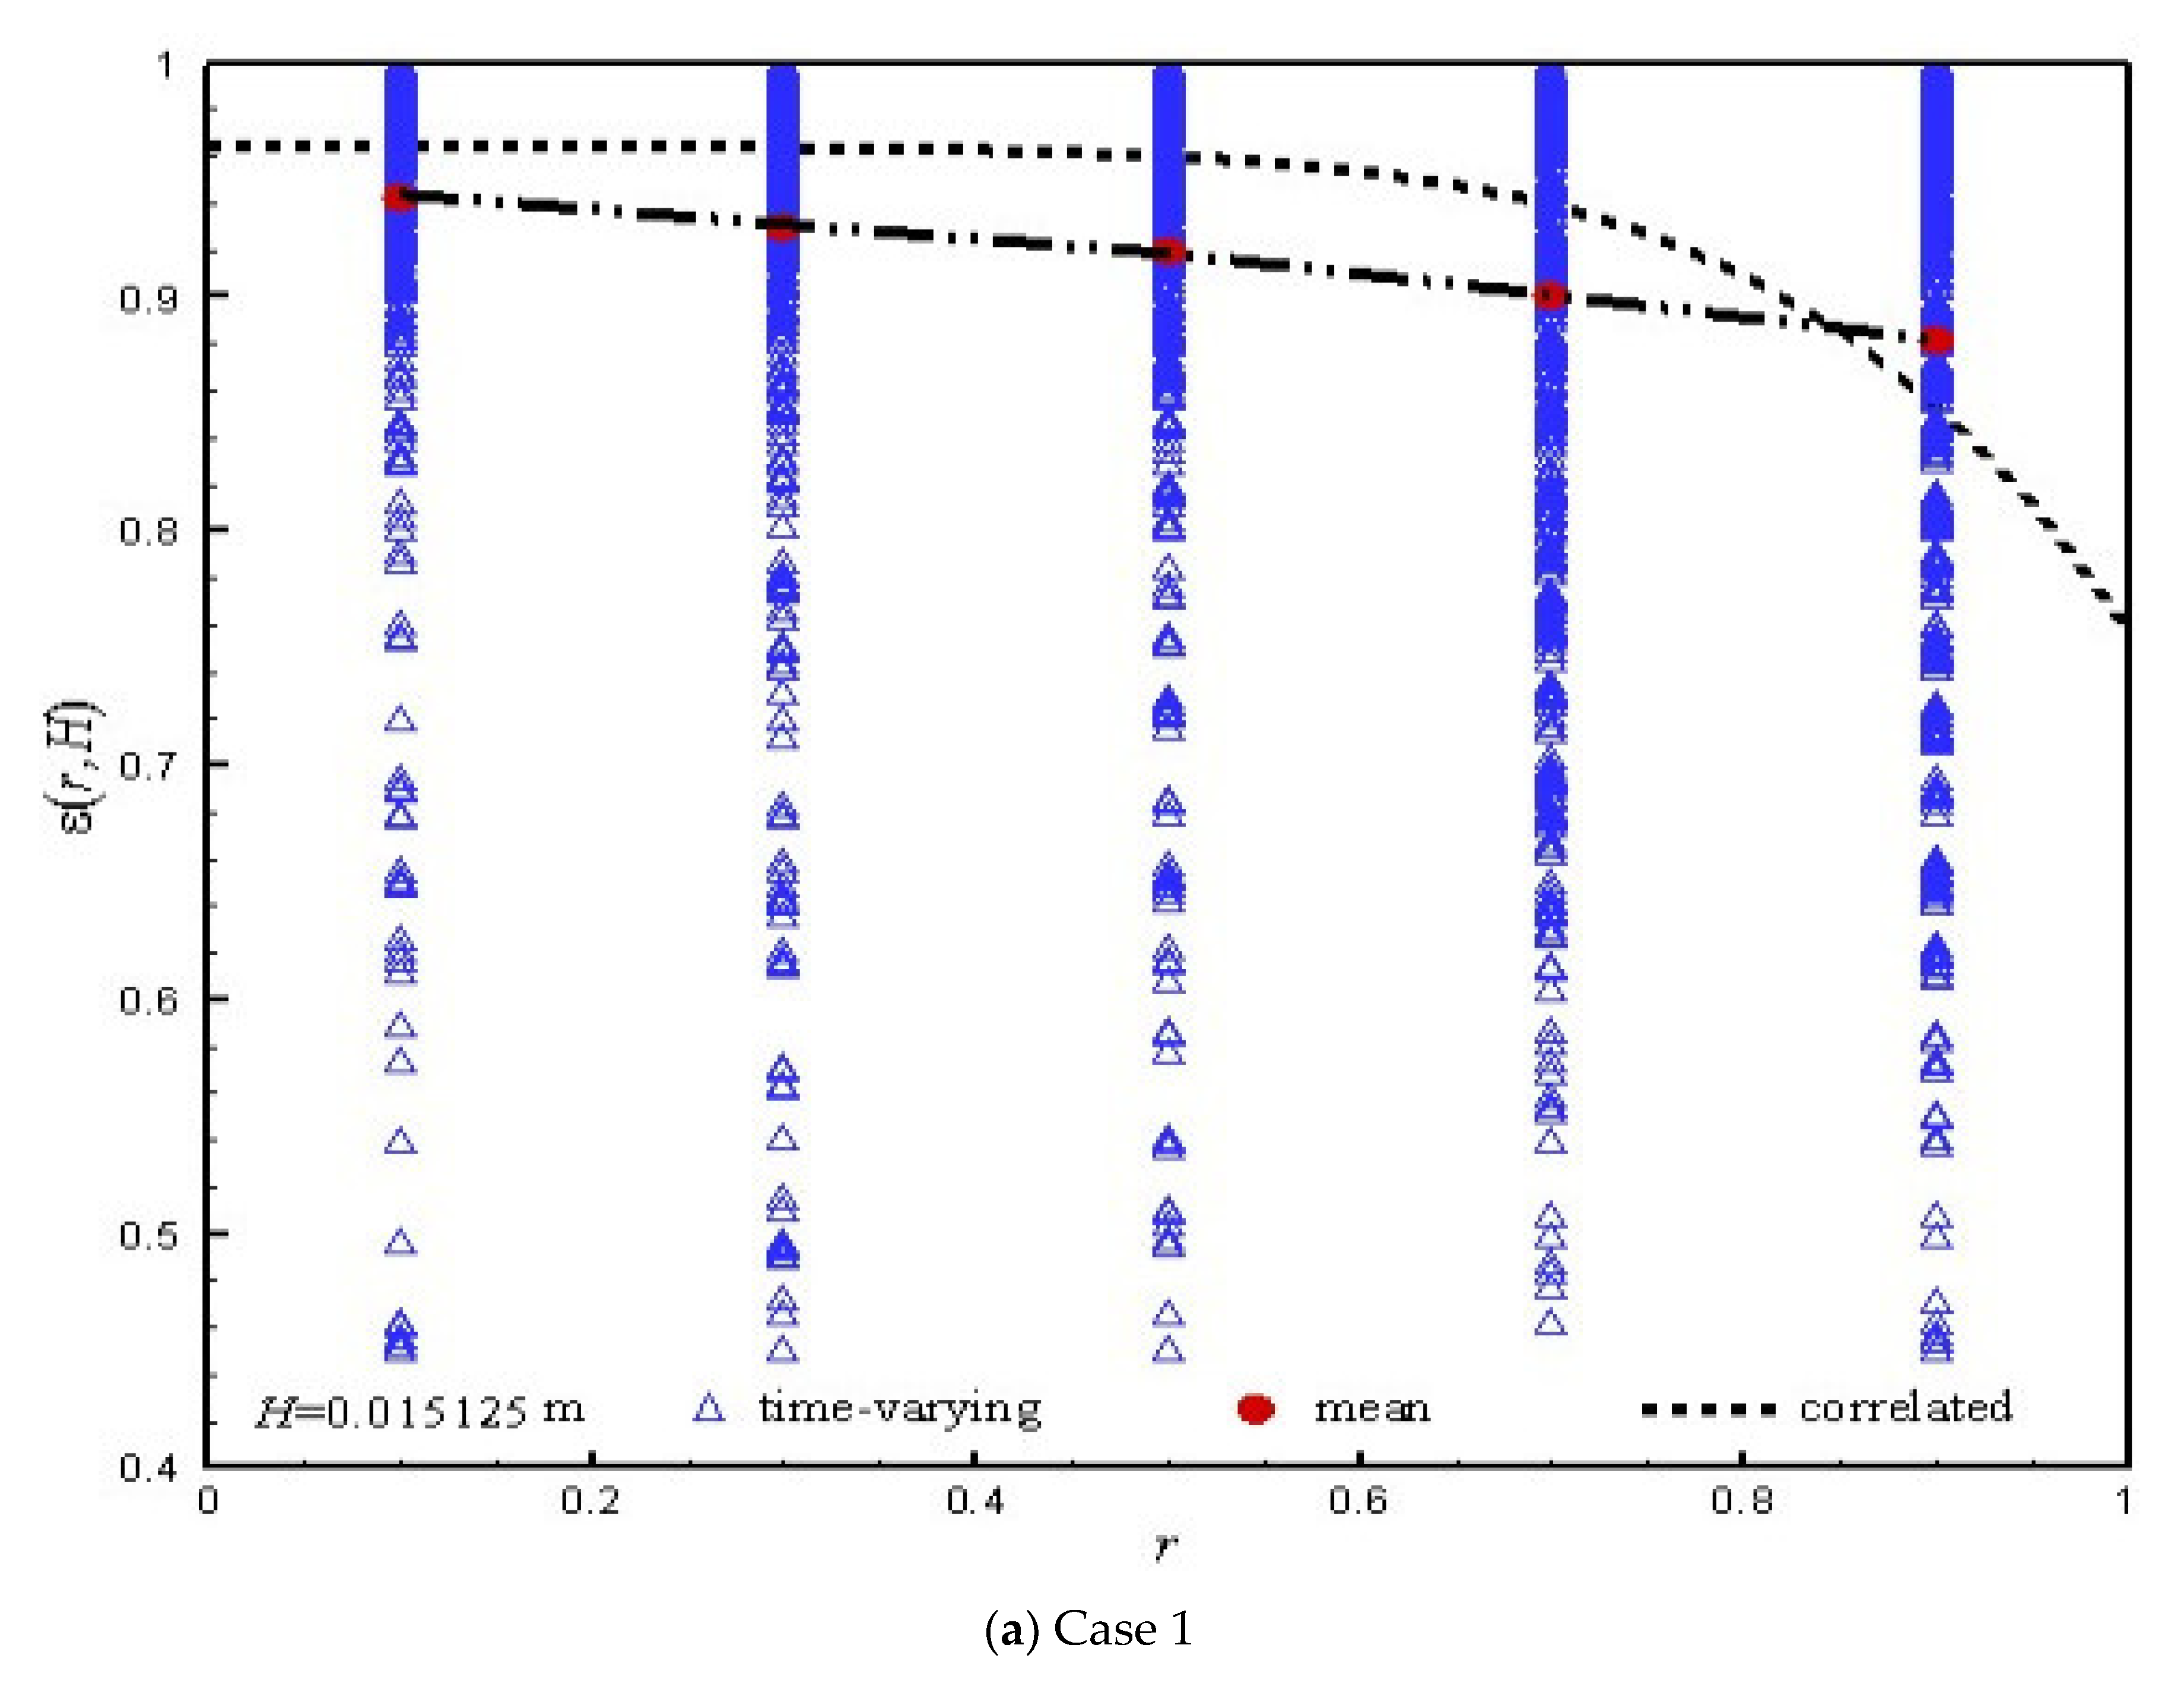
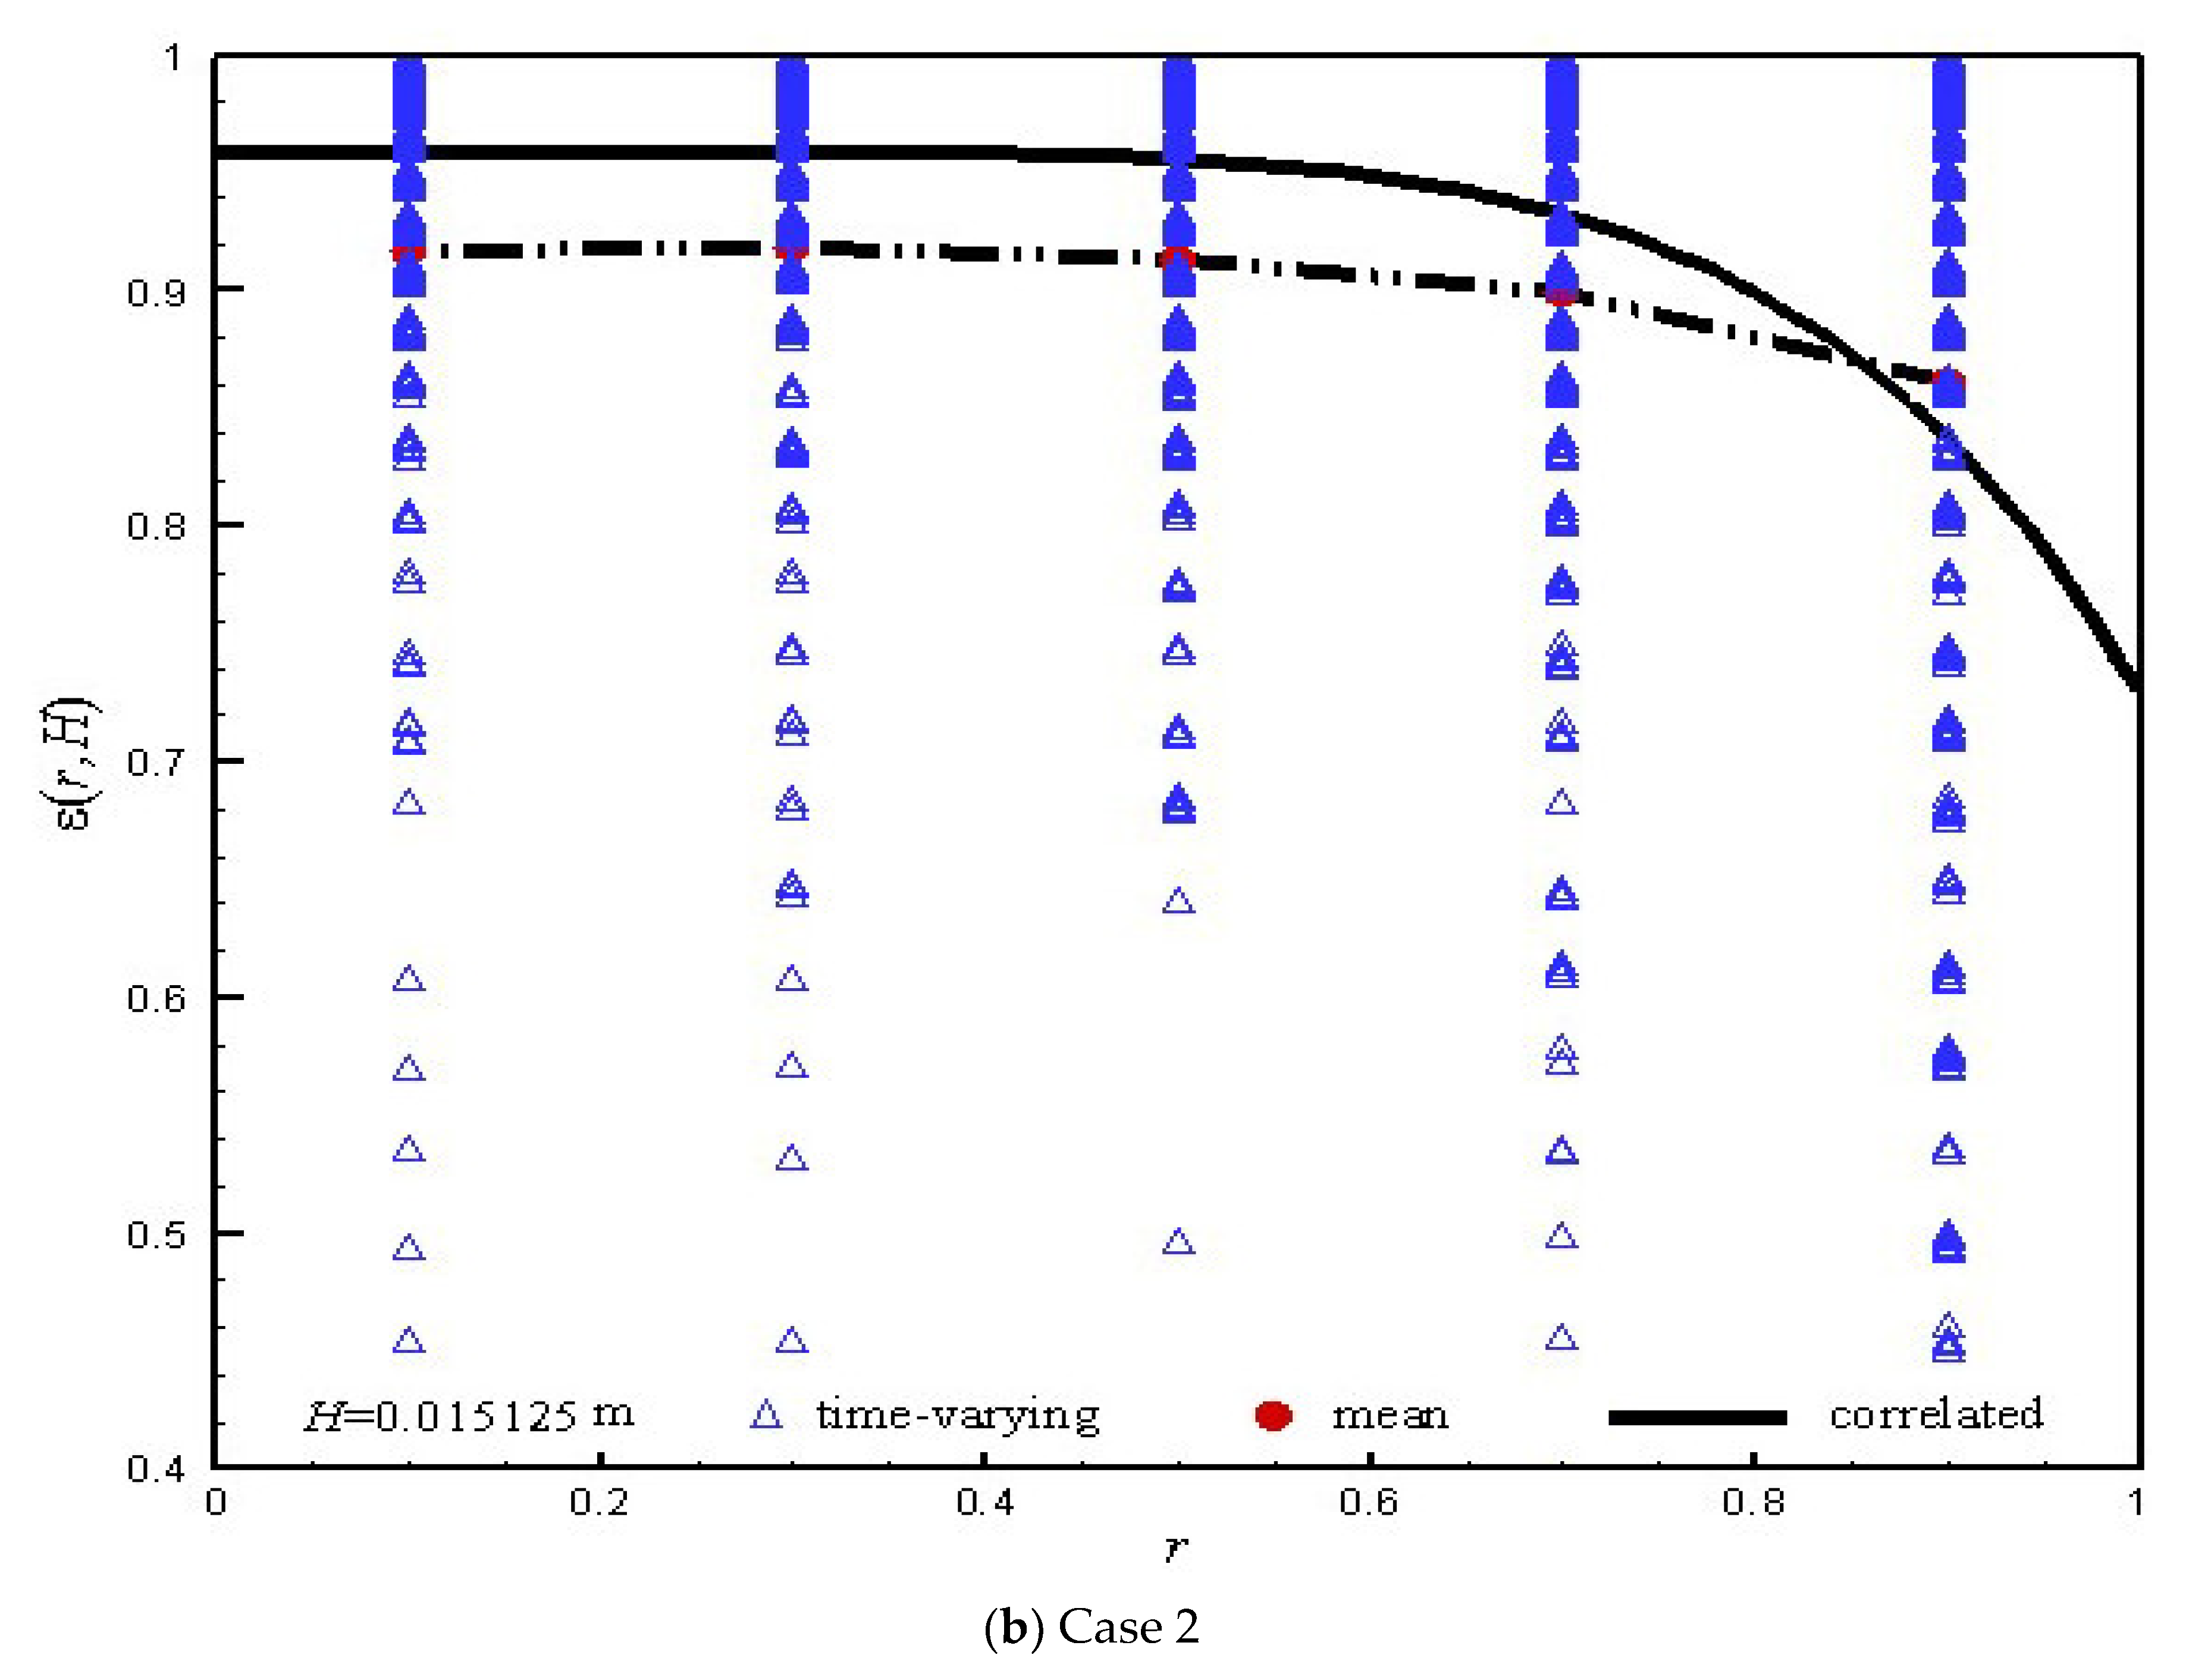
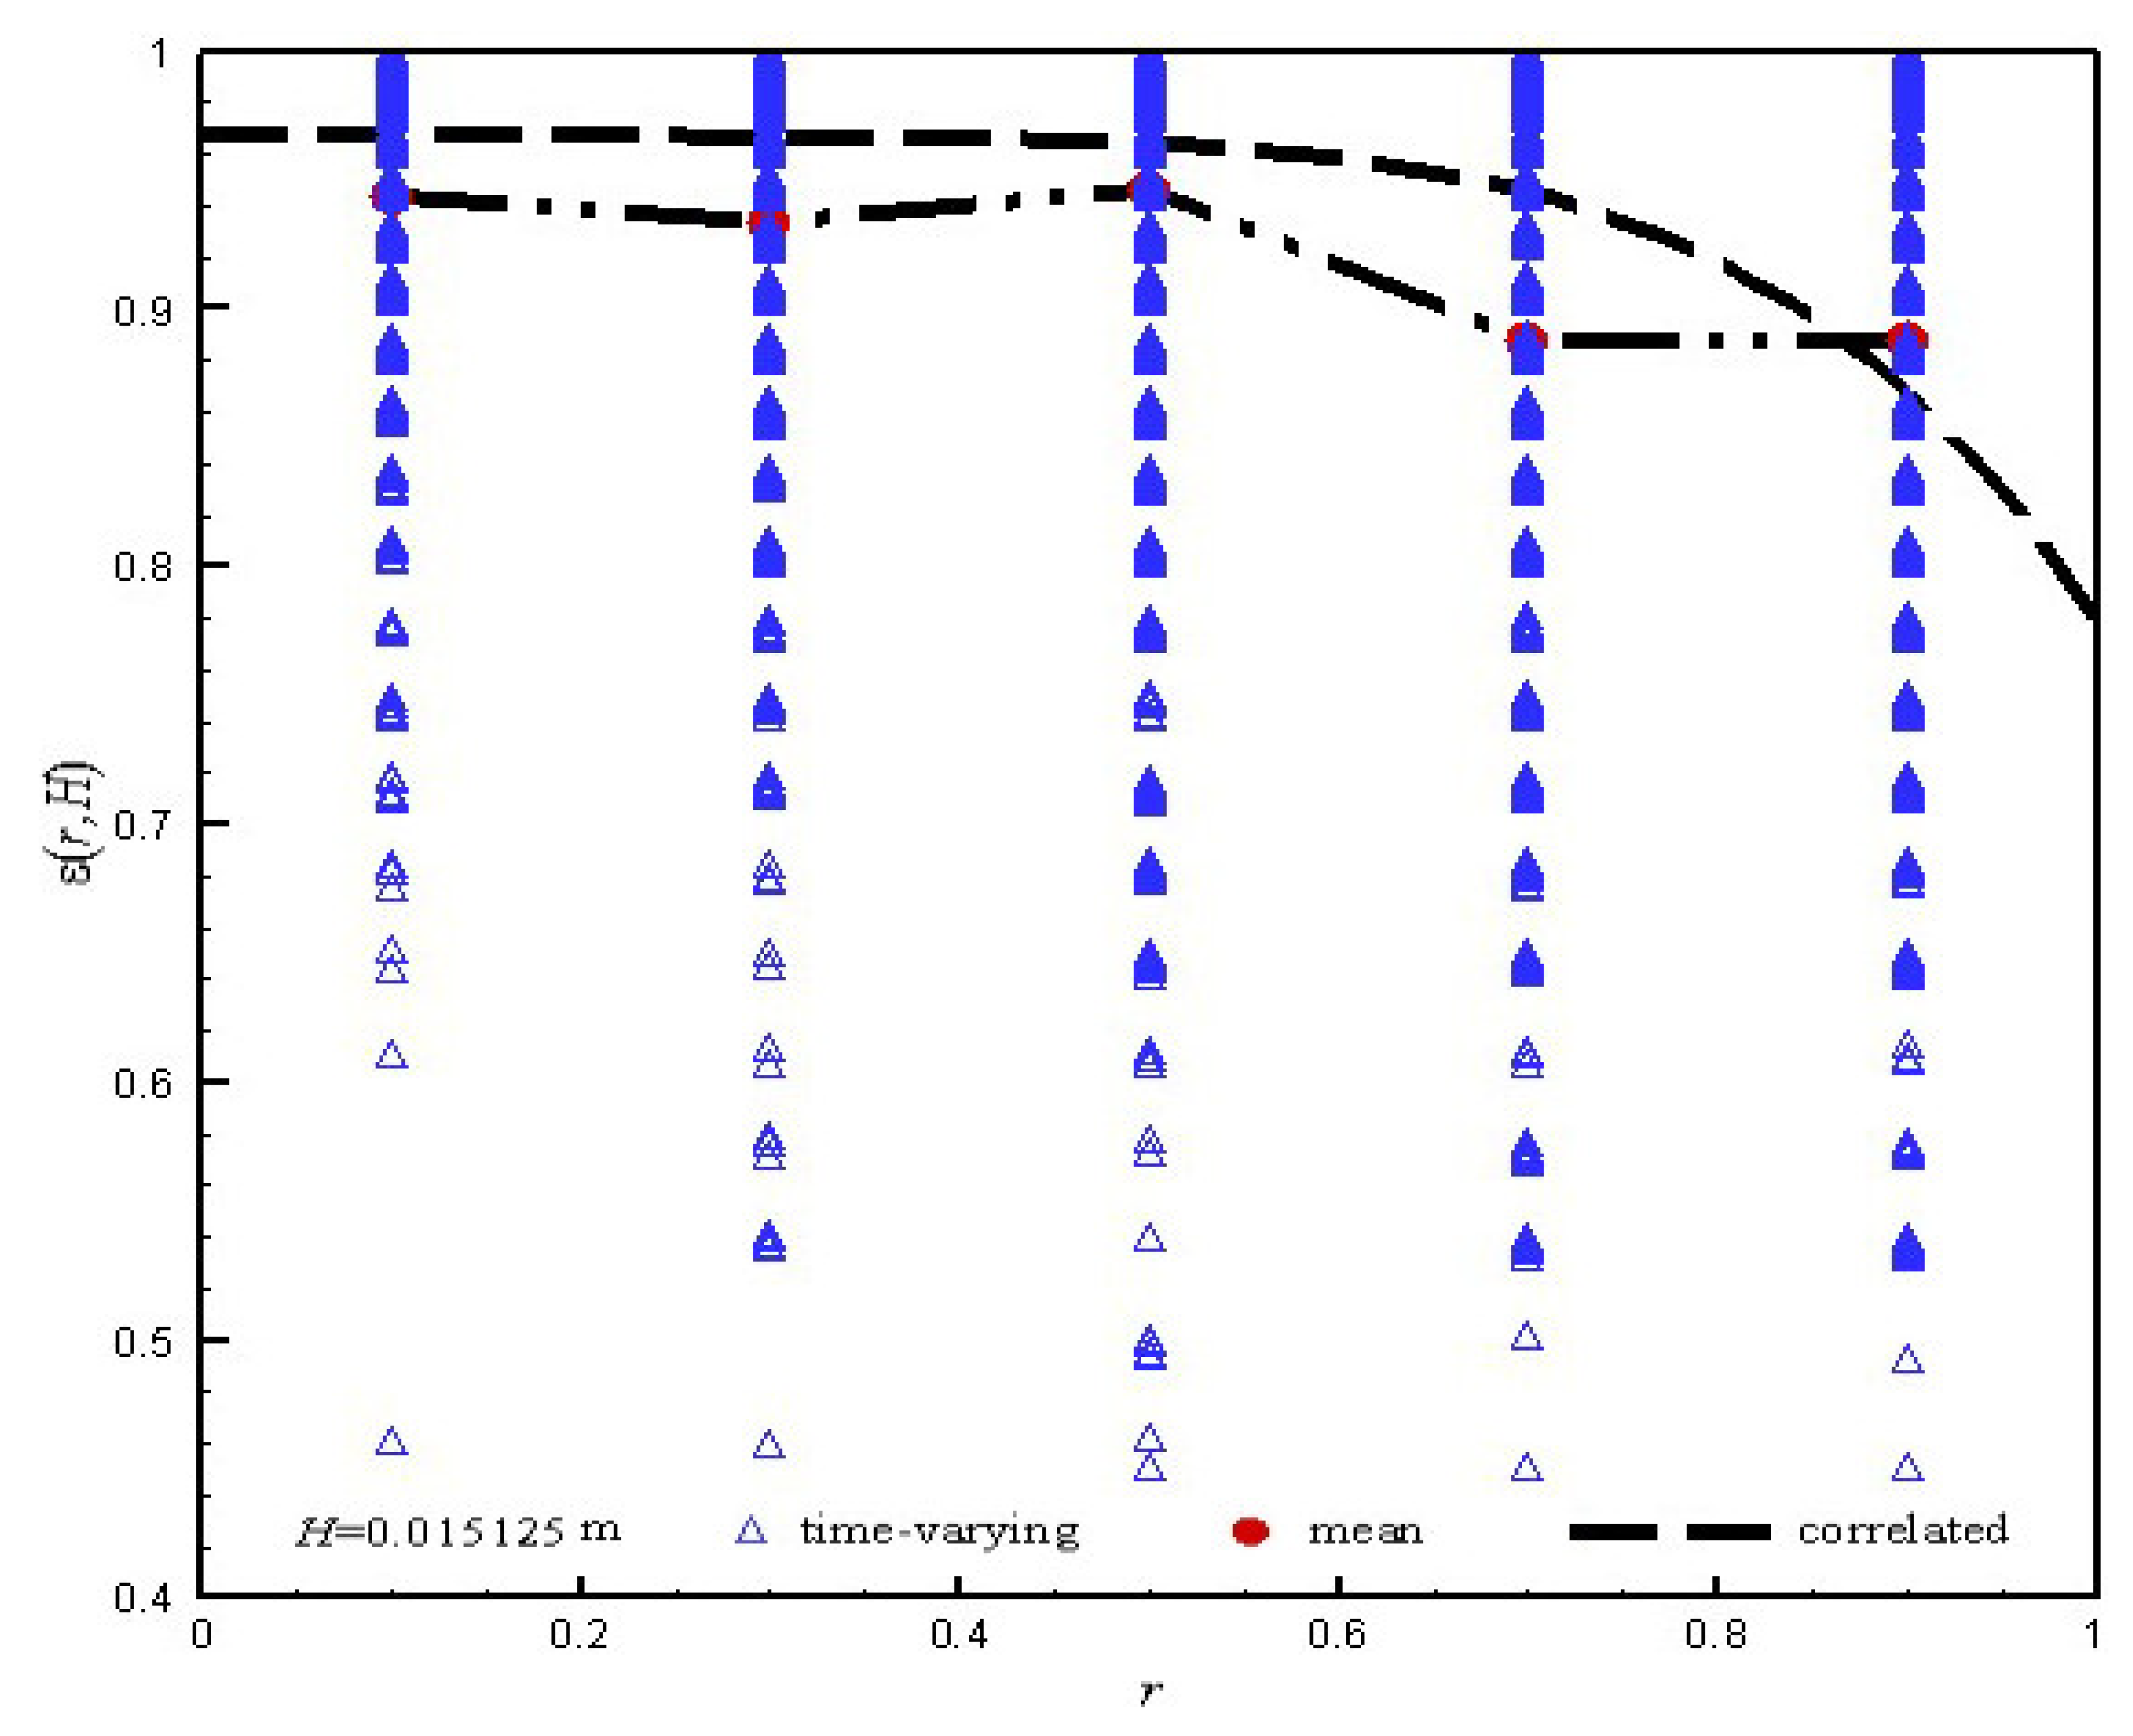
4.4. Core-Annular Structure

Figure 8 shows the porosity close to the wall and the central area with the height of 0.015125 m in case 1. Let r be the dimensionless radius of the bed. Figure 8a shows that the average porosity at r = 0.95 in the right wall area is significantly lower than that in the central area at r = 0.05. It can be noticed that the particles are widely distributed around the core of the riser cross-section with rotational symmetry [31]. Low concentrations prevail in the core, whereas a dense annulus is observed in the wall region. The difference of the core-annular porosity rates from negative to 1 − ε mf , indicating that the formation and fragmentation of the clusters has spatial and temporal dynamic characteristics. In the center, there also exists a sign of the clusters, while in close, the wall clusters are easy to break and transfer. Figure 8b shows the porosity of the left wall area ( r = −0.95) and the central area ( r = −0.05) at the same height. There is a large difference in the distribution of the porosity between the left and the right at the same time, indicating a severe asymmetry in the instantaneous radial structure in the MiFB. In addition, the total time-mean values are symmetrical. It can be concluded that the rotational symmetry of the core-annular structure reported in the experimental research should be in the sense of time average [32]. The symmetry of the time-averaged distribution indicates good particle mixing and gas-solid contact performance in the MiFB. Thus, the further discussion of the radial structure in the following considers only the results from the right of the MiFB.
Figure 9 gives the radial porosity distribution at the section with a height of 0.015125 m for slugging cases 1 and 2. According to [2], the radial porosity is just a function of the dimensionless radius once the cross-sectional porosity is determined. This does not depend on the gas and particle flow rates. The simulated time-averaged cross-sectional porosity values at the height 0.015125 m are 0.912 and 0.907 for cases 1 and 2, respectively. The radial porosity in the MaFB can be correlated by the following equation [2]:
ε ¯ 0.4 ε ε ¯ 0.4 ε ¯ = 4 r 6
The simulation results for both cases fundamentally follow the core-annulus radial structure in the trend. That is, a higher central porosity and a lower side porosity. However, the simulated radial structures exhibit the lower porosity in the central area and the higher porosity close to the wall, compared with the correlated structures. This can be explained with the micro geometry size factor. The relatively strong wall friction can be conducted at the center of the MiFB so that the cluster traces can be captured in the center. On the other hand, the frequent onset of particle slugs could even flash the entire bed cross-section.
Figure 10 gives the radial porosity distribution at the section with a height of 0.015125 m for non-slugging case 3. The simulated radial structures still exhibit the lower porosity in the central area and the higher porosity close to the wall, compared with the correlated structures. However, the simulated near-side porosity is very close to the correlated results. Moreover, the simulated far-side porosity is also very close to the correlated results, except for the porosity at r = 0.7. Among all the simulated radial structures, the results from case 3 are closest to the correlated results in the MaFB, indicating once again that when slugging does not appear, the influences of the micro device size are of no significance.

5. Conclusions

This paper presents a drag model that considers the complex circumstances of the target particle. The proposed model is implanted into the CFD-DEM simulations of the fine particles’ fast fluidization in the micro riser. As it is affected by the micro geometry size, the simulation results exhibit a special law different from that in the MaFB. The formation and fragmentation of the clusters in the different local regions of the slugging fast bed exhibit temporal synchronization. The boundary of the dense and dilute phases turns blurry, and slugs disappear with the increase in the gas velocity. There exists serious solid backmixing effects in the slugging fast fluidization, while the backmixing effect weakens in the non-slugging fast fluidization. The outlet solid flux decreases compared with those in the MaFB for the slugging fast fluidized bed due to the micro size effect, while the micro size effect on the solid flux is not distinct for the non-slugging fast fluidized bed. The radial porosity with slugging exhibits the weakened core-annulus structure when compared with the correlated radial porosity from the MaFB. The radial porosity without slugging tends to approach the core-annulus structure in the MaFB.

Author Contributions

Conceptualization, G.W.; methodology, G.W.; software, G.W.; validation, G.W.; formal analysis, G.W.; investigation, G.W. and Y.L.; resources, G.W.; data curation, G.W.; writing—original draft preparation, G.W.; writing—review and editing, G.W.; visualization, G.W.; supervision, Y.L.; and project administration, Y.L. All authors have read and agreed to the published version of the manuscript.

Funding

This research received fundings supported by the Natural Science Foundation of Chongqing (CSTB2022NSCQ-MSX0974), the National Natural Science Foundation of China (61962051), and the Science and Technology Plan Project of Qinghai Province-Applied Basic Research Plan (2023-ZJ-736).

Data Availability Statement

The date underlying this article will be shared on reasonable request to the first author.

Conflicts of Interest

The authors declare no conflict of interest.

Nomenclature

Aarea, m2
ArArchimedes number
Cdrag coefficient
Dbed diameter, m
dparticle diameter or distance between particles, m
eunit vector
Fforce on particle, N
fgrid area fraction occupied by particle
FrFred number
Goutlet solid flux, kg·m−2·s−1
ggravity acceleration, m·s−2
hsmooth length, m
Hheight in bed, m
HaHamaker constant, N·m
H0truncation distance, m
Iinertia moment of particle as spherical, kg·m2
i, j, kparticle or grid index
Nnumber of particles
ppressure, Pa
Rparticle radius, m
rparticle position vector
rdimensionless bed radius, m
Spmomentum exchange source term
Ttorque, N·m
ttime, s
u0inlet gas velocity, m·s−1
ugas velocity, m·s−1
utparticle terminal speed
Vvolume, m3
vparticle velocity, m·s−1
X, Yparticle centriod coordinate component, m
x, ygrid node coordinate component, m
ε porosity
ε ¯ cross-sectional porosity
ε sd solid volume fraction at bottom of bed
κ stiffness coefficient, N·m−1
λ solid volume fraction multiplier
μ viscosity, N·s·m−2
ρ density, kg·m−3
τ viscocous stress tensor, Pa
ω particle angular velocity, s−1
ξ restitution coefficient
subscript
2Dtwo dimension
3Dthree dimension
ccontact
ddrag
ggas
i, j, kparticle or grid index
mfminimal fluidized state
pparticle
ssolid
ttotal
vvan der Waals
wbed wall

References

  1. Li, J.; Ouyang, J.; Gao, S.; Ge, W.; Yang, N.; Song, W. Multi-Scale Simulation of Particle-Fluid Complex Systems; Sience Press: Beijing, China, 2005. [Google Scholar]
  2. Jin, Y.; Zhu, J.X.; Wang, Z.W.; Yu, Z.Q. Fluidization Engineering Principles; Tsinghua University Press: Beijing, China, 2001. [Google Scholar]
  3. Crowe, C.T. Multiphase Flow Handbook; CRC Press: New York, NY, USA, 2006. [Google Scholar]
  4. Han, Z.; Yue, J.; Geng, S.; Hu, D.; Liu, X.; Bello Suleiman, S.; Cui, Y.; Bai, D.; Xu, G. State-of-the-art hydrodynamics of gas-solid micro fluidized beds. Chem. Eng. Sci. 2021, 232, 116345. [Google Scholar] [CrossRef]
  5. Tsuji, Y.; Kawaguchi, T.; Tanake, T. Discrete particle simulation of two-dimensional fluidized bed. Powder Technol. 1993, 77, 79–87. [Google Scholar] [CrossRef]
  6. Hoomans, B.P.B.; Kuipers, J.A.M.; Briels, W.J.; Van Swaaij, W.P.M. Discrete particle simulation of bubble and slug formation in a two-dimensional gas-fluidised bed: A hard-sphere approach. Chem. Eng. Sci. 1996, 51, 99–108. [Google Scholar] [CrossRef]
  7. Xu, B.H.; Yu, A.B. Numerical simulation of the gas-solid flow in a fluidized bed by combing discrete particle method with computational fluid dynamics. Chem. Eng. Sci. 1997, 52, 2785–2809. [Google Scholar] [CrossRef]
  8. Ouyang, J.; Li, J.H. Particle-motion-resolved discrete model for simulating gas-solid fluidization. Chem. Eng. Sci. 1999, 54, 2077–2083. [Google Scholar] [CrossRef]
  9. Yu, A.B.; Xu, B.H. Particle-scale modelling of gas–solid flow in fluidisation. J. Chem. Technol. Biotechnol. 2003, 78, 111–121. [Google Scholar] [CrossRef]
  10. Ye, M.; van der Hoef, M.; Kuipers, J. A numerical study of fluidization behavior of Geldart A particles using a discrete particle model. Powder Technol. 2004, 139, 129–139. [Google Scholar] [CrossRef]
  11. Potic, B.; Kersten, S.R.A.; Ye, M.; van der Hoef, M.A.; Kuipers, J.A.M.; van Swaaij, W.P.M. Fluidization with hot compressed water in micro-reactors. Chem. Eng. Sci. 2005, 54, 5982–5990. [Google Scholar] [CrossRef]
  12. Guo, Q.; Bordbar, A.; Ma, L.; Yu, Y.; Xu, S. A CFD-DEM study of the solid-like and fluid-like states in the homogeneous fluidization regime of Geldart A particles. AIChE J. 2022, 68, e17420. [Google Scholar] [CrossRef]
  13. Li, S.; Zhao, P.; Xu, J.; Zhang, L.; Wang, J. Direct comparison of CFD-DEM simulation and experimental measurement of Geldart A particles in a micro-fluidized bed. Chem. Eng. Sci. 2021, 64, 622–625. [Google Scholar] [CrossRef]
  14. Zhou, C.L.; Zhao, Y.Z. Discrete element method and its applications in fluidizatio. CIESC J. 2014, 65, 2520–2534. [Google Scholar]
  15. Hou, Q.F.; Zhou, Z.Y.; Yu, A.B. Micromechanical modeling and analysis of different flow regimes in gas fluidization. Chem. Eng. Sci. 2012, 84, 449–468. [Google Scholar] [CrossRef]
  16. Wang, J.W.; Van der Hoef, M.A.; Kuipers, J.A.M. CFD study of the minimum bubbling velocity of Geldart A particles in gas-fluidized beds. Chem. Eng. Sci. 2010, 65, 3772–3785. [Google Scholar] [CrossRef]
  17. Wang, J.W.; Van der Hoef, M.A.; Kuipers, J.A.M. Why the two-fluid model fails to predict the bed expansion characteristics of Geldart A particles in gas-fluidized beds: A tentative answer. Chem. Eng. Sci. 2009, 64, 622–625. [Google Scholar] [CrossRef]
  18. Li, T.; Rabha, S.; Verma, V.; Dietiker, J.F.; Xu, Y.; Lu, L.; Rogers, W.; Gopalan, B.; Breault, G.; Tucker, J.; et al. Experimental study and discrete element method simulation of Geldart Group A particles in a small-scale fluidized bed. Adv. Powder Technol. 2017, 28, 2961–2973. [Google Scholar] [CrossRef]
  19. Wu, G.R.; Ouyang, J. Fine grid DEM simulation of bed layer height in bubbling fluidized-bed. CIESC J. 2014, 65, 2092–2097. [Google Scholar]
  20. Wen, C.Y.; Yu, Y.H. Mechanics of fluidization. Chem. Eng. Progr. Symp. Ser. 1966, 62, 100–111. [Google Scholar]
  21. Schiller, V.L.; Naumann, A. Uber die grundlegenden berechnungen bei der schwerkraftaufbereitung. Z. Ver. Dtsch. Ing. 1993, 77, 318–320. [Google Scholar]
  22. Xu, M.; Ge, W.; Li, J.H. A discrete particle model for particle–fluid flow with considerations of sub-grid structures. Chem. Eng. Sci. 2007, 62, 2302–2308. [Google Scholar] [CrossRef]
  23. Wu, G.R.; Ouyang, J.; Li, Q. Revised drag calculation method for coarse grid Lagrangian-Eulerian simulation of gas-solid bubbling fluidized bed. Powder Technol. 2013, 235, 959–967. [Google Scholar] [CrossRef]
  24. Patankar, T.V. Numerical Heat Transfer and Fluid Flow; Hemisphere Publishing Corporation: New York, NY, USA, 1980. [Google Scholar]
  25. Kuipers, J.A.M.; van Uuin, K.J.; van Beckum, F.P.H.; van Swaaij, W.P.M. A numerical model of gas-fluidized beds. Chem. Eng. Sci. 1992, 47, 1913–1924. [Google Scholar] [CrossRef]
  26. Zou, L.M.; Guo, Y.C.; Chan, C.K. Cluster-based drag coefficient model for simulating gas-solid flow in a fast-fluidized bed. Chem. Eng. Sci. 2008, 63, 1052–1061. [Google Scholar] [CrossRef]
  27. Shi, X.; Sun, R.; Lan, X.; Liu, F.; Zhang, Y.; Gao, J. CPFD simulation of solids residence time and back-mixing in CFB risers. Powder Technol. 2015, 271, 16–25. [Google Scholar] [CrossRef]
  28. Wu, G.R.; Zuo, Z.F.; Li, Y.G.; Israr, M. Improvement of relative DEM time step range in fast fluidization simulation of Type-A FCC particles. Processes 2023, 11, 1155. [Google Scholar] [CrossRef]
  29. Li, J.; Kwauk, M. Particle-Fluid Two-Phase Flow: The Energy-Minimization Multi-Scale Method; Metallurgical Industry Press: Beijing, China, 1994. [Google Scholar]
  30. Yang, N.; Wang, W.; Ge, W.; Li, J.H. CFD simulation of concurrent-up gas-fluid flow in circulating fluidized beds with structure-dependent drag coefficient. Chem. Eng. Sci. 2003, 96, 71–80. [Google Scholar] [CrossRef]
  31. Weber, J.; Bobek, M.; Breault, R.; Mei, J.; Shadle, L. Investigation of core-annular flow in an industrial scale circulating fluidized bed riser with electrical capacitance volume tomography (ECVT). Powder Technol. 2018, 327, 524–535. [Google Scholar] [CrossRef]
  32. Hensler, T.; Firsching, M.; Bonilla, J.S.G.; Wörlein, T.; Uhlmann, N.; Wirth, K.E. Non-invasive investigation of the cross-sectional solids distribution in CFB risers by X-ray computed tomography. Powder Technol. 2016, 297, 247–258. [Google Scholar] [CrossRef]
Figure 1. Five variations and their region division of particle-grid overlap.
Processes 11 02977 g001
Figure 2. Particle location and mean porosity with slugging.
Processes 11 02977 g002
Figure 3. Particle location and mean porosity without slugging, case 3.
Processes 11 02977 g003
Figure 4. Particle velocity distribution below 0.01 m in slugging case 2.
Processes 11 02977 g004
Figure 5. Particle velocity distribution below 0.01 m in non-slugging case 3.
Processes 11 02977 g005
Figure 6. Outlet solid flux with slugging.
Processes 11 02977 g006
Figure 7. Outlet solid flux without slugging.
Processes 11 02977 g007
Figure 8. Porosity at side and central area in the tubular riser, case 1.
Processes 11 02977 g008
Figure 9. Radial porosity distribution with slugging.
Processes 11 02977 g009aProcesses 11 02977 g009b
Figure 10. Radial porosity distribution for non-slugging case 3.
Processes 11 02977 g010
Table 1. Fixed parameters for particle and gas.
ParticleGas
Density ρp = 930 kg·m−3Viscosity μg = 1.7 × 10⁻⁵ N·s·m−2
Particle diameter dp = 54 μmDensity ρg = 1.28 kg·m−3
Minimum porosity εmf = 0.45CFD time step Δtg = 2 × 10⁻⁶ s
Stiffness Coef. κ = 10 N·m−1
Restitution Coef. ξ = 0.9
Friction Coef. f = 0.3
Smooth length h = 2.5 dp
Cutoff distance H 0 = 0.4 nm
DEM time step Δtp = 2.5 × 10⁻⁷ s
Disclaimer/Publisher’s Note: The statements, opinions and data contained in all publications are solely those of the individual author(s) and contributor(s) and not of MDPI and/or the editor(s). MDPI and/or the editor(s) disclaim responsibility for any injury to people or property resulting from any ideas, methods, instructions or products referred to in the content.

