Article

Product Development Studies of Cranberry Seed Oil Nanoemulsion

1
Department of Pharmaceutics, College of Pharmacy, King Saud University, Riyadh 11451, Saudi Arabia
2
Department of Pharmacognosy, College of Pharmacy, Prince Sattam Bin Abdulaziz University, Al-Kharj 11942, Saudi Arabia
3
Department of Pharmaceutics, College of Pharmacy, Prince Sattam Bin Abdulaziz University, Al-Kharj 11942, Saudi Arabia
4
Department of Pharmacy Practice, College of Pharmacy, AlMaarefa University, Ad Diriyah 13713, Saudi Arabia
*
Author to whom correspondence should be addressed.
Processes 2022, 10(2), 393; https://doi.org/10.3390/pr10020393
Submission received: 24 January 2022 / Revised: 5 February 2022 / Accepted: 11 February 2022 / Published: 18 February 2022
(This article belongs to the Special Issue Drug Delivery Systems: Theory, Methods and Applications)

Abstract

:
Cranberry seed oil (CSO) can be used in various skin diseases, perhaps due to the presence of ω-3, ω-6, and ω-9 fatty acids. In addition, tocotrienols (vitamin E) has demonstrated powerful antioxidant activity. The combined application of CSO nanoemulsions open a promising avenue for skin conditions. The goal of this work was to create a nanoemulsion (NE) containing CSO and test its stability and in vitro release. To make NE formulations (CNE1-CNE6), the aqueous titration method was used. Following the creation of NE formulations, we selected the CNE4 formulation, which had a mean droplet size of around 110 nm, a narrow size distribution (PDI < 0.2), a steady zeta potential (−34.21 mV), and a high percentage transmittance (>99%). Furthermore, electron microscopy imaging revealed nanosized spherical droplets without any aggregation in the CNE4 formulation, which showed high entrapment efficiency (>80%). Densitometry analysis confirmed linoleic acid (RF 0.62) as a major component of CSO using toluene–acetone–glacial acetic acid (90:9:1 v/v/v) as a mobile phase. Nanogel had a three-fold greater cumulative drug permeation through the skin than neat CSO. This study shows that a unique CSO delivery technique can be used to treat skin diseases.

1. Introduction

Cranberry (Vaccinium macrocarpon) is a perennial shrub native to North America that belongs to the Ericaceae family. Being one of the major agricultural cash crops for edible berries, it is mostly cultivated in different parts of USA, Canada, and Turkey [1]. Dark pink and white flowers attract insects for the pollination, further producing sour-tasting red or pink appealing berries [1]. Cranberry fruit subsidizes nutritional value and offers multiple functional and tremendous neutraceutical profits [2]. Cranberry seeds are potential source of cranberry seed oil (CSO), which is a very stable, light, and non-greasy oil [2]. CSO is commercially used in the manufacturing of lip balms, cream, lotions, and facial serums. The CSO is made up of a unique blend of ω-fatty acids (ω-3, ω-6, and ω-9), tocols (tocopherols and tocotrienols), and a high concentration of antioxidants. The oil has a high amount of α-linolenic acid (30–35%) and linoleic acid (35–42%), followed by oleic acid (20–25%), which gives it a pleasant flavour and good oxidative stability [3]. Consumption of polyunsaturated fatty acids (PUFAs), such as ω-6 and ω-3 fatty acids, has been shown to protect against cancer and autoimmune illness [4,5]. Furthermore, CSO contains high levels of tannins, anthocyanins, flavonoids, and phenolic acids, all of which have antioxidant, anticancer, and anti-inflammatory properties. Because of its high amount of essential fatty acids (EFAs) and antioxidants, CSO are widely used as significant components in cosmeceuticals [6,7,8]. Skin inflammatory disorders may benefit from CSO.
Linoleic acid (LA), cis Δ 9,12-octadecadienoic acid is a polyunsaturated ω-6 fatty acid, which is considered as main component accounts for 35 to 42% of CSO [7,8]. LA is one of the most favoured fatty acids used in cosmeceuticals as it cannot be synthesised by the body, therefore preferred as emollients for skincare products. At the same time, LA has a number of health-promoting properties, including antiatherogenic and anticarcinogenic activities, lessening catabolic effects of immune stimulation and ability to boost growth promotion [6,8]. CSO-based medications are said to have a minimal risk of major side effects, are inexpensive, and are easily accessible to customers. Despite all of the above applications, the usage of LA or CSO is restricted because of their limited thermal stability and poor aqueous solubility, which limits their clinical applications and hinders drug development.
The nanotechnology provides a prodigious opportunity to folklore medicines in order to improve their efficacy and delivery potentials [9,10]. Oil-in-water (O/W) NEs are safe and offer several advantages including encapsulation of delicate hydrophobic molecules, their controlled release, good skin penetration, prevent drug degradation, improved stability and bioavailability, and low-cost manufacturing [9,10,11,12,13]. CSO can be investigated as a possible candidate for skin diseases based on its profile of high-value chemicals and nutrients. Recently, the NE formulations of various essential oils, such as clove oil, niaouli essential oil, cinnamon oil, lavender oil, and nutmeg oil have been investigated in literature [11,12,14,15,16,17]. However, the NE formulations of CSO or its biomarker molecules have not been explored in the literature, to the best of the author’s knowledge. As a result, the purpose of this research was to design, describe, and evaluate CSO NE formulations for skin delivery. For formulation development, we used an aqueous titration approach, and for all analyses, we used a high-performance thin-layer chromatographic (HPTLC) method. Our data imply that CSO NEs may play a role in skin delivery.

2. Materials and Methods

2.1. Drugs and Chemicals

LA (purity ≥ 99%) was procured from “Sigma Aldrich (St. Louis, MO, USA)”. CSO was procured from “Jolly Chic (Riyadh, Saudi Arabia)”. Propylene glycol monocaprylate type II (Capryol-90®), diethylene glycol monoethyl ether (Carbitol®), polyoxyl 35 castor oil (Cremophor-EL®), caprylocaproyl polyoxyl-8 glycerides (Labrasol®), propylene glycol dicaprolate/dicaprate (Labrafac®), and polyglyceryl-3 dioleate (Pleurol oleique®) were procured from “Gattefosse (Lyon, France)”. Polyoxyethylenesorbitan monolaurate (Tween 20®), polyoxyethylenesorbitan monooleate (Tween 80®), polyethylene glycol-200 (PEG-200), and ethanol were procured from “Hi-Media (Mumbai, India)”. HPLC grade toluene, acetone, and glacial acetic acid were procured from “Fluka Chemica (Darmstadt, Germany)”. Deionized water (DW) was procured from “Milli-Q water purification system (Millipore, Billerica, MA, USA)”. Dialysis membrane (MWCO: 12000–14000 D) was from “Sigma Aldrich (St. Louis, MO, USA)”. All other chemical and reagents used for the study were of analytical grade and procured from an approved vendor.

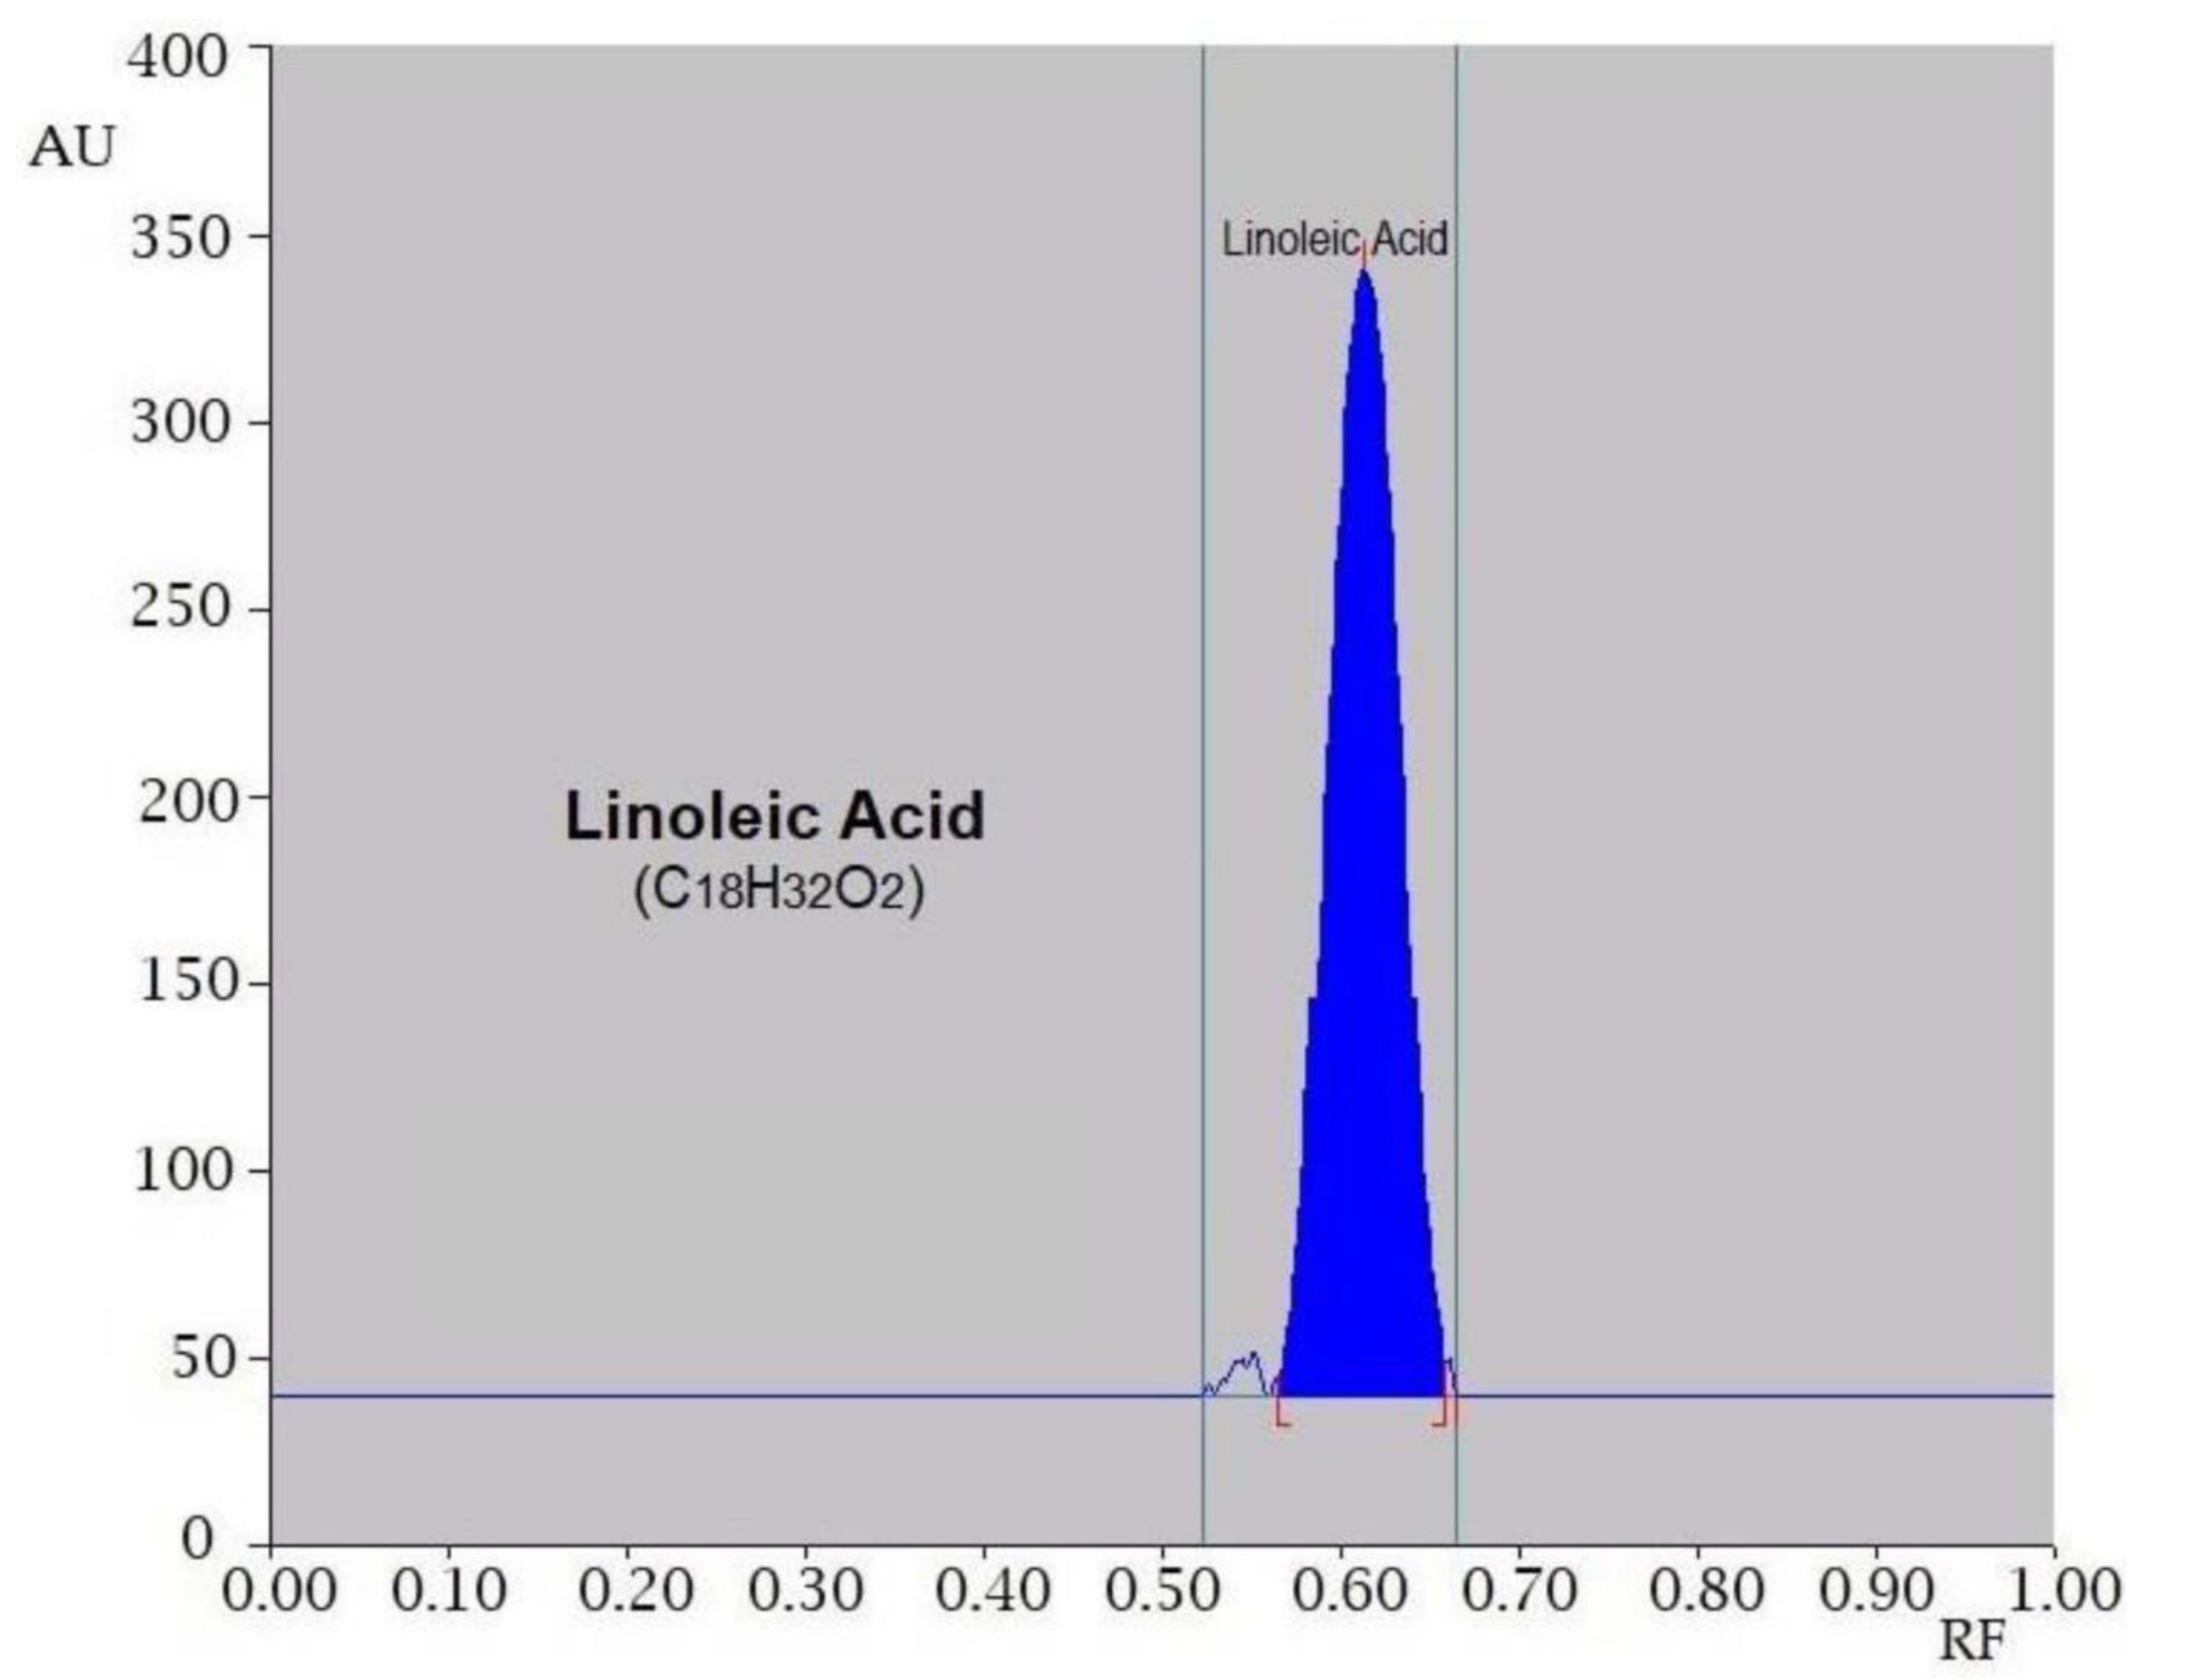
2.2. Analytical Method

The biomarker compound of CSO i.e., LA was quantified by our developed HPTLC method. In brief, LA aliquots were smudged in the form of bands of 5 mm on a precoated “silica-gel aluminium plate 60F254 (20 cm × 10 cm with 0.2 mm thickness, E-Merck, Darmstadt, Germany)” by using “CAMAG Linomat-V sample applicator (CAMAG, Muttenz, Switzerland)”. The optimized mobile phase was comprised of toluene–acetone–glacial acetic acid (90:9:1 v/v/v). To visualize the zones, developed plates were dried and sprayed with anisaldehyde- sulphuric acid reagent. Densitometric scanning was carried out on CAMAG TLC scanner III in the absorbance mode at 366 nm. The method was employed for the all drug estimations.

2.3. Component Screening

Components were screened based on the solubility profile of CSO. CSO is itself oil and so the solubility determination in various oils was not required. However, its solubility in surfactants and cosurfactant was carried out by taking an excess amount of the sample (CSO) in 2 mL of each of the surfactant and cosurfactant in a 5 mL stoppered glass vials. The obtained samples were gently vortexed, and then kept at 37 ± 1.0 °C in an isothermal shaker (Remi International, Mumbai, India) for 72 hrs. The equilibrated samples were extracted and centrifuged for 15 min at 3000 rpm. The supernatant was removed and filtered through a membrane filter with a 0.45 µm pore size. The concentration of CSO in each component was determined using the proposed HPTLC technique at 366 nm.

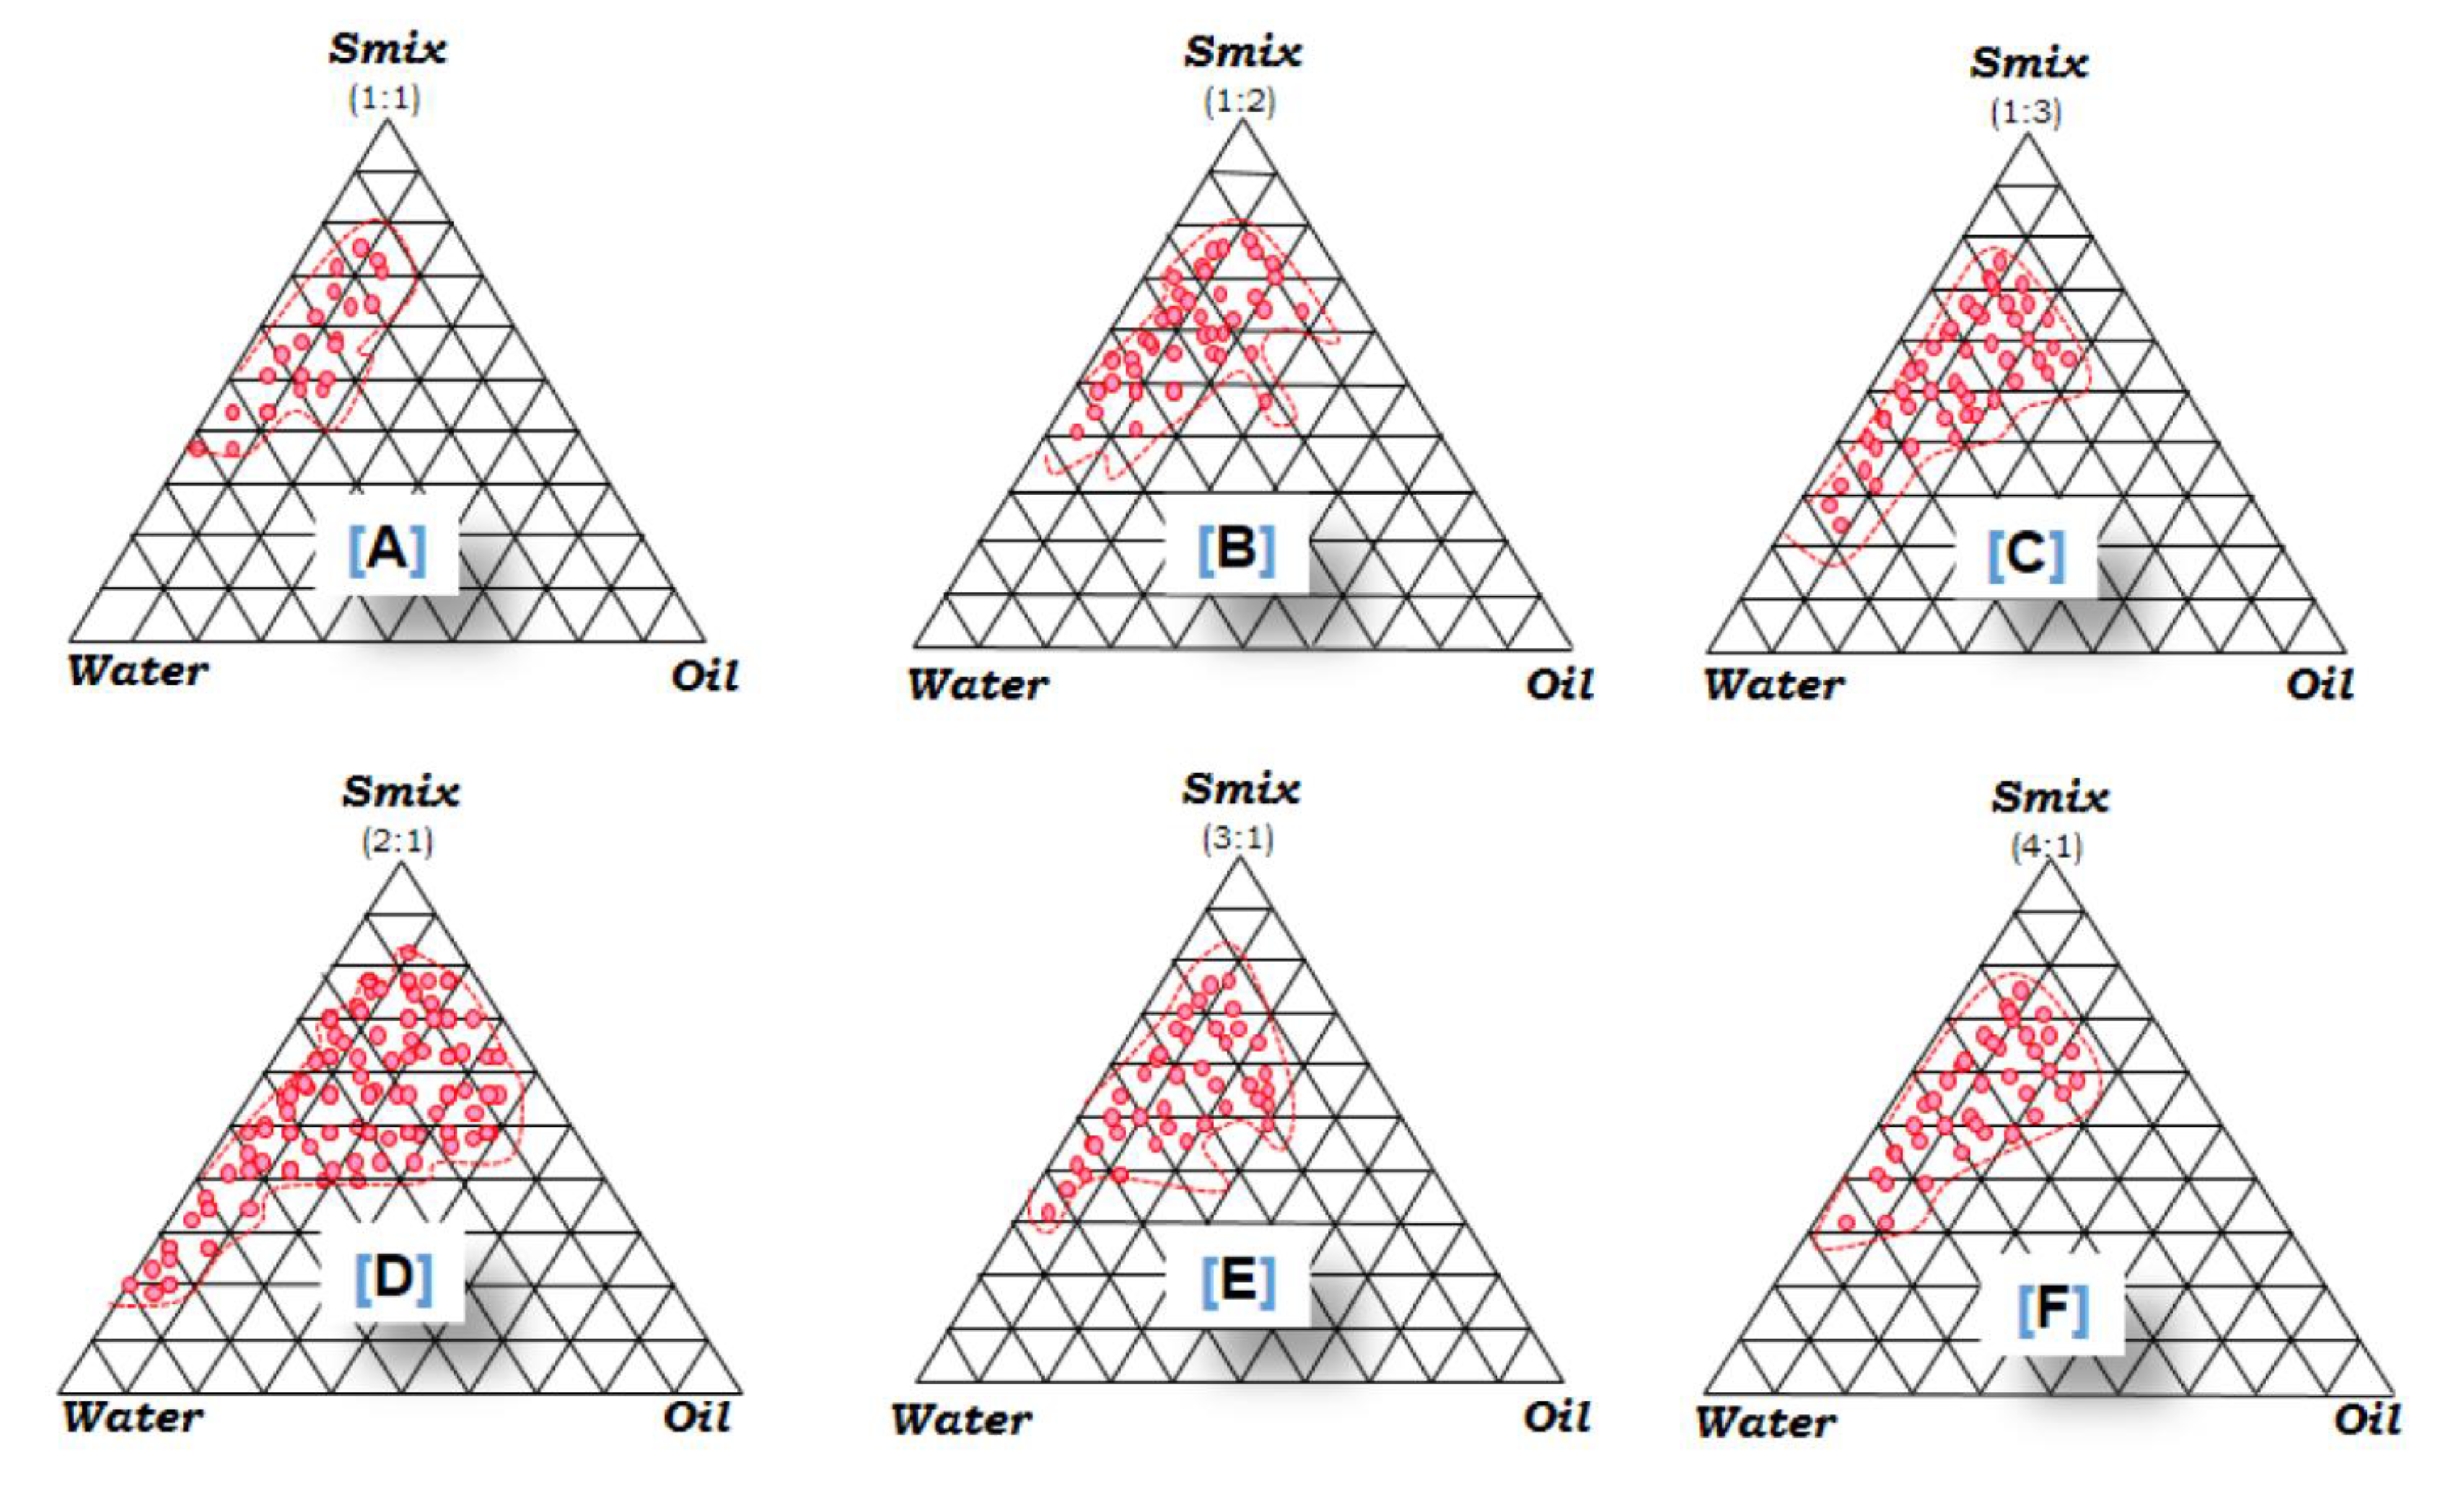
2.4. Construction of Pseudo-Ternary Phase Diagrams

The pseudo-ternary phase diagram (PPD) was generated using the aqueous titration methodology based on the results of the CSO solubility investigation [11]. The DW was mixed with different mixtures of surfactant (Labrasol) and co-surfactant (Carbitol) (Smix) in the ratios of 1:0, 1:1, 1:2, 1:3, 2:1, 3:1, and, 4:1, on the basis of increasing concentration of cosurfactant with respect to surfactant and increasing the concentration of surfactant with respect to cosurfactant for detailed study of the PPD [18]. Oil and specified Smix ratios were carefully blended in variable ratios from 1:9 to 9:1 in distinct vials for each PPD. Sixteen distinct oil and Smix mixtures (1:9, 1:8, 1:7, 1:6, 1:5, 2:8, 1:3.5, 1:3, 3:7, 1:2, 4:6, 5:5, 6:4, 7:3, 8:2, and 9:1 w/w) were prepared to cover the maximum ratios for study to clearly identify the phase boundaries. For each combination of oil and Smix, a slow titration with DW was performed individually. The amount of DW added was adjusted to produce aqueous concentrations ranging from 5–95% of the total volume at 5% intervals [18,19]. PPD was used to depict the physical state of the NEs, with one axis indicating the aqueous phase, the other representing oil, and the third representing the Smix ratio.
In a nutshell, CSO (oil) and a mixture of Labrasol (surfactant) and Carbitol (co-surfactant) were chosen in various weight ratios (1:0, 1:1, 1:2, 1:3, 2:1, 3:1, and 4:1). To cover the maximum ratios, combinations of oil phase and particular Smix were generated progressively at varying ratio (9:1, 8:2, 7:3, 6:4, 5:5, 4:6, 3:7, 2:8, 1:9 w/w) for each PPD, allowing the boundary between the phases formed during PPD to be properly delineated. DW was gradually increased until the turbidimetric changes were seen [19,20]. The transparency, isotropy, and boundaries between homogeneous and heterogeneous mixtures (i.e., single-phase, clear, fluid, and homogeneous formulation) were all carefully studied in each set. The greater the spectrum of emulsion indicates higher hydration in PPD. PDD with one axis represented an aqueous phase, the other one oil phase, and the last one represented specific Smix in fixed ratios was constructed [21]. PCP triangular software (Pune, India) was used to construct PPDs. The optimal percentage of the emulsion composition showing significant clarity and transparency was chosen for further studies.

2.5. Formulation Development

To produce the CSO NEs, the micro/nano-emulsion approach described by Muller et al. was used [22]. Different o/w NE formulations were selected from the NE region and designated for further studies, according to PPDs. In summary, the appropriate volumes of the oily phase/drug (CSO) and Smix were chosen based on preliminary trials, and the dropwise addition of DW was continued with gentle mixing until a transparent liquid formed. All formulations were prepared accordingly and stored for 24 h in tightly sealed containers at 25 °C (±0.5). Samples those remained fully transparent with no signs of precipitation and phase separation were taken forward for further studies. In next step, Carbopol 934 (1% w/v in DW) was added with mechanically stirring at 250 rpm for 24 h. The pH of the formulations was maintained in the range of 4.93–5.12 by the addition of 0.5% w/v of triethanolamine in order to mimic the skin conditions. Formulations were visually examined for clarity, transparency, and the homogeneity.

2.6. Characterization of Prepared CSO NEs

2.6.1. Thermodynamic Stability

Thermodynamic stability was performed on a centrifuge machine (6000 rpm for 30 min) for developed NEs to check their physical integrities like phase separation, creaming or cracking [19]. NEs passed above tests were under treated heating (45 °C) and cooling (0 °C) (H/C) cycles 8 hourly for the next two days. Those survived after H/C cycles were given 6 cycles of freeze-thaw (F: −21 °C)/(T: 25 °C) treatment for 48 h. At the outset, samples retained their thermodynamic stability were only selected for further evaluations.

2.6.2. Entrapment Efficiency (EE)

The EE of the CSO NE was estimated on the basis of LA present in the formulation. Non-capsulated CSO was removed by centrifuging samples at 6000 rpm (Thomas Scientific Centrifuge, 5418-R, St. Louis, MO, USA) with an ambient condition maintained at 4 °C for 30 min and supernatant was harvested, diluted with phosphate buffer (pH 7.4) and estimated for LA by HPTLC method at 366 nm. EE (%) was determined by using below formula [12]:
% EE   = ( C t C r ) C t × 100
where ‘Ct’ is the total concentration of capsulated and non-encapsulated LA and ‘Cr’ is the concentration of free LA in CSO NE.

2.6.3. Light Transmittance and pH

The goal of the test was to determine the transparency of prepared NE, hence the all prepared CSO NE had their light transmittance (%) assessed. The experiment was conducted using UV-Vis spectrophotometer set to 650 nm with DW as a blank [23]. The pH of CSO NE, on the other hand, was determined using a bench-top digital pH meter (Mettler Toledo, Darmstadt, Germany).

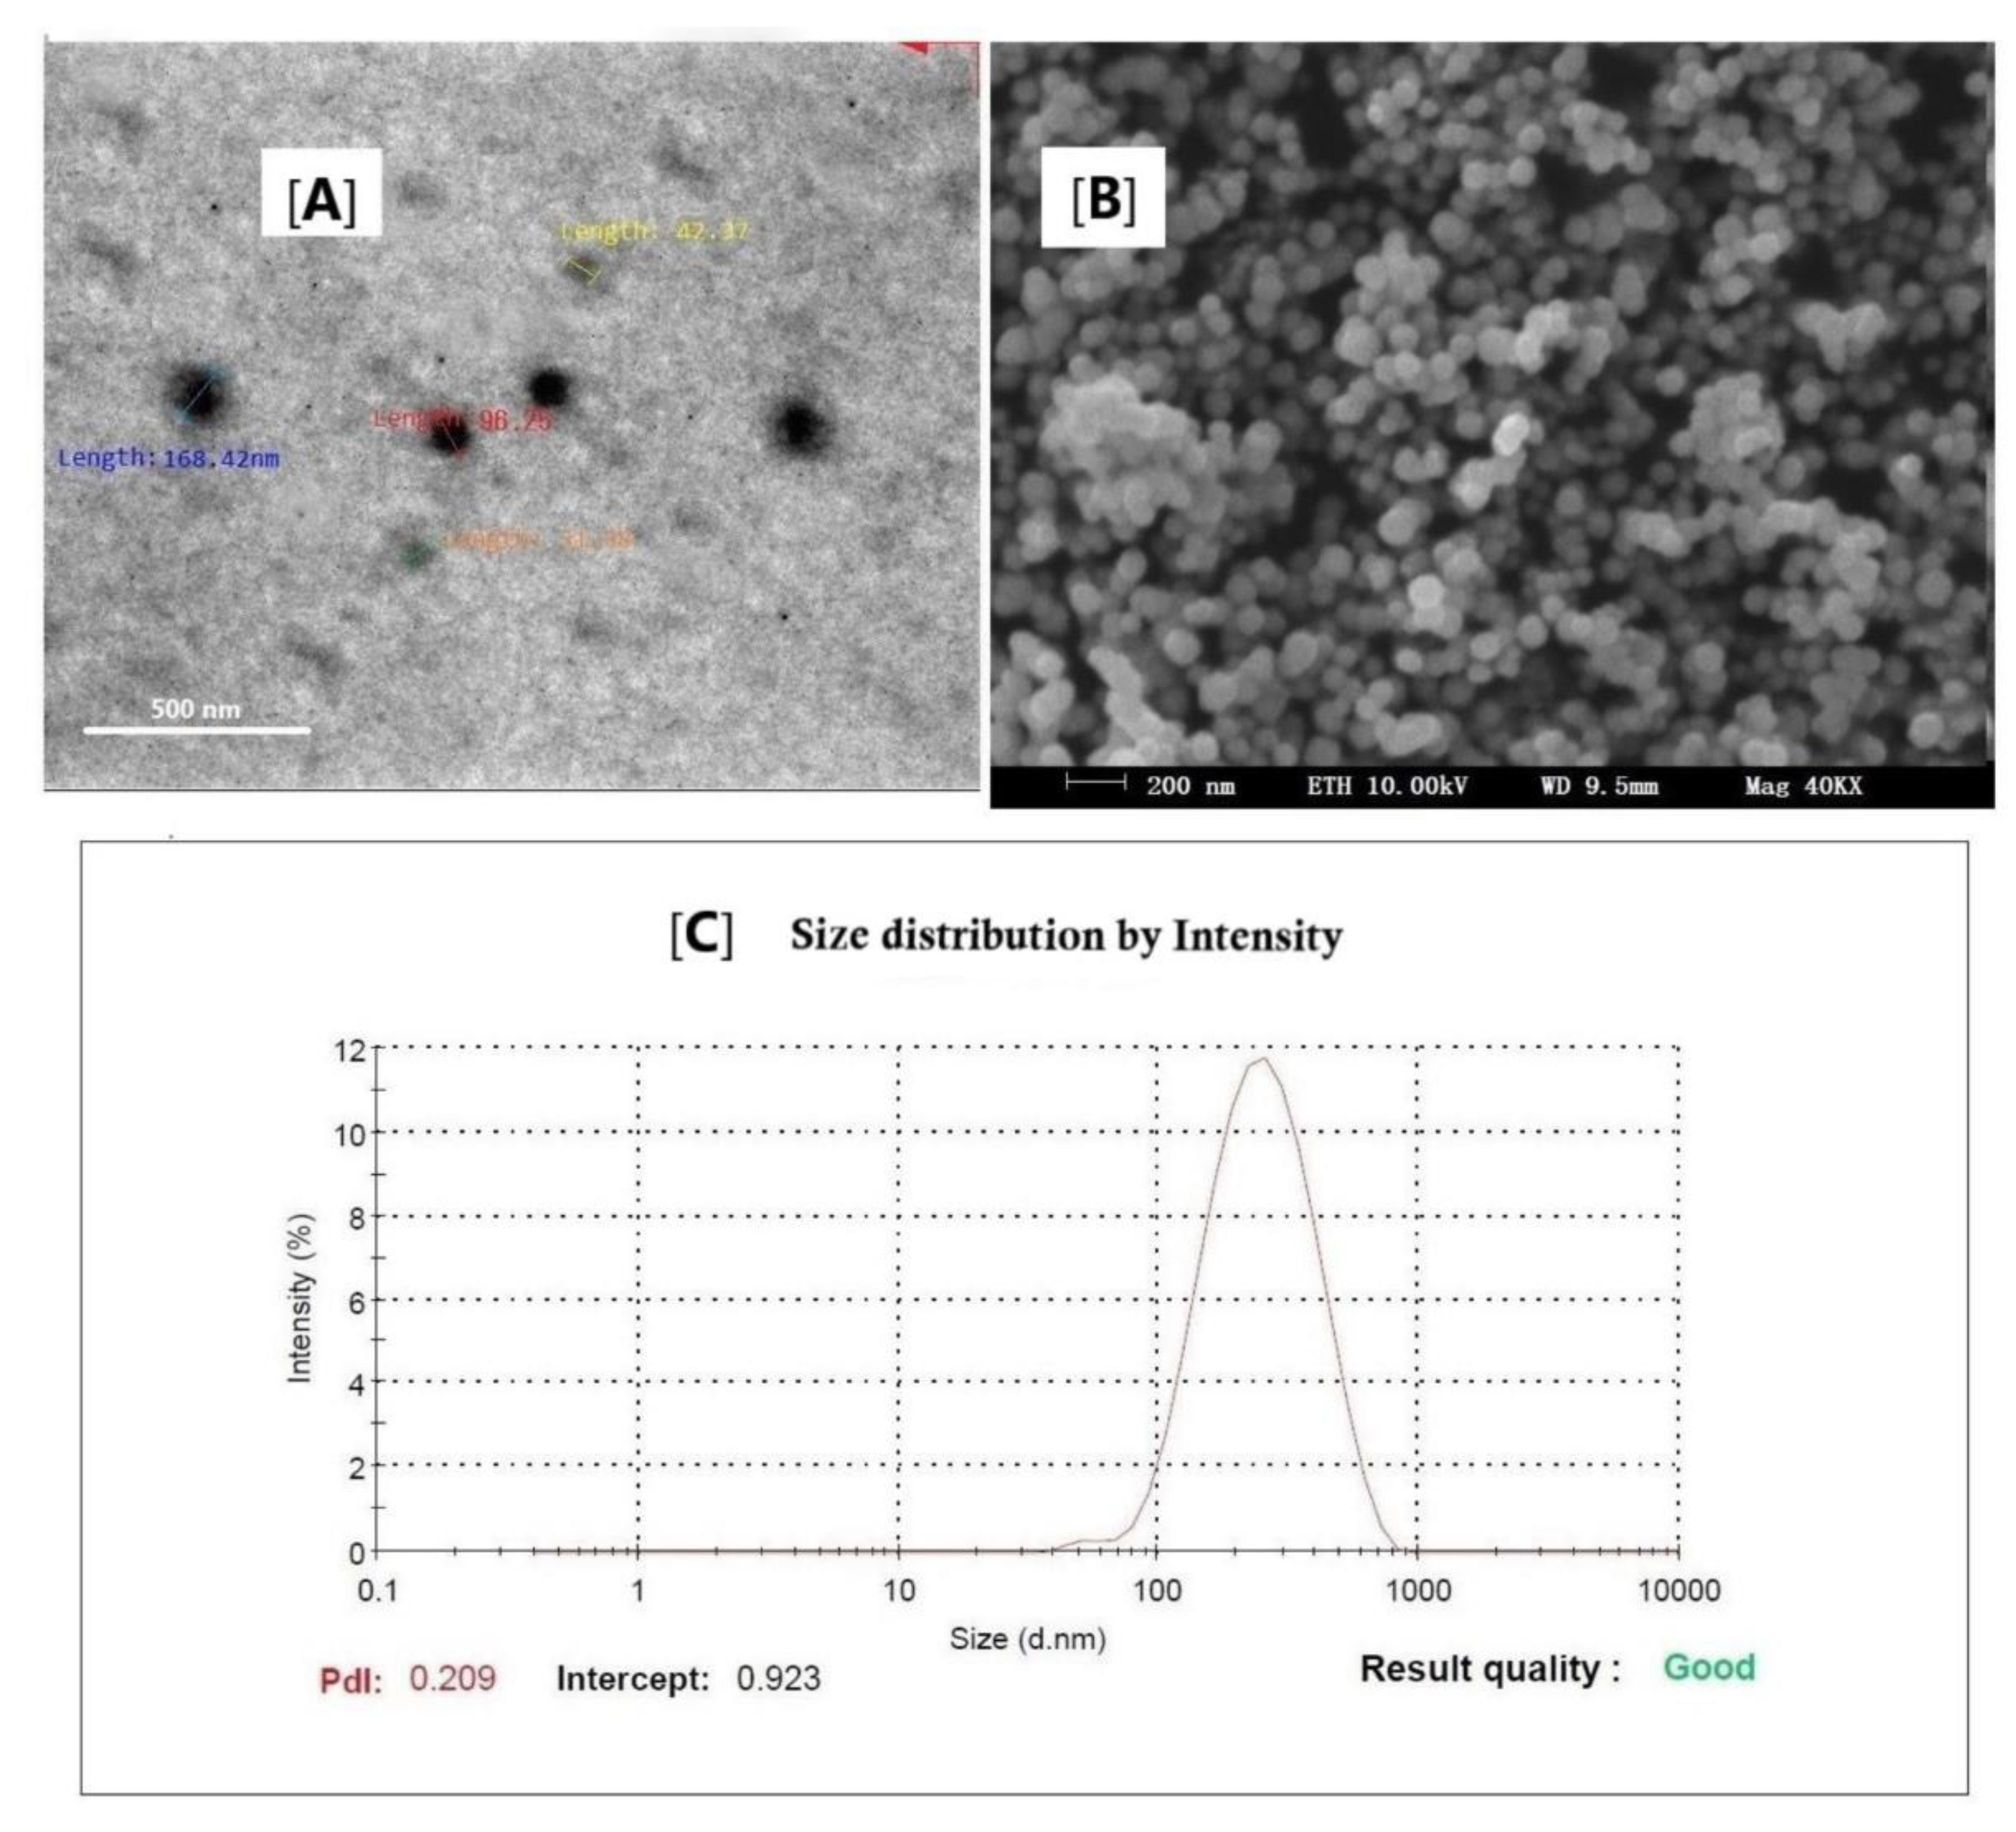
2.6.4. Size, Polydispersity Index (PDI), and Surface Charge

Particle size (z-averages), size distribution, and PDI of CSO NE were determined using a dynamic light scattering (DLS) method with a Nano-ZS zetasizer operated at 25 °C (ZEN 3600, Malvern Instruments, Darmstadt, Germany) based on the laser light scattering phenomenon [21]. Before the size analysis, the trial samples were adequately diluted at 1:100 (NE/water) and left at room temperature for 5 min. However, the zeta potential (ζ) was determined by Nano-ZS using laser doppler velocimetry technique. Before transferring samples to the apparatus for charge measurements, they were diluted (1:100) with 1 mM KCl (pH 7.0). All measurements were done in triplicate and the results were recorded separately as mean ± SD.

2.6.5. Electron Microscopy

Transmission electron microscopy (TEM) was conducted to confirm the internal structure and physical size and surface morphology of trial formulation using electron microscope operating at accelerating voltage of 200 kv (JEM 1400-Plus, JEOL Ltd., Tokyo, Japan). Properly diluted (1:100) and filtered test sample was gently placed over copper grid (200 mesh), then stained with 2% phosphotungstic acid and after drying finally observed under the microscope. The external surface and physical size of CSO NE was examined by scanning electron microscopy (SEM) (JEM 7600F, JEOL Ltd., Tokyo, Japan). Trial NE was freezed at −196 °C in liquid nitrogen and then sublimed at −90 °C for 10 min. In next the step, trial samples were sputtered at 10 mA for 30 s and images were finally captured.

2.6.6. Rheology

The prepared NE’s viscosity was determined using a “Brookfield Viscometer (DVELV Ultra, Brookfield Engineering Lab, Middleboro, MA, USA)” set to 25 °C (±0.3) and 100 rpm, and the results were analyzed using “Rheocalc software (Version #2.6)”.

2.7. Drug Release Study

The drug release investigation was carried out with a dialysis bag fitted over a modified Franz’s diffusion cell (FDC) (configured area: 7.16 cm2; volume: 37 mL of receiver chamber) [24]. Before the experiment, a dialysis membrane (2.4 nm, 12,000–14,000 Da) was soaked in dissolution media (7:3; acetate buffer pH 5.4: ethanol) and put above FDC. CSO NE formulations were accurately weighed and deposited in a donor compartment with dissolution media in the receptor compartment. The solution in receptor side was held at 37 °C (±0.5) for the studies, with a stirring magnetic bead speed of 500 rpm. The sample aliquots (100 μL) were extracted from the receiver compartment through side tube at intervals of 0, 0.5, 1, 2, 4, 6, 8, 10, 12, 24, 36, and 48 h and replaced by an equal volume of freshly prepared buffer each time. The samples were analysed by HPTLC at 366 nm. Statistical analysis was performed by using one-way analysis of variance (ANOVA).

2.8. Drug Permeation

Excised Wistar-rat abdominal skin was used to study permeation over skin. The full thickness skin of the rat was obtained, cleaned with normal saline, and stored in a deep freezer at −20 °C. The study planned to use FDC to create close contact with the CSO NE on the donor compartment. To conduct experiments, preserved skin was brought to room temperature and then mounted over FDC in-between the donor and receiver compartments with the stratum corneum side facing upward towards the donor compartment and the dermal side facing the receiver compartment filled with ethanolic acetate buffer (pH 5.4) maintained at 37 (±1) °C and stirred at 100 rpm. 1 mL of C SO NE formulation was placed in the donor compartment, and aliquots (1 mL) were taken from the receiver cell at predetermined intervals (0.5, 1, 2, 3, 4, 5, 6, 7, 8, 9, 10, 12, 14, 16, 24, and 48 h), filtered through a 0.45 μm membrane filter, and chromatographically analyzed at 366 nm using a developed HPTLC method. For each formulation, the cumulative amount of medication permeated per unit area through excised skin (μg/cm2) was plotted as a function of time (t). The slope of the linear component of the permeation graph with divided by the area of FDC to get steady state flux (Jss) values. The permeability coefficient (Kp) was estimated by dividing Jss by the initial drug concentration in the donor cell (Co) using the following equation:
K p = J ss C 0
Using the following equation, the enhancement ratio (Er) was computed by dividing the Jss of test (trial) formulation by the control:
E r = J ss   of   test   formulation J ss   of   control

2.9. Product Stability

Mechanical stress, manufacturing procedures, excipients, storage conditions, heat, moisture, and pH are all obvious ways for a product to deteriorate. As a result, it was decided to test the stability of the produced CSO NE in order to assure the physical integrity of the system (by analysing aggregation, precipitation, fusion, and degradation upon storage). The test formulations were kept in glass vials at two different temperatures: 40 (±2) °C (in the stability chamber) and 25 (±2) °C (at room temperature) at ambient humidity, and evaluated for particle size, zeta potential, and physical appearance in the time slots specified [11,12].

2.10. Statistical Analysis

Statistical analyses were accomplished by one-way ANOVA with Tukey’s multiple comparisons test using p < 0.05 (95% C.I.) as a statistical significance threshold unless mentioned specifically. All statistical analyses were performed in triplicate using GraphPad prism software (v.6, San Diego, CA, USA).

3. Result and Discussion

3.1. Analytical Method

For all estimations, including the quantification of LA in prepared CSO NE and as crude oil (CSO), a robust HPTLC method was designed and employed. Densitometric examination in reflectance mode at 366 nm revealed a sharp chromatogram (RF: 0.62 ± 0.03) in the toluene–acetone–glacial acetic acid solvent system (90:9:1 v/v/v) (Figure 1). Using the proposed HPTLC method, the amount of LA was determined to be 38.20 ± 1.21%.

3.2. Component Screening

CSO is itself chosen as oily phase (contained LA as a major constituent), and its solubility in various solvents, surfactants, and cosurfactants (such as Tween-20, Tween-80, Labrasol, PEG-200, Capryol-90, Carbitol®, ethanol, Cremophor-EL, Labrafac, and Carbitol) was determined by using standard solubility procedures [19]. The quality attributes of (i) lowering the interfacial tension to a very small value to aid the dispersion process, (ii) providing a flexible thin film that can readily surround droplets, and (iii) providing the correct curvature at the interfacial region for the desired o/w NE were used to select a suitable surfactant in NE development [18,19]. The visual appearance of the NE dispersions varied from somewhat turbid with a bluish tint to foggy milky appearance, indicating the nature of the dispersed phase in titrated samples.

3.3. PPDs

The goal of constructing PPD by using aqueous titration method was to outline the range of NE regions with following observations, (i) formation of mono/bi-phasic system was confirmed by visual observation, (ii) in a case where turbidity appeared the formulation was considered as biphasic, (iii) however in a case where clear and transparent mixture were visualized after stirring the formulation was considered as monophasic system [18]. To determine the o/w phases required for the optimization of NEs, PPDs were created separately for each Smix combination (Figure 2). When a high concentration of Smix was utilized, a large nanophasic area (o/w) appeared. The surface area (mm2) of CSO as a function of phase behaviour was recorded in various surfactant and cosurfactant and combinations thereof, eventually to identify the best possibility to optimize a stable NE. Table 1 represents the studied phasic area, as Labrasol (143.12) > PEG-200 (97.08) > Tween 80 (94.63) > Tween 20 (77.11) > Capryol-90 (81.74) > Carbitol (73.45) > Cremophor-EL (42.16) > ethanol (35.22) > Labrafac (28.78). On the basis of high solubility (phasic area) Labrasol and Carbitol were finally selected as surfactant and cosurfactant for NE preparation. During the experiments, it was observed that, when Labrasol was used alone, it precipitated undesired liquid crystals (LCs) in PPD. Therefore, due the above reason, a cosurfactant was introduced to expand their NE region with reduction in LCs formation. The NE domain obtained by these trials at different ratios of surfactant (Labrasol®) to cosurfactant (Carbitol) were plotted in the phase diagram (Figure 2). The Smix (1:0) was unable to break the interfacial tension with CSO, confirmed by the presence of more LCs in the PPD. Adding Carbitol (cosurfactant) to Labrasol (surfactant) in 1:1 ratio (Smix), made interfacial film more flexible to accommodate the drug and LCs started disappearing. The phase behaviour study revealed that, when the surfactant to cosurfactant ratio was 1:1, the maximum quantity of oil can be included in the NE system. On increasing the cosurfactant concentration in Smix ratio (1:1 < 1:2 < 1:3), LCs were degenerated with proportionate increase in nanophasic area (Figure 2A–C). Conversely, on increasing the surfactant concentration in Smix ratio (2:1 < 3:1 < 4:1), LCs were increased and a small NE region was seen in PPD (Figure 2D–F). Due to further reduction in the interfacial tension and increase in the fluidity at the interface, a slight increase in entropy of the system would have been occurred, that eventually encapsulated more CSO in the lipophilic part of the surfactant monomers [18,25]. An increase in the nanophasic area was irrelevant when the surfactant concentration in Smix ratio was increased (>2:1) (Figure 2D). This LCs phase was attributed due to the presence of high surfactant concentration (Labrasol), which actually suppressed the effect of cosurfactant. The free energy of NE formation is therefore somehow dependent on the extent to which the Smix submissively reduces the interfacial tension of oil and water, and the dispersion entropy [18,19]. Therefore, in such circumstances, the formation of NEs will be spontaneous and it will produce physically stable NEs [18,19,20]. Those formulations were selected from phase diagrams, which can accommodate high quantity of oil with the low concentration of Smix.

3.4. Formulation Development

From each PPD, different formulations were selected from the NE region. The entire range of NE was covered and the formula that used the minimum concentration of Smix for its NE formation was selected from the constructed diagrams (Table 2). The CSO (oil) was taken and a measured quantity of Smix was added in prescribed ratio. Adopting aqueous titration method, the DW was dropwise added to the mixture till a clear and transparent dispersion was obtained. According to the PDD, the maximum quantity of CSO that solubilized was approximately 23.6 ± 3.8% v/v by incorporating Smix around 56.4 ± 5.3% v/v. The types of non-ionic surfactants used in the formulation, demonstrated a substantial effect over mean diameter and their size distributions.

3.5. Characterization of Prepared CSO NE

3.5.1. Thermodynamic Stability

To identify the metastable form (that is responsible for the instability of formulations), thermodynamic stability test was performed and results of those formulations are represented in Table 2. In brief, selected formulations were undertaken for the stability evaluation (centrifugation, H/C, and F/T) using standard stability protocol. Out of 12 trial formulations, only 6 formulations (CNE1-CNE6) showed no signs of instability (i.e., creaming, cracking or phase separation). These passed formulations were further evaluated for size, charge, morphology, viscosity, and other parameters.

3.5.2. EE

EE stands for drug encapsulation ability, which is an evident physicochemical property of NEs [22]. Because of the greater solubility in excipients (less ordered recrystallization), a large amount of CSO was contained in the investigated NE (Table 3). The best formulation had a percentage entrapment of 80.29 (>80%) in this investigation, which could be owing to their lipophilic nature and greater loading capacity in stabilized formulations.

3.5.3. Light Transmittance and pH

As mentioned earlier, the purpose of the test was to measure the transparency of CSO NE on UV-Vis spectrophotometer. Transmittance (%) values approaching to the 100 percent is generally regarded as transparent. All test formulations appeared clear, transparent and easy to transmit the light. The highest value of % transmittance (99.18 ± 0.02%) was observed for CNE4, while CNE1 was found to have the lowest value of % transmittance (97.68 ± 0.09%). Their transparency was attributed due to the smaller size (<25% of the light’s wavelength). However, the pH values of the prepared of CSO NE were within the range (4.81 to 5.39).

3.5.4. Size, PDI, and Surface Charge

The size (z-averages), size distribution, and PDI results of CSO NE are represented in Table 3. From the Table 3, we can see that CNE4 formulas out of six is less than 110 nm in size was prepared by using Smix ratio of 2:1, which causes an improvement in cosurfactant molecules to penetrate the surfactant film (Figure 3). Further, it may reduce the fluidity and viscosity of the interface film, resulting miniaturization of the curvature radius of novel droplets and thereby generate a transparent system. Largest droplet was appeared for CNE2, may be due to the presence of high concentration of Labrasol (surfactant), which possibly formed a rigid interface. The inappropriate amount of Carbitol (cosurfactant) was found incapable to provide additional flexibility to the rigid film for the secondary nanosizing. Rendering to the electrical double layer theory, zeta potential values in the magnitude of ±30 mV indicate the potential stability of a dispersion [18], due to the moderate repulsion between similarly charged particles, thereby lessening chances of particle aggregation or flocculation. It was found that CNE4 formula have a zeta potential −34.21 mV which indicate the stability of this formula. A low PDI was observed for all CSO NEs indicated thought uniformity of the system. Finally, the mean particle size of optimized formulations (CNE1-CNE6) were ranging from 50–150 nm with the PDI values < 0.2 demonstrated the system had moderately narrow size of distribution.

3.5.5. Electron Microscopy

In many instances, TEM has been recognised as a powerful tool in order to analyze size and shape of droplets, and agglomeration propensity of the dispersed phase in isotropic systems [11,12]. Therefore, the internal structure and morphology of trial formulations were evaluated by TEM. TEM imaging was carried out for CNE4 formulation and recorded in Figure 3A, which revealed non-aggregated nanodroplets with uneven spherical shapes. The particles were appeared dark with a bright surrounding in a positive image under TEM. SEM study was conducted to critically examine the external surface and physical size of CSO NE. Figure 3B shows the SEM images for CNE4 in the presence of Labrasol and Carbitol with spherical morphology. The particle size was estimated for CNE4 formulation about 150 nm (with broad distribution) and 50 nm (with narrow distribution), respectively. The average particle size was estimated for CNE4 formulation about 110 nm (±5). According to the results, the presence of Labrasol (surfactant) and Carbitol (cosurfactant) were caused more particles due to suitable nucleation and the smaller size because of the promising effect of nanosizing. Electron microscopy finally revealed the uniform and spherical nature of CSO NE with varying size, ranging approximately from 50–150 nm.

3.5.6. Rheology

Different surfactants and co-surfactants utilized in the stabilization of NE compositions were associated with viscosity measurements. The mean viscosity of CSO NE formulations (95–284 cps) is shown in Table 3. The viscosity of formulation CNE4 was found to be moderate at 141.26 cps, making it rheologically appropriate for skin application.

3.6. Drug Release Study

To compare the optimized formulation with neat CSO, in vitro drug release was performed. The release profile of CSO NE was found to have improved significantly (p < 0.05) (i.e., the drug release was increased vividly when formulated as a NE). At the conclusion of 24 h, the cumulative percents of drug released were CNE4 (89.16) > CNE3 (83.06) > CNE5 (78.41) > CNE6 (74.50) > CNE2 (72.13) > CNE1 (69.28), while, the neat CSO (non-formulated) release was only 37.8%. The smaller particle size of the CSO (phytochemicals), which subsequently enlarged the surface area to the dissolution media and therefore effectively strengthened the drug solubilization potential, was attributed to the significantly high values of drug release from CSO NE.

3.7. Drug Permeation

The enhanced drug permeation was observed for CSO NE formulations as compared to the neat CSO (control). Formulation CNE4 was found most efficient in drug permeation rendering to the cumulative drug permeation, Jss, Kp, and Er (Table 4). The Jss of CNE4 and neat CSO were 46.71 μg/cm2/h and 18.33 μg/cm2/h, respectively. A three-fold increase in CSO permeability coefficient was observed for CNE4 formulation (0.529 × 10⁻² cm/h) as compared to the neat CSO (0.175 × 10⁻² cm/h). The enhanced drug permeation for all CSO NE formulations was possible due to the smaller droplet size and the presence of Labrasol (surfactant) and Carbitol (cosurfactant) in NEs compared to neat CSO [26,27]. In addition, Carbitol has been studied as a potent skin permeation enhancer [28,29]. Hence, the role of Carbitol might be greater in enhancing the drug permeation for all NEs compared to the neat CSO. Actually, NE enhanced the permeation of LA following the lipid pathway of stratum corneum. Here, neutral lipids are arranged as bilayers i.e., hydrophobic chains are facing towards the each other to constitute a lipophilic bimolecular facet [12]. CSO NE directly penetrated into the stratum corneum, and destabilized the bilayer structure by involving surfactant molecules present there eventually led enhanced LA permeability. At the same time, the hydrophilic domain exquisitely hydrated the stratum corneum, which finally led to enhanced percutaneous drug absorption. A high initial flux is always stared as beneficial since suitable quantity of phytoactives are fast released from nanoformulations to unveil prompt effect. Thus, we concluded that CNE4 were significantly ever better than a neat CSO towards enhancing the skin penetration, possibly due the synergistic effects of LA and Smix.

3.8. Product Stability

Three month stability study was conducted for selected CSO NE formulations and their data is recorded and analysed in Table 5. The droplet size of CNE4 formulation was not much affected, but a slight change has been observed for other formulations after a three months of storage, possibly due to aggregation of particles at regulated temperatures. Due to the protecting ability of surfactant at regulated temperature and humidity conditions, particles remain stable and accountable for the usage. Generally, aggregation accelerated with an increase in storage temperatures probably due to the physical destabilization of a dispersion system as a concern of energy input by the chronologically higher temperatures, and the energy input amplified the system kinetic energy which started particle collision.

4. Conclusions

In summary, we have designed CSO NEs containing, LA using aqueous titration method. Prepared with Labrasol and Carbitol, a NE formula was promising method to increase the solubility and dissolution rate of CSO. The most stable NE formulation (CNE4) consisted mostly of very fine droplets with uniform size distribution, and negative zeta potential. Stability study demonstrated that CNE4 formulation could be considered stable with comparatively low velocity of droplet migration. Nano dispersions (o/w NEs) could be considered as a relevant carrier for the inclusion of unexplored medical oils and other phytoactives. From this work, we finally conclude that, the optimized NE formulation (CNE4) could be imperative and worthwhile for the promising delivery of CSO in skin disorders. Moreover, these results encourage further studies about antipsoriatic activity of nanoemulsified CSO on experimental animals and their further scale up.

Author Contributions

Conceptualization, W.A.M. and F.S.; methodology, P.A., A.A. and S.A.; software, M.M.G.; validation, S.A., P.A. and W.A.M.; formal analysis, A.A.; investigation, P.A. and A.A.; resources, W.A.M.; data curation, P.A.; writing—original draft preparation, F.S.; writing—review and editing, S.A., W.A.M. and P.A.; visualization, W.A.M.; supervision, F.S.; project administration, F.S.; funding acquisition, W.A.M. All authors have read and agreed to the published version of the manuscript.

Funding

This research was funded by the Researchers Supporting Project (number RSP2022R516) at King Saud University, Riyadh, Saudi Arabia and The APC was funded by RSP.

Institutional Review Board Statement

Not applicable.

Informed Consent Statement

Not applicable.

Data Availability Statement

Not applicable.

Acknowledgments

Authors are thankful to Researchers Supporting Project (number RSP2022R516) at King Saud University, Riyadh, Saudi Arabia.

Conflicts of Interest

The authors declare no conflict of interest.

References

  1. National Agricultural Statistics Service (NASS). Agricultural Statistics Board; Cranberries (Annual reports, Fr Nt 4); Washington, DC, USA, 2001.
  2. Thyagarajan, P. Evaluation and Optimization of Cranberry Seed Oil Extraction Methods. Master’s Thesis, McGill University, Montréal, QC, Canada, 2012. [Google Scholar]
  3. Yu, L.L.; Zhou, K.K.; Parry, J. Antioxidant properties of cold-pressed black caraway, carrot, cranberry and hemp seed oils. Food Chem. 2005, 91, 723–729. [Google Scholar] [CrossRef]
  4. Connor, W.E. Importance of n-3 fatty acids in health and disease. Am. J. Clin. Nutr. 2000, 71, 171S–175S. [Google Scholar] [CrossRef] [PubMed]
  5. Aronson, W.J.; Glaspy, J.A.; Reddy, S.T.; Reese, D.; Heber, D.; Bagga, D. Modulation of omega-3/omega-6 polyunsaturated ratios with dietary fish oils in men with prostate cancer. Urology 2001, 58, 283–288. [Google Scholar] [CrossRef]
  6. Parry, J.; Su, L.; Luther, M.; Zhou, K.; Yurawecz, M.P.; Whittaker, P.; Yo, L. Fatty acid composition and antioxidant properties of cold-pressed marionberry, boysenberry, red raspberry and blueberry seed oils. J. Agric. Food Chem. 2005, 53, 566–573. [Google Scholar] [CrossRef] [PubMed]
  7. Bushman, B.S.; Phillips, B.; Isbell, T.; Ou, B.; Crane, J.M.; Knapp, S.J. Chemical composition of cranberry (Rubus spp.) seeds and oils and their antioxidant potential. J. Agric. Food Chem. 2004, 52, 7982–7987. [Google Scholar] [CrossRef] [PubMed]
  8. Lu, X.; Yu, H.; Ma, Q.; Shen, S.; Das, U.N. Linoleic acid suppresses colorectal cancer cell growth by inducing oxidant stress and mitochondrial dysfunction. Lipids Health Dis. 2010, 9, E106. [Google Scholar] [CrossRef] [Green Version]
  9. Bilia, A.R.; Guccione, C.; Isacchi, B.; Righeschi, C.; Firenzuoli, F.; Bergonzi, M.C. Essential oils loaded in nanosystems: A developing strategy for a successful therapeutic approach. Evid. Based Complement. Altern. Med. 2014, 2014, E651593. [Google Scholar] [CrossRef] [Green Version]
  10. Shakeel, F.; Alamer, M.M.; Alam, P.; Alshetaili, A.; Haq, N.; Alanazi, F.K.; Alshehri, S.; Ghoneim, M.M.; Alsarra, I.A. Hepatoprotective effects of bioflavonoid luteolin using self-nanoemulsifying drug delivery system. Molecules 2021, 26, E7479. [Google Scholar] [CrossRef]
  11. Shakeel, F.; Salem-Bekhit, M.M.; Haq, N.; Alshehri, S. Nanoemulsification improves the pharmaceutical properties and bioactivities of niaouli essential oil (Melaleuca quinquenervia L.). Molecules 2021, 26, E4750. [Google Scholar] [CrossRef]
  12. Shakeel, F.; Alam, P.; Ali, A.; Alqarni, M.H.; Alshetaili, A.; Ghoneim, M.M.; Alshehri, S.; Ali, A. Investigating antiarthritic potential of nanostructured clove oil (Syzygium aromaticum) in FCA-induced arthritic rats: Pharmaceutical action and delivery strategies. Molecules 2021, 26, E7327. [Google Scholar] [CrossRef]
  13. De Sousa Marcial, S.P.; Carneiro, G.; Leite, E.A. Lipid-based nanoparticles as drug delivery system for paclitaxel in breast cancer treatment. J. Nanopart. Res. 2017, 19, E340. [Google Scholar] [CrossRef]
  14. Garcia, C.R.; Malik, M.H.; Biswas, S.; Tam, V.H.; Rumbaugh, K.P.; Li, W.; Liu, X. Nanoemulsion delivery system for enhanced efficacy of antimicrobials and essential oils. Biomater. Sci. 2022, 10, 633–653. [Google Scholar] [CrossRef] [PubMed]
  15. Barradas, T.N.; Silva, H.G.D.H. Nanoemulsions of essential oils to improve solubility, stability, and permeability: A review. Environ. Chem. Lett. 2021, 19, 1153–1171. [Google Scholar] [CrossRef]
  16. Fallen, H.; Jemaa, M.B.; Neves, M.A.; Isoda, H.; Nakajima, M. Formulation, physicochemical characterization, and anti-E. coli activity of food-grade nanoemulsions incorporating clove, cinnamon, and lavender essential oils. Food Chem. 2021, 359, E129963. [Google Scholar] [CrossRef] [PubMed]
  17. Cossetin, L.F.; Garlet, Q.I.; Velho, M.C.; Gundel, S.; Ourique, A.F.; Heinzmann, B.M.; Monteiro, S.G. Development of nanoemulsions containing Lavandula dentata or Myristica fragrans essential oils: Influence of temperature and storage period on physical-chemical properties and chemical stability. Ind. Crops Prod. 2021, 160, E113115. [Google Scholar] [CrossRef]
  18. Qadir, A.; Faiyazuddin, M.; Hussain, M.T.; Alshammari, T.M.; Shakeel, F. Critical steps and energetics involved in a successful development of a stable nanoemulsion. J. Mol. Liq. 2016, 214, 7–18. [Google Scholar] [CrossRef]
  19. Shafiq, S.; Shakeel, F.; Talegaonkar, S.; Ahmad, F.J.; Khar, R.K.; Ali, M. Development and bioavailability assessment of ramipril nanoemulsion formulation. Eur. J. Pharm. Biopharm. 2007, 66, 227–243. [Google Scholar] [CrossRef]
  20. Schmidts, T.; Nocker, P.; Lavi, G.; Kuhlmann, J.; Czermak, P.; Runkel, F. Development of an alternative, time and cost saving method of creating pseudoternary diagrams using the example of microemulsion. Coll. Surf. A. 2009, 340, 187–192. [Google Scholar] [CrossRef]
  21. Ricaurte, L.; de Jesús Perea-Flores, M.; Martinez, A.; Quintanilla-Carvajal, M.X. Production of high-oleic palm oil nanoemulsions by high-shear homogenization (microfluidization). Innov. Food Sci. Emerg. Technol. 2016, 35, 75–85. [Google Scholar] [CrossRef]
  22. Müller, R.H.; Mäder, K.; Gohla, S. Solid lipid nanoparticles (SLN) for controlled drug delivery—A review of the state of the art. Eur. J. Pharm. Biopharm. 2000, 50, 161–177. [Google Scholar] [CrossRef]
  23. Faiyazuddin, M.; Akhtar, N.; Akhter, J.; Suri, S.; Shakeel, F.; Shafiq, S.; Mustafa, G. Production, characterization, in vitro and ex vivo studies of babchi oil-encapsulated nanostructured solid lipid carriers produced by a hot aqueous titration method. Pharmazie 2010, 65, 348–355. [Google Scholar] [PubMed]
  24. Jain, S.; Kaur, A.; Puri, R.; Utreja, P.; Jain, A.; Bhide, M.; Ratnam, R.; Singh, V.; Patil, A.S.; Jayaraman, N.; et al. Poly propyl ether imine (PETIM) dendrimer: A novel non-toxic dendrimer for sustained drug delivery. Eur. J. Med. Chem. 2010, 45, 4997–5005. [Google Scholar] [CrossRef] [PubMed]
  25. Schwarz, C.; Mehnert, W.; Lucks, J.S.; Müller, R.H. Solid lipid nanoparticles (SLN) for controlled drug delivery. I. Production, characterization and sterilization. J. Control. Release 1994, 30, 83–96. [Google Scholar] [CrossRef]
  26. Kosa, D.; Peto, A.; Fenyvesi, F.; Varadi, J.; Vecsernyes, M.; Gonda, S.; Vasas, G.; Feher, P.; Bacskay, I.; Ujhelyi, Z. Formulation of novel liquid crystal (LC) formulations with skin-permeation-enhancing abilities of Plantago lanceolate (PL) extract and their assessment on HaCaT cells. Molecules 2021, 26, E1023. [Google Scholar] [CrossRef]
  27. Theochari, I.; Mitsou, E.; Nikolic, I.; Ilic, T.; Dobricic, V.; Plesta, V.; Savic, S.; Xenakis, A.; Papadimitriou, V. Colloidal nanodispersions for the topical delivery of ibuprofen: Structure, dynamics and bioperformances. J. Mol. Liq. 2021, 334, E116021. [Google Scholar] [CrossRef]
  28. Osborne, D.W.; Musakhanian, J. Skin penetration and permeation properties of Transcutol®-neat or diluted mixtures. AAPS PharmSciTech. 2018, 19, 3512–3533. [Google Scholar] [CrossRef]
  29. Nurhidayati, L.G.; Nugroho, B.H.; Indrati, O. In vitro permeation test of diclofenac sodium nanoemulsion with combination Tween 80 and Transcutol. Curr. Trends Biotechnol. Pharm. 2020, 14, S48. [Google Scholar]
Figure 1. Chromatogram of linoleic acid (LA) (RF = 0.62) in toluene–acetone–glacial acetic acid, (90:9:1 v/v/v).
Processes 10 00393 g001
Figure 2. Phase diagrams demonstrating nanoemulsion (NE) region (shaded zone) of the oil (CSO), surfactant (Labrasol), and cosurfactant (Carbitol) at different Smix ratios [(A) Smix 1:1, (B) Smix 1:2, (C) Smix 1:3, (D) Smix 2:1, (E) Smix 3:1, and (F) Smix 4:1].
Processes 10 00393 g002
Figure 3. Electron photomicrographs of CSO NE (CNE4 formulation); (A) TEM, (B) SEM, and (C) size distribution intensity.
Processes 10 00393 g003
Table 1. Comparative phasic area of cranberry seed oil (CSO) in various surfactants and cosurfactants (mean ± SD, n = 3).
ComponentPhasic Area ± SD (mm2)
Tween 2077.11 ± 2.40
Tween 8094.63 ± 1.91
Labrasol *143.12 ± 4.17
PEG-20097.08 ± 4.26
Capryol-9081.74 ± 3.11
Carbitol *73.45 ± 4.09
Ethanol35.22 ± 1.84
Cremophor EL42.16 ± 2.39
Labrafac28.78 ± 3.54
* Components showing highest phasic area (mm2) as surfactant and cosurfactant.
Table 2. Composition of selected nanoemulsion (NE) formulations that passed thermodynamic stability test.
Formulation
Matrix
Composition (%) of Selected NanoemulsionSmix Ratio
Oil (CSO)SmixWater
CNE11040501:1
CNE21044461:2
CNE31038521:3
CNE41039512:1
CNE51041493:1
CNE61042484:1
Table 3. Physicochemical evaluation of nanoemulsified CSO NE (mean ± SD, n = 3).
Formulation
Code
Mean Diameter (nm)Polydispersity Index (PDI)Zeta Potential
(−mV)
Mean Viscosity (cps)Entrapment Efficiency (%)Drug Release (%)
CNE1229.4 ± 11.60.357 ± 0.09028.63 ± 4.1994.76 ± 6.2461.79 ± 5.0769.28 ± 3.31
CNE2187.3 ± 9.20.282 ± 0.0769.08 ± 4.31100.39 ± 9.5168.44 ± 7.1272.13 ± 5.29
CNE3166.5 ± 10.10.196 ± 0.07719.52 ± 3.18118.06 ± 5.9371.52 ± 5.3383.06 ± 7.91
CNE4109.7 ± 4.30.172 ± 0.03134.21 ± 2.70141.26 ± 5.3480.29 ± 4.9289.16 ± 8.14
CNE5154.6 ± 8.70.148 ± 0.01323.35 ± 3.47291.25 ± 8.7469.25 ± 7.2978.41 ± 4.65
CNE6250.7 ± 10.60.308 ± 0.0919.55 ± 1.86283.57 ± 10.2970.42 ± 6.5574.50 ± 4.31
Table 4. Permeation study of different CSO NE formulations (mean ± SD, n = 3).
Formulation
Code
Flux (Jss) ± SD
(mg/cm2/h)
Permeability Constant
(Kp) ± SD (cm/h × 10−2)
Enhancement
Ratio (Er)
p-Value
Neat CSO18.33 ± 0.190.175 ± 0.09--
CNE125.58 ± 0.120.213 ± 0.061.21<0.05
CNE237.92 ± 0.090.377 ± 0.092.15<0.05
CNE341.83 ± 0.110.431 ± 0.042.46>0.01
CNE446.71 ± 0.070.529 ± 0.033.02<0.01
CNE535.24 ± 0.130.407 ± 0.052.32>0.01
CNE632.51 ± 0.100.380 ± 0.072.17<0.05
p-value compared with initial; ANOVA.
Table 5. Stability evaluation (mean ± SD, n = 3).
Formulation MatrixSampling (Day First)Sampling (after Three Months)
RTP (25 °C (±2))Stability Chamber (40 °C (±2)/65%RH (±5))
PMD (nm)ZP (−mV)PMD (nm)ZP (−mV)
CNE1230.1 ± 10.2 28.6 ± 5.2261.9 ± 11.530.7 ± 6.1
CNE2187.6 ± 8.19.1 ± 4.3193.2 ± 7.611.3 ± 5.4
CNE3166.8 ± 4.319.6 ± 3.3178.3 ± 5.522.3 ± 6.3
CNE4110.5 ± 3.234.4 ± 2.7115.2 ± 7.235.2 ± 3.6
CNE5156.4 ± 8.223.6 ± 4.7164.8 ± 6.125.8 ± 6.2
CNE6253.3 ± 11.110.4 ± 3.8270.4 ± 7.912.3 ± 3.5
Abbreviations, PMD: Particle mean diameter (nm); ZP: Zeta potential (±mV).
Publisher’s Note: MDPI stays neutral with regard to jurisdictional claims in published maps and institutional affiliations.

