Article

High-Performance Thin-Layer Chromatography (HPTLC) Method for Identification of Meloxicam and Piroxicam

Department of Pharmacognosy and Pharmaceutical Chemistry, Faculty of Pharmacy, Medical University-Plovdiv, 4002 Plovdiv, Bulgaria
*
Author to whom correspondence should be addressed.
Processes 2022, 10(2), 394; https://doi.org/10.3390/pr10020394
Submission received: 19 January 2022 / Revised: 11 February 2022 / Accepted: 16 February 2022 / Published: 18 February 2022

Abstract

:
Background: High-performance thin-layer chromatography (HPTLC) is an advantageous, modern analytical technique based on the principles of thin-layer chromatography (TLC), which provides essential benefits, such as improved sample application, better and faster separation, and less mobile phase usage. The aim of this work was to develop a simple and rapid HPTLC method that could be used for the identification of meloxicam and piroxicam. Methods: HPTLC. The analysis was carried out using silica gel 60 F254 glass TLC plates and as the mobile phase: hexane: ethyl acetate: glacial acetic acid, in a ratio of 65:30:5 v/v/v. For the standard solution preparation, ethanol was used. Front: 60 mm. Detection was performed at 366 nm. Results: The Rf value for meloxicam was 0.81 and the Rf value for piroxicam was 0.57. The proposed method can be used in the detection of the analyzed compounds in very low concentrations. It was established that the detection limit of meloxicam was 0.04 μg per band and that of piroxicam was 0.05 μg per band. It was also established that the quantitation limit of meloxicam was 0.12 μg per band and that of piroxicam was 0.15 μg per band. Conclusions: The proposed method is simple, sensitive, stable, cost effective, and eco-friendly. It could be used in research or for routine quality control purposes.

1. Introduction

High-performance thin-layer chromatography (HPTLC) is an advantageous modern analytical technique based on the principles of thin-layer chromatography (TLC) [1,2,3,4]. Compared to classical TLC, HPTLC provides essential benefits, such as improved sample application (automatic or semi-automatic), higher separation efficiencies, less mobile phase usage, automatization of the drying of the plates, less time required for analysis, minimized exposure to toxic solvents, and reduced possibilities of environmental pollution [1,2,3,4].
Although, currently, there is a wide variety of analytical techniques for the identification, separation, and quantification of compounds, HPTLC techniques could provide extra advantages; for example, simultaneous analysis of many samples, simple sample preparation, no prior manipulation for solvents (such as filtration or degassing), lower solvent expenditure and no traces of previous analyses (new stationary phase for each analysis) [3].
Compared with other methods used in chromatography, such as gas chromatography (GC) and high-performance liquid chromatography (HPLC), TLC is the simplest and least expensive to perform [4,5]. At the same time, both TLC and HPTLC have a wide variety of application fields, such as biotechnology, chemistry, phytochemistry, the pharmaceutical industry, the food industry, cosmetics and many others [6,7,8,9,10,11,12,13].
Despite the variety of analytical techniques available for identification, TLC remains important for the pharmaceutical industry. Many TLC tests for the identification of pharmaceuticals or impurities are included in U.S. Pharmacopoeia and European Pharmacopoeia monographs [14,15]. The aim of this work was to develop a simple and rapid HPTLC method for the identification of meloxicam and piroxicam. Both meloxicam and piroxicam are important non-steroidal, anti-inflammatory drugs prescribed worldwide for the treatment of rheumatoid arthritis, osteoarthritis and chronic or acute pain with different etiologies [16,17,18,19,20].

2. Materials and Methods

2.1. Apparatus

The method was developed using a CAMAG HPTLC system (CAMAG, Muttenz, Switzerland) in the following configuration:
  • CAMAG Limomat 5, a software-controlled applicator CAMAG, Muttenz, Switzerland);
  • CAMAG Automatic Developing Chamber 2 (CAMAG, Muttenz, Switzerland);
  • CAMAG TLC Visualizer 2 (CAMAG, Muttenz, Switzerland);
  • Ultrasonic bath (BANDELIN, Berlin, Germany).

2.2. Pharmaceutical Reference Standards and Chemicals

The standards of meloxicam and piroxicam were obtained from Sigma Aldrich, Steinheim, Germany. All solvents/reagents were of analytical grade. Ethanol 96%, hexane, ethyl acetate, and glacial acetic acid were also obtained from Sigma Aldrich, Steinheim, Germany.

2.3. Standard Solutions and Sample Preparation

The standard solutions and the sample solutions were prepared with ethanol 96% (Sigma Aldrich, Steinheim, Germany).

2.4. Chromatography

The analyses were carried out using silica gel 60 F254 glass TLC plates, 10 × 20 cm, 200 μm layer thickness (E. Merck KGaA, Darmstadt, Germany). The mobile phase comprised hexane: ethyl acetate: glacial acetic acid in a ratio of 65:30:5 v/v/v. The volume of the mobile phase was 10 mL. Application type: band. Front: 60 mm. Time for development: 14 min. Drying: 5 min. Detection at 366 nm.

3. Results and Discussion

3.1. Method Development

Piroxicam and meloxicam have similar structures, which allows identification to be performed in the same chromatographic conditions. Both compounds contain benzothiazine, and the only difference is that piroxicam contains a pyridine ring in the amidic part, while meloxicam contains 5-methyl-1,3-thiazole.
The first step of the assay was to choose a solvent for the analyzed compounds. We wanted to choose an eco-friendly solvent that posed no danger to the researchers, because, in HPTLC, the only possible interaction between the researchers and chemicals is when the samples are prepared. Although ethanol is not the best solvent for piroxicam and meloxicam, we decided to work with ethanol 96%. Standard solutions, in different concentrations, were prepared using ethanol 96% as a solvent. The concentration range of the working standard solutions was 1000–0.5 μg/mL.
The analyses were carried out using silica gel 60 F254 glass TLC plates, 10 × 20 cm, with a layer thickness of 200 μm. CAMAG Limomat 5, a software-controlled applicator, was used for the application of the standard solutions/samples. Using this instrument, the samples were sprayed onto plates in the form of bands, using compressed air. The application was automatic (only filling the syringe was manual). The application volume was 2 µL.
The mobile phase comprised hexane: ethyl acetate: glacial acetic acid in a ratio of 65:30:5 v/v/v. Although, during the development of this method, we tried varying both the pH and composition ratio of the phase, we obtained the best results with this mobile phase ratio. The volume of the mobile phase was 10 mL. Compared to classical TLC methods, this is a small mobile phase volume, and is more cost effective in terms of solvent expense.
The CAMAG Automatic Developing Chamber 2 (ADC 2) was used for the development of the plates. The ADC 2 not only provides excellent safety for the researchers, but also works independently of environmental effects. This instrument also provides good reproducibility and fast analysis for isocratic developments. The development process was fully automated, without previous saturation. The average time of development was 14 min. The front needed to be 60 mm. The drying process was fully automated and was performed by the ADC 2.
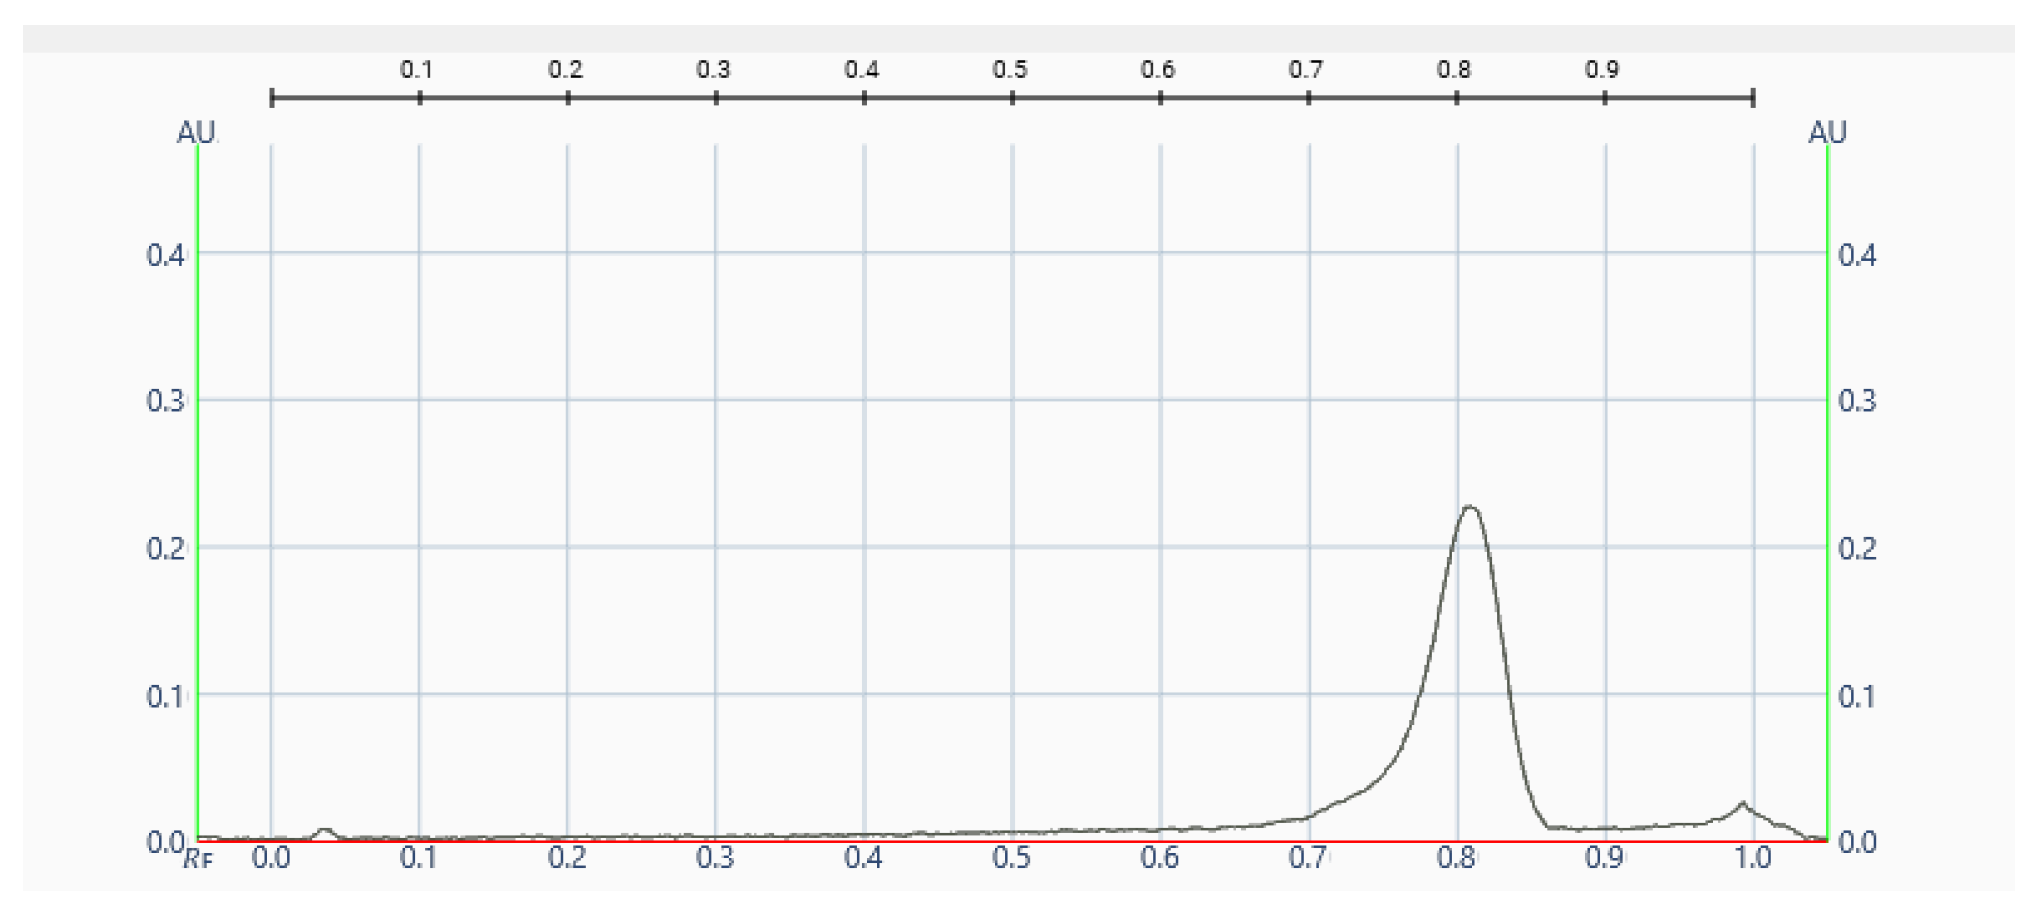
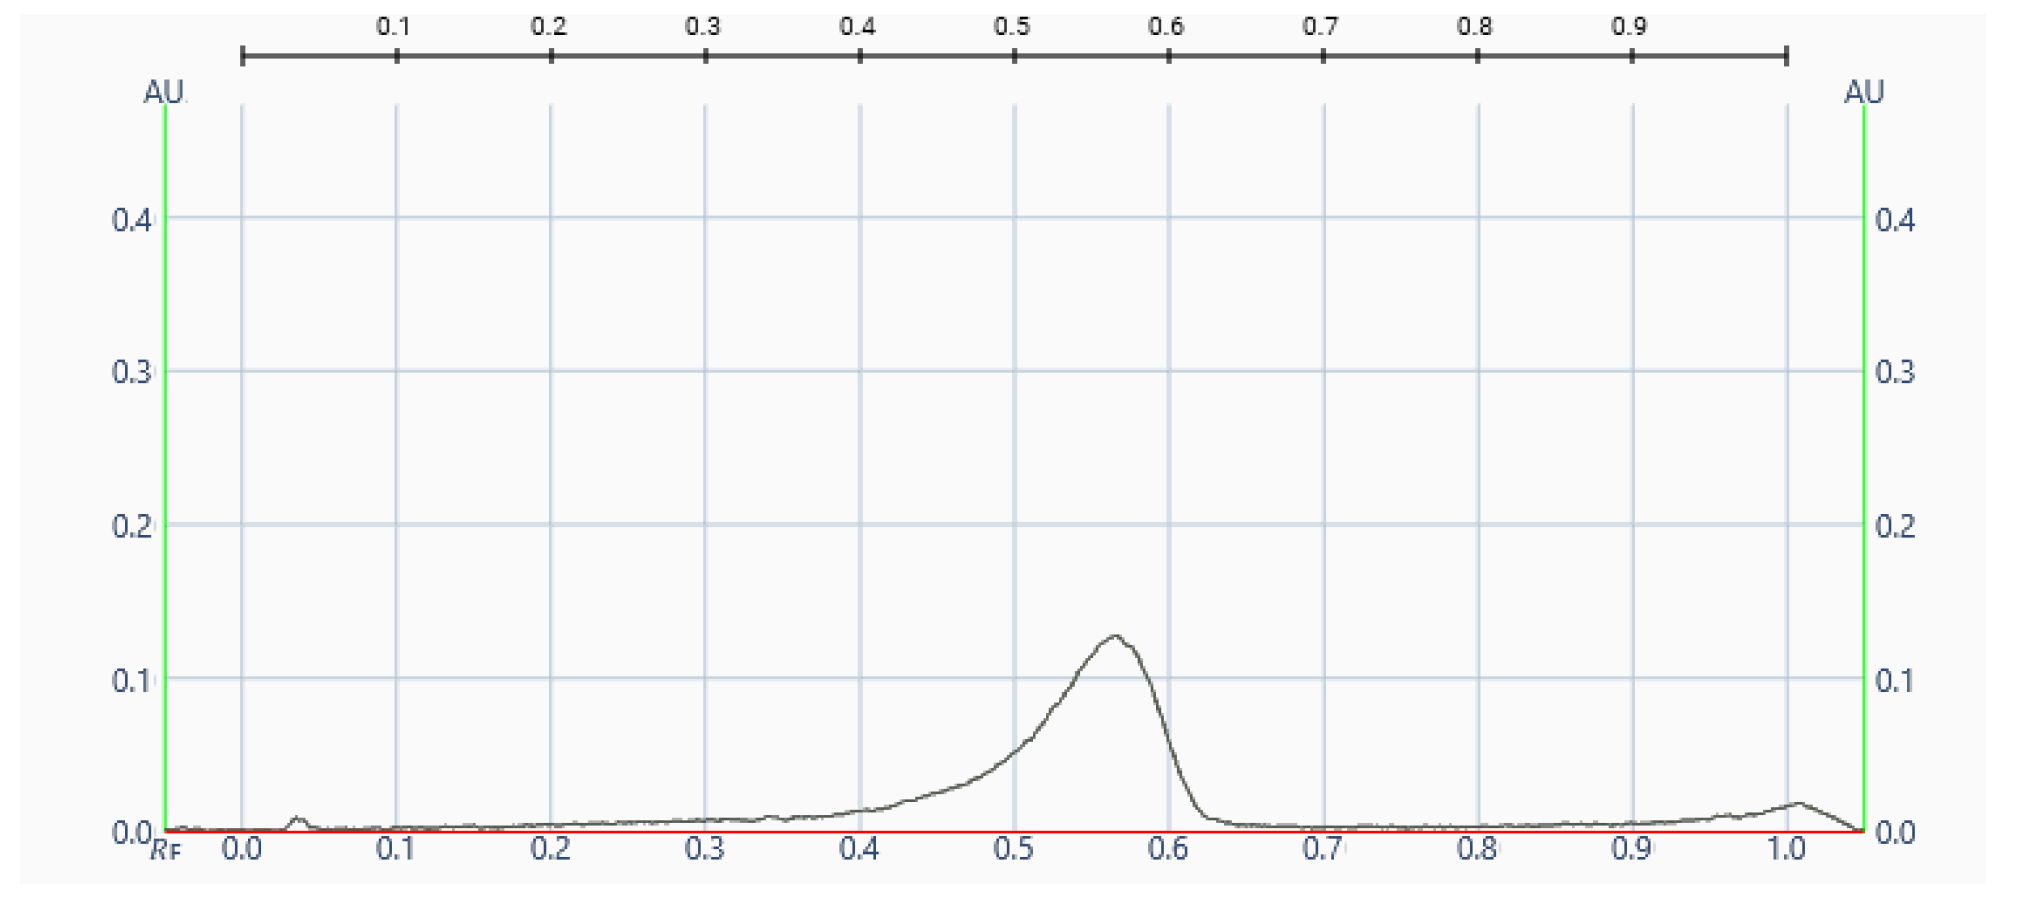
Documentation and detection were carried out using the CAMAG TLC Visualizer 2 under long-wavelength UV light (366 nm). CAMAG HPTLC Software visionCATS was used for the data collection analysis. The Rf value for meloxicam was 0.81, and the Rf value for piroxicam was 0.57 (Figure 1).

3.2. Method Validation

The method was validated according to the ICH-Q2 (R1) guidelines [21].
Specificity: The results obtained during method development showed that the method was specific for the assay, and also selective because there was no interference from the excipients or solvents. A placebo solution was prepared. On the chromatograms with the placebo, no spots with the Rf values corresponding to meloxicam and piroxicam were observed. The method was found to be acceptable to ensure the identification of meloxicam and piroxicam. The Rf values were calculated by CAMAG HPTLC Software visionCATS. The Rf value of meloxicam was 0.81, and the Rf value of piroxicam was 0.57.
Method robustness: The robustness of the proposed method was evaluated by the introduction of minor changes in the mobile phase composition ratio (+/−1%), and also in its pH. The changes in Rf were +/−0.02, which showed that the method was robust.
Detection limit (DL): According to the ICH-Q2 (R1) guidelines, DL is the lowest amount of an analyte that can be reliably detected [21]. The detection limit was evaluated based on the standard deviation of the response and the slope. The lowest concentrations for which a reliable spot was established were 0.04 μg per band for meloxicam and 0.05 μg per band for piroxicam; the analyzed volume was 2 µL.
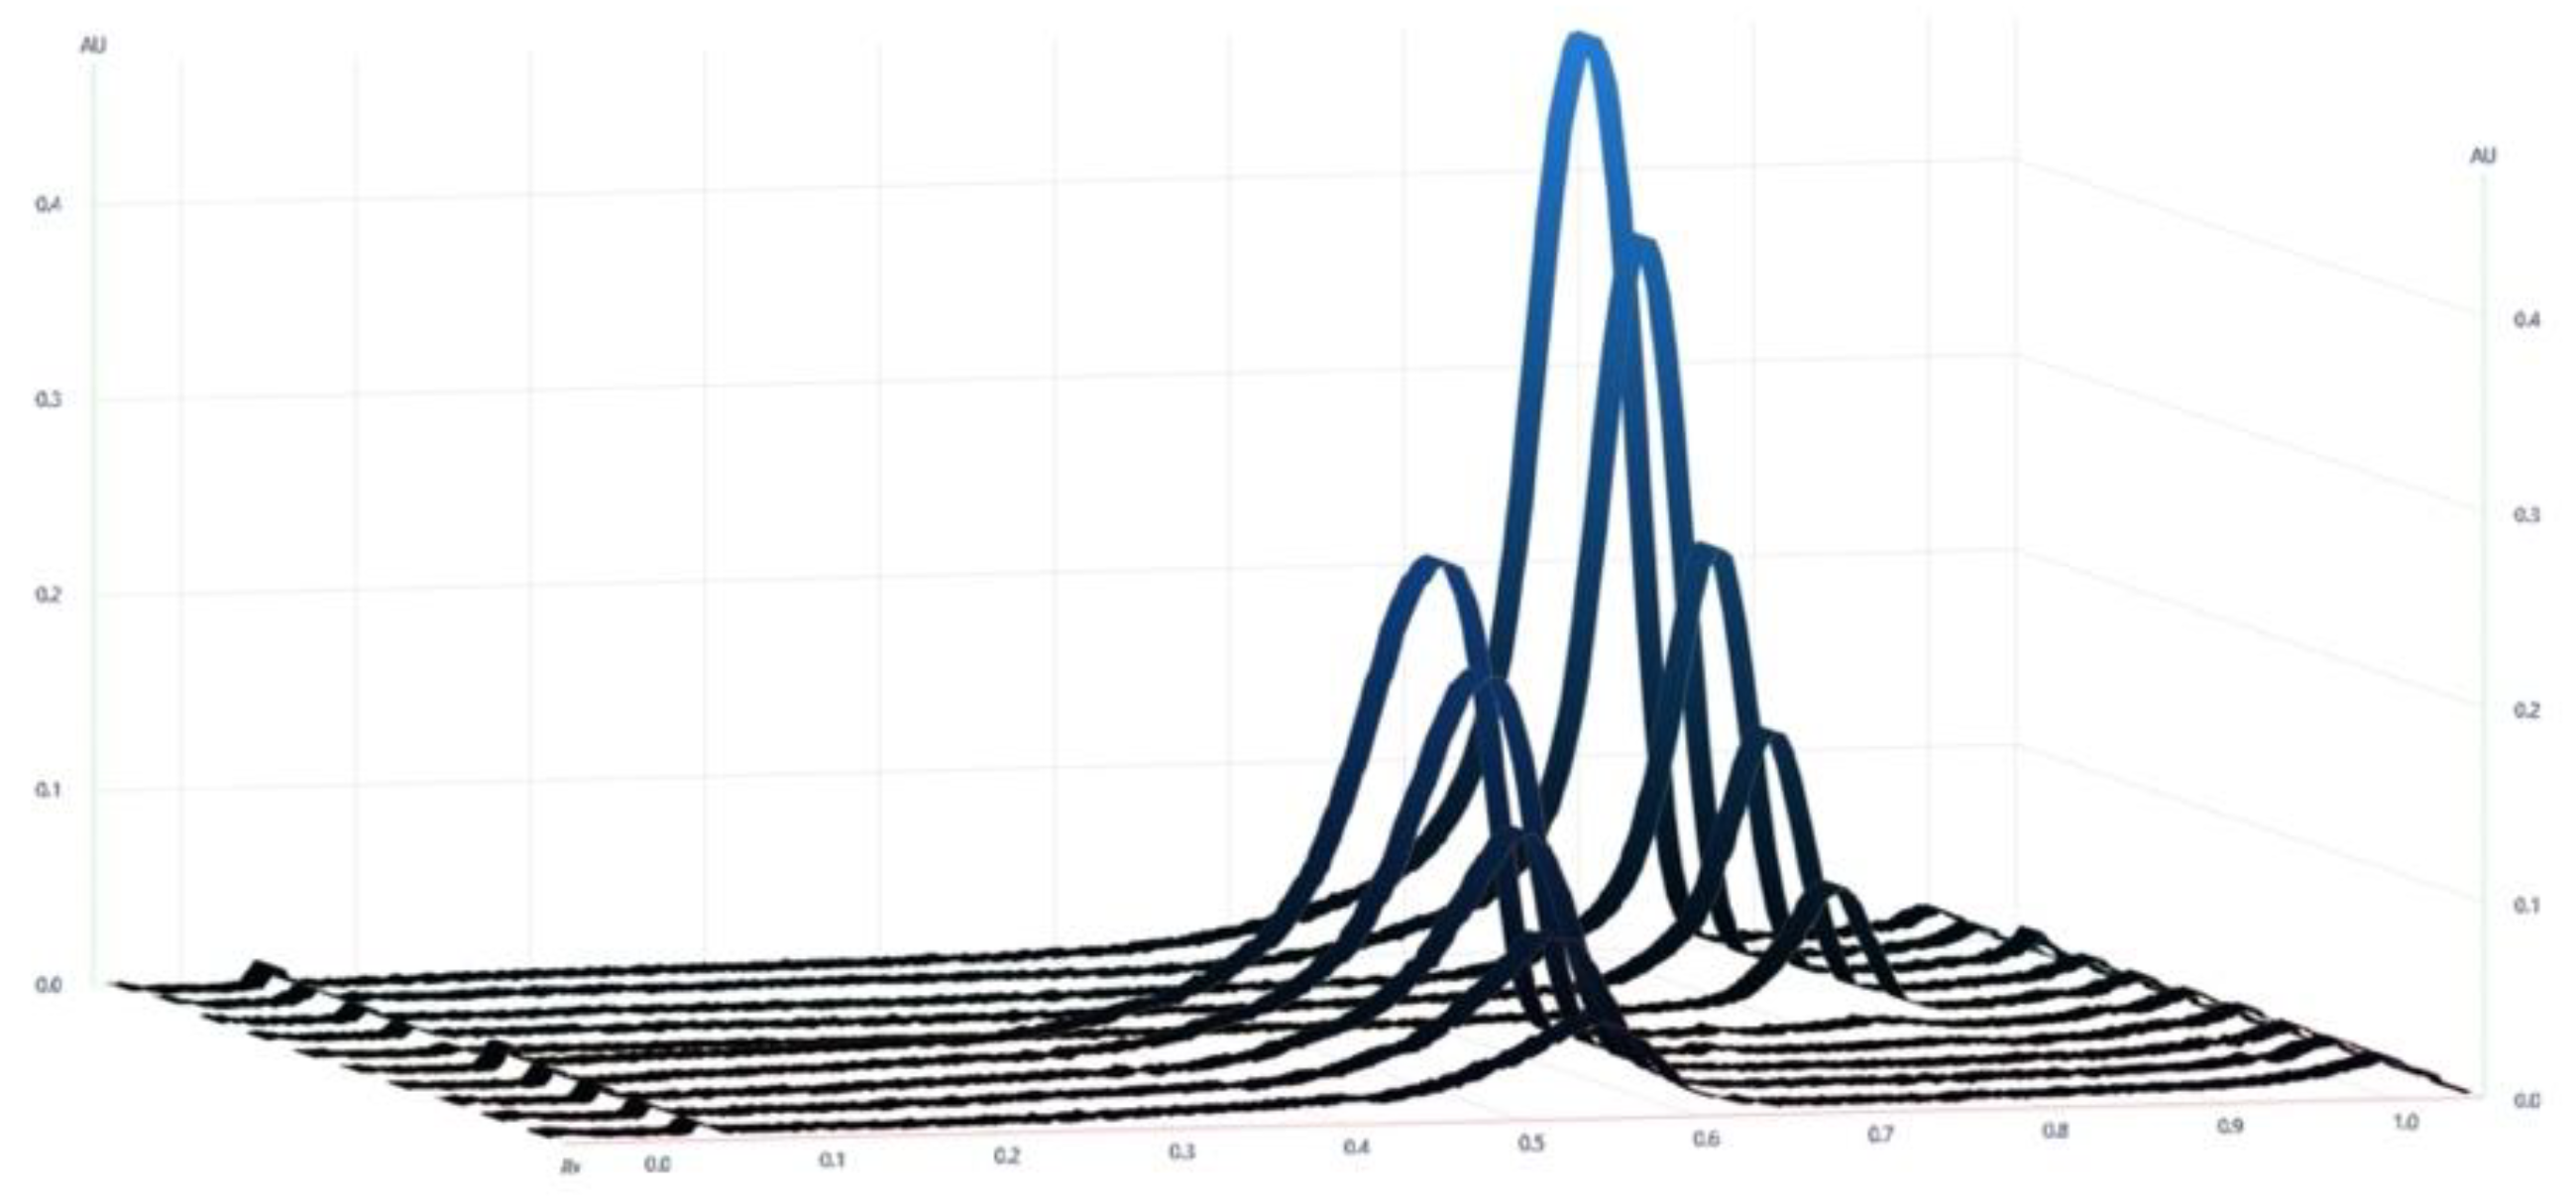
Linearity: According to the ICH-Q2 (R1) guidelines, for the establishment of linearity, a minimum of five concentrations is recommended [21]. The peak areas of the standard solutions were measured with CAMAG HPTLC Software visionCATS. Figure 2 represents the dimetric profile of meloxicam and piroxicam in different concentrations. Figure 3 and Figure 4 show representative densitograms of standard solutions of meloxicam and piroxicam. The figures were obtained with CAMAG HPTLC Software visionCATS.
The calibration curve of the peak areas of meloxicam, within a concentration range of 0.125–1 μg·band−1, was obtained with the following linear regression line: y = 0.0231x + 0.0021. The R2 was 0.9944. The calibration curve of the peak areas of piroxicam, within a concentration range of 0.125–1 μg·band−1, was obtained with the following linear regression line: y= 0.0314x + 0.0013. The R2 was 0.9919.
Quantitation limit (QL): According to the ICH-Q2 (R1) guidelines, the quantitation limit is the lowest amount of an analyte that can be quantified with adequate accuracy and precision [21]. The quantitation limit was evaluated based on the standard deviation of the response and the slope. The quantitation limit for meloxicam was 0.12 μg·band−1, and for piroxicam, it was 0.15 μg·band−1.
Accuracy and Precision: According to the ICH-Q2 (R1) guidelines, accuracy represents the degree of agreement between the true value and the value discovered. The accuracy was evaluated in terms of the percentage of recovery. Recovery was assessed with three known concentration levels and six replicates for each concentration level. It was evaluated based on the mean and accepted true values; the results are shown in Table 1. The accuracy of meloxicam, as the percentage of recovery, was 99.73%, 100.17% and 100.61% at high (1 μg·band−1), middle (0.6 μg·band−1) and low (0.3 μg·band−1) quality control, respectively. The accuracy for piroxicam, as the percentage of recovery, was 99.75%, 100.22% and 100.78% at high (1 μg·band−1), middle (0.6 μg·band−1) and low (0.3 μg·band−1) quality control, respectively. The high values of the percentages of recovery suggested the accuracy of the HPTLC assay for the quantitative determination of meloxicam and piroxicam.
According to the ICH-Q2 (R1) guidelines, precision represents the closeness between a series of measurements obtained from several samplings [21]. The precision was determined as intraday and inter-day precision, and evaluated as a percentage of the coefficient of variation for three known concentrations, each analyzed six times. The results are shown in Table 2. For the intraday precision, the % CV of meloxicam was determined as 0.10%, 0.39% and 1.03% at high (1 μg·band−1), middle (0.6 μg·band−1) and low (0.3 μg·band−1) quality control, respectively. For the intraday precision, the % CV of piroxicam was evaluated as 0.07%, 0.38% and 0.91% at high (1 μg·band−1), middle (0.6 μg·band−1) and low (0.3 μg·band−1) quality control, respectively. The inter-day precision was determined by repeating the same experiment on different days. For the inter-day precision, the % CV of meloxicam was evaluated as 0.11%, 0.40% and 1.04% at high (1 μg·band−1), middle (0.6 μg·band−1) and low (0.3 μg·band−1) quality control, respectively. For the inter-day precision, the % CV of piroxicam was determined as 0.09%, 0.37% and 0.92% at high (1 μg·band−1), middle (0.6 μg·band−1) and low (0.3 μg·band−1) quality control, respectively. The low values of % CV suggested the precision of the HPTLC assay for the quantitative determination of meloxicam and piroxicam.

3.3. Determination of Meloxicam and Piroxicam in Commercial Formulations

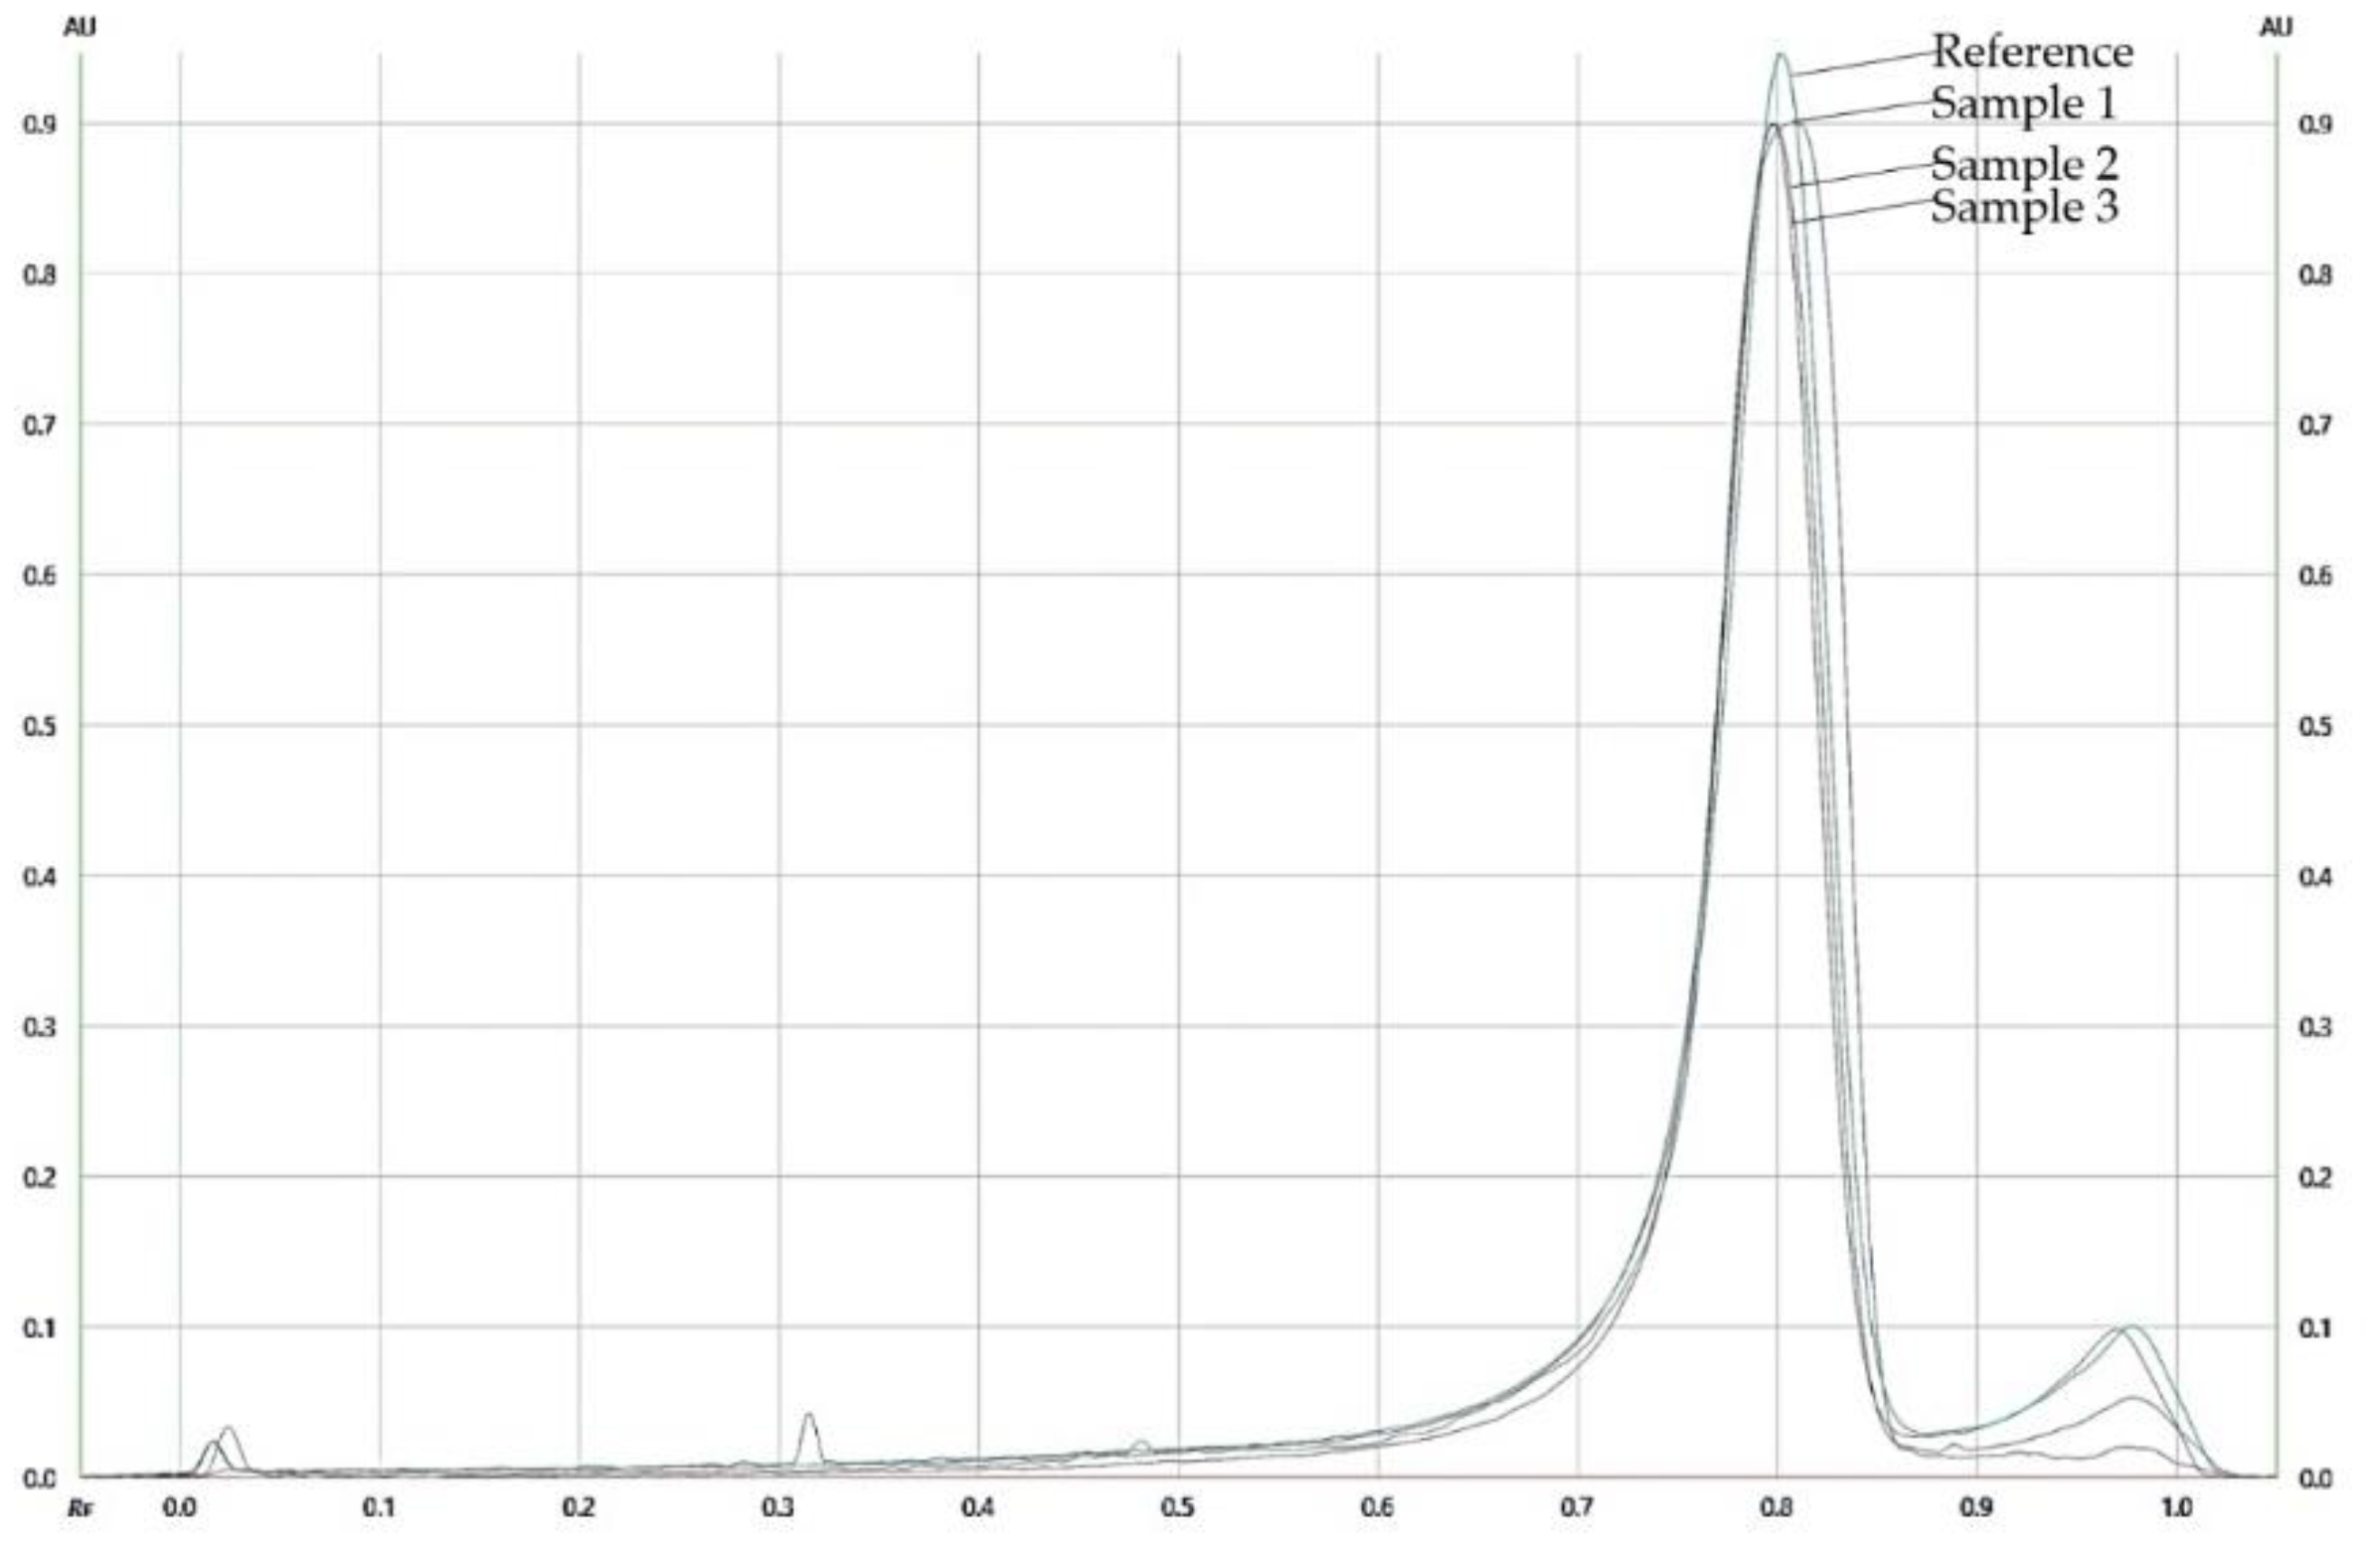
The HPTLC assay for the determination and quantification of meloxicam and piroxicam could be used for the analysis of commercial formulations (capsule and tablet dosage forms). The sample preparation is simple and involves dissolving the samples in ethanol. All the sample solutions were sonicated for 5 min. The sample solutions were filtrated through syringe filters (size of the pores: 0.45 μm). Figure 5 and Figure 6 show representative densitograms of the standard solution, and three solutions from commercial formulations of meloxicam and piroxicam. The Rf value of meloxicam in the commercial formulations was 0.81, and the Rf value of piroxicam in the commercial formulations was 0.57. The densitograms of meloxicam and piroxicam from the dosage forms were observed to be identical to the reference. It was found that the % meloxicam of commercial products was 98.70% in sample one, 97.86% in sample two and 97.79% in sample three. The % of piroxicam found in commercial products was 98.96% in sample one, 98.85% in sample two, and 98.28% in sample three. Since the peaks of the densitograms from the commercial dosage forms and from the pure substance are identical, the HPTLC assay for meloxicam and piroxicam could be used for the analysis of commercial formulations.

3.4. Advantages and Limitations of the Proposed Method

Compared to classical TLC, HPTLC provides some essential benefits (Table 3), which are reported in this paper.
Compared to classical TLC, HPTLC does not require special preparation of the plates, including making a start line, front, and places for the sample applications. In HPTLC, these steps are automatic and are controlled by software. This represents the first example of point of time consumption.
Both TLC and HPTLC require small volumes of samples. The automatic sample application in HPTLC provides essential stability because it guarantees that the same sample volume will be applied (usually 1 or 2 µL) every time. Compared to the manual application, where there is the possibility of error, the automatic application seems to be not only more accurate, but also more user-friendly and time effective.
Although the proposed method has some strengths and could be easily performed, there are several limitations. Firstly, the HPTLC instrument only works with glass plates, which should also be an appropriate size (10 × 20 cm). Secondly, compared to TLC techniques, additional material is required for performing the analysis; compressed air or nitrogen are required for the sample application. In HPTLC techniques, the samples are sprayed onto the plate in the form of bands or spots, using a semi-automatic/automatic injector, which does not work without compressed air or nitrogen. On the other hand, this injector provides a precise application, without contact with the plates. Last, but not least, HPTLC is a more expensive technique than TLC and its use requires qualified personnel. However, compared to other chromatographic techniques, such as HPLC and GC, HPTLC is still much more cost effective.
HPTLC methods for the determination of meloxicam and piroxicam are limited [22,23]. Data about some TLC/HPTLC techniques for the determination of these non-steroidal anti-inflammatory drugs are presented in Table 4.

4. Conclusions

HPTLC represents a natural evolution of classical TLC. It is a sophisticated analytical technique that provides essential benefits, such as simultaneous screening of many samples, cost effectiveness, and time savings. We developed a rapid, sensitive, and sustainable HPTLC method that could be used for the identification of meloxicam and piroxicam simultaneously and separately. The method was able to detect meloxicam and piroxicam in the following very low concentrations: 0.04 μg per band for meloxicam and 0.05 μg per band for piroxicam. This method could be used in research, or for routine quality control.

Author Contributions

Conceptualization, S.I.; methodology, S.I.; software, S.I., K.I. and V.T.; validation, S.I., K.I., V.T. and S.D.; formal analysis, S.I., K.I., V.T. and S.D.; investigation, S.I., K.I., V.T. and S.D.; resources, S.I.; data curation, S.I., K.I., V.T. and S.D.; writing—original draft preparation, S.I., K.I. and V.T.; writing—review and editing, S.I., K.I. and V.T.; visualization, S.I. and V.T.; supervision, K.I. All authors have read and agreed to the published version of the manuscript.

Funding

This research received no external funding.

Institutional Review Board Statement

Not applicable.

Informed Consent Statement

Not applicable.

Data Availability Statement

Not applicable.

Conflicts of Interest

The authors declare no conflict of interest.

References

  1. Srivastava, M.M. An Overview of HPTLC: A Modern Analytical Technique with Excellent Potential for Automation, Optimization, Hyphenation, and Multidimensional Applications. In High-Performance Thin-Layer Chromatography (HPTLC); Srivastava, M., Ed.; Springer: Berlin/Heidelberg, Germany, 2011; pp. 3–24. ISBN 978-3-642-14024-2. [Google Scholar]
  2. Variyar, P.S.; Chatterjee, S.; Sharma, A. Fundamentals and Theory of HPTLC-Based Separation. In High-Performance Thin-Layer Chromatography (HPTLC); Srivastava, M., Ed.; Springer: Berlin/Heidelberg, Germany, 2011; pp. 27–39. ISBN 978-3-642-14024-2. [Google Scholar]
  3. Patel, R.B.; Patel, M.R.; Batel, B.G. Experimental Aspects and Implementation of HPTLC. In High-Performance Thin-Layer Chromatography (HPTLC); Srivastava, M., Ed.; Springer: Berlin/Heidelberg, Germany, 2011; pp. 41–54. ISBN 978-3-642-14024-2. [Google Scholar]
  4. Charegaonkar, D. High-Performance Thin-Layer Chromatography: Excellent Automation. In High-Performance Thin-Layer Chromatography (HPTLC); Srivastava, M., Ed.; Springer: Berlin/Heidelberg, Germany, 2011; pp. 55–65. ISBN 978-3-642-14024-2. [Google Scholar]
  5. Parys, W.; Pyka-Pająk, A.; Dołowy, M. Application of Thin-Layer Chromatography in Combination with Densitometry for the Determination of Diclofenac in Enteric Coated Tablets. Pharmaceuticals 2019, 12, 183. [Google Scholar] [CrossRef] [PubMed] [Green Version]
  6. Fried, B.; Reddy, A. Recent High Performance Thin Layer Chromatographic Studies on Biomphalaria Glabrata (Gastropoda). Chromatography 2015, 2, 118–124. [Google Scholar] [CrossRef]
  7. Choma, I.; Jesionek, W. TLC-Direct Bioautography as a High Throughput Method for Detection of Antimicrobials in Plants. Chromatography 2015, 2, 225–238. [Google Scholar] [CrossRef]
  8. Orfali, R.; Perveen, S.; Aati, H.Y.; Alam, P.; Noman, O.M.; Palacios, J.; Al-Kurbi, B.S.S.; Al-Taweel, A.M.; Khan, A.; Mehmood, R.; et al. High-Performance Thin-Layer Chromatography for Rutin, Chlorogenic Acid, Caffeic Acid, Ursolic Acid, and Stigmasterol Analysis in Periploca Aphylla Extracts. Separations 2021, 8, 44. [Google Scholar] [CrossRef]
  9. Noman, O.M.; Nasr, F.A.; Mothana, R.A.; Alqahtani, A.S.; Qamar, W.; Al-Mishari, A.A.; Al-Rehaily, A.J.; Siddiqui, N.A.; Alam, P.; Almarfadi, O.M. Isolation, Characterization, and HPTLC-Quantification of Compounds with Anticancer Potential from Loranthus Acaciae Zucc. Separations 2020, 7, 43. [Google Scholar] [CrossRef]
  10. Bui, Q.; Sherma, J.; Hines, J. Using High Performance Thin Layer Chromatography-Densitometry to Study the Influence of the Prion [RNQ+] and Its Determinant Prion Protein Rnq1 on Yeast Lipid Profiles. Separations 2018, 5, 6. [Google Scholar] [CrossRef] [Green Version]
  11. Islam, M.K.; Sostaric, T.; Lim, L.Y.; Hammer, K.; Locher, C. Antioxidant HPTLC-DPPH Fingerprinting of Honeys and Tracking of Antioxidant Constituents upon Thermal Exposure. Foods 2021, 10, 357. [Google Scholar] [CrossRef]
  12. Binert-Kusztal, Ż.; Starek, M.; Żandarek, J.; Dąbrowska, M. Development of TLC Chromatographic-Densitometric Procedure for Qualitative and Quantitative Analysis of Ceftobiprole. Processes 2021, 9, 708. [Google Scholar] [CrossRef]
  13. Alam, P.; Shakeel, F.; Alqarni, M.H.; Foudah, A.I.; Faiyazuddin, M.D.; Alshehri, S. Rapid, Sensitive, and Sustainable Reversed-Phase HPTLC Method in Comparison to the Normal-Phase HPTLC for the Determination of Pterostilbene in Capsule Dosage Form. Processes 2021, 9, 1305. [Google Scholar] [CrossRef]
  14. Saslis-Lagoudakis, C.H.; Bruun-Lund, S.; Iwanycki, N.E.; Seberg, O.; Petersen, G.; Jäger, A.K.; Rønsted, N. Identification of Common Horsetail (Equisetum Arvense L.; Equisetaceae) Using Thin Layer Chromatography versus DNA Barcoding. Sci. Rep. 2015, 5, 11942. [Google Scholar] [CrossRef] [Green Version]
  15. Kaale, E.; Risha, P.; Layloff, T. TLC for Pharmaceutical Analysis in Resource Limited Countries. J. Chromatogr. A 2011, 1218, 2732–2736. [Google Scholar] [CrossRef] [PubMed]
  16. Elshafie, H.S.; Sadeek, S.A.; Zordok, W.A.; Mohamed, A.A. Meloxicam and Study of Their Antimicrobial Effects against Phyto- and Human Pathogens. Molecules 2021, 26, 1480. [Google Scholar] [CrossRef] [PubMed]
  17. Yu, Y.; Tian, Y.; Zhang, H.; Jia, Q.; Chen, X.; Kang, D.; Du, Y.; Song, S.; Zheng, A. The Evaluation of Meloxicam Nanocrystals by Oral Administration with Different Particle Sizes. Molecules 2022, 27, 421. [Google Scholar] [CrossRef] [PubMed]
  18. Gallo, M.; Serpella, L.; Leone, F.; Manna, L.; Banchero, M.; Ronchetti, S.; Onida, B. Piroxicam Loading onto Mesoporous Silicas by Supercritical CO2 Impregnation. Molecules 2021, 26, 2500. [Google Scholar] [CrossRef]
  19. Enthoven, W.T.; Roelofs, P.D.; Deyo, R.A.; van Tulder, M.W.; Koes, B.W. Non-Steroidal Anti-Inflammatory Drugs for Chronic Low Back Pain. Cochrane Database Syst. Rev. 2016, 2, CD012087. [Google Scholar] [CrossRef] [Green Version]
  20. Calvo, A.M.; Prado, M.T.D.O.; Dionísio, T.J.; Marques, M.P.; Brozoski, D.T.; Lanchote, V.L.; Faria, F.A.C.; Santos, C.F. Effective Method for the Detection of Piroxicam in Human Plasma Using HPLC. Braz. Oral Res. 2016, 30. [Google Scholar] [CrossRef] [Green Version]
  21. ICH Q2(R1) Validation of Analytical Procedures: Text and Methodology. Available online: https://www.gmp-compliance.org/files/guidemgr/Q2(R1).pdf (accessed on 7 January 2022).
  22. Puthli, S.P.; Vavia, P.R. Stability Indicating HPTLC Determination of Piroxicam. J. Pharm. Biomed. Anal. 2000, 22, 673–677. [Google Scholar] [CrossRef]
  23. Bartsch, H.; Eiper, A.; Kopelent-Frank, H. Stability Indicating Assays for the Determination of Piroxicam—Comparison of Methods. J. Pharm. Biomed. Anal. 1999, 20, 531–541. [Google Scholar] [CrossRef]
  24. Starek, M.; Krzek, J.; Tarsa, M.; Żylewski, M. Determination of Piroxicam and Degradation Products in Drugs by TLC. Chroma 2009, 69, 351–356. [Google Scholar] [CrossRef]
  25. Starek, M.; Krzek, J.; Rotkegel, P. TLC Determination of Piroxicam, Tenoxicam, Celecoxib and Rofecoxib in Biological Material. J. Anal. Chem. 2015, 70, 351–359. [Google Scholar] [CrossRef]
  26. Starek, M.; Krzek, J. TLC Determination of Meloxicam in Tablets and after Acidic and Alkaline Hydrolysis. Acta Pol. Pharm. 2012, 69, 225–235. [Google Scholar] [PubMed]
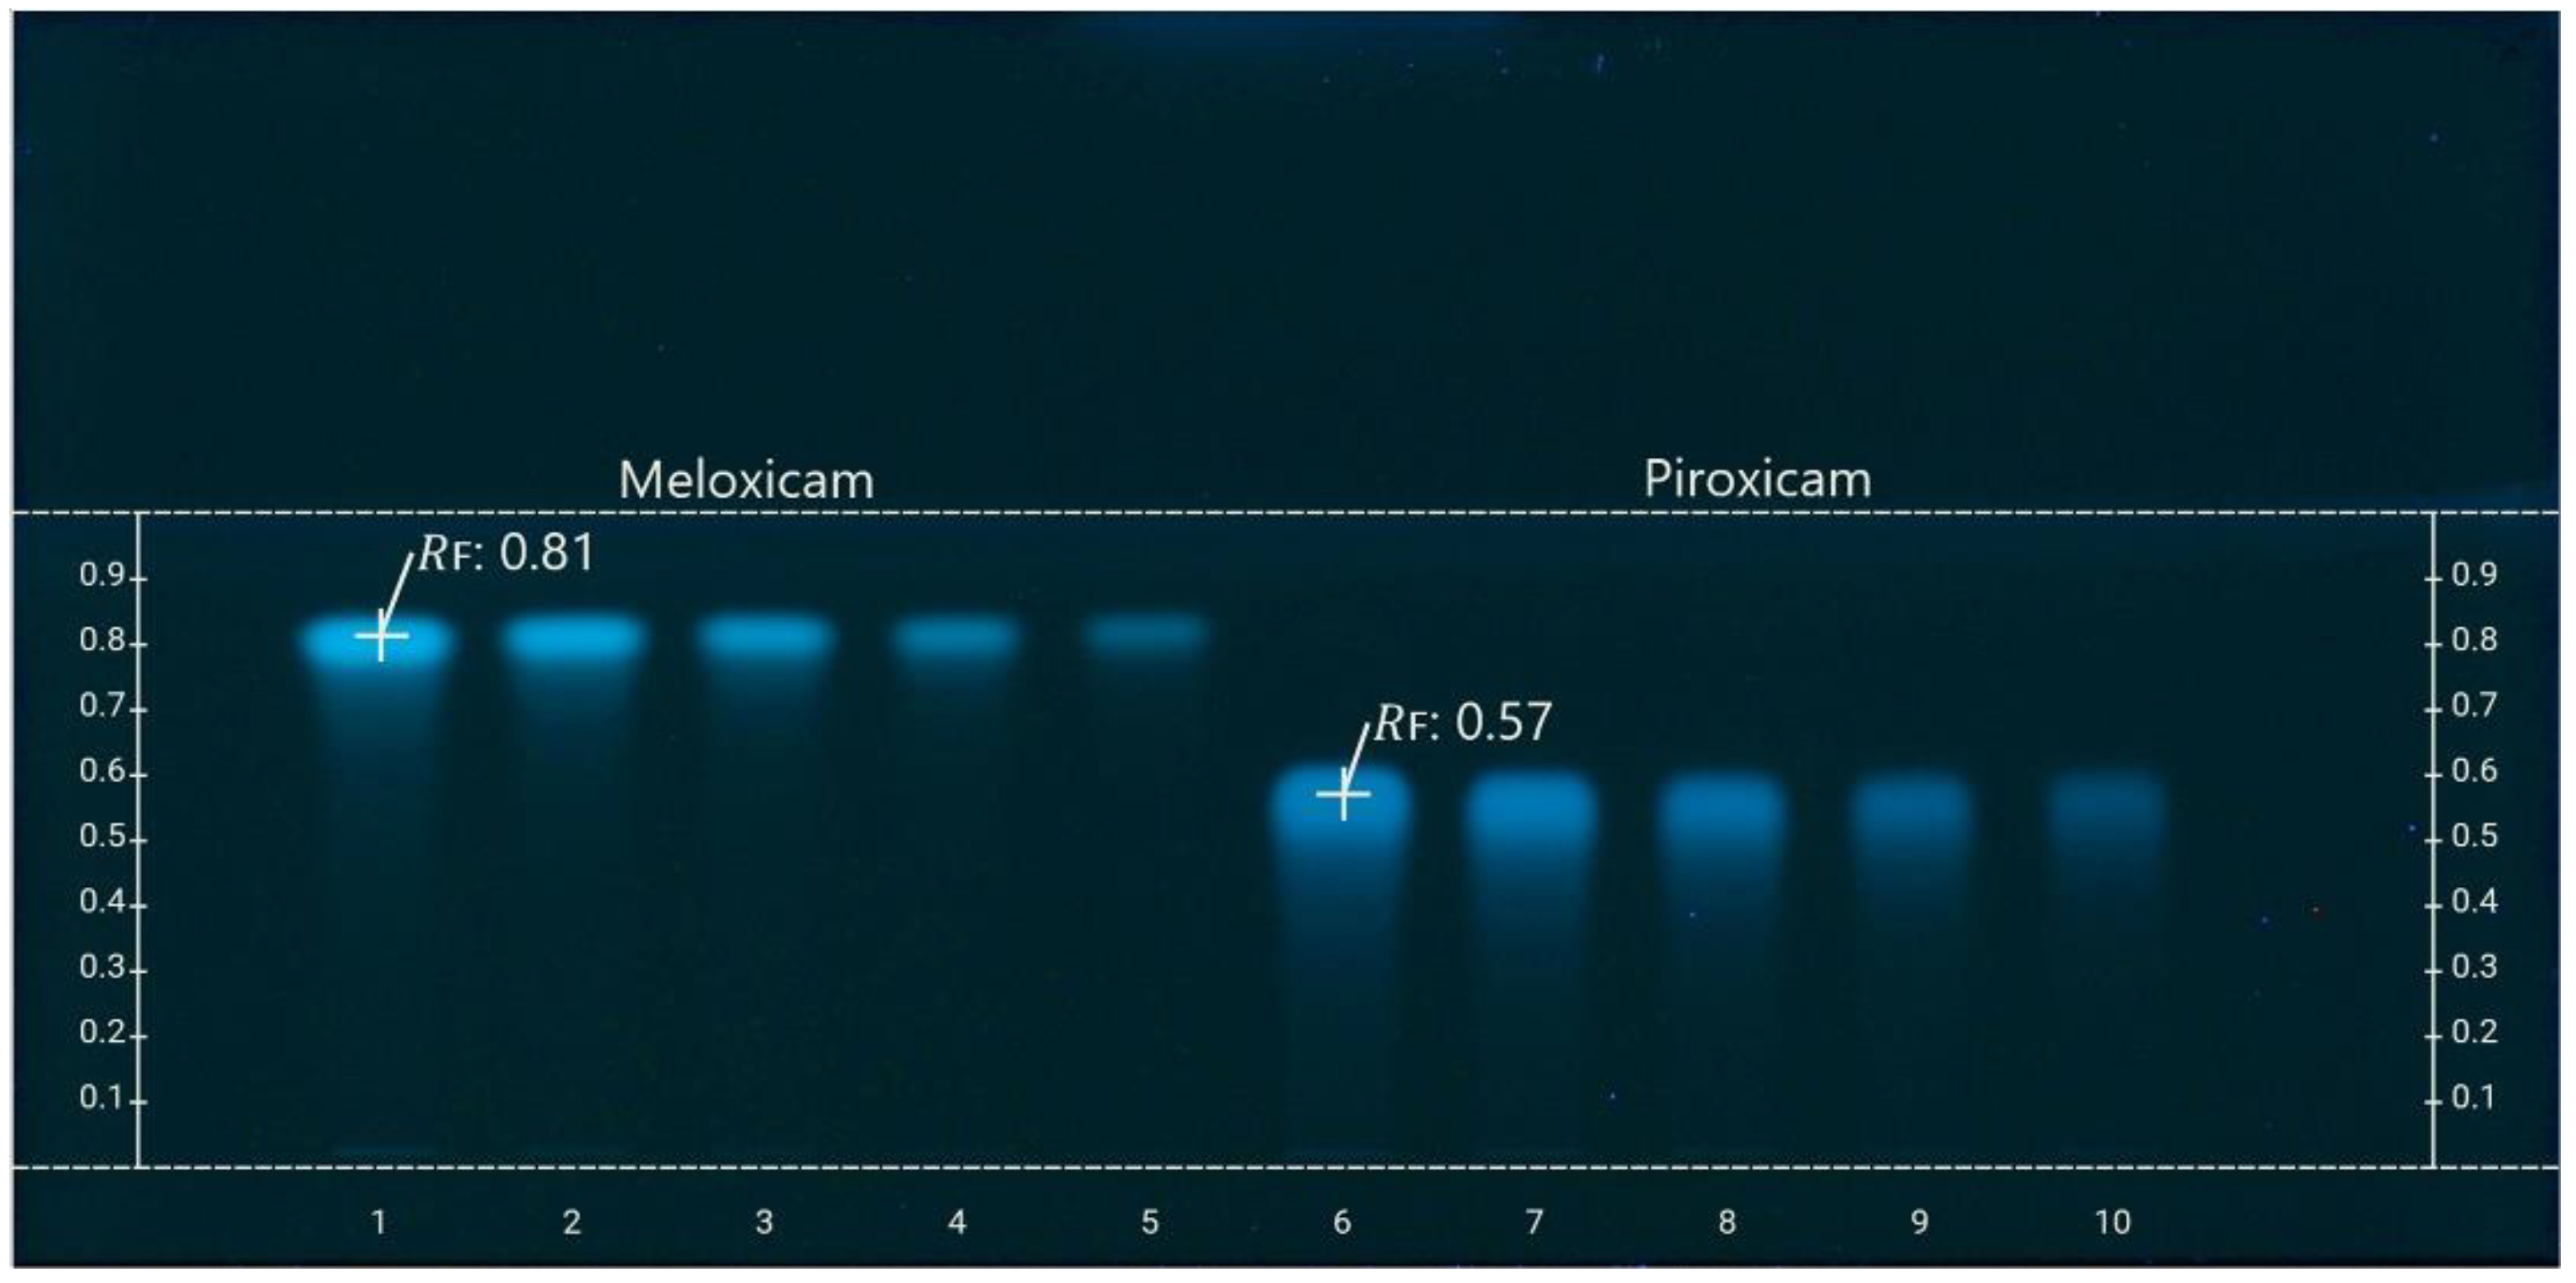
Figure 1. Chromatogram of meloxicam and piroxicam in different concentrations: 1. Meloxicam 2 μg·band−1; 2. Meloxicam 1 μg·band−1; 3. Meloxicam 0.5 μg·band−1; 4. Meloxicam 0.25 μg·band−1; 5. Meloxicam 0.125 μg·band−1; 6. Piroxicam 2 μg·band−1; 7. Piroxicam 1 μg·band−1; 8. Piroxicam 0.5 μg·band−1; 9. Piroxicam 0.25 μg·band−1; 10. Piroxicam 0.125 μg·band−1.
Processes 10 00394 g001
Figure 2. Dimetric profile of meloxicam and piroxicam in different concentrations.
Processes 10 00394 g002
Figure 3. A representative densitogram of a standard solution of meloxicam in concentration 0.5 μg·band−1.
Processes 10 00394 g003
Figure 4. A representative densitogram of a standard solution of piroxicam in concentration 0.5 μg·band−1.
Processes 10 00394 g004
Figure 5. A representative densitogram of standard solution and three solutions from commercial formulations of meloxicam in concentration 0.5 μg·band−1.
Processes 10 00394 g005
Figure 6. A representative densitogram of standard solution and three solutions from commercial formulations of piroxicam in concentration 0.5 μg·band−1.
Processes 10 00394 g006
Table 1. Evaluation of accuracy of meloxicam and piroxicam.
Conc. (μg·band−1)Conc. Found
(μg·band−1) ± SD
Recovery %Coefficient of Variation
(CV %)
Meloxicam
10.997 ± 0.00199,730.10
0.60.601 ± 0.003100,170.48
0.30.302 ± 0.004100,611.23
Piroxicam
10.998 ± 0.00199,750.08
0.60.601 ± 0.002100,220.39
0.30.302 ± 0.004100,781.31
Table 2. Evaluation of precision of meloxicam and piroxicam.
Conc.
(μg·band−1)
Intraday PrecisionInterday Precision
Conc. Found (μg·band−1) ± SDStandart ErrorCV %Conc. Found (μg·band−1) ± SDStandart ErrorCV %
Meloxicam
10.997 ± 0.0010.0010.100.997 ± 0.0010.0010.11
0.60.600 ± 0.0020.0010.390.605 ± 0.0020.0010.40
0.30.301 ± 0.0030.0011.030.302 ± 0.0030.0011.04
Piroxicam
10.998 ± 0.0020.0010.070.997 ± 0.0010.0010.09
0.60.601 ± 0.0030.0010.380.601 ± 0.0020.0010.37
0.30.301 ± 0.0030.0010.910.301 ± 0.0030.0010.92
Table 3. Comparison between classical TLC and HPTLC.
Classical TLCHPTLC
Sample applicationManualAutomatic
Mobile phase quantityThe quantity of the mobile phase varies in different methods. Normally, it is around 50 mL. 10 mL
DevelopmentIn the chamber (all operations are performed manually).Automatic
Time for developmentMuch more time is required. In these techniques, the average front needs to be 12–16 cm.Much faster than TLC
DryingThe plate must be removed manually from the chamber and put in a specific place for drying.Automatic
SafetyAll operations are performed manually. The researcher is exposed to toxic solvents and evaporations.Much safer than TLC
Table 4. Comparison between the chromatographic conditions, LD and LQ, of some meloxicam and piroxicam TLC/ HPTLC techniques.
Purpose of the Proposed MethodTechniqueMobile Phase CompositionDetection Wave LengthLDLQRef.
Determination of piroxicamHPTLCToluene/acetic acid (8:2 v/v)360 nmThe LD was presented in 40 ng.The LQ was presented in 150 ng.[22]
Comparison of the methods for determination of piroxicamHPTLCChloroform/96% acetic acid (9:1 v/v)280 nmNot presentedNot presented[23]
Determination of piroxicam and degradation productsTLCEthyl acetate/toluene/butylamine (2:2:1, v/v/v)360 nm0.07 μg per spot0.20 μg per spot[24]
Determination of piroxicam in biological materialTLCEthyl acetate/toluene/butylamine (2:2:1, v/v/v)360 nm0.07 μg per spot (in methanol)0.10 μg per spot (in acet one)0.21 μg per spot (in methanol)0.32 μg per spot (in acet one)[25]
Determination of meloxicamTLCEthyl acetate/toluene/butylamine (2:2:1, v/v/v)297 nm0.96 μg per spot2.90 μg per spot[26]
Publisher’s Note: MDPI stays neutral with regard to jurisdictional claims in published maps and institutional affiliations.