Abstract
In this work, slim tube displacement tests for minimum miscibility pressure MMP were carried out. Based on the displacement data, the MMP was calculated by statistical regression using linear and quadratic extrapolation with threshold values of 90% and 95% oil recovery as well as the intersection of trend lines for immiscible and miscible displacement regimes. The obtained data show a significant variation in the range of MMP values depending on the calculation method. To clarify the MMP value, an analysis of displacement dynamics was carried out. The ratio of the volume flow rate of reservoir oil to the volume flow rate of the injected gas—flow rates ratio (FFR)—was used as a new parameter. The MMP value calculated from the FRR value extrapolation was determined as 37.09 MPa. According to the results obtained, the proposed methodology based on the displacement dynamics can be useful as a criterion for clarifying the MMP value in slim tube displacement experiments.
1. Introduction
The implementation of gas enhanced oil recovery (EOR) provides increasing displacement efficiency and favorable opportunities for the utilization of greenhouse gases, such as the injection of carbon dioxide, flue gases, or associated petroleum gas into reservoirs [1]. The most effective gas injection process is miscible displacement that allows for high oil recovery to be achieved. Depending on the reservoir conditions, miscibility can be developed using mass transfer processes between fluids under dynamic conditions [2,3]. The efficiency of the oil displacement depends on development of mass transfer processes and is affected by the injection pressure and gas/reservoir oil compositions. Mass change processes occur at the boundary of interacting phases in the transition zone [4,5,6,7]. The successful development of miscibility in the transition zone changes the key characteristics of the interacting fluids such as interfacial tension, viscosity, density, and phase permeability, which leads to the disappearance of phase boundaries and, hence, the single-phase displacement process [8,9,10,11].
The main physical modeling technique for oil displacement by gas injection is the slim tube experiment [12,13]. The slim tube model is usually a long, coiled tube measuring 2–40 m in length and 0.1–1 cm in diameter used to simulate the 1-D physical displacement and minimize the effect of the viscous fingering and form a transition zone of the mass transfer process [14]. Due to the characteristics of the slim tube, the transition zone can be fully realized.
The main parameter obtained in a slim tube test is the minimum miscibility pressure (MMP), defined as the minimum pressure, at reservoir temperature, required to achieve miscibility. The main approach for MMP determination in slim tube testing is the value of the oil recovery depending on the injection pressure; the MMP is defined as 90–95% recovery or the inflection point on the recovery versus the pressure plot [4,15]. However, in some cases, it is difficult to accurately determine the MMP due to the blurring of the inflection point. In such cases, it is necessary to apply additional criteria for MMP determination. Several criteria have been proposed by various authors, including 90% oil recovery at 1.0 or 1.2 pore volume (PV) of the gas injection [16,17,18], 95+% oil recovery at gas breakthrough [19], more than 80% oil recovery at gas breakthrough with 94% ultimate recovery [20], or, finally, oil recovery of 94% when the gas–oil ratio (GOR) reaches 40,000 scf/bbl [7]. An analysis of the change in fluid composition during the displacement process can be used additionally with the recovery criterion, for example, the presence of a methane bank compared to the original separated gas composition [21]. The technique provided in [22] takes advantage of the fact that chromatographic separation occurs during two-phase flow at pressures below the MMP and it is shown that the C1/C3 ratio in the produced gas is a very useful parameter to track as a function of pressure. One of the criteria for determining the MMP is the oil recovery rate (ORR) and instantaneous recovery rate (IRR) based on the recovery rate data. The ORR shows the recovery over the time taken. The ORR curve has a different unique point marking the maximum ORR values, which are a kind of boundary used to predict the MMP. The IRR value shows a similarly good correlation with pressure and allows the reliable determination of the MMP value [23].
As mentioned above, an additional value on recovery is used to determine the MMP. Even if miscibility is achieved, part of the oil will not be displaced at the entrance of the model due to the fact that the miscibility does not have time to form [24]. This, in turn, may cause uncertainty when choosing the value of the achieved ultimate recovery or as a criterion of miscibility, since the amount of residual oil in each case will be determined by the behavior of the phases. When the miscibility is reached, a transition zone is formed in which the properties of the phases gradually change from the injected gas to the reservoir oil. The mobility of the displacing and displaced phases is equal, and displacement will occur in a piston like manner [25], in which the volumetric rates of the displacing and displaced phases will be equal. In this case, based on the above, it can be assumed that by analyzing the displacement dynamics, it is possible to assess the phase conditions of fluids and hence determine whether miscibility has been achieved or not.
2. Experimental Apparatus and Methodology
In this work, slim tube displacement tests were carried out. Live oil samples were prepared using separated oil and prepared recombination gas. The resulting fluid was used for the displacement experiments. The experimental procedure for isothermal slim tube tests includes saturating the slim tube with solvent (kerosene) at test pressure and displacing the kerosene with recombined oil at test temperature and pressure. The quality of the slim tube saturation was monitored by the fluid characteristics at the separation line gas–oil ratio (GOR) and composition according to PVT analysis. After the slim tube saturation, gas was injected at a constant rate of 0.1 mL/min. The volume of the displaced separated oil was determined using a graduated burette and the separated gas by a gas flow meter (Ritter TG 05) for each 0.05 pore volume injected (PVI). The gas was injected until a 1.4 PVI or a GOR of 10,000 was reached. The scheme of the slim tube unit is shown in Figure 1.
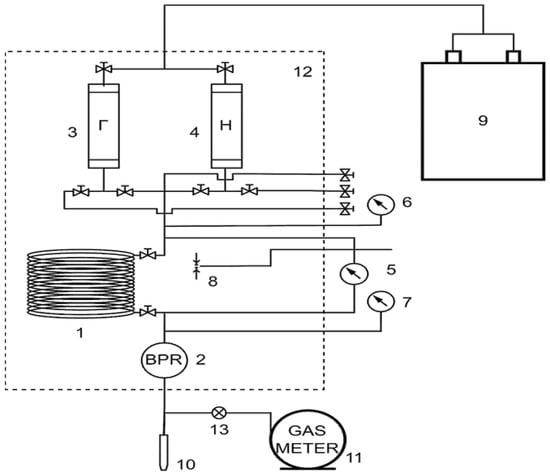
Figure 1.
Slim tube unit: 1—slim tube; 2—back pressure regulator (BPR); 3—injected gas sample; 4—oil sample; 5—differential manometer; 6—inlet manometer; 7—outlet manometer; 8—thermocouple; 9—plunger pump; 10—oil burette; 11—gas meter; 12—constant temperature oven; 13—gas sample line.
Based on the displacement results, both the oil recovery (Equation (1)) and GOR (Equation (2)) were calculated. The methane concentration in the effluent gas was determined using the gas chromatography methodology described below. The effluent composition of inorganic and hydrocarbon gases was determined on a Khromatek-Kristall 5000 gas chromatograph with flame ionization and thermal conductivity detectors. The calculation of the oil volume at reservoir conditions was carried out using the volume of the separated oil and oil formation volume factor.
The recovery was determined using Equation (1).
where Voil.sep—volume of displaced separated oil (cm3), Bo—oil formation volume factor (u.f.), Voil.init—initial oil volume in slim tube (cm3).
Recovery = Voil.sep × Bo/Voil.init
The gas oil ratio was determined using Equation (2).
where Vgas.eff—volume of effluent gas (cm3), Voil.sep—volume of displaced separated oil (cm3).
GOR = Vgas.eff/Voil.sep
3. Results and Discussion
This section presents the results of the experiments for minimum miscibility pressure (MMP) determination with a slim tube model. To determine the MMP, a series of five slim tube experiments with the associated petroleum gas (APG) injections was carried out at pressure steps of 21–45 MPa, and a constant temperature of 47 °C. Based on the displacement data, the MMP was calculated by statistical regression using linear and quadratic extrapolation (Figure 2 and Figure 3) with threshold values of 90% and 95% oil recovery as well as using the intersection of trend lines for immiscible and miscible displacement regimes (Figure 4). The MMP calculation results are presented in Table 1.
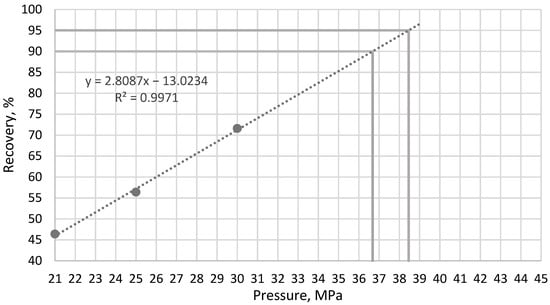
Figure 2.
Results of linear extrapolation to determine the MMP.
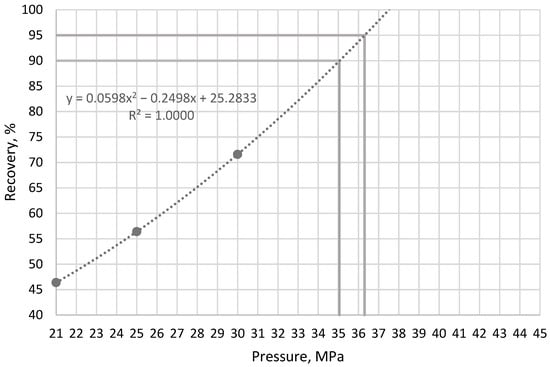
Figure 3.
Results of quadratic extrapolation to determine the MMP.
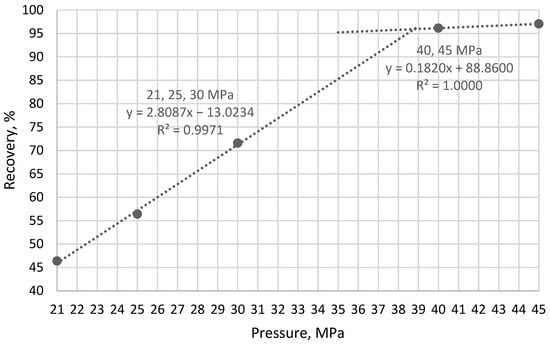
Figure 4.
Results of linear intersection to determine the MMP.

Table 1.
Results of MMP calculation using statistical regression methods.
According to the calculation results, the average MMP value was determined as 37.06 MPa, while the range of values was 35.05–38.79 MPa. The obtained data show a significant variation in the range of MMP values depending on the calculation method. The considered methods for determining MMP use the total value of the displacement efficiency, which depends on the amount of residual oil saturation.
Next, the dynamics of displacement during gas injection is considered, such as recovery curves, gas–oil ratio dynamics, and the additional criteria—the ratio of the reservoir oil volumetric flow rate to the volumetric flow rate of the injected gas, or the flow rates ratio (FRR). The gas injection rate in the experiment remained constant. The measurement step was performed every hour, which is every 0.05 pore volume injected (PVI). The calculation of this ratio was carried out according to Equation (3).
where FRR—flow rate ratio (u.f.), Qoil.disp.—reservoir oil displacement rate (cm3/hr), Qgas.inj.—gas injection rate (cm3/hr).
FRR = Qoil.disp./Qgas.inj.
The recovery curves are shown in Figure 5. At the initial stage of displacement, the rate of oil displacement is the same for all injection pressures, and then due to the gas breakthrough, the rate of displacement decreases. As the injection pressure increases, the final displacement efficiency increases, and the recovery curves’ inflection point shifts towards a later pore volume injected, from 0.15–0.25–0.3 PVI at 21–25–30 MPa, respectively, with immiscible displacement, and up to 0.9–0.95 PVI with miscible displacement at pressures of 40 and 45 MPa, respectively.
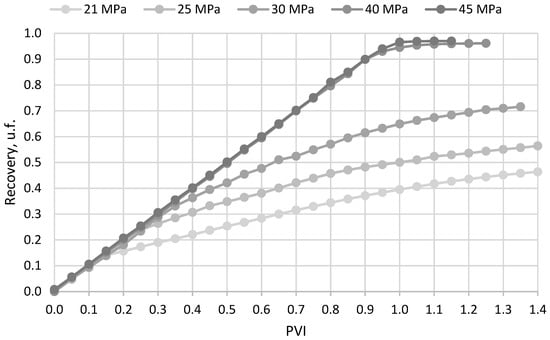
Figure 5.
Recovery curves for APG injection at pressures 21–45 MPa.
The gas–oil ratio dynamics are shown on Figure 6. In a case where immiscible displacement two-phase flow occurs, the mobility of the gas phase is greater in comparison with the oil, which leads to rapid breakthrough at the outlet of the slim tube. A rapid gas breakthrough occurs in cases of displacement at 21–30 MPa. With further displacement, the amount of gas phase in the flow increases, which in turn causes a gradual increase in the gas content. At the same time, with an increase in the pressure due to the development of miscibility, the gas breakthrough point shifts to a later PVI. When the pressure reaches 40–45 MPa, miscibility is formed and a single-phase flow occurs, the gas content remains unchanged, and the breakthrough with a sharp increase in the gas–oil ratio occurs at a late stage of displacement.
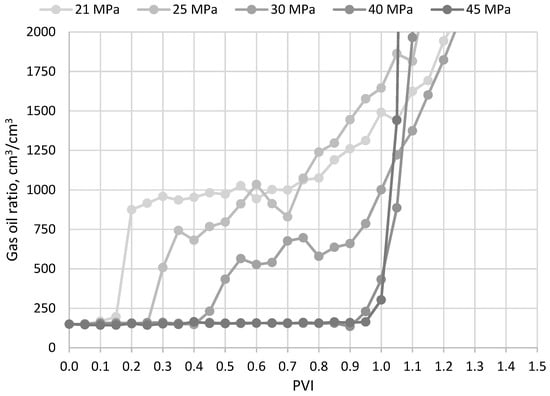
Figure 6.
Gas–oil ratio dynamics for APG injection at pressures 21–45 MPa.
The dynamics of the FRR values are shown in Figure 7. At the initial stage of displacement, the FFR curves reach values of 0.8–1. Further, in the case of immiscible displacement at pressures of 21–30 MPa, there is a sharp decrease in the FRR values. This behavior is related to the presence of a two-phase flow due to the gas breakthrough, which leads to a decrease in efficiency displacement and, hence, a decrease in the FRR values. An increase in the injection pressure accompanies the development of mass transfer processes, leading to an increase in the displacement efficiency, a shift of the FRR decreasing points to later pore volumes, and an increase in the FRR values. These changes occur simultaneously and gradually with the recovery, and GOR changes when the pressure stage changes. Since the FRR parameter is sensitive to the phase conditions, its value in some way characterizes the local displacement efficiency at each measurement interval, and its total value for the injection interval should show the overall displacement efficiency.
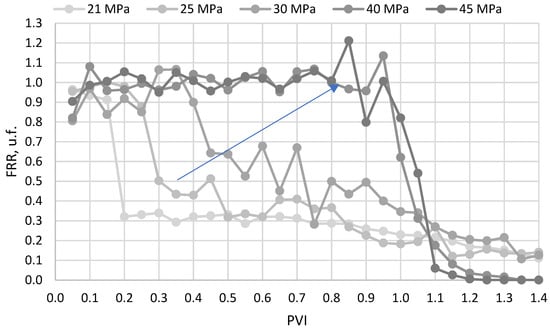
Figure 7.
FRR value dynamics for APG injection at pressures 21–45 MPa.
In the case of a miscible displacement, on the contrary, the FRR reaches a plateau of stable values near 1 and does not change until the gas breakthrough at 0.9–0.95 PVI.
On the FRR profile, with an increase in the pressure stage, the shape of the curve tends to the characteristic shape of the curves corresponding to the miscible displacement, as shown by the arrow. It can be assumed that the injection pressure at which the FRR curves have a characteristic profile and at average FRR values equal to 1, the miscibility will be reached. Based on this, the average FRR values on the immiscible displacement pressure steps 21–30 MPa were extrapolated to find an intersection with the FRR value of 1, which refers to a miscible displacement (Figure 8).
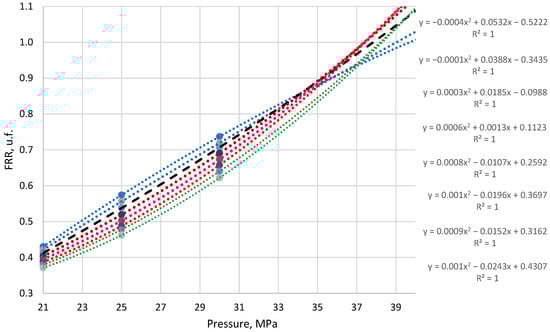
Figure 8.
Extrapolation of the average FFR values from 0.05 to 0.8–1.15 PVI.
The starting point for the measurements was selected at 0.05 PVI due to the first oil and gas volume measurement, and the finishing points were selected as different intervals from 0.8 to 1.15 PVI. The extrapolation of the average values was carried out using a second-order polynomial. Polynomial equation extrapolating points are located from top to bottom, respectively, for 0.8–1.15 PV. According to the results of the extrapolation, several groups of curves can be distinguished: 0.8–0.85 PVI (blue curves) have a downward trend relative to others; the curve 0.9 PVI (black dashed line) has an intermediate position between the curves 0.8–0.85 PVI and a series of curves 0.95–1.05 PVI (red lines); and the curves at 1.1–1.15 PVI (green lines) have a similar trend with the curves at 0.95–1.05, but they are separated and shifted towards high pressures.
Returning to the dynamics of displacement, the curve for the interval up to 0.9 PVI (black dashed line) occupies an intermediate position. In addition, this is the last point that characterizes the displacement mode before the gas breakthrough point for miscible injection at pressures of 40–45 MPa. Based on this, the intersection of the extrapolation curve with an abscissa equal to one for this interval can be considered the theoretical point of achieving miscibility. The value calculated based on the curve equation was 37.09 MPa.
A summary of the results of the determination of MMP using all of the above calculations is shown in Figure 9.
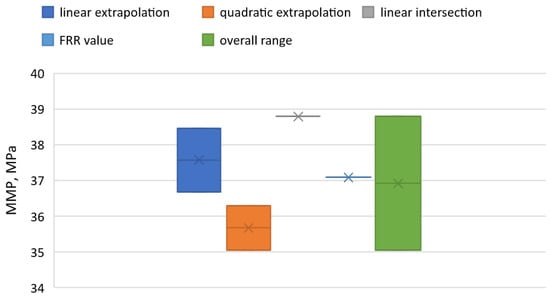
Figure 9.
Summary of the results of the MMP calculation.
The value of the MMP calculated from the displacement dynamics when selecting the point 0.9 PVI was 37.09 MMP. The average range value for all of the measured methods was 36.92 MPa. The results of the analysis indicate the possibility of using the proposed method based on the analysis of displacement dynamics to estimate the MMP value more accurately when the values of the MMP calculation by the recovery value, depending on the selected recovery value and the calculation method, show a wide range of MMP values.
4. Conclusions
In this work, the MMP value was calculated by statistical regression using linear and quadratic extrapolation with threshold recovery values of 90% and 95%, as well as using the intersection of trend lines for immiscible and miscible displacement modes. According to the results of the calculations, the average value of the MMP was determined as 37.06 MPa, while the range of values was 35.05–38.79 MPa. To clarify the MMP value, an analysis of displacement dynamics was carried out. The ratio of the volume flow rate of reservoir oil to the volume flow rate of the injected gas—the flow rate ratio (FFR)—was used as a new parameter. Depending on the displacement mode and the injection pressure step, patterns of changes in the displacement dynamics were demonstrated in comparison with other displacement parameters (recovery, gas–oil ratio). Based on the FRR values, an extrapolation was carried out to calculate and refine the MMP. The MMP value calculated from the extrapolation of the FRR values was determined as 37.09 MPa, while the average range values for all measured methods was determined as 36.92 MPa. Based on the results, it can be concluded that the proposed methodology based on the displacement dynamics can be useful as a criterion for clarifying the MMP value in slim tube displacement experiments.
Author Contributions
Conceptualization, A.S.S. and A.V.B.; Formal analysis, A.S.S. and D.R.N.; Investigation, A.S.S., D.R.N. and V.K.D.; Resources, I.F.M.; Data curation, I.F.M.; Writing—original draft, A.V.B.; Writing—review & editing, V.K.D.; Visualization, D.R.N. and V.K.D.; Project administration, M.A.V. All authors have read and agreed to the published version of the manuscript.
Funding
The study was funded by RFBR, project number 20-35-90116.
Data Availability Statement
The data are available from the authors.
Conflicts of Interest
The authors declare no conflict of interest.
References
- Odunlami, O.A.; Vershima, D.A.; Oladimeji, T.E.; Nkongho, S.; Ogunlade, S.K. Advanced techniques for the capturing and separation of CO2—A review. Results Eng. 2022, 15, 100512. [Google Scholar] [CrossRef]
- Zick, A.A. A combined condensing/vaporizing mechanism in the displacement of oil by enriched gas. In Proceedings of the SPE Annual Technical Conference and Exhibition, New Orleans, LA, USA, 5–8 October 1986. [Google Scholar]
- Johns, R.T.; Dindoruk, B.; Orr, F.M., Jr. Analytical theory of combined condensing/vaporizing gas drives. SPE Adv. Technol. Ser. 1993, 1, 7–16. [Google Scholar] [CrossRef]
- Glaso, O. Miscible Displacement: Recovery Tests With Nitrogen. SPE Reserv. Eng. 1990, 5, 61–68. [Google Scholar] [CrossRef]
- Zhang, J.; Liao, X.; Cai, M.J.; Liu, M.; Li, R. Characteristic Analysis of Miscible ZONE of Slim Tube Experiment of CO2 Flooding. In Proceedings of the International Petroleum and Petrochemical Technology Conference 2019 (IPPTC 2019), Beijing, China, 27–29 March 2019; Lin, J., Ed.; Springer: Singapore, 2019. [Google Scholar] [CrossRef]
- Ahmad, W.; Vakili-Nezhaad, G.; Al-Bemani, A.S.; Al-Wahaibi, Y. Uniqueness, repeatability analysis and comparative evaluation of experimentally determined MMPs. J. Pet. Sci. Eng. 2016, 147, 218–227. [Google Scholar] [CrossRef]
- Holm, L.W.; Josendal, V.A. Mechanisms of Oil Displacement By Carbon Dioxide. J. Pet. Technol. 1974, 26, 1427–1438. [Google Scholar] [CrossRef]
- AlHamdan, M.; Cinar, Y.; Suicmez, V.S.; Dindoruk, B. Experimental and Numerical Study of Compositional Two-Phase Displacements in Layered Porous Media. In Proceedings of the SPE Reservoir Characterisation and Simulation Conference and Exhibition, Abu Dhabi, UAE, 9–11 October 2011. [Google Scholar] [CrossRef]
- Reis, P.K.P.; Carvalho, M.S. Pore-scale compositional modeling of gas-condensate flow: Effects of interfacial tension and flow velocity on relative permeability. J. Pet. Sci. Eng. 2021, 202, 108454. [Google Scholar] [CrossRef]
- Al-Abri, A.; Amin, R. Phase Behaviour, Fluid Properties and Recovery Efficiency of Immiscible and Miscible Condensate Displacements by SCCO2 Injection: Experimental Investigation. Transp. Porous Media 2010, 85, 743–756. [Google Scholar] [CrossRef]
- Yuan, Q.; Yao, S.; Zhou, X.; Zeng, F.; Knorr, K.D.; Imran, M. Miscible displacements with concentration-dependent diffusion and velocity-induced dispersion in porous media. J. Pet. Sci. Eng. 2017, 159, 344–359. [Google Scholar] [CrossRef]
- Flock, D.L.; Nouar, A. Parametric analysis on the determination of the minimum miscibility pressure in slim tube displacements. J. Can. Pet. Technol. 1984, 23, 80–88. [Google Scholar] [CrossRef]
- Zhang, K.; Gu, Y. Two different technical criteria for determining the minimum miscibility pressures (MMPs) from the slim-tube and coreflood tests. Fuel 2015, 161, 146–156. [Google Scholar] [CrossRef]
- Zhang, K.; Jia, N.; Zeng, F.; Li, S.; Liu, L. A review of experimental methods for determining the Oil-Gas minimum miscibility pressures. J. Pet. Sci. Eng. 2019, 183, 106366. [Google Scholar] [CrossRef]
- Randall, T.E.; Bennion, D.B. Recent Developments in Slim Tube Testing For HCMF Solvent Design. In Proceedings of the Technical Meeting/Petroleum Conference of The South Saskatchewan Section, Regina, SA, Canada, 5–7 October 1987. [Google Scholar] [CrossRef]
- Jacobson, H.A. Acid gases and their contribution to miscibility. J. Can. Pet. Technol. 1972, 11, 56–59. [Google Scholar] [CrossRef]
- Graue, D.J.; Zana, E.T. Study of a possible CO2 flood in Rangely Field. J. Pet. Technol. 1981, 33, 1312–1318. [Google Scholar] [CrossRef]
- Frimodig, J.P.; Reese, N.A.; Williams, C.A. Carbon dioxide flooding evaluation of high-pour-point, Paraffinic Red Wash reservoir oil. Soc. Pet. Eng. J. 1983, 23, 587–594. [Google Scholar] [CrossRef]
- Rutherford, W.M. Miscibility Relationships in the Displacement of Oil by light hydrocarbons. Soc. Pet. Eng. J. 1962, 2, 340–346. [Google Scholar] [CrossRef]
- Holm, L.W.; Josendal, V.A. Effect of oil composition on miscible-type displacement by carbon dioxide. Soc. Pet. Eng. J. 1982, 22, 87–98. [Google Scholar] [CrossRef]
- Wu, R.S.; Batycky, J.P. Evaluation of miscibility from slim tube tests. J. Can. Pet. Technol. 1990, 29. [Google Scholar] [CrossRef]
- Mogensen, K. A novel protocol for estimation of minimum miscibility pressure from slim tube experiments. J. Pet. Sci. Eng. 2016, 146, 545–551. [Google Scholar] [CrossRef]
- Amao, A.M.; Siddiqui, S.; Menouar, H. A New Look at the Minimum Miscibility Pressure (MMP) Determination from Slimtube Measurements. In Proceedings of the SPE Improved Oil Recovery Symposium, Tulsa, OK, USA, 14–18 April 2012. [Google Scholar] [CrossRef]
- Dindoruk, B.; Johns, R.; Orr, F.M. Measurement and modeling of minimum miscibility pressure: A state-of-the-art review. SPE Reserv. Eval. Eng. 2021, 24, 367–389. [Google Scholar] [CrossRef]
- Orr, F.M. Theory of Gas Injection Processes; Tie-Line Publications: Copenhagen, Denmark, 2007; Volume 5. [Google Scholar]
Publisher’s Note: MDPI stays neutral with regard to jurisdictional claims in published maps and institutional affiliations. |
© 2022 by the authors. Licensee MDPI, Basel, Switzerland. This article is an open access article distributed under the terms and conditions of the Creative Commons Attribution (CC BY) license (https://creativecommons.org/licenses/by/4.0/).