Abstract
This article aims to improve the secondary distribution process in a mass consumer company implementing technologies, such as transport management system (TMS) to achieve the objectives set by the company. A DMAIC based methodology is proposed to define and solve structured problems related to secondary distribution, following the performance of the process based on critical to logistics (CTL) factors. The methodology prioritized the design of a master plan for the secondary distribution and the characterization of the secondary distribution process, defining the principal technologies that should compose the business architecture of the secondary distribution, with emphasis on the TMS due to its significant impact and relevance for planning, execution, and control of the distribution process. This study replaces the control component of the DMAIC with the assess component to perform the economic and productivity evaluation of the implementation of a TMS since the improvement proposals were formulated and evaluated. The results show that TMS allows the reduction of delivery time variability, order processing time, voided invoices, distribution costs, the increase in customer service and efficiency in the distribution operation and generates profitability for the medium and long term.
1. Introduction
In today’s business environment, companies need to develop a supply chain approach that allows them to synchronize and harmonize their logistics systems by considering flows of products, services, information, and finances between suppliers, producers, distributors, carriers, customers, and stakeholders [1,2,3]. Within the supply chain, the logistics distribution process allows the timely delivery of customer orders (fulfillment) considering strategies, means of transport, infrastructure, and information and communication technologies (ICT), thus meeting customer needs at the lowest cost [4,5]. Therefore, the planning, execution, and harmonized control of the distribution system, which includes the flows of information, services, products, and finances, are essential to satisfy the requirements of customers and stakeholders profitably at the lowest risk [6]. In this sense, the distribution process represents the set of logistics activities that mitigate the differences between demand and supply, confirming the availability of products among the actors in the supply chain [7]. Currently, this process is directly associated with the concept of city logistics, which considers conditions and restrictions for last-mile deliveries such as roads, mobility, and congestion, environment, quality of life of the inhabitants, among others, and in turn requires proper management of operations, facilities, transportation systems, inventory strategies, distribution networks, and ICTs [8,9].
Due to the rapid growth of cities and the number of users, the demand for urban freight transport continuously increases, expanding logistics flows in limited zones and generating chaotic and uncoordinated transport [10]. Consequently, proper management of urban freight transport represents a fundamental element for sustainable economic growth [11]. It requires the distribution and transportation logistics systems to adopt ICTs to optimize the capacity of cargo vehicles, eliminate operational errors, and guarantee distribution routes that maximize performance, among others, therefore reducing costs, delivery times, delays, and pollution [12,13]. These conditions favor the use of logistics service providers (third-party logistics-3PL) as allies and partners in supply chains [14], pursuing a more efficient service to the end customer at a lower cost, adequate supply chain management, security in operations, and implementation and use of ICT [15,16].
The development of ICT is increasing, focusing more on digital platforms (portals, intranet/extranet), causing additional pressures for the competitiveness of supply chains [17]. The ICT involves directly with the customer relationships, manufacturing, transportation, warehousing networks, and data streams [18], mitigating problems related to goods payment, privacy and security, and traceability [19], and enhancing the firm’s performance [20]. Consequently, ICT platforms represent one of the main pillars of smart logistics to improve intelligent transport systems [21] and support urban last-mile logistics through on-board telematics that allow real-time monitoring of vehicles and lay-by areas [22]. Likewise, ICT can reduce air pollution, congestion, and carbon emissions of the delivery sector through computerized routing, scheduling systems, and vehicle telematics systems [23,24]. In this regard, TMS impacts the reduction of CO2 emissions within a distribution network by improving driving behavior, route optimization, and vehicle load level [25].
Likewise, the implementation of ICT in the distribution and customer service process is essential to support logistics management in real-time, allowing traceability and visibility of operations, resources, products, and actors, thus guaranteeing that deliveries comply with the quantity, quality, agreed delivery time, and established logistical conditions [26,27]. Therefore, ICTs are fundamental in the planning, execution, and control of distribution networks, since they allow the management of precise information in real-time, including the visibility and traceability of products, operations, and resources in the supply chain [27,28]. Investment in ICT has positively influenced productivity [29], allowing the supply chain execution (SCE) to optimize the movement of materials between distribution centers and other agents in the supply chain. Moreover, the success of the ICT implementation in logistics processes requires the proper selection and validation [30], the adoption of an appropriate ICT significantly impacts the competitive advantage of logistics companies and logistics operations [18], and companies require investments acquiring, updating, and maintaining technological infrastructure [31]. Therefore, it is necessary to review the appropriate methodologies to solve structured problems and support the selection and implementation of ICT for the secondary distribution.
Methodologies such as technology acceptance model (TAM), unified theory of acceptance and use of technology (UTAUT), dialogue–access–risk–assessment–transparency (DART), define–measure–analyze–improve–control (DMAIC), failure modes and effects analysis (FMEA), and quality function deployment (QDF) can predict the success of an ICT according to user perceptions, associated risks, and process modifications, ensuring ICTs become facilitators of value creation in logistics management. From these methodologies, the DMAIC is the most characteristic methodology of lean six sigma implementation in organization processes [32], is usually used to support and verify the ICT appropriation, solving structured problems, supporting management processes in ICT implementation projects [33,34], and guarantees a successful ICT implementation in logistics processes [30]. Likewise, the DMAIC methodology can be modified and supplemented, as in the case of DMADV, which employs the define, measure, analyze, design, and verify phases to replace existing systems with new processes [32].
Based on the research gaps in the literature, it is necessary to analyze the connections between lean six sigma (LSS) and ICT [35], extend the understanding of LSS implementation in specific contexts to create a background to support adopting LSS in logistics services environments successfully [36]. Likewise, it is required to produce more papers using other already existing or completely new methods related to DMAIC [32] and conduct research on real organizations using ICT platforms [37]. Therefore, this study aims to improve the secondary distribution process in mass consumer companies through the use and appropriation of ICT, offering an improvement approach based on data analysis and management tools in supply chain logistics, especially for the distribution process improvement in terms of service level, freight costs on sales, and returns from customers. The main contributions of this paper are as follows:
- The DMAIC methodology improves the secondary distribution process in a company, involves the selection of ICT, and promotes connections between LSS and ICT in logistics.
- The DMAIC methodology is modified by discarding the control component since the improvement proposals are formulated, and it is replaced by the assess component to evaluate the economic and productive impacts generated in the secondary distribution system of a company.
- This study provides an application in a large food company to show the efficiency and effectiveness of the proposed methodology.
For this, Section 2 presents backgrounds on secondary distribution and methodologies for ICT selection and implementation, Section 3 describes the company under study, the methodology for the validation of ICT, and analyzes the information of the secondary distribution of the company based on critical to logistics (CTL) factors. Section 4 presents improvement opportunities in the distribution process considering a management approach and proposes a TMS to increase efficiency and customer service based on an economic and productivity analysis. Finally, Section 5 presents the conclusions and future works derived from this study.
2. Research Background
Companies dedicated to the manufacture and distribution of mass consumption food products typically serve distribution channels (stores and supermarkets) that must satisfy customer requirements (quantities, references, quality, and agreed delivery time) [38,39]. To achieve efficient distribution, these types of companies usually resort to primary distribution, which implies the distribution of products from the production facilities or central warehouses to the regional distribution centers (DCs), and a secondary distribution involving deliveries from regional DCs to customers (supermarkets and stores), relating directly to city logistics models [40,41].
The secondary distribution presents more considerable organizational and logistical complexity than the primary distribution due to stores and supermarkets located in high-density urban areas. It implies managing congestion, restrictions for certain types of vehicles in delivery areas, driving regulations, reduced speed, while the distances between delivery points are usually relatively short [9,13,42]. Additionally, the structure of the urban distribution network typically contains multiple origin nodes (factories or warehouses), destination nodes (warehouses, stores, or supermarkets), and arcs connecting nodes (distances, costs, or times between nodes). Therefore, it is necessary to implement quantitative models in distribution systems to design routes, comply with the planned service levels, and achieve the highest efficiency in the distribution network [8,43].
These solutions are usually framed in ICT; however, the rapid development of technologies increases the number and scope of the tools applicable to several logistics processes, causing an increase in the ICT available for logistics processes, which impedes decision making about which technology is more convenient to implement [31]. From these technologies, TMS has fulfilled a strategic role in the planning and management of supply chain activities due to the importance of transportation management in the costs and interactions in companies, customers, and suppliers [44], including integrative digital technologies in the supply chain aligned with logistics 4.0 [45] and geographic information systems that support decision making, traceability, and route monitoring for distribution and transportation of goods [46].
TMS is the ICT that continuously optimizes transport variables by increasing efficiency, improving customer service, and reducing distribution costs. TMS connects supply chain agents and generates visibility to shipping and order fulfillment activities automating transportation operations. Similarly, a TMS supports the transportation processes from the operational execution and the financial settlement, allows operations traceability, freight payments, managing indicators, making reports, and scheduling docks, offering a range of solutions to the planning and execution of transport, freight management, foreign trade, package delivery, and connectivity. The scope of the TMS in operations planning determines the minimum routing cost to serve a customer and determines from which warehouse the orders should be delivered to customers [44].
TMS has been approached from the scientific literature by different authors who highlight the importance of effective management of supply chain technologies, especially between retailers and suppliers, to obtain satisfactory joint performance in relationships, collaboration, and synchronization between the parties [47]. Asimakopoulos et al. [48] developed the DynaCargo (dynamic cargo routing on-the-go) project for sustainable ecological development in urban spaces implementing a TMS for urban solid waste collection, relying on RFID units, DTN network protocols, and dynamic routing algorithms to minimize hardware and telecommunication costs. Similarly, Evensen [34] works with an ATMS (advanced transportation management systems), which combines transportation management services, such as intersection control, pollution reduction, access control, management of parking lots, docks, ramps, among others, and enables customized services. On the other hand, Mu [49], Li et al. [50], and Ashour et al. [51] propose TMS applications for the transport of passengers, through transport routes, vehicle monitoring, bus stations, implementation of GPS (global positioning system) or GPRS (general packet radio service) applications and integration of systems of urban and rural transport. Karoń and Janecki [52] analyzed the development of an intelligent transport system (ITS) for a city in Poland.
However, it is necessary to use a technology validation methodology to determine the relevance of an ICT for a logistics process. Based on [30], Table 1 presents a comparison between methodologies used for the validation of ICT for logistics processes, highlighting the advantages and disadvantages of each one. From these options, the DMAIC is chosen, which despite representing a generalist and not a very standardized methodology, it can be adapted and modified according to the requirements of the logistics process. Likewise, DMAIC is used because it is a comprehensive methodology that seeks the continuous improvement of processes, focusing not exclusively on establishing whether the ICT is relevant or not but also on determining the requirements to overcome identified problems. Accordingly, in this study, the control component is replaced by the assess component because the proposed scope covers up to the economic and productive validation of the solutions.

Table 1.
Advantages and disadvantages of ICT validation methodologies.
To guarantee a structured improvement within logistics processes, methodology, such as DMAIC, is required to provide a framework to structure robust and high-quality solutions according to problems faced by companies [53]. Consequently, LSS represents a data-driven approach, which uses specific methodologies to reduce variability, eliminate waste within business processes, and lead to fact-based decisions through statistical tools and techniques. DMAIC consists of understanding the root causes of a problem through exhaustive analyses to propose assertive solutions and prioritize premature decision making to improve the process [54], representing one of the methodologies ensuring the implementation of supply chain management practices in companies [55,56], reducing security risks in container transport within the supply chain [57], developing improvement models for the analysis and interpretation of performance indicators [58], improving logistics replenishment processes, the efficiency of the transportation process, and business performance in terms of on-time in-full orders, quality level in the supply chain network [59].
DMAIC methodology provides labor costs savings, eliminates replenishment routes without generating negative impacts in the process, and increases employee and customer satisfaction. It entails improving transport and distribution logistics processes to lead them to world-class processes. Therefore, it is pertinent to use the DMAIC methodology in this study since it has proven to be a successful methodology to improve logistics processes, especially in transportation and distribution systems, and can complement other methods for improving business processes [56]. DMAIC can be used in various sectors because it is not a standardized procedure and is used as a continuous improvement method [32]. It has been used as a framework for supporting continuous improvement in logistics processes, encompassing logistics services [36], procurement processes with ICT for process digitization purposes [35], reverse logistics processes for the pharmaceutical industry [60], inbound logistics and production scheduling to manage the transformation from traditional operations towards the integration of the IoT and cyber-physical systems [61], service and delivery processes to increase the level of compliance with service agreements, reduce CO2 emissions, improve invoice processing time and delivery fill rates [62], supply chain strategies in collaboration with ICT platforms to make organizations resilient to disruptions [37], internal logistics and hospital sustainable digital transformation to elaborate an intelligent support system [54], and supply chain management to minimize lead times focusing on the improvement in processes, information systems, organizational structures, and advances in distribution and transportation technologies [63].
3. Materials and Methods
This study proposes a methodology based on some DMAIC components (definition, measurement, analysis, and improvement) and tools for the logistics process improvement in the supply chain to achieve the objectives of a secondary distribution system. The control component of the DMAIC is discarded since the improvement proposals will be formulated and evaluated. Additionally, this study includes a methodology component called economic and productivity evaluation to assess the potential impacts generated by the proposed improvements for the secondary distribution system in the company. DMAIC methodology represents a systematic analytic procedure that could be generalized to a wide range of applications [64]; therefore, the methodological approach based on the DMAIC is appropriate since it allows for developing improvement proposals based on the data analysis from the secondary distribution network using statistical techniques and process management. Figure 1 shows the stages of the methodological framework to achieve the objective of this study.
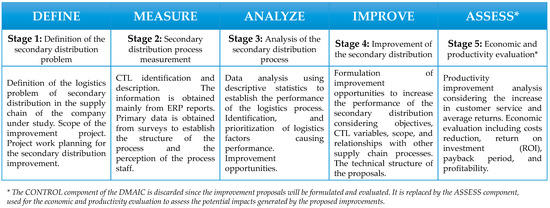
Figure 1.
Stages of the methodological proposal.
The company under study belongs to the food sector (refrigerated and frozen food), producing more than 1200 tons of products per month and developing high-quality processes. The company’s portfolio exceeds 400 references between its brand and brands manufactured for third parties. The company promotes products through various distribution channels: chain channels, supermarkets, mini markets, direct store delivery (DSD), institutional sales, and state contracts. Through nine distribution centers (DC), the company can distribute its products directly to the customer. However, in recent years, the company declared losses due to congestion caused by the inadequate physical infrastructure in the operating cities, the competitive issues in the market, and problems related to the installation and appropriation of comprehensive management software that caused significant trauma to the company. In addition, some logistics problems related to quality, quantity, and delivery timeliness persist, for which it is necessary to improve the service level, the freight cost, and the order returns indicator.
This section introduces the first three stages of the methodological framework, including the definition of the distribution problem (Stage 1), measurement of the distribution process (Stage 2), and analysis of the distribution process (Stage 3).
3.1. Definition of the Secondary Distribution Problem (Stage 1)
This stage delimits the company’s problem. Table 2 establishes the scope of the problem and shows a deficiency in the service level by being 9.5% below the set goal. Similarly, cost inefficiencies due to returns and voided invoices severely affect EBITDA (earnings before interest, taxes, depreciation, and amortization) and profitability. Therefore, the secondary distribution is affecting the service level and the efficiency of the company and its supply chain.
Table 2.
Definition of the secondary distribution problem.
3.2. Measurement of the Secondary Distribution (Stage 2)
This stage measures the secondary distribution, beginning with the definition and description of the CTL factors. CTL factors represent variables that directly impact the secondary distribution process and must be under control to visualize the effectiveness of the process. For this case, the CTL factors will be the variables on which the quantitative and qualitative study will be focused to understand the current problem. Table 3 presents these quantitative variables.
Table 3.
Study variables.
The information collected for each CTL factor is obtained from historical data reports from the company’s ERP. The primary information comes from a survey directed to the logistics staff of the company. This information is arranged according to dates, regional DCs, and CTL to establish the current performance measurement of the secondary distribution. Different descriptive statistics techniques provide a quantitative approach to guarantee the validity of the analysis of the distribution process.
3.3. Analysis of the Secondary Distribution (Stage 3)
This stage develops a descriptive diagnosis and a quantitative performance measurement for the secondary distribution to understand the characteristics and performance of the process. A survey applied to the logistics management and the collaborator in this logistics provides primary data. The questions are related to the CTL factors defined for the secondary distribution and are listed below:
- How many DCs does the company have in the supply chain?
- How is the secondary distribution process performed in the company?
- Are the cargo vehicles owned by the company or subcontracted?
- What are the main criteria for selecting a logistics operator?
- How are freights managed in the distribution of the company?
- Which of the two freights (primary or secondary) is more important for the company and why?
- Are there cost overruns in the company’s secondary transport?
- Is an ICT implemented in the company for distribution and transportation management?
The information obtained from the survey indicates that secondary distribution directly impacts customer satisfaction and profitability. The secondary distribution is highly complex since several municipalities are served from nine regional DCs and a DC attached to the production plant. The secondary distribution process is developed in several phases in which the company, the customer, and the carrier interact. These phases include the storage of the finished product in regional DCs, and for this, the primary freight is transported in large capacity trucks (large volumes) from the DC of the production plant to regional DCs. The sellers then record the orders in the Enterprise Resource Planning (ERP) system so that the finished product can be invoiced based on the seller’s orders. Each DC prepares the dispatch order, and the carriers distribute the products from the regional DC to the customers. Since the company does not own a vehicle fleet to transport the products from the DC to the points of consumption, the transport of the secondary freight is subcontracted with cargo transport companies (3PL) that fulfill the specifications required by the company (logistical capacity, financial capacity, national coverage and offices in the DC locations, competitive costs, and Money Laundering Risk Management System approval).
On the other hand, the secondary freight cost is relevant (approximately 7% on sales) due to inefficiencies generated by lack of synchronization and collaboration with other actors in the supply chain, especially with transporters and customers, as well as low-effectiveness logistics and commercial practices. Likewise, the company has an ERP system that provides an administrative and commercial approach to orders, but not a logistics approach that supports management, traceability, and visibility in the secondary distribution (routing, traceability, visibility, and transportation and distribution management), and hence inefficiencies are generated in productivity and costs described above.
Regarding the quantitative measurement of performance, an analysis is performed for the five CTL factors of the secondary distribution: secondary freight, voided invoices, product turnover returns, product quality returns, and service level.
3.3.1. Secondary Freight
Table 4 shows the secondary freight costs by regional DC and their share of the total costs of secondary freight, where DC 1, 2, and 3 represent 58.9% of the total expenses in secondary transportation per year. Logistics improvement strategies must focus on these DCs to improve the secondary distribution since they compile the highest sales and transportation operations.
Table 4.
Secondary freight share.
Table 5 shows the consolidated annual freight costs on sales, indicating a sales share of 6.15% for the secondary freight, representing a significant value concerning the goal set by the logistics management (5% on sales). Therefore, the company requires improvement strategies for its reduction since this CTL factor impacts the profitability and efficiency of the secondary distribution.
Table 5.
Consolidated annual freight.
The capacity of the trucks and their respective percentage of use must be analyzed since the trucks used in the secondary distribution must dedicate 25% of the volume to allow air circulation in the cold chain and guarantee logistics operational excellence. Table 6 shows the average truck utilization for each regional DC, identifying that none of the regional DC uses 75% of the truck capacity to perform the secondary distribution. The DC with the highest truck utilization is DC 1 with 68%, while the lowest is DC 9 with 33% on average. According to the weighted average of vehicle use, considering the participation of each DC in sales, the company presents an average vehicle occupancy of 61%. These results highlight the need to implement logistics improvements to increase truck utilization and increase logistics efficiency.
Table 6.
Percentage of truck utilization by regional DC.
3.3.2. Voided Invoices
Voided invoices represent orders not delivered to the customer even though they have been invoiced. The cancellation of invoices impacts the efficiency and profitability of logistics, hence its importance in the present analysis. The information collected reflects that 80% of the voided invoices during a year belong to DC 1, 3, 4, 5, representing a value of USD 592,987, equivalent to 2.3% of the company’s annual sales. Tools such as cause–effect diagrams indicate that the most critical causes relate to logistics, internal, and external communication problems and can be improved by implementing real-time ICTs and training the staff to renegotiate with customers. Regarding transport logistics problems, the analysis identifies issues, such as customers unattended by drivers, non-compliance in delivery times, and driver’s delivery errors, representing an annual value of USD 115,399. These problems can be mitigated using efficient and specialized ICTs for transport management.
3.3.3. Product Turnover Returns
Product turnover returns represent customers maintaining the product at their facilities, and it is necessary to pick up as it approaches expiry because the sale has yet to be attributed to the final consumer. It occurs due to an error in the demand forecast, and the company takes care of the reverse logistics for its collection. The procedure of returns is relatively similar during all months, and they are related to low sales, poor inventory management, short expiration dates, among others. The logistics cost of returns represents an average annual value of USD 53,959. These values indicate the importance of improving this CTL factor since returns do not generate value for customers and affect the efficiency and profitability of the supply chain.
3.3.4. Product Quality Returns
Product quality returns occur when some characteristics of the delivered product are not complying with the quality specifications, generating risks to the consumer’s health. Therefore, the product is collected and later destroyed or sold as raw material for other industries. These returns affect operational efficiency, customer satisfaction, and profitability. The cost of these returns represents an average of 1.29% of annual sales, while the company’s goal is to obtain 1% of product quality returns.
3.3.5. Service Level
The service level is measured by comparing the units billed with the units requested by customers. The service level decreases with each line that has been ordered and has not been invoiced. The secondary distribution of the company impacts the service level since it is responsible for delivering the products to the customers. From Table 7, it is deduced that the service level is on average at 85.5%, which is lower than the established goal of 95%, and that no regional DC reaches it, highlighting the need to implement an improvement plan to increase it.
Table 7.
Service level by regional DC.
Therefore, the company must improve the service level, reduce the costs of secondary freight, reduce the cancellation of invoices and customer returns. Likewise, the company does not meet the goals set for the five CTL factors, which leads to the formulation of improvement proposals for the secondary distribution in the company. Moreover, the logistics strategies and processes associated with the secondary distribution are not strategically aligned with the conditions and restrictions of the city logistics where the company’s DCs are located. Consequently, the company requires improvement proposals for the secondary distribution considering the collaboration and synchronization of logistics processes within a city logistics approach. Likewise, it demands the implementation of ICTs with real-time functionalities. The improvement of the secondary distribution of the company will allow the appropriation of ICTs that have been developed in the scientific literature and world-class operations, facilitating the approach to the concepts of city logistics.
4. Results and Discussion
This section introduces the last two stages of the methodological framework, including secondary distribution improvement from a management approach (Stage 4) and the economic and productivity evaluation for secondary distribution improvements (Stage 5).
4.1. Secondary Distribution Improvement from a Management Approach (Stage 4)
Based on the performance analysis of the CTL factors, it is necessary to identify and select improvement opportunities to meet the goals set for the secondary distribution. The improvement opportunities are detailed in Table 8, describing the factor, current problem, proposed solution, and expected impacts.
Table 8.
Improvement opportunities for CTL factors.
A structured dialogue methodology was implemented to select the improvement opportunities, in which the logistics manager, a group of internal analysts, and external experts analyzed the improvement opportunities. This group assigns a score from 1 to 10, where 10 represents the highest rating. Table 9 presents the scoring results, identifying that the secondary distribution management, secondary freight, and product turnover returns received the highest rating (greater than 8.5).
Table 9.
Rating of improvement opportunities for secondary distribution.
Therefore, the improvement proposals consist of improving the secondary distribution from a management approach and implementing a TMS (transport management system) to support the effective management of secondary distribution. The management approach is based on a master plan that establishes goals, strategies, logistics processes, organizational structure, and ICTs such as ERP, order management system (OMS), warehouse management system (WMS), and TMS. This master plan (see Table 10) must be aligned with the strategic plan of the company and its supply chain strategies.
Table 10.
Master plan for the secondary distribution.
Table 11 presents the characterization of the secondary distribution based on a SIPOC analysis (suppliers, inputs, process, outputs, customers), including improved activities, and the proposal to appropriate real-time ICTs to support the decision-making process. On the other hand, the characterization is aligned with the master plan and the logistics strategy. The most relevant improved activities are the planning and selection of means of transport according to the logistics conditions of the delivery, as well as routing planning considering minimal tardiness in the secondary distribution network. Additionally, the characterization includes the TMS implementation to support the management of the secondary distribution, including the synchronization with the WMS and the ERP.
Table 11.
Characterization of the secondary distribution.
The second improvement proposal consists of implementing ICTs to improve the secondary distribution. From the master plan and characterization of the secondary distribution, the importance of appropriating a TMS is established, including its synchronization with the company’s WMS and ERP and other ICTs implemented in the company. As shown in Figure 2, the synchronization of multiple ICTs is required through information and technology architecture (physical and logical data, software, hardware, and communications supporting ICTs). In this sense, Table 12 describes the scope and functionality of the proposed ICT architecture based on the ERP, WMS, order management system, and TMS.
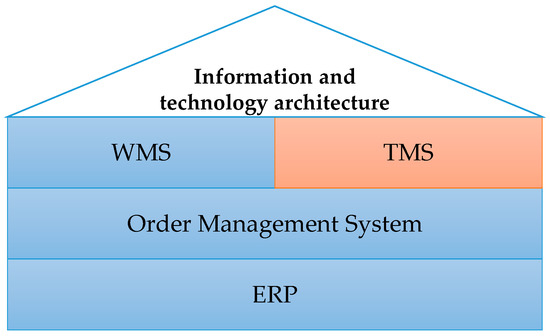
Figure 2.
Information and technology architecture for the secondary distribution.
Table 12.
ICT in the business architecture of the secondary distribution.
Since the TMS is the most relevant ICT in the business architecture for the logistics processes in the company under study, Table 13 describes each of its functionalities, impacts, and software and hardware required to support it.
Table 13.
TMS functionalities.
Key factors are pivotal for the proper implementation of the TMS. In this sense, the commitment of senior management, work teams to implement the project, effective communication among project stakeholders, and proper training of team members according to their role facilitate overcoming obstacles when they appear. Therefore, the proper implementation and integration of a TMS will support the secondary distribution operation to ensure satisfactory quality and productivity levels, standardized, and controlled processes to prevent operational and financial errors. The TMS will offer optimization tools adapted to customers, suppliers, distribution channels, and operations. All this will generate appropriate and controlled costs leading to a customer service improvement and a reduction in total transportation and distribution costs.
4.2. Economic and Productivity Evaluation for Secondary Distribution Improvements (Stage 5)
Table 14 quantifies the investments for the successful implementation of a TMS in the company. The improvement opportunities presented above support these investments. Hence, the acquisition and proper use of TMS require one-time investments (incurred once) and periodic investments (repeated every certain period) to acquire the technology for the secondary distribution and guarantee its operation over time.
Table 14.
Investments for the implementation of a TMS.
According to Table 13, which shows the expected impacts from the implementation of the TMS and based on the information regarding the quantitative measurement of the performance of the secondary distribution, Table 15 presents the expected productivity impacts supported by Table 13.
Table 15.
Productivity impacts generated by the implementation of the TMS.
From Table 15, the increase in customer service generates an increase in the frequency and volumes of customer orders. The customer service can increase the purchase volume of current customers by at least 3%. For practical purposes, the estimations consider a 4% profit margin for the sold products to quantify the profit generated by the TMS in terms of increased purchases or repurchases. Therefore, the company’s annual sales represent USD 25,899,320, of which an increase of 3% equals USD 776,980, providing a supplemental income equivalent to USD 31,079 (4% profit margin) due to good customer service. Moreover, the TMS implementation improves the transportation selection process, reduces the number of unexpected and urgent deliveries, and reduces the response time for decision making, reflected in increased efficiency in the transportation and distribution processes.
As shown in Table 16, the secondary distribution costs represent 4.72% on annual sales, with which the goals established and proposed by the company are met. In addition, the implementation of TMS allows for reducing the cost of voided invoices caused by secondary distribution from 0.45% to 0.27% on annual sales. Likewise, the improvements in voided invoices, efficiency in the distribution operation, reduction of the variability of the delivery time, and reduction of the order processing time allow for reaching the desired service level, from 85.5% to 95%.
Table 16.
Impact values generated by the implementation of the TMS.
Table 17 presents the economic analysis to determine the feasibility of the TMS project. The economic evaluation is based on years to visualize the implementation time of the TMS (stipulated in 24 months) and the investment return over time. Likewise, the economic analysis considers annual inflation of 5% to update the investments values and productivity savings. As shown in Table 17, the TMS implementation takes two years; then, the recovery of the investment begins after this period due to the impacts of the project. This information provides an objective analysis of the project’s economic impact to support the decision to implement a TMS to improve the efficiency of the secondary distribution.
Table 17.
Economic analysis of the TMS implementation.
Table 18 shows the economic impact indicators such as the net present value (NPV), the internal rate of return (IRR), the investment payback period (IPP), and the return on investment (ROI) calculated from Table 16. The NPV uses a 20% annual rate, representing an attractive rate for the company. The NPV is USD 659,295, which is equivalent to an IRR of 84%; that is, the TMS implementation project covers its investment and operational costs, generating additional value in 5 years, and with a return rate higher than four times the investor opportunity rate (discount rate).
Table 18.
Economic variables in the TMS implementation.
Likewise, the project shows that the IPP is two years and nine months, establishing that once the TMS is fully operational, it covers its investment costs in just nine months of operation. Regarding the return on investment (ROI), this determines the economic benefit generated by the TMS system. The ROI results from the division between the net income of the TMS implementation and implementing costs. Table 19 shows that the project does not provide ROI for the first two periods when the TMS is being implemented. Then, the TMS implementation provides ROI of 38%, 135%, 205%, and 260% for years 2, 3, 4, 5, respectively.
Table 19.
ROI for different periods.
This information confirms the TMS is a viable solution to guarantee the sustainability and growth of the secondary distribution logistics operations of the company. Therefore, the benefits of TMS come from the improvements offered by the modules of cargo transport planning, vehicle and carrier selection, routing, visibility and traceability for cargo and orders, sales synchronization, billing and logistics, cost and freight management of the secondary distribution and management indicators cube. Consequently, the proposed DMAIC methodology technically and economically validated a TMS for a distribution system, demonstrating the achievement of company objectives related to the reduction of delivery time variability, order processing time, voided invoices, distribution costs, the increase in customer service, and efficiency in the distribution operation, as well as generating profitability for the medium and long term.
4.3. Discussion
From the traditional DMAIC methodology, adaptable methodologies can arise to solve multiple logistics problems involving ICT. In this sense, by proposing the assess element and replacing the control element, the DMAIS (define–measure–analyze–improve–assess) methodology is obtained, which, unlike other technology assessment methods, involves the analysis of the entire logistics process. This approach allows for analyzing the requirements of the process, considering the relevance of implementing, modifying, or improving technologies, and selecting the most appropriate technologies that provide the solutions required and expected in the process.
Consequently, the define phase determined the problem of the secondary distribution, the current value, and the desired value of related indicators. The measure phase was based on CTL factors represented in five variables that allowed us to understand the current problem. The analysis phase provided a descriptive diagnosis and a quantitative performance measurement for the secondary distribution to understand the characteristics and performance of the process. The improve phase identified and selected improvement opportunities to meet the goals set for the secondary distribution, prioritizing the secondary distribution management, and proposing a master plan and characterization for the secondary distribution, highlighting the importance of appropriating a TMS is established, including its synchronization with the company’s WMS and ERP, and other ICTs implemented in the company. The assess phase validated the investments, productivity impacts, savings, incomes, and economic analysis generated by the implementation of the TMS.
In the case of the company under study, the secondary distribution process presented relevant challenges in terms of CTL factors (secondary freight expenses, voided invoices, product quality returns, product turnover returns, and service level). A survey conducted to employees involved in the strategic, tactical, and operational levels allowed for obtaining insights about the CTL factors of the secondary distribution process. The structured dialogue methodology prioritized the improvement opportunities, highlighting a master plan and a SIPOC characterization, which suggested the adoption of a TMS in sync with the WMS and the ERP. The expected benefits for the company related to the adoption of a TMS directly impact the CTL, offering savings in voided invoices and secondary distribution, and incomes for good customer service, providing profits and ROI after two years of TMS operation. Moreover, the commitment of the top management is pivotal to ensure the success of the DMAIS methodology. Top management must support improvement projects by providing resources and personnel for the diagnostic and definition of the problem, analysis of information and indicators, creation of improvement opportunities, design of a master plan and SIPOC characterization of the logistics process to be improved, and economic and productive evaluation of the selected project.
As has been done in other investigations [36,55,59,62,63], this study focuses on a case study to demonstrate the efficiency and effectiveness of the DMAIS methodology by establishing the main problems related to secondary distribution, the causes, and solutions to these problems. In this case, a TMS is significant due to the potential costs and benefits generated to the company. Specifically, the implementation of a TMS generates expected impacts in reducing unexpected deliveries, freight transportation costs, increased efficiency in operations, in-transit cargo tracking, improvement in service level, decreased order processing time, reduction of invoice processing time, reduction in secondary transportation costs, among others. These impacts allow for reaching the operational and strategic goals of the organization and supply chain.
5. Conclusions
This study proposed a plan to improve the secondary distribution for a company in the productive sector, thereby allowing increases to customer services, reducing the value of freight over sales, and reducing customer returns to guarantee the operational and economic sustainability of the company. DMAIC methodology was implemented by replacing the control component with the assess component to perform the economic and productivity evaluation of the implementation of a TMS since the improvement proposals were formulated and evaluated. This methodology defined the main problems of the secondary distribution, facilitating the understanding of the performance and characteristics of the process based on primary and secondary information. From the proposed improvement opportunities, the most relevant and appropriate solutions were selected using a structured dialogue. This methodology prioritized the design of a master plan for the secondary distribution and the characterization of the secondary distribution process.
This study defined the principal ICTs that should compose the business architecture of the secondary distribution, with emphasis on the TMS as a technological tool of significant impact and relevance for planning, execution, and control of the distribution process. The economic analysis of the TMS implementation showed that this technology allows for achieving the objectives set by the company, providing a secondary distribution cost of 4.72% on annual sales. Additionally, TMS reduces the cost of voided invoices caused by the secondary distribution from 0.45% to 0.27%. Likewise, the desired service level could increase from 85.5% to 95% through improvements in voided invoices, efficiency in the distribution operation, reduction in delivery time variability, and reduction in order processing time.
Moreover, the economic analysis showed that the TMS implementation is highly profitable for the medium and long term. Therefore, the proposed methodology validates the technical, productive, and economic viability for ICT implementations in logistics processes, offering a solution to improve logistics problems such as the secondary distribution process. The limitations of this research are mainly linked to the use of a case study in a single company, and the proposed methodology does not cover the post-implementation phase to compare the expected performance to the performance obtained after the improvement of the secondary distribution process. Another limitation of the study is associated with the supplier selection process for the ICT; then, future research may integrate a supplier selection method (a multicriteria decision-making method) to the proposed technology and compare the expected results versus the actual results to measure the precision of the methodology. Likewise, future works should implement the proposed methodology to validate other ICT implementations in logistics processes, such as purchasing, demand management, scheduling, and warehouse management.
Author Contributions
Conceptualization, J.A.C. and R.A.G.; methodology, R.A.G.; validation, J.A.C. and R.A.G.; formal analysis, R.A.G.; investigation, J.A.C. and R.A.G.; resources, R.A.G. and P.C.; writing—original draft preparation, J.A.C. and R.A.G.; writing—review and editing, J.A.C. and P.C.; visualization, J.A.C. and R.A.G.; supervision, J.A.C. and P.C. All authors have read and agreed to the published version of the manuscript.
Funding
This research received no external funding.
Institutional Review Board Statement
Not applicable.
Informed Consent Statement
Not applicable.
Data Availability Statement
The data presented in this study are available on request from the corresponding author.
Conflicts of Interest
The authors declare no conflict of interest.
References
- Aldana-Bernal, J.C.; Bernal-Torres, C.A. Social capital and the integration of processes in the supply chain management in the real sector in Colombia. Inf. Tecnol. 2019, 30, 249–262. [Google Scholar] [CrossRef]
- Salas-Navarro, K.; Meza, J.A.; Obredor-Baldovino, T.; Mercado-Caruso, N. Evaluation of the supply chain to improve competitiveness and productivity in the metalworking industry in Barranquilla, Colombia. Inf. Tecnol. 2019, 30, 25–32. [Google Scholar] [CrossRef]
- Munir, M.; Jajja, M.S.S.; Chatha, K.A.; Farooq, S. Supply chain risk management and operational performance: The enabling role of supply chain integration. Int. J. Prod. Econ. 2020, 227, 107667. [Google Scholar] [CrossRef]
- Henríquez-Fuentes, G.R.; Cardona, D.A.; Rada-Llanos, J.A.; Robles, N.R. Medición de Tiempos en un Sistema de Distribución bajo un Estudio de Métodos y Tiempos. Inf. Tecnológica 2018, 29, 277–286. [Google Scholar] [CrossRef]
- Liu, Y. An optimization-driven dynamic vehicle routing algorithm for on-demand meal delivery using drones. Comput. Oper. Res. 2019, 111, 1–20. [Google Scholar] [CrossRef]
- Ayaviri-Panozo, A.; Ramírez-Correa, P.E. The most used theories in the collaborative price negotiation between companies of the supply chain. Inf. Tecnol. 2019, 30, 201–210. [Google Scholar] [CrossRef]
- Schönsleben, P. Integral Logistics Management; CRC Press: Boca Raton, FL, USA, 2018. [Google Scholar]
- Eshtehadi, R.; Demir, E.; Huang, Y. Solving the vehicle routing problem with multi-compartment vehicles for city logistics. Comput. Oper. Res. 2020, 115, 104859. [Google Scholar] [CrossRef]
- Suarez-Chilma, V.F.; Sarache, W.A.; Costa, Y.J. Una Solución al Enrutamiento de Vehículos en Ciudades Montañosas Considerando Aspectos Ambientales y Económicos. Inf. Tecnológica 2018, 29, 3–14. [Google Scholar] [CrossRef][Green Version]
- Iwan, S.; Małecki, K. Data flows in urban freight transport management system. Commun. Comput. Inf. Sci. 2015, 531, 1–10. [Google Scholar] [CrossRef]
- Muñoz-Villamizar, A.; Santos, J.; Montoya-Torres, J.; Velázquez-Martínez, J. Measuring environmental performance of urban freight transport systems: A case study. Sustain. Cities Soc. 2020, 52, 101844. [Google Scholar] [CrossRef]
- Trappey, A.J.C.; Trappey, C.V.; Fan, C.-Y.; Hsu, A.P.T.; Li, X.-K.; Lee, I.J.Y. IoT patent roadmap for smart logistic service provision in the context of Industry 4.0. J. Chin. Inst. Eng. 2017, 40, 593–602. [Google Scholar] [CrossRef]
- Micheli, G.J.L.; Cagno, E.; Mustillo, G.; Trianni, A. Green supply chain management drivers, practices and performance: A comprehensive study on the moderators. J. Clean. Prod. 2020, 259, 121024. [Google Scholar] [CrossRef]
- Osorio, J.C.; Manotas, D.F.; Rivera, L. Priorización de Riesgos Operacionales para un Proveedor de Tercera Parte Logística-3PL. Inf. Tecnol. 2017, 28, 135–144. [Google Scholar] [CrossRef]
- Tang, C.S.; Veelenturf, L.P. The strategic role of logistics in the industry 4.0 era. Transp. Res. Part E Logist. Transp. Rev. 2019, 129, 1–11. [Google Scholar] [CrossRef]
- Winkelhaus, S.; Grosse, E.H. Logistics 4.0: A systematic review towards a new logistics system. Int. J. Prod. Res. 2019, 58, 18–43. [Google Scholar] [CrossRef]
- Kiisler, A.; Solakivi, T.; Hilmola, O.P. Supply chain and ICT issues of Estonia: Survey findings. Procedia Comput. Sci. 2020, 176, 828–837. [Google Scholar] [CrossRef] [PubMed]
- Omotayo, A.; Melan, M. Factors influencing the Information and Communication Technology (ICT) of third party logistics in Malaysia. Int. J. Supply Chain Manag. 2017, 6, 202–208. [Google Scholar]
- Ul-Hameed, W.; Nadeem, S.; Azeem, M.; Aljumah, A.I.; Adeyemi, R.A. Determinants of e-logistic customer satisfaction: A mediating role of information and communication technology (ICT). Int. J. Supply Chain Manag. 2018, 7, 105–111. [Google Scholar]
- Ul-Hameed, W.; Shabbir, M.S.; Imran, M.; Raza, A.; Salman, R. Remedies of low performance among pakistani E-logistic companies: The role of firm’s IT capability and information communication technology (ICT). Uncertain Supply Chain Manag. 2019, 7, 369–380. [Google Scholar] [CrossRef]
- Korczak, J.; Kijewska, K. Smart Logistics in the development of Smart Cities. Transp. Res. Procedia 2019, 39, 201–211. [Google Scholar] [CrossRef]
- De Marco, A.; Mangano, G.; Zenezini, G.; Cagliano, A.C.; Perboli, G.; Rosano, M.; Musso, S. Business Modeling of a City Logistics ICT Platform. Proc. Int. Comput. Softw. Appl. Conf. 2017, 2, 783–789. [Google Scholar] [CrossRef]
- Bates, O.; Friday, A.; Allen, J.; McLeod, F.; Cherrett, T.; Wise, S.; Piecyk, M.; Piotrowska, M.; Bektas, T.; Nguyen, T. ICT for Sustainable Last-Mile Logistics: Data, People and Parcels. In Proceedings of the ICT4S2018: 5th International Conference on Information and Communication Technology for Sustainability, Toronto, ON, Canada, 14–18 May 2018; Volume 52, pp. 49–67. [Google Scholar]
- Evangelista, P.; Santoro, L.; Thomas, A. Environmental sustainability in third-party logistics service providers: A systematic literature review from 2000–2016. Sustainabilty 2018, 10, 1627. [Google Scholar] [CrossRef]
- Wang, Y.; Rodrigues, V.S.; Evans, L. The use of ICT in road freight transport for CO 2 reduction–an exploratory study of UK’s grocery retail industry. Int. J. Logist. Manag. 2015, 26, 2–29. [Google Scholar] [CrossRef]
- Liao, D.-Y.; Wang, X. Applications of blockchain technology to logistics management in integrated casinos and entertainment. Informatics 2018, 5, 44. [Google Scholar] [CrossRef]
- Saberi, S.; Kouhizadeh, M.; Sarkis, J.; Shen, L. Blockchain technology and its relationships to sustainable supply chain management. Int. J. Prod. Res. 2019, 57, 2117–2135. [Google Scholar] [CrossRef]
- Da Silva, F.A. A avaliação do transportation management system (tms) nas operações logísticas de uma indústria brasileira de bebidas. GEPROS. Gestão Produção Operações Sist. 2018, 13, 1–20. [Google Scholar]
- Arévalo-Avecillas, D.; Nájera-Acuña, S.; Piñero, E.A. La Influencia de la Implementación de las Tecnologías de Información en la Productividad de Empresas de Servicios. Inf. Tecnológica 2018, 29, 199–212. [Google Scholar] [CrossRef]
- Cano, J.A.; Salazar, F.; Gómez-montoya, R.A. ICT Validation Methodologies for Logistics Management. Int. J. Supply Chain Manag. 2020, 9, 1157–1163. [Google Scholar]
- Cano, J.A.; Salazar, F.; Gómez-montoya, R.A.; Cortés, P. Disruptive and Conventional Technologies for the Support of Logistics Processes: A Literature Review. Int. J. Technol. 2021, 12, 448–460. [Google Scholar] [CrossRef]
- Panayiotou, N.A.; Stergiou, K.E. A systematic literature review of lean six sigma adoption in European organizations. Int. J. Lean Six Sigma 2021, 12, 264–292. [Google Scholar] [CrossRef]
- Ko, A.; Vas, R.; Kovacs, T.; Szabo, I. Knowledge creation from the perpective of the supply chain. The role of ICT. Soc. Econ. 2019, 41, 311–329. [Google Scholar] [CrossRef]
- Kimanthi, I. Framework for Government ICT Disruptive Innovation Projects: A Case Study of Digital TV Migration in Kenya. MBA Thesis, Strathmore University, Nairobi City, 2016. [Google Scholar]
- Nicoletti, B.; Nicoletti, B.; Vergata, T. Lean Six Sigma and digitize procurement. Int. J. Lean Six Sigma 2013, 4, 184–203. [Google Scholar] [CrossRef]
- Gutierrez-Gutierrez, L.; de Leeuw, S.; Dubbers, R. Logistics services and Lean Six Sigma implementation: A case study. Int. J. Lean Six Sigma 2016, 7, 324–342. [Google Scholar] [CrossRef]
- Mensah, P.; Merkuryev, Y.; Longo, F. Using ICT in developing a resilient supply chain strategy. Procedia Comput. Sci. 2015, 43, 101–108. [Google Scholar] [CrossRef]
- Martins-Turner, K.; Grahle, A.; Nagel, K.; Göhlich, D. Electrification of Urban Freight Transport—A Case Study of the Food Retailing Industry. Procedia Comput. Sci. 2020, 170, 757–763. [Google Scholar] [CrossRef]
- Russo, F.; Comi, A. A Model For Simulating Urban Goods Transport and Logistics: The integrated Choice of ho.re.ca. Activity Decision-Making and Final Business Consumers. Procedia Soc. Behav. Sci. 2013, 80, 717–728. [Google Scholar] [CrossRef]
- Sun, K.; Ryoo, I. A smart sensor data transmission technique for logistics and intelligent transportation systems. Informatics 2018, 5, 15. [Google Scholar] [CrossRef]
- Wang, J.; Lim, M.K.; Tseng, M.L.; Yang, Y. Promoting low carbon agenda in the urban logistics network distribution system. J. Clean. Prod. 2019, 211, 146–160. [Google Scholar] [CrossRef]
- Hatefi, S.M.; Jolai, F. Robust and reliable forward-reverse logistics network design under demand uncertainty and facility disruptions. Appl. Math. Model. 2014, 38, 2630–2647. [Google Scholar] [CrossRef]
- Cattaruzza, D.; Absi, N.; Feillet, D.; González-Feliu, J. Vehicle routing problems for city logistics. EURO J. Transp. Logist. 2017, 6, 51–79. [Google Scholar] [CrossRef]
- Terry, L. TMS turns it on. Supply Chain Syst. Mag. 2005, 25, 20–26. [Google Scholar]
- Schniederjans, D.G.; Curado, C.; Khalajhedayati, M. Supply chain digitisation trends: An integration of knowledge management. Int. J. Prod. Econ. 2020, 220, 107439. [Google Scholar] [CrossRef]
- Giraldo-García, J.A.; Castrillón-Gómez, O.D.; Ruiz-Herrera, S. Discrete Simulation and Agents of a Simple Chain Supply including a Geographic Information System (GIS). Inf. Tecnol. 2019, 30, 123–136. [Google Scholar] [CrossRef]
- Richey, R.G., Jr.; Tokman, M.; Skinner, L.R. Exploring collaborative technology utilization in retailer–supplier performance. J. Bus. Res. 2008, 61, 842–849. [Google Scholar] [CrossRef]
- Asimakopoulos, G.; Christodoulou, S.; Gizas, A.; Triantafillou, V.; Tzimas, G.; Vasilopoulos, N. Functional specifications and architecture of a dynamic routing system for urban waste collection using real-time information. In Proceedings of the 13th International Conference WWW/Internet 2014, ICWI 2014, Porto, Portugal, 25–27 October 2014; White, B., Isaias, P.R.L., Eds.; IADIS: Lisbon, Portugal, 2014; pp. 203–210. [Google Scholar]
- Mu, Z.H. An object-oriented-based design for urban public transportation management systems. Appl. Mech. Mater. 2014, 556–562, 6750–6753. [Google Scholar] [CrossRef]
- Li, C.B.; Zhang, Y.; Guo, R.X.; Li, X.L. The research of Hohhot in the integration of urban and rural public transport management system. Appl. Mech. Mater. 2014, 568–570, 1889–1892. [Google Scholar] [CrossRef]
- Ashour, I.; Zorkany, M.; Shiple, M. Design and implementation of transportation management system. In Proceedings of the VEHITS 2015-Proceedings of the 1st International Conference on Vehicle Technology and Intelligent Transport Systems, Lisbon, Portugal, 20–22 May 2015; Gusikhin O., H.M., Ed.; SciTePress: Setúbal, Portugal, 2015; pp. 11–18. [Google Scholar]
- Karoń, G.; Janecki, R. Development of various scenarios of ITS systems for urban area. Adv. Intell. Syst. Comput. 2017, 505, 3–12. [Google Scholar] [CrossRef]
- Hassanien, H.E.; Elragal, A. Deep Learning for Enterprise Systems Implementation Lifecycle Challenges: Research Directions. Informatics 2021, 8, 11. [Google Scholar] [CrossRef]
- Dossou, P.-E.; Foreste, L.; Misumi, E. Intelligent Support System for Healthcare Logistics 4.0 Optimization in the Covid Pandemic Context. J. Softw. Eng. Appl. 2021, 14, 233–256. [Google Scholar] [CrossRef]
- Senthilkumar, T.; Karthi, S.; Devadasan, S.R.; Sivaram, N.M.; Sreenivasa, C.G.; Murugesh, R. Implementation of DMAIC methodology in supply chains to reduce customer end-rejections: A case study in an Indian SME. Int. J. Product. Qual. Manag. 2012, 10, 388–409. [Google Scholar] [CrossRef]
- Mishra, P.; Sharma, R.K. A hybrid framework based on SIPOC and Six Sigma DMAIC for improving process dimensions in supply chain network. Int. J. Qual. Reliab. Manag. 2014, 31, 522–546. [Google Scholar] [CrossRef]
- Kumar, S.; Jensen, H.; Menge, H. Analyzing mitigation of container security risks using six sigma DMAIC approach in supply chain design. Transp. J. 2008, 47, 54–66. [Google Scholar]
- Ahmed, A.-K.; Homa, K.; Maruthamuthu, T. A new performance improvement model: Adding benchmarking to the analysis of performance indicator data. Jt. Comm. J. Qual. Patient Saf. 2016, 42, 462–465. [Google Scholar]
- Mishra, P.; Sharma, R.K. Measuring business performance in a SCN using Six Sigma methodology—A case study. Int. J. Ind. Syst. Eng. 2017, 25, 76–109. [Google Scholar] [CrossRef]
- Kumar, S.; Dieveney, E.; Dieveney, A. Reverse logistic process control measures for the pharmaceutical industry supply chain. Int. J. Product. Perform. Manag. 2009, 58, 188–204. [Google Scholar] [CrossRef]
- Basios, A.; Loucopoulos, P. Six Sigma DMAIC Enhanced with Capability Modelling. In Proceedings of the 2017 IEEE 19th Conference on Business Informatics, CBI 2017, Thessaloniki, Greece, 24–27 July 2017; Manolopoulos, Y., Zaki, M., D.D.T.B., Eds.; Institute of Electrical and Electronics Engineers Inc.: Piscataway, NJ, USA, 2017; Volume 2, pp. 55–62. [Google Scholar]
- Hankel, A. Transport optimization project team uses DMAIC to improve efficiency, customer satisfaction. Qual. Prog. 2012, 45, 30–36. [Google Scholar]
- Acero, R.; Torralba, M.; Pérez-Moya, R.; Pozo, J.A. Value stream analysis in military logistics: The improvement in order processing procedure. Appl. Sci. 2020, 10, 106. [Google Scholar] [CrossRef]
- Ponsiglione, A.M.; Ricciardi, C.; Improta, G.; Dell’Aversana Orabona, G.; Sorrentino, A.; Amato, F.; Romano, M. A six sigma DMAIC methodology as a support tool for health technology assessment of two antibiotics. Math. Biosci. Eng. 2021, 18, 3469–3490. [Google Scholar] [CrossRef]


Publisher’s Note: MDPI stays neutral with regard to jurisdictional claims in published maps and institutional affiliations. |
© 2021 by the authors. Licensee MDPI, Basel, Switzerland. This article is an open access article distributed under the terms and conditions of the Creative Commons Attribution (CC BY) license (https://creativecommons.org/licenses/by/4.0/).