Abstract
The motivation for this research was the desire to disclose the social nature of the financial risks of global companies: the authors attempted a scientific explanation of the influence of corporate social responsibility, which is manifested through the preservation and creation of additional jobs, on the financial risks of global companies. The research aims to establish the interdependence between financial risks and sustainable employment in global companies. This goal is achieved using the SEM (structural equation modeling) method based on corporate statistics from the Fortune “Global 500” rankings for 2021–2023. As a result, the consequences of global companies’ CSR (corporate social responsibility) practices in personnel management and financial risk management are modeled and described through quantitative and qualitative patterns. The established regularities proved that for developed and developing countries, the larger the number of employees, the lower the financial risks of global companies—the risk of a decrease in profitability, the risk of loss of profit, and the risk of depreciation of assets. The main conclusion is that there is a close systemic relationship between the financial risks of global companies and their workforce size, suggesting that CSR is key to highly effective financial risk management. A clear distinction between the practices of financial risk management through CSR in developed and developing countries forms the basis of the theoretical significance of the research results. The authors provide recommendations to improve the current practice of financial risk management in global companies by integrating it more closely with personnel management practices, highlighting their managerial relevance. It is proposed that corporate strategies for global companies in developed countries should focus on reducing the risk of declining profitability, as CSR has the most pronounced and consistent impact on this particular financial risk. In developing countries, corporate strategies are recommended to be structured by diversifying the areas of CSR application, with the most promising in financial risk management being the reduction in asset depreciation risk and the reduction in profitability risk. The findings of this research have practical significance because they enhance the predictability of CSR activities of global companies and open up opportunities for highly accurate forecasting of the financial risk implications of ensuring sustainable employment by global companies, considering the specificities of developed and developing countries.
1. Introduction
Financial risks are a crucial reference point for managing global companies. Financial indicators, particularly revenue, profit, and asset value, determine the ability of global companies to adapt to changing market conditions. These financial indicators should be viewed through the lens of risk due to their susceptibility to changes, the unpredictability of these changes, and the significant negative consequences that deteriorating values of these indicators can have on global companies.
Financial risk management makes it possible to forecast changes in the aforementioned financial indicators in the operations of global companies and manage these changes by preventing risk events (e.g., declining profitability, loss of profit, and asset depreciation) and mitigating their negative impacts on the companies. However, it is important to note the limitations of financial risk management for global companies.
Currently, global companies lack the ability to exert significant influence on the global market environment, either due to high competition in these markets or the implementation of large-scale regulatory measures by national and supranational governments. This is particularly evident in the challenges global companies face in securing a presence in certain markets and attracting additional investments for their growth. As a result, financial risk management for global companies is necessarily focused on adjusting internal business processes.
Personnel management is one of the most effective and universal tools available to global companies for financial risk management, which provides a pronounced effect in the short term. However, despite the strong appeal of personnel management for global companies, there is currently no consensus on how exactly personnel should be managed in the interests of financial risk management. Two alternative approaches to personnel management exist.
The first approach can be termed classical because it has evolved historically and has been employed for many decades. This approach involves workforce reduction as an emergency measure in financial risk management. The apparent advantage of this method lies in reducing the labor cost burden on international companies during periods of downturn, temporary production halts, or acute shortages of financial resources.
The second approach can be called innovative because it has solidified only recently, emerging with the onset of the Decade of Action. This approach is increasingly practiced by global companies. It considers the less apparent and potentially long-term consequences of workforce reduction, such as brain drain, the loss of intangible assets, the ability to create intangible assets, and the deterioration of the company’s reputation as an employer, which can hinder future efforts to attract essential talents.
The essence of this innovative approach lies in global companies demonstrating corporate social responsibility (CSR) toward their employees by preserving and creating new jobs. This ensures sustainable employment, provides workers with stable jobs, retains valuable talent and intangible assets, and maintains a positive reputation for companies as employers.
The challenge arises from the uncertainty of the connection between sustainable employment and the financial risks faced by global companies. The lack of in-depth study on these cause-and-effect relationships and the insufficient scientific and methodological development of the second approach hinder the widespread adoption of CSR practices among global companies because they cannot be certain of deriving significant positive effects (e.g., reducing their financial risks) from ensuring sustainable employment.
In the existing literature, CSR and sustainable employment are primarily treated as separate domains of company management and personnel management, distinct from financial management, which is studied independently as another area of company management. This research seeks to contribute to resolving this issue by aiming to establish the interdependence between financial risks and sustainable employment in global companies.
The motivation for this research was the desire to disclose the social nature of the financial risks of global companies. As is known, social factors play an important role in the stock market: the expectation of investors, their risk appetite, following others, or, on the contrary, opposition to the panic behavior of others. Similarly to investments in the stock market, sales volumes and the business reputation of global companies, the shares of which are traded in the stock market, could be subject to the influence of social factors, which are poorly studied and are unknown to modern science.
This paper strives towards filling the gap in the existing literature, which consists of insufficient elaboration on the issues of the connection between financial risks and the corporate social responsibility of global companies. This paper attempts to scientifically explain the influence of the corporate social responsibility of global companies, which is manifested through the preservation and creation of additional jobs, on their financial risks.
This paper’s contribution to the development of the literature consists of an explanation of the social nature of the financial risks of global companies. The authors’ conclusions are important for corporate management policymakers because they disclose social factors, which were previously considered errors (unpredictable and uncontrolled mistakes), during the development and implementation of strategies for the management of the financial risks of global companies. Due to the authors’ recommendations, corporate management policymakers will be able to forecast the consequences of financial risk management more precisely and achieve higher effectiveness in the practice of global companies.
The novelty of this research lies in rethinking CSR and sustainable employment within global companies from the perspective of the relationship between this personnel management practice and the financial risks companies face. The scientific novelty of this research also involves clarifying the specific impacts of sustainable employment on the financial risks of global companies in developed and developing countries.
The innovativeness of this research consists of the novelty of the research objects: based on the latest statistics for 2021–2023, we studied the experience of developed and developing countries in isolation, which allowed us, for the first time, to reveal differences in the models of the management of financial risks with the help of manifestation of corporate social responsibility (through preservation and creation of additional jobs) in developed and developing countries. Therefore, the authors developed unique models for managing the financial risks of global companies through CSR in the context of ensuring sustainable employment with a focus on developed and developing countries.
2. Literature Review
2.1. Sustainable Employment and Its Impact on the Financial Risks of Global Companies
Drawing on the works of (Kalandarovna et al. 2020; Mo et al. 2024; Odilova 2023), the authors define sustainable employment as a personnel management practice where global companies demonstrate CSR. This approach offers several advantages. First, it provides stable employment for employees. Second, it helps retain valuable personnel and intangible assets and enhances the company’s reputation as an employer. In turn, a strong reputation allows companies to attract top talents from the labor market and even recruit exceptional employees from competitors.
The performed overview of corporate social responsibility allowed us to reveal the following main elements of sustainable development: opportunities for the development of human capital of company employees with the help of corporate training in support of lifelong learning; social justice of wages, career opportunities for employees, and inclusivity of personnel—openness for all employees, regardless of their sex, age, and health; favorability of conditions at workplaces to develop human potential of employees, including through support of knowledge-intensive employment; and employment for green and digital personnel.
The most accurate and objective quantitative measure of employment sustainability is the number of employees within a company. The maintenance and growth of jobs within companies serve as indicators of sustainable employment and CSR in personnel management. A literature review revealed that existing sources note and scientifically confirm a wide range of non-financial benefits of sustainable employment and CSR in personnel management, including support for sustainable development goals, particularly SDG 8 (Chahal and Rani 2024; Nasr-Allah et al. 2020), increased employee loyalty to companies as employers (Osovtsev et al. 2018), and productivity growth (D. Milica and J. Milica 2019).
The published research also highlights that CSR in personnel management is gaining increasing popularity worldwide. Global companies from developed countries, which were the first to launch large-scale CSR initiatives in personnel management and have since firmly integrated these initiatives into their corporate strategies, have achieved the greatest success in ensuring sustainable employment (Raies 2023). Global companies from developing countries, which later joined these efforts, are also making significant progress in ensuring sustainable employment. However, they have yet to reach the level of their counterparts from developed countries (Galoyan et al. 2023; Liang and Liu 2024; You et al. 2023).
However, the financial implications of sustainable employment and CSR in personnel management remain unclear, representing a gap in the literature and prompting the following research question (RQ1): What impact does the number of employees have on the financial risks of global companies?
In the available literature (Fernández-Portillo et al. 2023; Jiang and Fan 2022; Zhang et al. 2024), the researchers compare an excessively large workforce to ballast that companies need to shed to alleviate their situation during economic crises and realize their automation potential, thereby strengthening their digital competitiveness and improving operational efficiency.
In contrast, several other sources, including Bogoviz et al. (2018); Kim (2024); Song et al. (2024), provide evidence of companies deriving financial benefits from sustainable employment and CSR in personnel management. On this basis, the authors proposed the following hypothesis (H): the larger the number of employees, the lower the financial risks of global companies. The hypothesis is tested by modeling the impact of the number of employees on the financial risks of global companies.
2.2. Financial Risks Faced by Global Companies and Their Management Through Workforce Adjustments
The theoretical foundation of this research is the concept of corporate financial risk management (Ergasheva et al. 2023; Inshakova et al. 2021). According to this concept, financial risks for global companies, as discussed in this research, is understood as the deterioration of financial performance indicators (Lucchetta 2024; Zarova and Tursunov 2022).
Financial risk management involves deliberate managerial actions by global company representatives to adjust operational parameters in a way that reduces financial risks, which means preventing, mitigating, or halting the decline in financial performance indicators. The primary financial risks for global companies include the following:
- The risk of declining profitability due to reduced revenue generated by their operations (Xin et al. 2024);
- The risk of profit loss, which involves a decrease in the overall profit earned by global companies (Khasanov et al. 2019);
- The risk of asset depreciation, where the market value of a company’s assets decreases (De La Vega Caceres 2024).
Additionally, there are several additional indicators of financial performance, which include profit margin, return on assets (ROAs), and return on equity (ROE). However, statistical data on the above additional indicators of financial performance are not included in the international rankings of companies and are available only in the corporate financial reporting of certain companies. To form a sufficiently large sample for serious statistical analysis and receive data that are correct for a large number of global companies, we focused only on revenue, profit, and assets, which are the indicators of financial effectiveness, the data for which are available in the official international rankings, such as Fortune (2024).
A review of the available scholarly literature revealed that workforce adjustments are frequently cited as one of the main and most promising measures in the financial risk management of global companies (Beena et al. 2022). However, the practical consequences of this measure remain insufficiently clarified in existing publications. Some studies are based on past experiences that show a reduction in financial risks for global companies through workforce downsizing, particularly in the period before the Decade of Action (Clark 2018; Dhasmana 2021; Madhani 2017). However, others emphasize the need to ensure sustainable employment during the Decade of Action but lack sufficient recent evidence to substantiate its advantages for reducing financial risks in global companies (Brewster and Brookes 2024; Mushtaq and Akhtar 2024; Thuan et al. 2024).
Thus, there is uncertainty regarding the current implications of CSR practices in human resource management for the financial risks of global companies, representing a gap in the literature and leading to the following research question (RQ2): What impact do the financial risks of global companies have on their employee numbers? A content analysis of the existing literature suggests that as the number of employees increases, financial risks for global companies may either rise (due to increased costs in human resource management) or fall. Specifically, the risk of declining profitability may decrease with an increase in the workforce of global companies due to greater employee loyalty and their enhanced involvement in improving quality and increasing sales (Hajek and Munk 2024).
The risk of profit loss may diminish with the expansion of the global workforce by preserving the most valuable and augmenting unique and sought-after intangible assets (competencies, technologies, know-how, and progressive corporate culture), which underpin strong and difficult-to-replicate competitive advantages and generate profits (Vásquez et al. 2024). The risk of asset depreciation may be reduced with a growing number of employees due to the strengthening of goodwill based on the companies’ reputation as employers (Mardonov et al. 2021).
Together with this, the above indicators are closely interconnected in the unified system of the financial risks of global companies. Thus, the number of personnel determines the loyalty of employees to the global company. The preservation and creation of additional jobs strengthen the reputation of the global company as the employer, allowing it to keep and attract the best personnel from the labor market. Due to high loyalty to the global company and valuing their jobs, employees of the global company demonstrate higher labor efficiency and manufacture products of higher quality. This provides a responsible company with additional income (including the “scale effect”) because it increases sales volumes and reduces the share of defects.
In their turn, consumers also demonstrate increased loyalty to the global company as a supplier of products to the world market. Other reasons are that the company is a responsible employer and it sells large numbers of products and guarantees a high quality of products. This additionally increases sales volumes and guarantees a stable demand for products of the global company even in case of the growth of prices and in the conditions of economic crises.
Increased innovative activity and a reduced share of defects allow global companies to reduce expenditures. Combined with the above growth of incomes, this ensures an increase in the profitability of their activities. Growth of income alone raises the market capitalization of global companies’ assets. In addition to this, investors manifest increased loyalty to global companies which are responsible employers and sell high-quality products, which further increases the market cost of these global companies.
To provide a more precise answer to RQ2, this research examines the latest corporate data from global companies, using it to model the relationship and interdependence between their financial risks and employee numbers.
3. Materials and Methods
The economic significance of this research lies in identifying the patterns of change in financial performance indicators of global companies influenced by the financial risk management measure of altering their workforce size. To rely on sufficiently detailed, reliable, and comparable corporate statistics across various companies and obtain high-accuracy data from a representative sample of numerous international firms, this research utilizes the Fortune (2024) “Global 500” ranking.
The source of data in this paper is the ranking of the most profitable global companies (transnational corporations) of the world “Global 500”, which is compiled annually by Fortune (2024). The criterion for inclusion of countries in the research sample is the presence of at least one company from these countries in the ranking of Fortune (2024) in at least one period from 2021 to 2023. The methods of data processing are such methods of statistical analysis and regression analysis, which is used to determine economic and mathematical dependencies of variables, and the SEM method, which is used to join the revealed dependencies into a system.
To cover multiple periods, create a larger sample, and examine the most recent contemporary experience, this research is based on data from 2021 to 2023. The advantage of the selected sample of global companies is its immunity to errors and biases related to geography (the sample includes global companies from various countries worldwide) and business cycle fluctuations (the authors exclude data from 2020, a year marked by the pandemic and COVID-19 crisis, focusing instead on a phase of economic and entrepreneurial stability).
The authors processed Fortune (2024) data, systemically organizing the information (see Appendix A). Thus, statistics for developed countries (Table A1) are separated from those for developing countries (Table A2). Two time series data sets for each category of countries have been compiled, merging statistics from 2021 to 2023 into a unified data set. The geographical structure of global companies from developed countries is illustrated in Figure 1, while that from developing countries is shown in Figure 2.
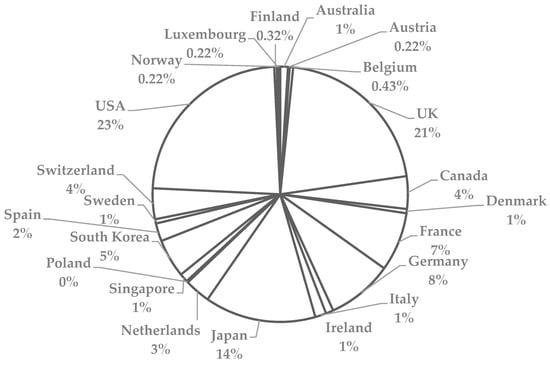
Figure 1.
Geographic structure of global companies from developed countries. Source: calculated and developed by the authors.
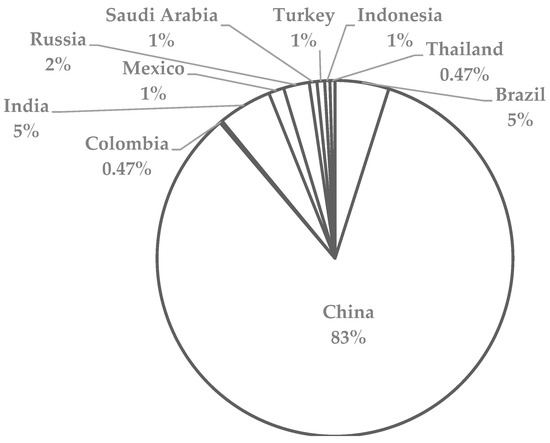
Figure 2.
Geographic structure of global companies from developing countries. Source: calculated and developed by the authors.
As can be seen in Figure 2, the geographic mix of global companies from developed countries is dominated by companies from the USA (23%), UK (21%), and Japan (14%).
As shown in Figure 2, the geographical structure of global companies from developing countries is dominated by companies from China (83%), Brazil (5%), and India (5%).
Descriptive statistics for the studied sample are given in Table 1.

Table 1.
Descriptive statistics for the research sample.
As shown in Table 1, the number of employees of global companies in 2023 in developed countries is 1.12% higher than in developing countries. The number of employees of global companies in developed countries in 2023 grew by 8.56%, compared to 2022, and before that, it had decreased by 0.17%, compared to 2021. The number of employees of global companies in developing countries in 2023 decreased by 13.12%, compared to 2022, and before that, it decreased by 0.02%, compared to 2021. On the whole, the level of corporate social responsibility (from the position of the preservation and creation of additional jobs as measures of employment support) is higher in developed countries than in developing countries.
The revenues of global companies in 2023 in developed countries are by 24.63% higher than in developing countries. Revenues of global companies in developed countries in 2023 grew by 14.35% compared to 2022, and before that, it grew by 14.36%, compared to 2021. The revenues of global companies in developing countries in 2023 decreased by 15.88% compared to 2022, and before that, they grew by 19.76% compared to 2021. On the whole, the risk of a decrease in revenues is higher in developing countries than in developed countries.
The profits of global companies in 2023 in developed countries are 61.60% higher than in developing countries. The profits of global companies in developed countries in 2023 decreased by 7.07% compared to 2022, and before that, they grew by 52.61% compared to 2021. The profits of global companies in developing countries in 2023 decreased by 30.46% compared to 2022, and before that, they grew by 32.55% compared to 2021. On the whole, the risk of profit loss is higher in developing countries than in developed countries.
The assets of global companies in 2023 in developed countries are 84.05% higher than in developing countries. The assets of global companies in developed countries in 2023 grew by 6.59% compared to 2022, and before that, they decreased by 0.65% compared to 2021. The assets of global companies in developing countries in 2023 decreased by 79.10% compared to 2022, and before that, they grew by 7.64% compared to 2021. On the whole, the risk of depreciation of assets is higher in developing countries than in developed countries.
This research aims to overcome the limitations of previous research by examining not just a one-way relationship (the impact of workforce size on financial risks or vice versa) but a bidirectional relationship between financial risks and workforce size in global companies. Therefore, structural equation modeling (SEM) has been chosen as the research method.
The choice of SEM over the commonly used regression analysis in other studies is justified by the ability of SEM to establish bidirectional relationships between variables, which regression analysis cannot achieve. SEM is also preferred over correlation analysis because it allows the authors to determine the strength of relationships and mathematically describe the patterns of their mutual influence.
The measure of workforce size in global companies is the “number of employees” (EPL, persons). The financial risk indicators for global companies are “revenues ($millions)” (Rrvn—a decrease indicates reduced profitability), “profits ($millions)” (Rpft—a reduction reflects a loss of profit), and “assets ($millions)” (Rast—a decline indicates asset depreciation).
The SEM methodology in this research involves the following:
- Establishing the relationships between variables using correlation analysis;
- Determining the dependencies of Rrvn, Rpft, and Rast on EPL separately and the systemic dependency of EPL on Rrvn, Rpft, and Rast;
- Generalizing the established interdependencies and integrating them into a unified SEM model.
The SEM model is compiled given the fact that corporate social responsibility is the indicator of the mitigation of financial risk and support of sustainable development. The SEM model strives towards demonstrating the mutual influence of the financial risks of global companies and sustainability of the employment of their employees (number of jobs), demonstrating, on the one hand, the regularity of the change in revenues, profits, and assets of global companies in the course of the creation of additional jobs and, on the other hand, the change in the number of jobs in global companies in the course of the change in their financial risks: the risk of decrease in revenues, risk of profit loss, and the risk of depreciation of assets.
The reliability and quality of the established relationships are evaluated using Fisher’s F-test and Student’s t-test. Hypothesis H (originates with an observation due to Hisham Sati) is considered validated if the regression coefficients (b) are positive in all regression equations of Rrvn, Rpft, and Rast relative to EPL.
4. Results
4.1. Model of Developed Countries
Rrvn, Rpft, and Rast are a set of variables for which there is a probability of the presence of the problem of multicollinearity with each other and with the variable EPL. To check the presence of multicollinearity, we calculated a simple (paired) correlation according to Pearson (Table 2).
Table 2.
Variables’ multicollinearity test for developed countries.
The results of the test (Table 2) showed that neither of the coefficients of paired correlation were sufficiently high (0.9) for the variables to overlap significantly. Therefore, repeated variables (multicollinearity of variables) are absent. A correlation and regression analysis of the data from Table A1 was carried out to establish the regularities of changes in the values of financial indicators of the activities of global companies in correlation with changes in the number of employees of these companies in developed countries in 2021–2023. Its results are shown in Table 3, Table 4, Table 5 and Table 6.
Table 3.
Dependence of Rrvn on EPL in developed countries in 2021–2023.
Table 4.
Dependence of Rpft on EPL in developed countries in 2021–2023.
Table 5.
Dependence of Rast on EPL in developed countries in 2021–2023.
Table 6.
Dependence of EPL on Rrvn, Rpft, and Rast in developed countries in 2021–2023.
The results from Table 3 indicate that the risk of profitability decline of global companies in developed countries in 2021–2023 is determined by 57.97% by the change in the number of employees of these companies. The high quality and reliability of the established relationship are evidenced by Fisher’s F-test (observed F = 528.3176) and Student’s t-test (t-statistic = 22.9852) passed at the significance level of 0.01.
It should be noted that employment here is not the adjusting coefficient as its growth leads to revenue, which means a reduction in the financial risk. In this case, employment is not skilled work; it is rather skilled human capital. On the other hand, a reduction in employment by one unit leads to a decline in revenue of 0.21 million. Here, employment is the adjusting coefficient as its reduction leads to a decrease in revenue and an increase in financial risk, which again signifies the role of human capital. However, in the context of this research, it is focused on EPL as a dependent variable and Rrvn, Rpft, and Rast as independent variables in isolation.
The results from Table 4 indicate that the risk of profit loss for global companies in developed countries during 2021–2023 is explained by 15.94% due to changes in their workforce size. The high quality and reliability of this established relationship are confirmed by Fisher’s F-test (observed F = 27.2209) and Student’s t-test (t-statistic = 5.2174), both significant at the 0.01 level.
The results from Table 5 indicate that the risk of asset depreciation for global companies in developed countries during 2021–2023 is explained by 6.68% due to changes in their workforce size. The high quality and reliability of this relationship are confirmed by Fisher’s F-test (observed F = 4.6841) and Student’s t-test (t-statistic = 2.1643), both significant at the 0.05 level.
The results from Table 6 show that changes in the workforce size of global companies in developed countries during 2021–2023 are explained by 59.03% due to financial risks. The high quality and reliability of this relationship are confirmed by Fisher’s F-test (observed F = 185.7232) and Student’s t-test (t-statistics: Rrvn = 22.7108, Rpft = −4.4343, and Rast = 0.7550).
As a result of generalizing the interdependencies established in Table 3, Table 4, Table 5 and Table 6, the indicators have been integrated into a unified SEM model (Figure 3).

Figure 3.
SEM model for developed countries. Source: calculated and developed by the authors.
Based on the SEM model shown in Figure 3, the following patterns have been identified in developed countries regarding changes in the financial performance indicators of global companies in relation to changes in their workforce size:
- A decrease in the risk of declining profitability by USD 0.2138 million for each additional employee;
- A reduction in the risk of profit loss by USD 0.0092 million for each additional employee;
- A decrease in the risk of asset depreciation by USD 0.2460 million for each additional employee;
- An increase in the workforce by 1.7187 employees for each additional USD 1 million in revenue;
- A reduction in the workforce by 2.2290 employees for each additional USD 1 million in profit;
- An increase in the workforce by 0.0054 employees for each additional USD 1 million in asset value.
The established regularities proved hypothesis H, demonstrating its correctness for developed countries. The regression coefficients (b) adopted positive values in all equations of regression dependence on EPL: in the equation for Rrvn (b = 0.2138), for Rpft (b = 0.0092), and Rast (b = 0.2460). Therefore, in developed countries, the higher the number of employees, the lower the financial risks of global companies—the risk of a decrease in revenues, the risk of profit loss, and the risk of depreciation of assets. This points to the expedience of ensuring sustainable development through the creation of additional jobs to fight the financial risks of global companies in developed countries.
4.2. Model for Developing Countries
Similar to developed countries, to reveal the presence/absence of multicollinearity in the statistics for developing countries, we calculated simple (paired) correlation according to Pearson (Table 7).
Table 7.
Variables’ multicollinearity test for developed countries.
The results of the test (Table 7) showed that neither of the coefficients of paired correlation were sufficiently high (0.9) for the variables to overlap significantly. Therefore, repeated variables (multicollinearity of variables) are absent. To identify patterns in the changes in the financial performance indicators of global companies in relation to workforce size in developing countries during 2021–2023, the authors conducted a correlation and regression analysis of the data from Table A2. The results are presented in Table 8, Table 9, Table 10 and Table 11.
Table 8.
Dependence of Rrvn on EPL in developing countries in 2021–2023.
Table 9.
Dependence of Rpft on EPL in developing countries in 2021–2023.
Table 10.
Dependence of Rast on EPL in developing countries in 2021–2023.
Table 11.
Dependence of EPL on Rrvn, Rpft, and Rast in developing countries in 2021–2023.
The results from Table 8 indicate that the risk of declining profitability for global companies in developing countries during 2021–2023 is explained by 63.83% due to changes in workforce size. The high quality and reliability of this relationship are confirmed by Fisher’s F-test (observed F = 594.9507) and Student’s t-test (t-statistic = 17.1741), both significant at the 0.01 level.
According to Table 9, changes in workforce size account for 16.45% of the risk of profit loss for global companies in developing countries during 2021–2023. The high quality and reliability of this relationship are supported by Fisher’s F-test (observed F = 11.93473) and Student’s t-test (t-statistic = 3.4546), both significant at the 0.01 level.
According to Table 10, the risk of asset depreciation for global companies in developing countries from 2021 to 2023 is explained by 31.86% due to changes in workforce size. The high quality and reliability of this relationship are confirmed by Fisher’s F-test (observed F = 48.4489) and Student’s t-test (t-statistic = 6.9605), both significant at the 0.01 level.
The results from Table 11 indicate that changes in workforce size for global companies in developing countries during 2021–2023 are determined by 72.09% due to the financial risks faced by these companies. The high quality and reliability of this relationship are confirmed by Fisher’s F-test (observed F = 154.0169) and Student’s t-test (t-statistics: Rrvn = 19.2829, Rpft = −9.3209, and Rast = 7.1873).
As a result of summarizing the interdependencies established in Table 8, Table 9, Table 10 and Table 11, these indicators have been integrated into a unified SEM model (Figure 4).
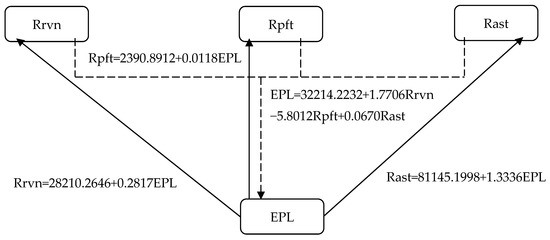
Figure 4.
SEM model for developing countries. Source: calculated and developed by the authors.
Based on the SEM model shown in Figure 4, the following patterns have been identified in developing countries regarding changes in the financial performance indicators of global companies in relation to changes in workforce size:
- A decrease in the risk of declining profitability by USD 0.2817 million for each additional employee;
- A reduction in the risk of profit loss by USD 0.0118 million for each additional employee;
- A decrease in the risk of asset depreciation by USD 1.3336 million for each additional employee;
- An increase in workforce size by 1.7706 employees for each additional USD 1 million in revenue;
- A reduction in workforce size by 5.8012 employees for each additional USD 1 million in profit;
- An increase in workforce size by 0.0670 employees for each additional USD 1 million in asset value.
The established regularities confirmed hypothesis H, proving its correctness for developing countries. The regression coefficients (b) took positive values in all equations for regression dependence on EPL: in the equation for Rrvn (b = 0.2817), for Rpft (b = 0.0118), and Rast (b = 1.3336). Therefore, in developing countries, the higher the number of employees, the lower the financial risks of global companies—the risk of a decrease in revenues, the risk of profit loss, and the risk of depreciation of assets. This points to the expedience of ensuring sustainable development through the creation of additional jobs to fight the financial risks of global companies in developing countries.
5. Discussion and Conclusions
The research continues the academic discussion initiated by (Ergasheva et al. 2023; Inshakova et al. 2021; Lucchetta 2024; Zarova and Tursunov 2022), contributing to the literature by advancing the concept of corporate financial risk management through a refined understanding of the interdependence between financial risks and the workforce size of global companies. In doing so, the research addresses a gap in scholarly knowledge concerning the intersection of financial risk management and human resource management in global corporations. The findings are summarized and compared with the existing literature in Table 12.
Table 12.
Summary of results and comparison with the literature.
Thus, according to the summarized results in Table 12, the research provides answers to both research questions and confirms the proposed hypothesis. The main conclusion is that there is a strong systemic interconnection between the financial risks of global companies and their workforce size, suggesting that CSR is key to highly effective financial risk management.
The scientific reasoning behind this conclusion is based on the fact that maintaining staff levels and creating additional jobs enhance the human resources, innovation, production, and marketing potential of global companies. This increases loyalty toward global companies, boosts the market value of their assets, strengthens competitive advantages, and expands their presence in global markets, ultimately leading to higher revenue and profit.
In contrast to Galoyan et al. (2023); Liang and Liu (2024); Raies (2023); and You et al. (2023), it is shown that the impact of CSR in human resource management and ensuring sustainable employment on reducing financial risks is more pronounced in developing countries than in developed ones. While developed countries were the first to launch large-scale CSR initiatives in HR management, global companies in developing countries derive greater financial benefits from similar initiatives, making them equally, if not more, interested in ensuring sustainable employment for their workers.
The new answer to RQ1 is that, unlike the findings of (Fernández-Portillo et al. 2023; Jiang and Fan 2022; Zhang et al. 2024), the impact of CSR in HR management and ensuring sustainable employment is not negative but positive for financial risk management: the larger the workforce, the lower the financial risks for global companies. Thus, hypothesis H is confirmed, supporting the conclusions of Bogoviz et al. (2018); Kim (2024); and Song et al. (2024). Specifically, the following patterns in the financial performance of global companies relative to workforce changes have been identified and substantiated:
- A pattern of reduced risk of declining profitability as workforce size increases by USD 0.2138 million per employee in developed countries and by USD 0.2817 million per employee in developing countries (with correlations of 57.97% in developed countries and 63.83% in developing countries);
- A pattern of reduced risk of profit loss as workforce size increases, by USD 0.0092 million per employee in developed countries and by USD 0.0118 million per employee in developing countries (with correlations of 16.94% in developed countries and 16.45% in developing countries);
- A pattern of reduced risk of asset depreciation as workforce size increases, by USD 0.2460 million per employee in developed countries and by USD 1.3336 million per employee in developing countries (with correlations of 6.68% in developed countries and 31.86% in developing countries).
The new answer to RQ2 is that contrary to the findings of Hajek and Munk (2024); Salinas Vásquez et al. (2024); and Mardonov et al. (2021), global companies do not abandon but rather increasingly and actively utilize CSR in human resource management and ensure sustainable employment when managing most of their financial risks. Workforce size increases as the risk of declining profitability and asset depreciation decreases but also rises as the risk of profit loss grows. Specifically, the following patterns have been identified and substantiated regarding changes in the workforce size of global companies relative to changes in financial performance indicators (with correlations of 59.03% in developed countries and 72.09% in developing countries):
- A pattern of increasing workforce size by 1.7187 employees per million dollars of revenues in developed countries and by 1.7706 employees in developing countries;
- A pattern of decreasing workforce size by 2.2290 employees per million dollars of profits in developed countries and by 5.8012 employees in developing countries;
- A pattern of increasing workforce size by 0.0054 employees per million dollars of asset value in developed countries and by 0.0670 employees in developing countries.
The above regularities show that during the management of the risk of a decrease in revenues and the risk of depreciation of assets with the help of the existing strategies of financial risk management, global companies in developed and developing countries increase the number of personnel, which supports sustainable employment. However, during the management of the risk of profit loss with the help of the existing strategies of financial risk management, global companies in developed and developing countries reduce the number of personnel (cut staff), which hinders sustainable development.
The proposed recommendations from the authors will allow us to deal with this lack of strategy for the financial risk management of global companies through integrating corporate social responsibility into them. Due to this, implementation of the improved strategies of financial risk management will allow for the preservation and creation of new jobs in the process of managing financial risks: the risk of a decrease in revenues, the risk of depreciation of assets, and the risk of profit loss for systemic support of sustainable development.
The theoretical significance of this research lies in its clear distinction between financial risk management practices through CSR in developed and developing countries, supported by numerous examples of specific companies from these categories and their recent experiences. Based on official international statistics for 2021–2023, the research identifies and mathematically describes the quantitative and qualitative patterns of changes in financial risks and workforce size in their interdependence, with separate models for developed and developing countries.
This distinction allows the authors to scientifically prove that global companies in developing countries should not only adhere to CSR in their personnel management to support the UN’s global initiative on the SDGs during the Decade of Action but also to derive specific financial benefits. Furthermore, they should not merely replicate the models of developed countries but instead develop and implement their own unique CSR models in human resource management, considering the specific findings of this research—namely, the patterns of sustainable employment returns for financial risk management.
The managerial significance of the identified patterns, consolidated into models, lies in their ability to enhance contemporary financial risk management practices of global companies through closer integration with human resource management practices. The results presented in this research provide a robust scientific and methodological foundation for developing corporate strategies for the practical implementation of an innovative approach to global human resource management through CSR, ensuring sustainable employment as a source of financial risk management—tailored to the needs of both developed and developing countries.
It is suggested that corporate strategies for global companies in developed countries focus on reducing the risk of declining profitability, as CSR’s impact on this financial risk is the most evident and consistent. For global companies in developing countries, it is recommended to build strategies by diversifying CSR applications, with the most promising areas for financial risk management being the reduction in asset depreciation and declining profitability risks.
Possibilities for the practical application of the results obtained, in particular, the authors’ recommendations for the development and implementation of strategies for the management of the financial risks of global companies, are connected with the integration of promising measures of manifestation of corporate social responsibility through the preservation and creation of additional jobs into these strategies. This will provide additional advantages for global companies, which are connected with the commercialization of corporate social responsibility.
Here, national context should be taken into account. Despite the fact that a vivid effect for corporate social responsibility is established in developed and developing countries, which is connected with the reduction in financial risks of global companies, this effect is expressed differently for different financial risks and different categories of countries. The difference between developed and developing countries is seen at the level of institutes. Therefore, when developing and implementing the strategies for the management of the financial risks of global companies with the help of their corporate social responsibility, it is necessary to take into account the national institutional context and adapt these strategies to it.
The generalized consideration of global companies at the level of the categories of developed and developing countries allowed us to reveal common features that are peculiar to these categories on the one hand but, on the other hand, did not allow for a detailed study of the institutional features of the business environment of each country, which is a limitation of the results obtained. In future studies, to deal with this limitation, it is advisable to conduct in-depth research of the institutional business environment by the example of concrete countries and specify the framework recommendations, offered in this paper, for their adaptation to the business environment of each country.
The practical significance of the identified patterns and models lies in their ability to enhance the predictability of CSR implementation by global companies and provide high-precision forecasts of the impact of sustainable employment on financial risks, considering the specific contexts of developed and developing countries.
Author Contributions
Conceptualization, B.O.T.; methodology, B.O.T.; formal analysis, C.R.K.; investigation, C.R.K.; resources, O.K.A.; data curation, O.K.A.; writing—original draft preparation, B.O.T. and L.V.S.; writing—review and editing, B.O.T. and L.V.S.; supervision, T.I.B.; project administration, T.I.B. All authors have read and agreed to the published version of the manuscript.
Funding
This research received no external funding.
Data Availability Statement
Data is contained within the article.
Conflicts of Interest
The authors declare no conflict of interest.
Appendix A
Table A1.
Statistics for developed countries.
Table A1.
Statistics for developed countries.
| Year | Company Name | Country | Number of Employees | Revenues ($Millions) | Profits ($Millions) | Assets ($Millions) |
|---|---|---|---|---|---|---|
| 2023 | BHP Group | Australia | 39,210 | 71,502 | 30,900 | 95,166 |
| 2023 | Woolworths Group | Australia | 197,773 | 44,126 | 5754 | 22,975 |
| 2023 | OMV Group | Austria | 22,308 | 65,523 | 3897 | 60,210 |
| 2023 | Anheuser-Busch InBev | Belgium | 166,632 | 57,786 | 5969 | 212,943 |
| 2023 | Shell | UK | 93,000 | 386,201 | 42,309 | 443,024 |
| 2023 | BP | UK | 67,600 | 248,891 | −2487 | 288,120 |
| 2023 | Chevron | UK | 43,846 | 246,252 | 35,465 | 257,709 |
| 2023 | AmerisourceBergen | UK | 41,500 | 238,587 | 1699 | 56,561 |
| 2023 | Samsung Electronics | UK | 270,372 | 234,129 | 42,398 | 356,470 |
| 2023 | Costco Wholesale | UK | 304,000 | 226,954 | 5844 | 64,166 |
| 2023 | Hon Hai Precision Industry | UK | 767,062 | 222,535 | 4751 | 134,618 |
| 2023 | Industrial & Commercial Bank of China | UK | 427,587 | 214,766 | 53,589 | 5,742,860 |
| 2023 | China Construction Bank | UK | 376,682 | 202,753 | 48,145 | 5,016,806 |
| 2023 | Microsoft | UK | 221,000 | 198,270 | 72,738 | 364,840 |
| 2023 | Stellantis | UK | 272,367 | 188,888 | 17,669 | 198,629 |
| 2023 | Agricultural Bank of China | UK | 452,258 | 187,061 | 38,524 | 4,919,030 |
| 2023 | Ping An Insurance | UK | 344,223 | 181,566 | 12,454 | 1,614,738 |
| 2023 | Cardinal Health | UK | 46,035 | 181,364 | −933 | 43,878 |
| 2023 | Cigna | UK | 70,231 | 180,516 | 6668 | 143,932 |
| 2023 | Marathon Petroleum | UK | 17,800 | 180,012 | 14,516 | 89,904 |
| 2023 | Phillips 66 | UK | 13,000 | 175,702 | 11,024 | 76,442 |
| 2023 | Sinochem Holdings | UK | 223,448 | 173,834 | −1 | 229,659 |
| 2023 | China Railway Engineering Group | UK | 314,792 | 171,669 | 2035 | 234,956 |
| 2023 | Valero Energy | UK | 9743 | 171,189 | 11,528 | 60,982 |
| 2023 | Gazprom | UK | 468,000 | 167,832 | 17,641 | 352,199 |
| 2023 | China National Offshore Oil | UK | 81,775 | 164,762 | 16,988 | 219,416 |
| 2023 | China Railway Construction | UK | 342,098 | 163,037 | 1800 | 221,617 |
| 2023 | China Baowu Steel Group | UK | 245,675 | 161,698 | 2493 | 179,760 |
| 2023 | Mitsubishi | UK | 79,706 | 159,371 | 8723 | 166,889 |
| 2023 | Ford Motor | UK | 173,000 | 158,057 | −1981 | 255,884 |
| 2023 | Mercedes-Benz Group | UK | 168,797 | 157,782 | 15,252 | 277,436 |
| 2023 | Home Depot | UK | 471,600 | 157,403 | 17,105 | 76,445 |
| 2023 | Bank of China | UK | 306,182 | 156,924 | 33,811 | 4,192,115 |
| 2023 | General Motors | UK | 167,000 | 156,735 | 9934 | 264,037 |
| 2023 | Elevance Health | UK | 102,300 | 156,595 | 6025 | 102,772 |
| 2023 | JD.com | UK | 450,679 | 155,533 | 1543 | 86,303 |
| 2023 | JPMorgan Chase | UK | 293,723 | 154,792 | 37,676 | 3,665,743 |
| 2023 | China Life Insurance | UK | 180,619 | 151,487 | 6859 | 888,306 |
| 2023 | Electricité de France | UK | 165,028 | 150,902 | −18,869 | 414,137 |
| 2023 | Equinor | UK | 21,936 | 150,806 | 28,746 | 158,021 |
| 2023 | BMW Group | UK | 149,475 | 149,991 | 18,870 | 263,470 |
| 2023 | Kroger | UK | 430,000 | 148,258 | 2244 | 49,623 |
| 2023 | Enel | UK | 65,124 | 147,790 | 1769 | 234,332 |
| 2023 | Centene | UK | 74,300 | 144,547 | 1202 | 76,870 |
| 2023 | ENI | UK | 32,188 | 140,607 | 14,606 | 162,323 |
| 2023 | China Mobile Communications | UK | 452,202 | 139,597 | 14,718 | 331,724 |
| 2023 | China Communications Construction | UK | 221,017 | 138,270 | 1255 | 344,369 |
| 2023 | Verizon Communications | UK | 117,100 | 136,835 | 21,256 | 379,680 |
| 2023 | China Minmetals | UK | 183,298 | 133,541 | 877 | 153,155 |
| 2023 | Walgreens Boots Alliance | UK | 262,500 | 132,703 | 4337 | 90,124 |
| 2023 | Allianz | UK | 159,253 | 129,059 | 7087 | 1,089,944 |
| 2023 | Alibaba Group Holding | UK | 235,216 | 126,813 | 10,625 | 255,263 |
| 2023 | Xiamen C&D | UK | 40,959 | 125,971 | 454 | 104,907 |
| 2023 | Honda Motor | UK | 197,039 | 124,912 | 4813 | 185,853 |
| 2023 | Petrobras | UK | 45,149 | 124,474 | 36,623 | 187,191 |
| 2023 | Shandong Energy Group | UK | 232,841 | 124,089 | 33 | 137,900 |
| 2023 | E.ON | UK | 69,378 | 121,646 | 1926 | 142,988 |
| 2023 | China Resources | UK | 379,944 | 121,643 | 4662 | 331,830 |
| 2023 | Fannie Mae | UK | 8000 | 121,596 | 12,923 | 4,305,288 |
| 2023 | China Energy Investment | UK | 310,753 | 121,584 | 5699 | 281,587 |
| 2023 | Comcast | UK | 186,000 | 121,427 | 5370 | 257,275 |
| 2023 | AT&T | UK | 160,700 | 120,741 | −8524 | 402,853 |
| 2023 | Deutsche Telekom | UK | 206,759 | 120,108 | 8415 | 318,596 |
| 2023 | Pemex | UK | 120,054 | 118,537 | 4994 | 115,262 |
| 2023 | Meta Platforms | UK | 86,482 | 116,609 | 23,200 | 185,727 |
| 2023 | Bank of America | UK | 216,823 | 115,053 | 27,528 | 3,051,375 |
| 2023 | China Southern Power Grid | UK | 271,202 | 113,674 | 1516 | 166,026 |
| 2023 | SAIC Motor | UK | 154,863 | 110,612 | 2396 | 143,552 |
| 2023 | Hyundai Motor | UK | 72,689 | 110,412 | 5705 | 203,299 |
| 2023 | China Post Group | UK | 752,547 | 110,271 | 4897 | 2,131,968 |
| 2023 | COFCO | UK | 103,537 | 110,222 | 1766 | 100,848 |
| 2023 | Reliance Industries | UK | 376,000 | 109,523 | 8307 | 208,710 |
| 2023 | Engie | UK | 96,454 | 109,175 | 227 | 251,268 |
| 2023 | Target | UK | 440,000 | 109,120 | 2780 | 53,335 |
| 2023 | AXA | UK | 90,443 | 109,067 | 7021 | 743,376 |
| 2023 | SK | UK | 124,499 | 105,959 | 851 | 154,620 |
| 2023 | Mitsui | UK | 46,811 | 105,694 | 8353 | 115,873 |
| 2023 | Indian Oil | UK | 32,791 | 105,349 | 1219 | 53,808 |
| 2023 | Xiamen ITG Holding Group | UK | 32,856 | 103,090 | 290 | 46,715 |
| 2023 | Itochu | UK | 133,051 | 103,029 | 5914 | 98,777 |
| 2023 | Dell Technologies | UK | 133,000 | 102,301 | 2442 | 89,611 |
| 2023 | Archer Daniels Midland | UK | 41,181 | 101,556 | 4340 | 59,774 |
| 2023 | Citigroup | UK | 238,104 | 101,078 | 14,845 | 2,416,676 |
| 2023 | CITIC Group | UK | 172,761 | 100,769 | 3904 | 1,536,521 |
| 2023 | United Parcel Service | UK | 404,700 | 100,338 | 11,548 | 71,124 |
| 2023 | Pfizer | UK | 83,000 | 100,330 | 31,372 | 197,205 |
| 2023 | Deutsche Post DHL Group | UK | 554,975 | 99,324 | 5636 | 72,853 |
| 2023 | Banco Santander | UK | 204,300 | 99,231 | 10,102 | 1,850,881 |
| 2023 | PowerChina | UK | 182,424 | 99,020 | 621 | 187,768 |
| 2023 | Nestlé | UK | 275,000 | 98,931 | 9712 | 146,174 |
| 2023 | Life Insurance Corp. of India | UK | 104,036 | 98,535 | 4483 | 557,673 |
| 2023 | Lowe’s | UK | 244,500 | 97,059 | 6437 | 43,708 |
| 2023 | Nippon Telegraph and Telephone | UK | 338,651 | 97,049 | 8962 | 190,665 |
| 2023 | PTT | UK | 30,628 | 96,162 | 2604 | 98,832 |
| 2023 | Huawei Investment & Holding | UK | 207,000 | 95,490 | 5283 | 154,237 |
| 2023 | Johnson & Johnson | UK | 152,700 | 94,943 | 17,941 | 187,378 |
| 2023 | Sinopharm | UK | 201,508 | 94,075 | 1101 | 81,654 |
| 2023 | FedEx | UK | 518,249 | 93,512 | 3826 | 85,994 |
| 2023 | COSCO Shipping | UK | 107,793 | 93,181 | 6233 | 161,552 |
| 2023 | Humana | UK | 67,100 | 92,870 | 2806 | 43,055 |
| 2023 | Bosch Group | UK | 421,338 | 92,766 | 1367 | 106,964 |
| 2023 | BASF | UK | 111,481 | 91,847 | −660 | 90,132 |
| 2023 | People’s Insurance Co. of China | UK | 177,852 | 91,535 | 3639 | 218,805 |
| 2023 | Royal Ahold Delhaize | UK | 249,000 | 91,486 | 2678 | 51,808 |
| 2023 | ENEOS Holdings | UK | 44,617 | 91,437 | 1062 | 74,993 |
| 2023 | Hengli Group | UK | 170,125 | 90,944 | 356 | 48,633 |
| 2023 | Amer International Group | UK | 23,175 | 90,498 | 1497 | 31,835 |
| 2023 | Carrefour | UK | 334,640 | 90,062 | 1418 | 60,340 |
| 2023 | Energy Transfer | UK | 12,565 | 89,876 | 4756 | 105,643 |
| 2023 | BNP Paribas | UK | 193,122 | 89,564 | 10,724 | 2,845,023 |
| 2023 | State Farm Insurance | UK | 60,519 | 89,328 | −6654 | 318,243 |
| 2023 | Seven & I Holdings | UK | 125,701 | 88,078 | 2095 | 77,461 |
| 2023 | HSBC Holdings | UK | 219,199 | 87,807 | 16,035 | 2,966,530 |
| 2023 | China FAW Group | UK | 119,487 | 87,679 | 3846 | 86,465 |
| 2023 | China Telecommunications | UK | 392,726 | 87,166 | 2061 | 151,749 |
| 2023 | Freddie Mac | UK | 7819 | 86,717 | 9327 | 3,208,333 |
| 2023 | PepsiCo | UK | 315,000 | 86,392 | 8910 | 92,187 |
| 2023 | Zhejiang Rongsheng Holding Group | UK | 23,316 | 86,166 | 170 | 56,816 |
| 2023 | Assicurazioni Generali | UK | 82,061 | 85,750 | 3063 | 553,827 |
| 2023 | Wuchan Zhongda Group | UK | 24,247 | 85,710 | 581 | 21,030 |
| 2023 | Petronas | UK | 49,771 | 85,365 | 20,999 | 161,493 |
| 2023 | Sony | UK | 112,994 | 85,255 | 6923 | 241,383 |
| 2023 | Pertamina | UK | 33,596 | 84,888 | 3807 | 87,811 |
| 2023 | XMXYG | UK | 15,364 | 83,639 | 300 | 42,458 |
| 2023 | Christian Dior | UK | 180,597 | 83,283 | 6097 | 140,792 |
| 2023 | Wells Fargo | UK | 238,000 | 82,859 | 13,182 | 1,881,016 |
| 2023 | Walt Disney | UK | 195,800 | 82,722 | 3145 | 203,631 |
| 2023 | China North Industries Group | UK | 216,339 | 82,689 | 1788 | 75,355 |
| 2023 | Tencent Holdings | UK | 108,436 | 82,440 | 27,984 | 228,808 |
| 2023 | Japan Post Holdings | UK | 227,369 | 82,291 | 3185 | 2,230,764 |
| 2023 | ConocoPhillips | UK | 9500 | 82,156 | 18,680 | 93,829 |
| 2023 | Aviation Industry Corp. of China | UK | 383,000 | 81,671 | 1528 | 185,527 |
| 2023 | Maersk Group | UK | 104,260 | 81,529 | 29,198 | 93,680 |
| 2023 | Tesla | UK | 127,855 | 81,462 | 12,556 | 82,338 |
| 2023 | Hitachi | UK | 322,525 | 80,389 | 4796 | 94,180 |
| 2023 | Procter & Gamble | UK | 106,000 | 80,187 | 14,742 | 117,208 |
| 2023 | ArcelorMittal | UK | 154,352 | 79,844 | 9302 | 94,547 |
| 2023 | Tesco | UK | 222,306 | 79,687 | 903 | 55,843 |
| 2023 | Unilever | UK | 127,056 | 63,182 | 8038 | 83,035 |
| 2023 | Rio Tinto Group | UK | 53,726 | 55,554 | 12,420 | 96,744 |
| 2023 | Vodafone Group | UK | 98,103 | 47,550 | 12,316 | 169,051 |
| 2023 | Barclays | UK | 87,400 | 45,023 | 7309 | 1,820,526 |
| 2023 | AstraZeneca | UK | 83,500 | 44,351 | 3288 | 96,483 |
| 2023 | GSK | UK | 69,400 | 43,035 | 18,439 | 72,338 |
| 2023 | J. Sainsbury | UK | 107,000 | 37,910 | 249 | 32,347 |
| 2023 | Anglo American | UK | 105,000 | 35,118 | 4514 | 67,407 |
| 2023 | Taikang Insurance Group | UK | 59,011 | 34,837 | 1615 | 197,971 |
| 2023 | CRRC Group | UK | 170,184 | 34,697 | 902 | 74,224 |
| 2023 | Coop Group | UK | 82,054 | 34,684 | 589 | 23,736 |
| 2023 | TongLing Nonferrous Metals Group | UK | 21,797 | 34,590 | 5 | 14,646 |
| 2023 | SK Hynix | UK | 31,944 | 34,567 | 1727 | 82,571 |
| 2023 | Shanghai Pharmaceuticals Holding | UK | 47,877 | 34,486 | 835 | 28,727 |
| 2023 | Shandong Hi-Speed Group | UK | 54,097 | 34,455 | 445 | 191,751 |
| 2023 | Suzuki Motor | UK | 70,012 | 34,292 | 1634 | 34,486 |
| 2023 | 3M | UK | 92,000 | 34,229 | 5777 | 46,455 |
| 2023 | Inditex | UK | 116,323 | 34,119 | 4327 | 32,556 |
| 2023 | British American Tobacco | UK | 52,077 | 34,096 | 8219 | 184,670 |
| 2023 | Linde | UK | 65,010 | 33,364 | 4147 | 79,658 |
| 2023 | Compass Group | UK | 513,707 | 32,564 | 1421 | 20,870 |
| 2023 | Brookfield | Canada | 202,500 | 92,769 | 2056 | 441,284 |
| 2023 | Alimentation Couche-Tard | Canada | 122,000 | 62,810 | 2683 | 29,592 |
| 2023 | Royal Bank of Canada | Canada | 91,427 | 52,062 | 12,265 | 1,405,792 |
| 2023 | Cenovus Energy | Canada | 5998 | 51,406 | 4956 | 41,241 |
| 2023 | Toronto-Dominion Bank | Canada | 94,945 | 48,700 | 13,535 | 1,406,019 |
| 2023 | Suncor Energy | Canada | 16,558 | 44,928 | 6975 | 62,463 |
| 2023 | George Weston | Canada | 221,285 | 43,838 | 1396 | 36,139 |
| 2023 | Enbridge | Canada | 12,050 | 40,964 | 2308 | 132,581 |
| 2023 | Nutrien | Canada | 24,700 | 37,884 | 7660 | 54,586 |
| 2023 | Magna International | Canada | 158,000 | 37,840 | 592 | 27,789 |
| 2023 | Power Corp. of Canada | Canada | 37,300 | 37,419 | 1510 | 541,559 |
| 2023 | Bank of Nova Scotia | Canada | 90,979 | 36,390 | 7701 | 989,455 |
| 2023 | Bank of Montreal | Canada | 46,722 | 34,730 | 10,513 | 835,312 |
| 2023 | Canadian Natural Resources | Canada | 10,035 | 32,503 | 8404 | 56,206 |
| 2023 | Energi Danmark Group | Denmark | 220 | 48,717 | 1251 | 5044 |
| 2023 | DSV | Denmark | 76,283 | 33,321 | 2484 | 22,827 |
| 2023 | TotalEnergies | France | 101,279 | 263,310 | 20,526 | 303,864 |
| 2023 | Crédit Agricole | France | 72,758 | 86,471 | 5718 | 2,312,852 |
| 2023 | Vinci | France | 271,648 | 65,750 | 4479 | 119,494 |
| 2023 | Société Générale | France | 115,466 | 63,417 | 2122 | 1,586,435 |
| 2023 | Saint-Gobain | France | 155,685 | 53,847 | 3158 | 59,087 |
| 2023 | Renault | France | 105,812 | 49,924 | −356 | 126,246 |
| 2023 | Sanofi | France | 91,573 | 47,738 | 8804 | 135,212 |
| 2023 | Groupe BPCE | France | 96,936 | 47,723 | 4156 | 1,633,720 |
| 2023 | Bouygues | France | 196,154 | 46,696 | 1023 | 64,655 |
| 2023 | Orange | France | 130,307 | 45,721 | 2257 | 116,997 |
| 2023 | Veolia Environnement | France | 202,210 | 45,105 | 753 | 78,216 |
| 2023 | SNCF Group | France | 276,271 | 43,594 | 2551 | 141,949 |
| 2023 | L’Oréal | France | 87,369 | 40,241 | 6002 | 49,983 |
| 2023 | La Poste | France | 238,033 | 37,224 | 1265 | 824,922 |
| 2023 | Schneider Electric | France | 135,000 | 35,945 | 3657 | 62,279 |
| 2023 | Finatis | France | 188,864 | 35,851 | −155 | 35,065 |
| 2023 | ELO Group | France | 166,397 | 35,799 | 35 | 22,010 |
| 2023 | Air Liquide | France | 67,109 | 31,483 | 2902 | 52,836 |
| 2023 | Volkswagen | Germany | 67,5805 | 293,685 | 15,223 | 602,612 |
| 2023 | Uniper | Germany | 7008 | 288,309 | −19,961 | 129,616 |
| 2023 | Siemens | Germany | 311,000 | 77,860 | 4027 | 148,184 |
| 2023 | Munich Re Group | Germany | 41,389 | 75,747 | 3610 | 318,574 |
| 2023 | Deutsche Bahn | Germany | 324,136 | 59,210 | −262 | 81,415 |
| 2023 | Energie Baden-Wurttemberg | Germany | 25,339 | 58,901 | 1828 | 74,160 |
| 2023 | Talanx | Germany | 23,669 | 56,029 | 1233 | 206,073 |
| 2023 | Daimler Truck Holding | Germany | 102,888 | 53,582 | 2803 | 68,255 |
| 2023 | Bayer | Germany | 101,369 | 53,365 | 4365 | 133,244 |
| 2023 | Edeka Zentrale | Germany | 408,900 | 49,481 | 416 | 10,396 |
| 2023 | ZF Friedrichshafen | Germany | 161,901 | 46,068 | 239 | 41,553 |
| 2023 | ThyssenKrupp | Germany | 96,494 | 44,502 | 1229 | 36,671 |
| 2023 | Fresenius | Germany | 282,024 | 42,954 | 1443 | 81,535 |
| 2023 | Deutsche Bank | Germany | 84,930 | 42,285 | 5701 | 1,434,280 |
| 2023 | Continental | Germany | 199,038 | 41,449 | 70 | 40,468 |
| 2023 | RWE | Germany | 18,278 | 40,352 | 2858 | 147,831 |
| 2023 | Phoenix Pharma | Germany | 35,178 | 38,045 | 252 | 14,784 |
| 2023 | Hapag-Lloyd | Germany | 14,248 | 36,331 | 17,912 | 41,279 |
| 2023 | Lufthansa Group | Germany | 93,083 | 34,466 | 832 | 46,238 |
| 2023 | SAP | Germany | 111,961 | 32,469 | 2402 | 76,994 |
| 2023 | Metro | Germany | 86,910 | 32,186 | −361 | 12,574 |
| 2023 | Siemens Energy | Germany | 92,000 | 31,367 | −437 | 50,052 |
| 2023 | Accenture | Ireland | 721,000 | 61,594 | 6877 | 47,263 |
| 2023 | CRH | Ireland | 75,800 | 33,368 | 3847 | 45,188 |
| 2023 | Medtronic | Ireland | 95,000 | 31,686 | 5039 | 90,981 |
| 2023 | Intesa Sanpaolo | Italy | 95,574 | 38,836 | 4579 | 1,041,054 |
| 2023 | Poste Italiane | Italy | 121,033 | 33,528 | 1584 | 279,155 |
| 2023 | Toyota Motor | Japan | 375,235 | 274,491 | 18,110 | 559,765 |
| 2023 | Nissan Motor | Japan | 139,418 | 78,287 | 1639 | 132,579 |
| 2023 | Toyota Tsusho | Japan | 66,944 | 72,760 | 2099 | 48,042 |
| 2023 | Nippon Life Insurance | Japan | 88,528 | 71,213 | 873 | 659,896 |
| 2023 | Dai-ichi Life Holdings | Japan | 60,997 | 70,329 | 1421 | 463,906 |
| 2023 | Mitsubishi UFJ Financial Group | Japan | 127,122 | 68,567 | 8249 | 2,913,963 |
| 2023 | AEON | Japan | 369,404 | 67,985 | 159 | 90,607 |
| 2023 | Marubeni | Japan | 49,546 | 67,898 | 4012 | 59,919 |
| 2023 | Panasonic Holdings | Japan | 233,391 | 61,903 | 1962 | 60,717 |
| 2023 | Idemitsu Kosan | Japan | 16,795 | 61,424 | 1874 | 36,653 |
| 2023 | Nippon Steel Corporation | Japan | 114,029 | 58,923 | 5127 | 72,074 |
| 2023 | Tokyo Electric Power | Japan | 38,007 | 57,616 | −913 | 102,178 |
| 2023 | Sumitomo | Japan | 78,221 | 50,370 | 4176 | 76,136 |
| 2023 | Tokio Marine Holdings | Japan | 43,217 | 49,119 | 2781 | 208,677 |
| 2023 | SoftBank Group | Japan | 63,339 | 48,542 | −7167 | 330,996 |
| 2023 | Denso | Japan | 164,572 | 47,292 | 2325 | 55,813 |
| 2023 | Sumitomo Mitsui Financial Group | Japan | 111,381 | 45,378 | 5954 | 2,037,280 |
| 2023 | Mizuho Financial Group | Japan | 51,258 | 42,693 | 4104 | 1,915,460 |
| 2023 | KDDI | Japan | 49,659 | 41,902 | 5005 | 89,782 |
| 2023 | Meiji Yasuda Life Insurance | Japan | 47,385 | 40,018 | 634 | 367,499 |
| 2023 | JFE Holdings | Japan | 64,241 | 38,925 | 1201 | 41,616 |
| 2023 | MS&AD Insurance Group Holdings | Japan | 38,584 | 38,796 | 1193 | 188,341 |
| 2023 | Mitsubishi Electric | Japan | 149,655 | 36,967 | 1580 | 42,056 |
| 2023 | Daiwa House Industry | Japan | 49,768 | 36,261 | 2278 | 46,271 |
| 2023 | Mitsubishi Chemical Group | Japan | 68,639 | 34,239 | 710 | 43,498 |
| 2023 | Sompo Holdings | Japan | 49,057 | 34,037 | 673 | 108,937 |
| 2023 | Aisin | Japan | 116,649 | 32,528 | 278 | 31,157 |
| 2023 | Bridgestone | Japan | 129,260 | 31,298 | 2287 | 37,612 |
| 2023 | Sumitomo Life Insurance | Japan | 45,336 | 31,218 | 1033 | 321,398 |
| 2023 | Mitsubishi Heavy Industries | Japan | 76,859 | 31,050 | 964 | 41,245 |
| 2023 | Airbus | The Netherlands | 134,267 | 61,805 | 4467 | 123,712 |
| 2023 | Louis Dreyfus | The Netherlands | 16,300 | 59,931 | 1006 | 21,613 |
| 2023 | LyondellBasell Industries | The Netherlands | 19,300 | 50,451 | 3882 | 36,365 |
| 2023 | ING Group | The Netherlands | 58,232 | 48,062 | 12,754 | 1,042,282 |
| 2023 | Ingka Group | The Netherlands | 177,192 | 46,135 | 315 | 58,116 |
| 2023 | EXOR Group | The Netherlands | 80,932 | 45,977 | 4446 | 89,307 |
| 2023 | X5 Retail Group | The Netherlands | 353,196 | 37,494 | 651 | 18,224 |
| 2023 | GasTerra | The Netherlands | 101 | 37,338 | 38 | 17,109 |
| 2023 | PKN ORLEN Group | Poland | 64,494 | 62,326 | 7520 | 62,060 |
| 2023 | Trafigura Group | Singapore | 12,347 | 318,476 | 6994 | 98,634 |
| 2023 | Wilmar International | Singapore | 100,000 | 73,399 | 2403 | 60,402 |
| 2023 | Olam Group | Singapore | 62,467 | 39,836 | 457 | 23,828 |
| 2023 | Kia | Republic of Korea | 35,847 | 67,055 | 4191 | 58,596 |
| 2023 | POSCO Holdings | Republic of Korea | 38,175 | 65,850 | 2446 | 78,716 |
| 2023 | LG Electronics | Republic of Korea | 74,000 | 64,953 | 927 | 43,846 |
| 2023 | Korea Electric Power | Republic of Korea | 49,237 | 54,650 | −18,954 | 186,655 |
| 2023 | Hanwha | Republic of Korea | 54,918 | 48,245 | 1017 | 167,871 |
| 2023 | HD Hyundai | Republic of Korea | 23,316 | 47,138 | 1091 | 52,125 |
| 2023 | GS Caltex | Republic of Korea | 3322 | 45,343 | 2161 | 20,699 |
| 2023 | KB Financial Group | Republic of Korea | 25,876 | 43,622 | 3405 | 557,387 |
| 2023 | LG Chem | Republic of Korea | 40,000 | 40,241 | 1430 | 54,035 |
| 2023 | Hyundai Mobis | Republic of Korea | 33,125 | 40,210 | 1925 | 44,045 |
| 2023 | Korea Gas | Republic of Korea | 4254 | 40,069 | 1157 | 49,624 |
| 2023 | Samsung C&T | Republic of Korea | 17,647 | 33,436 | 1584 | 46,887 |
| 2023 | CJ Corp. | Republic of Korea | 67,361 | 31,703 | 157 | 38,348 |
| 2023 | Samsung Life Insurance | Republic of Korea | 5224 | 31,243 | 1227 | 251,332 |
| 2023 | Repsol | Spain | 23,426 | 72,536 | 4471 | 63,982 |
| 2023 | Iberdrola | Spain | 40,090 | 56,741 | 4564 | 165,030 |
| 2023 | Banco Bilbao Vizcaya Argentaria | Spain | 115,675 | 45,766 | 6752 | 760,920 |
| 2023 | Telefónica | Spain | 103,651 | 42,063 | 2115 | 116,988 |
| 2023 | Naturgy Energy Group | Spain | 7112 | 35,723 | 1734 | 43,096 |
| 2023 | ACS | Spain | 116,702 | 35,355 | 703 | 40,098 |
| 2023 | Volvo | Sweden | 94,921 | 46,828 | 3236 | 60,369 |
| 2023 | Glencore | Switzerland | 81,706 | 255,984 | 17,320 | 132,583 |
| 2023 | Roche Group | Switzerland | 103,613 | 69,596 | 13,014 | 95,319 |
| 2023 | Novartis | Switzerland | 101,703 | 51,828 | 6955 | 117,453 |
| 2023 | Swiss Re | Switzerland | 14,408 | 45,998 | 472 | 170,676 |
| 2023 | Chubb | Switzerland | 34,000 | 43,166 | 5313 | 199,144 |
| 2023 | UBS Group | Switzerland | 72,597 | 42,950 | 7630 | 1,104,364 |
| 2023 | Zurich Insurance Group | Switzerland | 59,498 | 41,750 | 4603 | 377,782 |
| 2023 | Kuehne + Nagel International | Switzerland | 75,194 | 41,278 | 2770 | 15,951 |
| 2023 | Migros Group | Switzerland | 70,880 | 31,576 | 491 | 87,312 |
| 2023 | Walmart | USA | 2,100,000 | 611,289 | 11,680 | 243,197 |
| 2023 | Amazon | USA | 1,541,000 | 513,983 | −2722 | 462,675 |
| 2023 | Exxon Mobil | USA | 62,000 | 413,680 | 55,740 | 369,067 |
| 2023 | Apple | USA | 164,000 | 394,328 | 99,803 | 352,755 |
| 2023 | UnitedHealth Group | USA | 400,000 | 324,162 | 20,120 | 245,705 |
| 2023 | CVS Health | USA | 259,500 | 322,467 | 4149 | 228,275 |
| 2023 | Berkshire Hathaway | USA | 383,000 | 302,089 | −22,819 | 948,452 |
| 2023 | Alphabet | USA | 190,234 | 282,836 | 59,972 | 365,264 |
| 2023 | McKesson | USA | 48,000 | 276,711 | 3560 | 62,320 |
| 2023 | U.S. Postal Service | USA | 576,065 | 78,620 | 56,046 | 46,115 |
| 2023 | Albertsons | USA | 198,650 | 77,650 | 1514 | 26,168 |
| 2023 | General Electric | USA | 172,000 | 76,555 | 225 | 187,788 |
| 2023 | MetLife | USA | 45,000 | 69,898 | 2539 | 666,611 |
| 2023 | Goldman Sachs Group | USA | 48,500 | 68,711 | 11,261 | 1,441,799 |
| 2023 | Sysco | USA | 70,510 | 68,636 | 1359 | 22,086 |
| 2023 | Bunge | USA | 23,000 | 67,232 | 1610 | 24,580 |
| 2023 | RTX | USA | 182,000 | 67,074 | 5197 | 158,864 |
| 2023 | Boeing | USA | 156,000 | 66,608 | −4935 | 137,100 |
| 2023 | StoneX Group | USA | 3615 | 66,036 | 207 | 19,860 |
| 2023 | Lockheed Martin | USA | 116,000 | 65,984 | 5732 | 52,880 |
| 2023 | Morgan Stanley | USA | 82,427 | 65,936 | 11,029 | 1,180,231 |
| 2023 | Intel | USA | 131,900 | 63,054 | 8014 | 182,103 |
| 2023 | HP | USA | 58,000 | 62,983 | 3203 | 38,587 |
| 2023 | TD Synnex | USA | 28,500 | 62,344 | 651 | 29,734 |
| 2023 | IBM | USA | 303,100 | 60,530 | 1639 | 127,243 |
| 2023 | HCA Healthcare | USA | 250,500 | 60,233 | 5643 | 52,438 |
| 2023 | Prudential Financial | USA | 39,583 | 60,050 | −1438 | 689,917 |
| 2023 | Caterpillar | USA | 109,100 | 59,427 | 6705 | 81,943 |
| 2023 | Merck | USA | 68,000 | 59,283 | 14,519 | 109,160 |
| 2023 | World Kinect | USA | 5214 | 59,043 | 114 | 8165 |
| 2023 | New York Life Insurance | USA | 15,050 | 58,445 | −1127 | 392,126 |
| 2023 | Enterprise Products Partners | USA | 7300 | 58,186 | 5490 | 68,108 |
| 2023 | AbbVie | USA | 50,000 | 58,054 | 11,836 | 138,805 |
| 2023 | Plains GP Holdings | USA | 4100 | 57,342 | 168 | 29,207 |
| 2023 | Dow | USA | 37,800 | 56,902 | 4582 | 60,603 |
| 2023 | American International Group | USA | 26,200 | 56,437 | 10,276 | 526,634 |
| 2023 | American Express | USA | 77,300 | 55,625 | 7514 | 228,354 |
| 2023 | Publix Super Markets | USA | 242,000 | 54,942 | 2918 | 31,047 |
| 2023 | Charter Communications | USA | 101,700 | 54,022 | 5055 | 144,523 |
| 2023 | Tyson Foods | USA | 142,000 | 53,282 | 3238 | 36,821 |
| 2023 | Deere | USA | 82,239 | 52,577 | 7131 | 90,030 |
| 2023 | Cisco Systems | USA | 83,300 | 51,557 | 11,812 | 94,002 |
| 2023 | Nationwide | USA | 24,791 | 51,450 | 988 | 264,511 |
| 2023 | Allstate | USA | 54,250 | 51,412 | −1311 | 97,957 |
| 2023 | Delta Air Lines | USA | 95,000 | 50,582 | 1318 | 72,288 |
| 2023 | Liberty Mutual Insurance Group | USA | 50,000 | 49,956 | 414 | 160,316 |
| 2023 | TJX | USA | 329,000 | 49,936 | 3498 | 28,349 |
| 2023 | Progressive | USA | 55,063 | 49,611 | 722 | 75,465 |
| 2023 | American Airlines Group | USA | 129,700 | 48,971 | 127 | 64,716 |
| 2023 | CHS | USA | 10,014 | 47,792 | 1679 | 18,825 |
| 2023 | Performance Food Group | USA | 34,825 | 47,194 | 113 | 12,378 |
| 2023 | PBF Energy | USA | 3616 | 46,830 | 2877 | 13,549 |
| 2023 | Nike | USA | 79,100 | 46,710 | 6046 | 40,321 |
| 2023 | Best Buy | USA | 71,100 | 46,298 | 1419 | 15,803 |
| 2023 | Bristol-Myers Squibb | USA | 34,300 | 46,159 | 6327 | 96,820 |
| 2023 | United Airlines Holdings | USA | 92,795 | 44,955 | 737 | 67,358 |
| 2023 | Thermo Fisher Scientific | USA | 130,000 | 44,915 | 6950 | 97,154 |
| 2023 | Qualcomm | USA | 51,000 | 44,200 | 12,936 | 49,014 |
| 2023 | Abbott Laboratories | USA | 115,000 | 43,653 | 6933 | 74,438 |
| 2023 | Coca-Cola | USA | 82,500 | 43,004 | 9542 | 92,763 |
| 2023 | Oracle | USA | 143,000 | 42,440 | 6717 | 109,297 |
| 2023 | Nucor | USA | 31,400 | 41,513 | 7607 | 32,479 |
| 2023 | TIAA | USA | 16,070 | 40,911 | 494 | 634,457 |
| 2023 | Massachusetts Mutual Life Insurance | USA | 10,662 | 40,281 | 1485 | 381,336 |
| 2023 | General Dynamics | USA | 106,500 | 39,407 | 3390 | 51,585 |
| 2023 | Capital One Financial | USA | 55,943 | 38,373 | 7360 | 455,249 |
| 2023 | HF Sinclair | USA | 5223 | 38,205 | 2923 | 18,126 |
| 2023 | Dollar General | USA | 170,000 | 37,845 | 2416 | 29,083 |
| 2023 | Arrow Electronics | USA | 22,300 | 37,124 | 1427 | 21,763 |
| 2023 | Occidental Petroleum | USA | 11,973 | 37,095 | 13,304 | 72,609 |
| 2023 | Northwestern Mutual | USA | 8323 | 36,921 | 912 | 340,390 |
| 2023 | Travelers | USA | 32,175 | 36,884 | 2842 | 115,717 |
| 2023 | Northrop Grumman | USA | 95,000 | 36,602 | 4896 | 43,755 |
| 2023 | USAA | USA | 36,820 | 36,297 | −1296 | 204,005 |
| 2023 | Honeywell International | USA | 97,000 | 35,466 | 4966 | 62,275 |
| 2023 | US Foods Holding | USA | 29,000 | 34,057 | 265 | 12,773 |
| 2023 | Warner Bros. Discovery | USA | 37,500 | 33,817 | −7371 | 134,001 |
| 2023 | Lennar | USA | 12,012 | 33,671 | 4614 | 37,984 |
| 2023 | D.R. Horton | USA | 13,237 | 33,480 | 5858 | 30,351 |
| 2023 | Jabil | USA | 250,000 | 33,478 | 996 | 19,717 |
| 2023 | Cheniere Energy | USA | 1551 | 33,428 | 1428 | 41,266 |
| 2023 | Broadcom | USA | 20,000 | 33,203 | 11,495 | 73,249 |
| 2023 | Starbucks | USA | 402,000 | 32,250 | 3282 | 27,978 |
| 2023 | Molina Healthcare | USA | 15,000 | 31,974 | 792 | 12,314 |
| 2023 | Uber Technologies | USA | 32,800 | 31,877 | −9141 | 32,109 |
| 2023 | Philip Morris International | USA | 79,800 | 31,762 | 9048 | 61,681 |
| 2023 | Netflix | USA | 12,800 | 31,616 | 4492 | 48,595 |
| 2023 | NRG Energy | USA | 6603 | 31,543 | 1221 | 29,146 |
| 2023 | Mondelez International | USA | 91,000 | 31,496 | 2717 | 71,161 |
| 2023 | Danaher | USA | 80,000 | 31,471 | 7209 | 84,350 |
| 2023 | Salesforce | USA | 79,390 | 31,352 | 208 | 98,849 |
| 2023 | Paramount Global | USA | 27,400 | 31,331 | 1104 | 58,393 |
| 2023 | CarMax | USA | 30,621 | 31,126 | 485 | 26,183 |
| 2022 | BHP Group | Australia | 34,478 | 60,817 | 11,304 | 108,927 |
| 2022 | Woolworths Group | Australia | 210,067 | 50,211 | 1548 | 29,407 |
| 2022 | Coles Group | Australia | 120,000 | 29,056 | 750 | 13,583 |
| 2022 | OMV Group | Austria | 22,434 | 42,038 | 2586 | 61,168 |
| 2022 | Anheuser-Busch InBev | Belgium | 169,339 | 54,304 | 4670 | 217,627 |
| 2022 | Umicore | Belgium | 11,050 | 28,650 | 732 | 10,284 |
| 2022 | Shell | UK | 82,000 | 272,657 | 20,101 | 404,379 |
| 2022 | BP | UK | 65,900 | 164,195 | 7565 | 287,272 |
| 2022 | Tesco | UK | 231,223 | 84,192 | 2032 | 66,219 |
| 2022 | HSBC Holdings | UK | 219,697 | 77,330 | 13,917 | 2,957,939 |
| 2022 | Aviva | UK | 22,062 | 64,240 | 2704 | 485,481 |
| 2022 | Rio Tinto Group | UK | 49,345 | 63,495 | 21,094 | 102,896 |
| 2022 | Legal & General Group | UK | 10,743 | 62,505 | 2819 | 789,067 |
| 2022 | Unilever | UK | 148,044 | 62,006 | 7152 | 85,383 |
| 2022 | Lloyds Banking Group | UK | 57,955 | 58,476 | 7954 | 1,200,621 |
| 2022 | Vodafone Group | UK | 96,941 | 52,932 | 2425 | 170,749 |
| 2022 | GSK | UK | 90,096 | 46,915 | 6030 | 107,129 |
| 2022 | Anglo American | UK | 62,000 | 41,554 | 8562 | 65,985 |
| 2022 | J. Sainsbury | UK | 117,000 | 40,832 | 925 | 35,389 |
| 2022 | Barclays | UK | 81,600 | 37,562 | 9873 | 1,874,737 |
| 2022 | AstraZeneca | UK | 83,100 | 37,417 | 112 | 105,363 |
| 2022 | British American Tobacco | UK | 54,365 | 35,322 | 9353 | 186,033 |
| 2022 | Phoenix Group Holdings | UK | 8045 | 33,750 | −1151 | 452,064 |
| 2022 | Linde | UK | 72,327 | 30,798 | 3826 | 81,605 |
| 2022 | Brookfield Asset Management | Canada | 181,000 | 75,731 | 3966 | 391,003 |
| 2022 | Power Corp. of Canada | Canada | 33,700 | 55,489 | 2368 | 523,983 |
| 2022 | Manulife Financial | Canada | 38,000 | 49,315 | 5668 | 726,731 |
| 2022 | Royal Bank of Canada | Canada | 85,301 | 45,981 | 12,751 | 1,376,289 |
| 2022 | Alimentation Couche-Tard | Canada | 124,000 | 45,760 | 2706 | 28,395 |
| 2022 | George Weston | Canada | 215,298 | 43,925 | 344 | 37,288 |
| 2022 | Toronto-Dominion Bank | Canada | 89,464 | 38,275 | 11,367 | 1,394,315 |
| 2022 | Enbridge | Canada | 11,950 | 37,549 | 4937 | 133,733 |
| 2022 | Cenovus Energy | Canada | 5938 | 36,979 | 468 | 42,848 |
| 2022 | Magna International | Canada | 158,000 | 36,242 | 1514 | 29,086 |
| 2022 | Bank of Nova Scotia | Canada | 89,488 | 31,226 | 7651 | 955,674 |
| 2022 | Suncor Energy | Canada | 16,922 | 31,191 | 3286 | 66,317 |
| 2022 | Maersk Group | Denmark | 85,375 | 61,787 | 17,942 | 72,271 |
| 2022 | DSV | Denmark | 77,958 | 28,988 | 1782 | 24,678 |
| 2022 | Fortum | Finland | 19,140 | 132,894 | 874 | 170,165 |
| 2022 | TotalEnergies | France | 101,309 | 184,634 | 16,032 | 293,458 |
| 2022 | AXA | France | 92,398 | 144,447 | 8624 | 881,733 |
| 2022 | Credit Agricole | France | 75,711 | 107,695 | 6910 | 2,358,087 |
| 2022 | Electricité de France | France | 163,423 | 99,861 | 6045 | 410,418 |
| 2022 | Carrefour | France | 319,565 | 87,831 | 1268 | 54,199 |
| 2022 | BNP Paribas | France | 189,765 | 85,301 | 11,218 | 2,995,363 |
| 2022 | Engie | France | 171,474 | 83,622 | 4329 | 256,204 |
| 2022 | Christian Dior | France | 162,254 | 75,924 | 5848 | 139,119 |
| 2022 | Vinci | France | 219,299 | 59,389 | 3071 | 113,725 |
| 2022 | Société Générale | France | 124,089 | 59,058 | 6670 | 1,665,079 |
| 2022 | CMA CGM | France | 72,282 | 55,976 | 17,894 | 51,984 |
| 2022 | Renault | France | 156,466 | 54,639 | 1050 | 129,322 |
| 2022 | Saint-Gobain | France | 167,816 | 52,212 | 2981 | 58,651 |
| 2022 | Orange | France | 139,698 | 50,275 | 276 | 122,877 |
| 2022 | Groupe BPCE | France | 98,727 | 48,433 | 4733 | 1,723,716 |
| 2022 | Sanofi | France | 95,442 | 46,318 | 7358 | 136,715 |
| 2022 | Bouygues | France | 124,651 | 44,508 | 1330 | 50,758 |
| 2022 | SNCF Group | France | 270,296 | 41,088 | 1052 | 141,810 |
| 2022 | La Poste | France | 244,980 | 40,919 | 2446 | 905,467 |
| 2022 | L’Oréal | France | 85,412 | 38,175 | 5435 | 48,906 |
| 2022 | ELO Group | France | 153,005 | 37,677 | 407 | 24,093 |
| 2022 | Finatis | France | 196,350 | 37,458 | −196 | 36,146 |
| 2022 | Schneider Electric | France | 128,000 | 34,175 | 3788 | 62,020 |
| 2022 | Veolia Environnement | France | 169,741 | 33,706 | 478 | 60,349 |
| 2022 | Danone | France | 98,105 | 28,708 | 2275 | 51,643 |
| 2022 | Volkswagen | Germany | 672,789 | 295,820 | 18,187 | 601,028 |
| 2022 | Mercedes-Benz Group | Germany | 172,425 | 158,306 | 27,201 | 295,428 |
| 2022 | Allianz | Germany | 155,411 | 144,517 | 7815 | 1,295,531 |
| 2022 | BMW Group | Germany | 118,909 | 131,522 | 14,640 | 260,972 |
| 2022 | Deutsche Telekom | Germany | 216,528 | 128,631 | 4937 | 320,210 |
| 2022 | Deutsche Post DHL Group | Germany | 548,042 | 96,652 | 5974 | 72,304 |
| 2022 | Bosch Group | Germany | 402,614 | 93,106 | 2382 | 111,111 |
| 2022 | BASF | Germany | 111,047 | 92,929 | 6530 | 99,355 |
| 2022 | E.ON | Germany | 69,733 | 91,463 | 5546 | 136,166 |
| 2022 | Munich Re Group | Germany | 39,281 | 83,052 | 3468 | 355,205 |
| 2022 | Siemens | Germany | 303,000 | 75,516 | 7362 | 161,610 |
| 2022 | Deutsche Bahn | Germany | 323,716 | 55,658 | −1088 | 81,686 |
| 2022 | Talanx | Germany | 23,954 | 53,420 | 1195 | 224,585 |
| 2022 | Bayer | Germany | 99,637 | 52,118 | 1182 | 136,714 |
| 2022 | Edeka Zentrale | Germany | 404,900 | 51,950 | 415 | 10,608 |
| 2022 | ZF Friedrichshafen | Germany | 157,549 | 45,299 | 780 | 43,614 |
| 2022 | Continental | Germany | 190,875 | 45,163 | 1720 | 40,751 |
| 2022 | Fresenius | Germany | 281,011 | 44,361 | 2150 | 81,821 |
| 2022 | DZ Bank | Germany | 28,913 | 41,005 | 2360 | 713,209 |
| 2022 | ThyssenKrupp | Germany | 101,275 | 40,648 | −137 | 42,612 |
| 2022 | Deutsche Bank | Germany | 82,969 | 40,188 | 2898 | 1,506,190 |
| 2022 | Energie Baden-Wurttemberg | Germany | 24,519 | 38,010 | 429 | 81,038 |
| 2022 | Phoenix Pharma | Germany | 33,205 | 36,107 | 208 | 12,055 |
| 2022 | Heraeus Holding | Germany | 16,159 | 34,886 | 427 | 7952 |
| 2022 | Siemens Energy | Germany | 92,000 | 34,036 | −541 | 51,098 |
| 2022 | SAP | Germany | 107,415 | 32,919 | 6214 | 80,919 |
| 2022 | Metro | Germany | 86,527 | 29,594 | −67 | 14,839 |
| 2022 | RWE | Germany | 18,867 | 28,998 | 853 | 161,805 |
| 2022 | Accenture | Ireland | 624,000 | 50,533 | 5907 | 43,176 |
| 2022 | CRH | Ireland | 77,400 | 30,981 | 2565 | 44,670 |
| 2022 | Medtronic | Ireland | 90,000 | 30,117 | 3606 | 93,083 |
| 2022 | Assicurazioni Generali | Italy | 74,621 | 117,155 | 3366 | 666,538 |
| 2022 | Enel | Italy | 66,279 | 104,052 | 3771 | 235,291 |
| 2022 | ENI | Italy | 32,689 | 91,951 | 6882 | 156,639 |
| 2022 | Intesa Sanpaolo | Italy | 97,698 | 46,584 | 4948 | 1,215,456 |
| 2022 | Poste Italiane | Italy | 118,969 | 37,492 | 1866 | 323,736 |
| 2022 | Toyota Motor | Japan | 372,817 | 279,338 | 25,371 | 557,522 |
| 2022 | Mitsubishi | Japan | 80,728 | 153,690 | 8346 | 180,480 |
| 2022 | Honda Motor | Japan | 204,035 | 129,547 | 6294 | 197,456 |
| 2022 | Itochu | Japan | 136,722 | 109,434 | 7302 | 100,104 |
| 2022 | Nippon Telegraph and Telephone | Japan | 333,840 | 108,216 | 10,514 | 196,543 |
| 2022 | Mitsui | Japan | 44,336 | 104,665 | 8143 | 122,917 |
| 2022 | Japan Post Holdings | Japan | 232,112 | 100,278 | 4466 | 2,502,652 |
| 2022 | Hitachi | Japan | 368,247 | 91,375 | 5194 | 114,385 |
| 2022 | Sony | Japan | 108,900 | 88,321 | 7853 | 251,058 |
| 2022 | ENEOS Holdings | Japan | 41,852 | 80,133 | 4781 | 79,468 |
| 2022 | Seven & I Holdings | Japan | 127,196 | 78,458 | 1890 | 75,888 |
| 2022 | AEON | Japan | 288,064 | 78,155 | 58 | 101,017 |
| 2022 | Marubeni | Japan | 49,623 | 75,743 | 3777 | 67,998 |
| 2022 | Nissan Motor | Japan | 141,983 | 74,995 | 1919 | 134,845 |
| 2022 | Nippon Life Insurance | Japan | 92,737 | 74,392 | 3087 | 727,963 |
| 2022 | Dai-ichi Life Holdings | Japan | 62,296 | 73,082 | 3644 | 542,634 |
| 2022 | Toyota Tsusho | Japan | 65,218 | 71,465 | 1978 | 50,598 |
| 2022 | Panasonic Holdings | Japan | 240,198 | 65,774 | 2273 | 66,087 |
| 2022 | Nippon Steel Corporation | Japan | 115,667 | 60,612 | 5673 | 72,089 |
| 2022 | SoftBank Group | Japan | 59,721 | 55,384 | −15,205 | 391,604 |
| 2022 | Mitsubishi UFJ Financial Group | Japan | 135,042 | 54,087 | 10,067 | 3,078,263 |
| 2022 | Idemitsu Kosan | Japan | 16,606 | 52,336 | 2488 | 37,898 |
| 2022 | Tokio Marine Holdings | Japan | 43,048 | 52,199 | 3743 | 224,412 |
| 2022 | Denso | Japan | 167,950 | 49,099 | 2349 | 61,216 |
| 2022 | Sumitomo | Japan | 74,253 | 48,916 | 4128 | 78,924 |
| 2022 | KDDI | Japan | 48,829 | 48,486 | 5986 | 91,297 |
| 2022 | Tokyo Electric Power | Japan | 37,939 | 47,269 | 50 | 105,869 |
| 2022 | MS&AD Insurance Group Holdings | Japan | 39,962 | 45,685 | 2339 | 206,193 |
| 2022 | Mitsubishi Electric | Japan | 145,696 | 39,852 | 1811 | 42,072 |
| 2022 | Daiwa House Industry | Japan | 48,831 | 39,520 | 2005 | 45,480 |
| 2022 | JFE Holdings | Japan | 64,296 | 38,858 | 2564 | 43,554 |
| 2022 | Meiji Yasuda Life Insurance | Japan | 48,179 | 37,516 | 1618 | 397,023 |
| 2022 | Sompo Holdings | Japan | 47,776 | 37,099 | 2002 | 113,564 |
| 2022 | Sumitomo Mitsui Financial Group | Japan | 101,023 | 36,597 | 6290 | 2,122,598 |
| 2022 | Mitsubishi Chemical Holdings | Japan | 69,784 | 35,403 | 1577 | 45,910 |
| 2022 | Mizuho Financial Group | Japan | 52,464 | 35,279 | 4722 | 1,952,608 |
| 2022 | Aisin | Japan | 117,177 | 34,873 | 1264 | 34,641 |
| 2022 | Mitsubishi Heavy Industries | Japan | 77,991 | 34,364 | 1011 | 42,141 |
| 2022 | Sumitomo Life Insurance | Japan | 42,954 | 32,042 | 406 | 354,125 |
| 2022 | Canon | Japan | 184,034 | 32,005 | 1956 | 41,265 |
| 2022 | Fujitsu | Japan | 124,216 | 31,930 | 1626 | 27,443 |
| 2022 | Takeda Pharmaceutical | Japan | 47,347 | 31,771 | 2048 | 108,542 |
| 2022 | Suzuki Motor | Japan | 69,193 | 31,765 | 1427 | 34,224 |
| 2022 | Sumitomo Electric Industries | Japan | 281,075 | 29,980 | 857 | 31,360 |
| 2022 | Toshiba | Japan | 116,224 | 29,705 | 1733 | 30,760 |
| 2022 | Bridgestone | Japan | 135,636 | 29,570 | 3590 | 39,737 |
| 2022 | Medipal Holdings | Japan | 14,454 | 29,296 | 262 | 14,080 |
| 2022 | ArcelorMittal | Luxembourg | 157,909 | 76,571 | 14,956 | 90,512 |
| 2022 | Stellantis | The Netherlands | 281,595 | 176,663 | 16,789 | 195,298 |
| 2022 | Royal Ahold Delhaize | The Netherlands | 259,000 | 89,386 | 2656 | 51,975 |
| 2022 | Aegon | The Netherlands | 22,271 | 63,663 | 2341 | 532,403 |
| 2022 | Airbus | The Netherlands | 126,495 | 61,658 | 4981 | 121,712 |
| 2022 | Louis Dreyfus | The Netherlands | 15,737 | 49,569 | 697 | 23,626 |
| 2022 | Ingka Group | The Netherlands | 174,225 | 47,546 | 1887 | 65,011 |
| 2022 | EXOR Group | The Netherlands | 74,353 | 47,011 | 2030 | 103,593 |
| 2022 | LyondellBasell Industries | The Netherlands | 19,100 | 46,173 | 5610 | 36,742 |
| 2022 | ING Group | The Netherlands | 57,660 | 33,851 | 7036 | 1,079,297 |
| 2022 | X5 Retail Group | The Netherlands | 340,928 | 29,922 | 580 | 17,165 |
| 2022 | Randstad | The Netherlands | 39,530 | 29,127 | 908 | 12,553 |
| 2022 | Equinor | Norway | 21,126 | 90,924 | 8563 | 147,120 |
| 2022 | PKN ORLEN Group | Poland | 35,424 | 34,026 | 2881 | 26,490 |
| 2022 | Trafigura Group | Singapore | 9031 | 231,308 | 3100 | 90,066 |
| 2022 | Wilmar International | Singapore | 100,000 | 65,794 | 1890 | 58,718 |
| 2022 | Olam Group | Singapore | 62,548 | 34,987 | 511 | 23,786 |
| 2022 | Samsung Electronics | Republic of Korea | 266,673 | 244,335 | 34,294 | 358,982 |
| 2022 | Hyundai Motor | Republic of Korea | 121,403 | 102,775 | 4319 | 196,855 |
| 2022 | SK | Republic of Korea | 117,438 | 88,081 | 1722 | 139,160 |
| 2022 | LG Electronics | Republic of Korea | 75,000 | 66,862 | 902 | 45,002 |
| 2022 | POSCO Holdings | Republic of Korea | 36,619 | 66,421 | 5773 | 77,665 |
| 2022 | Kia | Republic of Korea | 51,975 | 61,050 | 4160 | 56,251 |
| 2022 | Korea Electric Power | Republic of Korea | 48,809 | 52,356 | −4645 | 177,638 |
| 2022 | Hanwha | Republic of Korea | 53,198 | 46,171 | 787 | 170,282 |
| 2022 | LG Chem | Republic of Korea | 40,000 | 37,830 | 3207 | 43,028 |
| 2022 | SK Hynix | Republic of Korea | 38,352 | 37,574 | 8391 | 81,105 |
| 2022 | KB Financial Group | Republic of Korea | 26,187 | 37,197 | 3853 | 558,637 |
| 2022 | Hyundai Mobis | Republic of Korea | 33,702 | 36,442 | 2056 | 43,320 |
| 2022 | Samsung Life Insurance | Republic of Korea | 4975 | 30,654 | 1284 | 287,258 |
| 2022 | GS Caltex | Republic of Korea | 3259 | 30,182 | 919 | 19,844 |
| 2022 | CJ Corp. | Republic of Korea | 64,259 | 30,134 | 240 | 35,304 |
| 2022 | Samsung C&T | Republic of Korea | 15,331 | 30,109 | 1429 | 46,486 |
| 2022 | Banco Santander | Spain | 194,479 | 78,689 | 9605 | 1,814,464 |
| 2022 | Repsol | Spain | 22,923 | 52,335 | 2955 | 63,961 |
| 2022 | Telefónica | Spain | 104,150 | 46,439 | 9621 | 124,175 |
| 2022 | Iberdrola | Spain | 38,702 | 46,246 | 4593 | 161,172 |
| 2022 | Banco Bilbao Vizcaya Argentaria | Spain | 110,432 | 39,807 | 5501 | 753,700 |
| 2022 | ACS | Spain | 105,553 | 38,317 | 3601 | 40,550 |
| 2022 | Inditex | Spain | 165,042 | 32,572 | 3811 | 32,442 |
| 2022 | Mercadona | Spain | 95,800 | 30,170 | 804 | 12,690 |
| 2022 | Volvo | Sweden | 89,195 | 43,388 | 3822 | 56,992 |
| 2022 | Investor | Sweden | 14,812 | 30,948 | 26,585 | 87,892 |
| 2022 | Glencore | Switzerland | 81,284 | 203,751 | 4974 | 127,510 |
| 2022 | Nestlé | Switzerland | 276,000 | 95,293 | 18,498 | 152,769 |
| 2022 | Roche Group | Switzerland | 100,920 | 72,054 | 15,242 | 101,358 |
| 2022 | Zurich Insurance Group | Switzerland | 54,914 | 69,867 | 5202 | 435,826 |
| 2022 | Novartis | Switzerland | 104,323 | 52,877 | 24,021 | 131,795 |
| 2022 | Swiss Re | Switzerland | 13,985 | 46,739 | 1437 | 181,567 |
| 2022 | Chubb | Switzerland | 31,000 | 40,963 | 8539 | 200,054 |
| 2022 | UBS Group | Switzerland | 71,385 | 40,638 | 7457 | 1,117,182 |
| 2022 | Kuehne + Nagel International | Switzerland | 73,516 | 35,891 | 2223 | 16,085 |
| 2022 | Coop Group | Switzerland | 82,697 | 33,649 | 612 | 23,681 |
| 2022 | Migros Group | Switzerland | 73,546 | 31,658 | 732 | 85,619 |
| 2022 | Holcim | Switzerland | 70,000 | 29,362 | 2515 | 65,750 |
| 2022 | Credit Suisse Group | Switzerland | 50,110 | 29,044 | −1806 | 829,856 |
| 2022 | ABB | Switzerland | 104,400 | 28,945 | 4546 | 40,260 |
| 2022 | Walmart | USA | 2,300,000 | 572,754 | 13,673 | 244,860 |
| 2022 | Amazon | USA | 1,608,000 | 469,822 | 33,364 | 420,549 |
| 2022 | Apple | USA | 154,000 | 365,817 | 94,680 | 351,002 |
| 2022 | CVS Health | USA | 258,000 | 292,111 | 7910 | 232,999 |
| 2022 | UnitedHealth Group | USA | 350,000 | 287,597 | 17,285 | 212,206 |
| 2022 | Exxon Mobil | USA | 63,000 | 285,640 | 23,040 | 338,923 |
| 2022 | Berkshire Hathaway | USA | 372,000 | 276,094 | 89,795 | 958,784 |
| 2022 | McKesson | USA | 66,500 | 263,966 | 1114 | 63,298 |
| 2022 | Alphabet | USA | 156,500 | 257,637 | 76,033 | 359,268 |
| 2022 | AmerisourceBergen | USA | 40,000 | 213,989 | 1540 | 57,338 |
| 2022 | Costco Wholesale | USA | 288,000 | 195,929 | 5007 | 59,268 |
| 2022 | Cigna | USA | 72,963 | 174,078 | 5365 | 154,889 |
| 2022 | AT&T | USA | 202,600 | 168,864 | 20,081 | 551,622 |
| 2022 | Microsoft | USA | 181,000 | 168,088 | 61,271 | 333,779 |
| 2022 | Cardinal Health | USA | 46,827 | 162,467 | 611 | 44,453 |
| 2022 | Chevron | USA | 42,595 | 162,465 | 15,625 | 239,535 |
| 2022 | Home Depot | USA | 490,600 | 151,157 | 16,433 | 71,876 |
| 2022 | Walgreens Boots Alliance | USA | 258,500 | 148,579 | 2542 | 81,285 |
| 2022 | Marathon Petroleum | USA | 17,700 | 14,1032 | 9738 | 85,373 |
| 2022 | Elevance Health | USA | 98,200 | 138,639 | 6104 | 97,460 |
| 2022 | Kroger | USA | 420,000 | 137,888 | 1655 | 49,086 |
| 2022 | Ford Motor | USA | 183,000 | 136,341 | 17,937 | 257,035 |
| 2022 | Verizon Communications | USA | 118,400 | 133,613 | 22,065 | 366,596 |
| 2022 | JPMorgan Chase | USA | 271,025 | 127,202 | 48,334 | 3,743,567 |
| 2022 | General Motors | USA | 157,000 | 127,004 | 10,019 | 244,718 |
| 2022 | Centene | USA | 72,500 | 125,982 | 1347 | 78,375 |
| 2022 | Meta Platforms | USA | 71,970 | 117,929 | 39,370 | 165,987 |
| 2022 | Comcast | USA | 189,000 | 116,385 | 14,159 | 275,905 |
| 2022 | Phillips 66 | USA | 14,000 | 114,852 | 1317 | 55,594 |
| 2022 | Valero Energy | USA | 9804 | 108,332 | 930 | 57,888 |
| 2022 | Dell Technologies | USA | 133,000 | 106,995 | 5563 | 92,735 |
| 2022 | Target | USA | 450,000 | 106,005 | 6946 | 53,811 |
| 2022 | Fannie Mae | USA | 7400 | 101,543 | 22,176 | 4,229,166 |
| 2022 | United Parcel Service | USA | 400,945 | 97,287 | 12,890 | 69,405 |
| 2022 | Lowe’s | USA | 270,000 | 96,250 | 8442 | 44,640 |
| 2022 | Bank of America | USA | 208,248 | 93,851 | 31,978 | 3,169,495 |
| 2022 | Johnson & Johnson | USA | 141,700 | 93,775 | 20,878 | 182,018 |
| 2022 | Archer Daniels Midland | USA | 39,979 | 85,249 | 2709 | 56,136 |
| 2022 | FedEx | USA | 508,650 | 83,959 | 5231 | 82,777 |
| 2022 | Humana | USA | 95,500 | 83,064 | 2933 | 44,358 |
| 2022 | Wells Fargo | USA | 247,848 | 82,407 | 21,548 | 1,948,068 |
| 2022 | State Farm Insurance | USA | 53,586 | 82,225 | 1281 | 325,349 |
| 2022 | Pfizer | USA | 79,000 | 81,288 | 21,979 | 181,476 |
| 2022 | Citigroup | USA | 221,768 | 79,865 | 21,952 | 2,291,413 |
| 2022 | PepsiCo | USA | 309,000 | 79,474 | 7618 | 92,377 |
| 2022 | Intel | USA | 121,100 | 79,024 | 19,868 | 168,406 |
| 2022 | U.S. Postal Service | USA | 584,902 | 77,041 | −4930 | 46,405 |
| 2022 | Procter & Gamble | USA | 101,000 | 76,118 | 14,306 | 119,307 |
| 2022 | General Electric | USA | 168,000 | 74,196 | −6520 | 198,874 |
| 2022 | International Business Machines | USA | 297,800 | 72,344 | 5743 | 132,001 |
| 2022 | Albertsons | USA | 195,750 | 71,887 | 1620 | 28,123 |
| 2022 | MetLife | USA | 43,000 | 71,080 | 6554 | 759,708 |
| 2022 | Prudential Financial | USA | 40,916 | 70,934 | 7724 | 937,582 |
| 2022 | Walt Disney | USA | 171,000 | 67,418 | 1995 | 203,609 |
| 2022 | Energy Transfer | USA | 12,558 | 67,417 | 5470 | 105,963 |
| 2022 | Lockheed Martin | USA | 114,000 | 67,044 | 6315 | 50,873 |
| 2022 | Freddie Mac | USA | 7301 | 65,898 | 12,109 | 3,025,586 |
| 2022 | Goldman Sachs Group | USA | 43,900 | 64,989 | 21,635 | 1,463,988 |
| 2022 | Raytheon Technologies | USA | 174,000 | 64,388 | 3864 | 161,404 |
| 2022 | HP | USA | 51,000 | 63,487 | 6503 | 38,610 |
| 2022 | Boeing | USA | 142,000 | 62,286 | −4202 | 138,552 |
| 2022 | Morgan Stanley | USA | 74,814 | 61,121 | 15,034 | 1,188,140 |
| 2022 | Bunge | USA | 22,000 | 59,152 | 2078 | 23,819 |
| 2022 | HCA Healthcare | USA | 244,000 | 58,752 | 6956 | 50,742 |
| 2022 | AbbVie | USA | 50,000 | 56,197 | 11,542 | 146,529 |
| 2022 | Dow | USA | 35,700 | 54,968 | 6311 | 62,990 |
| 2022 | Tesla | USA | 99,290 | 53,823 | 5519 | 62,131 |
| 2022 | Allstate | USA | 54,500 | 53,228 | 1599 | 99,440 |
| 2022 | American International Group | USA | 36,600 | 52,057 | 9388 | 596,112 |
| 2022 | Best Buy | USA | 81,375 | 51,761 | 2454 | 17,504 |
| 2022 | Charter Communications | USA | 93,700 | 51,682 | 4654 | 142,491 |
| 2022 | Sysco | USA | 57,710 | 51,298 | 524 | 21,414 |
| 2022 | Merck | USA | 67,500 | 51,216 | 13,049 | 105,694 |
| 2022 | New York Life Insurance | USA | 14,344 | 51,199 | 277 | 379,985 |
| 2022 | Caterpillar | USA | 107,700 | 50,971 | 6489 | 82,793 |
| 2022 | Cisco Systems | USA | 79,500 | 49,818 | 10,591 | 97,497 |
| 2022 | TJX | USA | 340,000 | 48,550 | 3283 | 28,462 |
| 2022 | Publix Super Markets | USA | 232,000 | 48,394 | 4412 | 31,524 |
| 2022 | ConocoPhillips | USA | 9900 | 48,349 | 8079 | 90,661 |
| 2022 | Liberty Mutual Insurance Group | USA | 45,000 | 48,200 | 3068 | 15,6043 |
| 2022 | Progressive | USA | 49,077 | 47,702 | 3351 | 71,132 |
| 2022 | Nationwide | USA | 24,134 | 47,376 | 1617 | 278,412 |
| 2022 | Tyson Foods | USA | 137,000 | 47,049 | 3047 | 36,309 |
| 2022 | Bristol-Myers Squibb | USA | 32,200 | 46,385 | 6994 | 109,314 |
| 2022 | Nike | USA | 73,300 | 44,538 | 5727 | 37,740 |
| 2022 | Deere | USA | 75,550 | 44,024 | 5963 | 84,114 |
| 2022 | American Express | USA | 64,000 | 43,663 | 8060 | 188,548 |
| 2022 | Abbott Laboratories | USA | 113,000 | 43,075 | 7071 | 75,196 |
| 2022 | StoneX Group | USA | 3242 | 42,534 | 116 | 18,840 |
| 2022 | Plains GP Holdings | USA | 4100 | 42,078 | 60 | 29,978 |
| 2022 | Enterprise Products Partners | USA | 6911 | 40,807 | 4638 | 67,526 |
| 2022 | TIAA | USA | 15,065 | 40,526 | 4061 | 698,191 |
| 2022 | Oracle | USA | 132,000 | 40,479 | 13,746 | 131,107 |
| 2022 | Thermo Fisher Scientific | USA | 129,000 | 39,211 | 7725 | 95,123 |
| 2022 | Coca-Cola | USA | 79,000 | 38,655 | 9771 | 94,354 |
| 2022 | General Dynamics | USA | 103,100 | 38,469 | 3257 | 50,073 |
| 2022 | CHS | USA | 9941 | 38,448 | 554 | 17,576 |
| 2022 | USAA | USA | 37,335 | 37,470 | 3300 | 210,677 |
| 2022 | Northwestern Mutual | USA | 7585 | 36,751 | 978 | 334,654 |
| 2022 | Nucor | USA | 28,800 | 36,484 | 6828 | 25,823 |
| 2022 | Exelon | USA | 31,518 | 36,347 | 1706 | 133,013 |
| 2022 | Massachusetts Mutual Life Insurance | USA | 10,052 | 35,900 | 319 | 383,292 |
| 2022 | Northrop Grumman | USA | 88,000 | 35,667 | 7005 | 42,579 |
| 2022 | 3M | USA | 95,000 | 35,355 | 5921 | 47,072 |
| 2022 | Travelers | USA | 30,492 | 34,816 | 3662 | 120,466 |
| 2022 | Arrow Electronics | USA | 20,700 | 34,477 | 1108 | 19,536 |
| 2022 | Honeywell International | USA | 99,000 | 34,392 | 5542 | 64,470 |
| 2022 | Dollar General | USA | 163,000 | 34,220 | 2399 | 26,327 |
| 2022 | Qualcomm | USA | 45,000 | 33,566 | 9043 | 41,240 |
| 2022 | CarMax | USA | 32,647 | 33,197 | 1151 | 26,338 |
| 2022 | Capital One Financial | USA | 50,767 | 32,033 | 12,390 | 432,381 |
| 2022 | TD Synnex | USA | 27,000 | 31,614 | 395 | 27,666 |
| 2022 | Philip Morris International | USA | 69,600 | 31,405 | 9109 | 41,290 |
| 2022 | World Fuel Services | USA | 4414 | 31,337 | 74 | 5942 |
| 2022 | Performance Food Group | USA | 22,885 | 30,399 | 41 | 7846 |
| 2022 | Delta Air Lines | USA | 83,000 | 29,899 | 280 | 72,459 |
| 2022 | American Airlines Group | USA | 123,400 | 29,882 | −1993 | 66,467 |
| 2022 | Netflix | USA | 11,300 | 29,698 | 5116 | 44,585 |
| 2022 | Paramount Global | USA | 25,115 | 29,579 | 4543 | 58,620 |
| 2022 | US Foods Holding | USA | 28,000 | 29,487 | 164 | 12,521 |
| 2022 | Danaher | USA | 79,000 | 29,453 | 6433 | 83,184 |
| 2022 | Jabil | USA | 238,000 | 29,285 | 696 | 16,654 |
| 2022 | Starbucks | USA | 383,000 | 29,061 | 4199 | 31,393 |
| 2022 | Mondelez International | USA | 79,000 | 28,720 | 4300 | 67,092 |
| 2021 | BHP Group | Australia | 31,589 | 42,931 | 7956 | 104,783 |
| 2021 | Woolworths Group | Australia | 215,000 | 42,678 | 781 | 26,503 |
| 2021 | Coles Group | Australia | 118,000 | 25,325 | 656 | 12,641 |
| 2021 | Commonwealth Bank of Australia | Australia | 43,585 | 24,362 | 6457 | 698,586 |
| 2021 | Anheuser-Busch InBev | Belgium | 163,695 | 47,358 | 1405 | 226,410 |
| 2021 | BP | UK | 68,100 | 183,500 | −20,305 | 267,654 |
| 2021 | Tesco | UK | 242,911 | 81,248 | 7948 | 63,984 |
| 2021 | HSBC Holdings | UK | 226,059 | 80,429 | 5229 | 2,984,164 |
| 2021 | Legal & General Group | UK | 10,099 | 63,325 | 2061 | 779,962 |
| 2021 | Aviva | UK | 28,930 | 62,579 | 3588 | 655,965 |
| 2021 | Unilever | UK | 148,949 | 57,797 | 6359 | 82,801 |
| 2021 | Prudential | UK | 18,687 | 55,973 | 2118 | 516,097 |
| 2021 | Vodafone Group | UK | 96,506 | 51,055 | 131 | 182,044 |
| 2021 | Rio Tinto Group | UK | 47,474 | 44,611 | 9769 | 97,390 |
| 2021 | GlaxoSmithKline | UK | 94,066 | 43,732 | 7373 | 109,949 |
| 2021 | Lloyds Banking Group | UK | 61,576 | 43,441 | 1690 | 1,191,025 |
| 2021 | J. Sainsbury | UK | 117,000 | 37,944 | −366 | 34,703 |
| 2021 | Barclays | UK | 83,000 | 35,405 | 3056 | 1,844,786 |
| 2021 | British American Tobacco | UK | 55,329 | 33,058 | 8208 | 188,222 |
| 2021 | Anglo American | UK | 64,000 | 30,902 | 2089 | 62,534 |
| 2021 | Phoenix Group Holdings | UK | 7653 | 28,493 | 1023 | 457,022 |
| 2021 | BT Group | UK | 99,700 | 27,863 | 1923 | 70,170 |
| 2021 | Linde | UK | 74,207 | 27,250 | 2501 | 88,229 |
| 2021 | Centrica | UK | 25,753 | 26,702 | 53 | 23,402 |
| 2021 | AstraZeneca | UK | 76,100 | 26,617 | 3196 | 66,729 |
| 2021 | Compass Group | UK | 548,143 | 25,413 | 170 | 19,030 |
| 2021 | BAE Systems | UK | 81,000 | 24,723 | 1666 | 37,634 |
| 2021 | Brookfield Asset Management | Canada | 151,000 | 62,752 | −134 | 343,696 |
| 2021 | Manulife Financial | Canada | 37,000 | 58,840 | 4378 | 691,283 |
| 2021 | Alimentation Couche-Tard | Canada | 131,000 | 54,132 | 2354 | 25,680 |
| 2021 | Power Corp. of Canada | Canada | 30,000 | 48,183 | 1526 | 493,996 |
| 2021 | Royal Bank of Canada | Canada | 83,842 | 45,509 | 8497 | 1,218,350 |
| 2021 | George Weston | Canada | 220,000 | 40,793 | 718 | 37,750 |
| 2021 | Toronto-Dominion Bank | Canada | 89,598 | 39,900 | 8841 | 1,286,834 |
| 2021 | Magna International | Canada | 158,000 | 32,647 | 757 | 28,605 |
| 2021 | Bank of Nova Scotia | Canada | 92,001 | 32,501 | 5038 | 852,307 |
| 2021 | Sun Life Financial | Canada | 23,816 | 32,316 | 1863 | 253,640 |
| 2021 | Enbridge | Canada | 12,100 | 29,147 | 2508 | 125,855 |
| 2021 | Bank of Montreal | Canada | 43,360 | 25,665 | 3788 | 711,910 |
| 2021 | Maersk Group | Denmark | 83,624 | 39,740 | 2850 | 56,117 |
| 2021 | Fortum | Finland | 19,933 | 55,850 | 2077 | 70,748 |
| 2021 | Nokia | Finland | 92,039 | 24,899 | −2875 | 44,291 |
| 2021 | AXA | France | 96,595 | 128,011 | 3605 | 984,656 |
| 2021 | TotalEnergies | France | 105,476 | 119,704 | −7242 | 266,132 |
| 2021 | Crédit Agricole | France | 73,817 | 82,959 | 3067 | 2,399,948 |
| 2021 | Carrefour | France | 322,164 | 82,211 | 730 | 58,238 |
| 2021 | BNP Paribas | France | 193,319 | 81,632 | 8053 | 3,045,415 |
| 2021 | Electricité de France | france | 161,203 | 78,904 | 741 | 374,349 |
| 2021 | Engie | France | 172,703 | 63,525 | −1750 | 187,464 |
| 2021 | Société Générale | France | 126,391 | 52,068 | −294 | 1,789,137 |
| 2021 | Christian Dior | France | 139,409 | 50,878 | 2203 | 129,744 |
| 2021 | Vinci | France | 217,731 | 50,270 | 1415 | 111,568 |
| 2021 | Renault | France | 170,158 | 49,536 | −9125 | 141,639 |
| 2021 | Orange | France | 142,150 | 48,165 | 5494 | 131,844 |
| 2021 | ELO Group | France | 160,606 | 47,607 | 773 | 28,282 |
| 2021 | Groupe BPCE | France | 98,790 | 43,476 | 1835 | 1,769,944 |
| 2021 | Saint-Gobain | France | 167,552 | 43,445 | 520 | 59,509 |
| 2021 | Sanofi | France | 99,412 | 42,580 | 14,031 | 140,161 |
| 2021 | Bouygues | France | 129,018 | 39,607 | 793 | 49,714 |
| 2021 | Finatis | France | 203,002 | 39,197 | −212 | 39,315 |
| 2021 | La Poste | France | 219,625 | 35,534 | 2375 | 927,802 |
| 2021 | SNCF Group | France | 271,509 | 34,155 | −3453 | 156,584 |
| 2021 | L’Oréal | France | 85,392 | 31,896 | 4060 | 53,366 |
| 2021 | CMA CGM | France | 90,792 | 31,445 | 1755 | 32,900 |
| 2021 | Veolia Environnement | France | 171,450 | 29,637 | 101 | 55,516 |
| 2021 | Schneider Electric | France | 126,328 | 28,667 | 2423 | 60,556 |
| 2021 | Financière de l’Odet | France | 79,207 | 27,470 | 244 | 68,531 |
| 2021 | Danone | France | 101,911 | 26,914 | 2229 | 52,349 |
| 2021 | Volkswagen | Germany | 662,575 | 253,965 | 10,104 | 608,368 |
| 2021 | Daimler | Germany | 288,481 | 175,827 | 4133 | 349,685 |
| 2021 | Allianz | Germany | 150,269 | 136,173 | 7756 | 1,297,243 |
| 2021 | Deutsche Telekom | Germany | 226,291 | 115,083 | 4738 | 324,205 |
| 2021 | BMW Group | Germany | 120,726 | 112,794 | 4301 | 265,146 |
| 2021 | Bosch Group | Germany | 395,034 | 81,464 | 360 | 111,817 |
| 2021 | Deutsche Post DHL Group | Germany | 526,896 | 76,122 | 3394 | 67,685 |
| 2021 | Munich Re Group | Germany | 39,642 | 74,075 | 1380 | 364,626 |
| 2021 | E.ON | Germany | 78,126 | 70,382 | 1159 | 116,732 |
| 2021 | BASF | Germany | 110,302 | 69,464 | −1208 | 98,261 |
| 2021 | Siemens | Germany | 293,000 | 63,936 | 4509 | 145,207 |
| 2021 | Bayer | Germany | 99,538 | 48,484 | −11,959 | 143,241 |
| 2021 | Talanx | Germany | 23,527 | 46,788 | 767 | 221,553 |
| 2021 | Deutsche Bahn | Germany | 322,768 | 45,465 | −6477 | 80,079 |
| 2021 | Edeka Zentrale | Germany | 402,000 | 44,159 | 315 | 10,567 |
| 2021 | Continental | Germany | 236,386 | 42,983 | −1096 | 48,509 |
| 2021 | Fresenius | Germany | 277,822 | 41,336 | 1945 | 81,561 |
| 2021 | ThyssenKrupp | Germany | 103,598 | 39,659 | 10,725 | 42,766 |
| 2021 | Deutsche Bank | Germany | 84,659 | 37,853 | 550 | 1,621,487 |
| 2021 | ZF Friedrichshafen | Germany | 153,522 | 37,159 | −940 | 44,950 |
| 2021 | Metro | Germany | 95,779 | 36,525 | 515 | 15,461 |
| 2021 | Heraeus Holding | Germany | 14,809 | 35,929 | 0 | 7055 |
| 2021 | DZ Bank | Germany | 28,061 | 35,498 | 994 | 727,638 |
| 2021 | Phoenix Pharma | Germany | 33,090 | 32,387 | 221 | 12,567 |
| 2021 | SAP | Germany | 102,430 | 31,150 | 5863 | 71,558 |
| 2021 | Siemens Energy | Germany | 92,000 | 30,723 | −1797 | 50,434 |
| 2021 | Boehringer Ingelheim | Germany | 51,944 | 26,497 | 3489 | 45,142 |
| 2021 | Accenture | Ireland | 506,000 | 44,327 | 5108 | 37,079 |
| 2021 | Medtronic | Ireland | 104,950 | 28,913 | 4789 | 90,689 |
| 2021 | CRH | Ireland | 77,100 | 27,587 | 1122 | 44,944 |
| 2021 | Assicurazioni Generali | Italy | 72,644 | 97,129 | 1987 | 666,616 |
| 2021 | Enel | Italy | 66,717 | 74,047 | 2974 | 200,034 |
| 2021 | ENI | Italy | 31,495 | 50,121 | −9839 | 134,187 |
| 2021 | Intesa Sanpaolo | Italy | 105,615 | 41,258 | 3734 | 1,226,999 |
| 2021 | Poste Italiane | Italy | 123,583 | 34,205 | 1375 | 333,311 |
| 2021 | UniCredit Group | Italy | 82,107 | 24,665 | −3173 | 1,139,916 |
| 2021 | Toyota Motor | Japan | 366,283 | 256,722 | 21,180 | 562,994 |
| 2021 | Honda Motor | Japan | 211,374 | 124,241 | 6202 | 198,201 |
| 2021 | Mitsubishi | Japan | 82,997 | 121,543 | 1628 | 168,490 |
| 2021 | Nippon Telegraph and Telephone | Japan | 324,667 | 112,670 | 8643 | 207,645 |
| 2021 | Japan Post Holdings | Japan | 243,612 | 110,561 | 3945 | 2,692,027 |
| 2021 | Itochu | Japan | 148,887 | 97,753 | 3787 | 101,071 |
| 2021 | Sony | Japan | 109,700 | 84,893 | 11,054 | 238,290 |
| 2021 | Hitachi | Japan | 350,864 | 82,345 | 4732 | 107,169 |
| 2021 | AEON | Japan | 282,073 | 81,228 | −671 | 107,765 |
| 2021 | Nippon Life Insurance | Japan | 95,352 | 76,984 | 3127 | 773,869 |
| 2021 | Mitsui | Japan | 44,509 | 75,562 | 3165 | 113,163 |
| 2021 | Nissan Motor | Japan | 139,507 | 74,170 | −4233 | 148,753 |
| 2021 | Dai-ichi Life Holdings | Japan | 64,823 | 73,842 | 3432 | 574,988 |
| 2021 | Panasonic | Japan | 243,540 | 63,191 | 1557 | 61,908 |
| 2021 | Marubeni | Japan | 49,265 | 59,735 | 2126 | 62,739 |
| 2021 | ENEOS Holdings | Japan | 40,753 | 59,540 | 1075 | 72,865 |
| 2021 | Toyota Tsusho | Japan | 64,402 | 59,517 | 1270 | 47,270 |
| 2021 | Mitsubishi UFJ Financial Group | Japan | 137,997 | 56,838 | 7330 | 3,250,213 |
| 2021 | SoftBank Group | Japan | 58,786 | 56,214 | 47,053 | 413,657 |
| 2021 | Tokyo Electric Power | Japan | 37,891 | 55,343 | 1706 | 109,341 |
| 2021 | Seven & I Holdings | Japan | 97,154 | 54,442 | 1692 | 65,204 |
| 2021 | Tokio Marine Holdings | Japan | 43,257 | 51,517 | 1526 | 232,960 |
| 2021 | KDDI | Japan | 47,320 | 50,115 | 6146 | 95,256 |
| 2021 | Denso | Japan | 168,391 | 46,569 | 1180 | 61,191 |
| 2021 | MS&AD Insurance Group Holdings | Japan | 41,501 | 46,150 | 1362 | 218,287 |
| 2021 | Nippon Steel Corporation | Japan | 115,632 | 45,556 | −306 | 68,481 |
| 2021 | Sumitomo | Japan | 74,920 | 43,818 | −1444 | 73,056 |
| 2021 | Mitsubishi Electric | Japan | 145,653 | 39,539 | 1822 | 43,381 |
| 2021 | Daiwa House Industry | Japan | 48,807 | 38,929 | 1840 | 45,688 |
| 2021 | Meiji Yasuda Life Insurance | Japan | 46,928 | 38,004 | 1780 | 415,713 |
| 2021 | Idemitsu Kosan | Japan | 16,560 | 37,792 | 329 | 35,755 |
| 2021 | Sumitomo Mitsui Financial Group | Japan | 86,781 | 36,811 | 4838 | 2,193,348 |
| 2021 | Sompo Holdings | Japan | 48,115 | 36,283 | 1344 | 118,614 |
| 2021 | Mitsubishi Heavy Industries | Japan | 79,974 | 34,903 | 383 | 43,497 |
| 2021 | Fujitsu | Japan | 126,371 | 33,863 | 1912 | 28,845 |
| 2021 | Aisin | Japan | 118,359 | 33,260 | 997 | 36,411 |
| 2021 | Sumitomo Life Insurance | Japan | 42,954 | 33,183 | 254 | 371,556 |
| 2021 | Mitsubishi Chemical Holdings | Japan | 69,607 | 30,729 | −71 | 47,805 |
| 2021 | JFE Holdings | Japan | 64,371 | 30,444 | −206 | 42,088 |
| 2021 | Mizuho Financial Group | Japan | 54,492 | 30,357 | 4443 | 2,039,658 |
| 2021 | Medipal Holdings | Japan | 14,614 | 30,291 | 226 | 15,189 |
| 2021 | Takeda Pharmaceutical | Japan | 47,099 | 30,166 | 3547 | 116,748 |
| 2021 | Suzuki Motor | Japan | 68,,739 | 29,981 | 1381 | 36,495 |
| 2021 | Canon | Japan | 181,897 | 29,599 | 780 | 44,813 |
| 2021 | Kansai Electric Power | Japan | 31,933 | 29,171 | 1028 | 73,018 |
| 2021 | Toshiba | Japan | 117,300 | 28,813 | 1075 | 31,651 |
| 2021 | NEC | Japan | 114,714 | 28,243 | 1411 | 33,170 |
| 2021 | Bridgestone | Japan | 138,036 | 28,047 | −218 | 40,586 |
| 2021 | Chubu Electric Power | Japan | 28,238 | 27,690 | 1389 | 51,414 |
| 2021 | Sumitomo Electric Industries | Japan | 286,784 | 27,532 | 532 | 30,578 |
| 2021 | Mazda Motor | Japan | 49,786 | 27,187 | −299 | 26,378 |
| 2021 | Subaru | Japan | 36,070 | 26,698 | 722 | 30,847 |
| 2021 | Alfresa Holdings | Japan | 12,045 | 24,556 | 231 | 11,905 |
| 2021 | ArcelorMittal | Luxembourg | 167,743 | 53,270 | −733 | 82,052 |
| 2021 | Royal Dutch Shell | The Netherlands | 87,000 | 183,195 | −21,680 | 379,268 |
| 2021 | EXOR Group | The Netherlands | 263,284 | 136,186 | −34 | 211,650 |
| 2021 | Royal Ahold Delhaize | The Netherlands | 249,000 | 85,158 | 1592 | 49,799 |
| 2021 | Aegon | The Netherlands | 22,322 | 58,211 | −166 | 543,140 |
| 2021 | Airbus | The Netherlands | 131,349 | 56,872 | −1291 | 134,734 |
| 2021 | Ingka Group | The Netherlands | 166,350 | 41,580 | 1323 | 62,381 |
| 2021 | Louis Dreyfus | The Netherlands | 15,708 | 33,564 | 382 | 23,253 |
| 2021 | ING Group | The Netherlands | 57,527 | 31,605 | 2564 | 1,142,896 |
| 2021 | LyondellBasell Industries | The Netherlands | 19,200 | 27,753 | 1420 | 35,403 |
| 2021 | X5 Retail Group | The Netherlands | 339,716 | 27,359 | 392 | 15,873 |
| 2021 | Achmea | The Netherlands | 13,921 | 26,843 | 732 | 114,615 |
| 2021 | Equinor | Norway | 21,245 | 45,818 | −5510 | 121,972 |
| 2021 | Trafigura Group | Singapore | 8619 | 146,994 | 1699 | 56,986 |
| 2021 | Wilmar International | Singapore | 100,000 | 50,527 | 1534 | 51,020 |
| 2021 | Olam International | Singapore | 60,425 | 26,068 | 178 | 20,206 |
| 2021 | Flex | Singapore | 167,201 | 24,124 | 613 | 15,836 |
| 2021 | Samsung Electronics | Republic of Korea | 267,937 | 200,734 | 22,116 | 347,992 |
| 2021 | Hyundai Motor | Republic of Korea | 122,814 | 88,156 | 1208 | 192,605 |
| 2021 | SK | Republic of Korea | 114,842 | 70,839 | 161 | 126,633 |
| 2021 | LG Electronics | Republic of Korea | 75,000 | 53,625 | 1669 | 44,350 |
| 2021 | Kia | Republic of Korea | 51,899 | 50,155 | 1261 | 55,654 |
| 2021 | Korea Electric Power | Republic of Korea | 48,519 | 49,102 | 1688 | 186,899 |
| 2021 | POSCO | Republic of Korea | 35,393 | 48,713 | 1340 | 73,312 |
| 2021 | Hanwha | Republic of Korea | 53,801 | 43,169 | 181 | 175,892 |
| 2021 | KB Financial Group | Republic of Korea | 26,948 | 33,201 | 2929 | 561,843 |
| 2021 | Hyundai Mobis | Republic of Korea | 35,087 | 31,047 | 1296 | 44,620 |
| 2021 | Samsung Life Insurance | Republic of Korea | 5273 | 29,274 | 1073 | 309,657 |
| 2021 | CJ Corp. | Republic of Korea | 62,756 | 27,125 | 74 | 36,825 |
| 2021 | SK Hynix | Republic of Korea | 36,854 | 27,041 | 4031 | 65,483 |
| 2021 | LG Chem | Republic of Korea | 40,234 | 26,645 | 435 | 38,079 |
| 2021 | Samsung C&T | Republic of Korea | 16,075 | 25,613 | 878 | 49,987 |
| 2021 | Banco Santander | Spain | 184,720 | 73,630 | −9994 | 1,845,796 |
| 2021 | Telefónica | Spain | 112,797 | 49,083 | 1803 | 128,561 |
| 2021 | ACS | Spain | 150,265 | 39,967 | 654 | 45,689 |
| 2021 | Iberdrola | Spain | 35,637 | 37,767 | 4115 | 149,938 |
| 2021 | Banco Bilbao Vizcaya Argentaria | Spain | 123,174 | 35,872 | 1487 | 900,932 |
| 2021 | Repsol | Spain | 23,203 | 32,188 | −3748 | 60,336 |
| 2021 | Mapfre Group | Spain | 33,730 | 24,642 | 600 | 84,629 |
| 2021 | Volvo | Sweden | 91,843 | 36,754 | 2098 | 62,266 |
| 2021 | Ericsson | Sweden | 101,129 | 25,237 | 1899 | 33,098 |
| 2021 | Glencore | Switzerland | 87,822 | 142,338 | −1903 | 118,000 |
| 2021 | Nestlé | Switzerland | 273,000 | 89,853 | 13,031 | 140,367 |
| 2021 | Roche Group | Switzerland | 101,465 | 64,285 | 15,229 | 97,485 |
| 2021 | Zurich Insurance Group | Switzerland | 52,930 | 59,001 | 3834 | 439,299 |
| 2021 | Novartis | Switzerland | 105,794 | 49,898 | 8072 | 132,059 |
| 2021 | Swiss Re | Switzerland | 13,189 | 43,338 | −878 | 182,622 |
| 2021 | UBS Group | Switzerland | 71,551 | 39,298 | 6557 | 1,125,765 |
| 2021 | Chubb | Switzerland | 31,000 | 35,994 | 3533 | 190,774 |
| 2021 | Credit Suisse Group | Switzerland | 48,770 | 32,343 | 2843 | 911,976 |
| 2021 | Migros Group | Switzerland | 85,226 | 31,903 | 1882 | 82,369 |
| 2021 | Coop Group | Switzerland | 78,578 | 31,058 | 574 | 23,366 |
| 2021 | ABB | Switzerland | 105,600 | 30,142 | 5146 | 41,088 |
| 2021 | Holcim | Switzerland | 67,409 | 24,654 | 1808 | 60,235 |
| 2021 | Walmart | USA | 2,300,000 | 559,151 | 13,510 | 252,496 |
| 2021 | Amazon | USA | 1,298,000 | 386,064 | 21,331 | 321,195 |
| 2021 | Apple | USA | 147,000 | 274,515 | 57,411 | 323,888 |
| 2021 | CVS Health | USA | 256,500 | 268,706 | 7179 | 230,715 |
| 2021 | UnitedHealth Group | USA | 330,000 | 257,141 | 15,403 | 197,289 |
| 2021 | Berkshire Hathaway | USA | 360,000 | 245,510 | 42,521 | 873,729 |
| 2021 | McKesson | USA | 67,500 | 238,228 | −4539 | 65,015 |
| 2021 | AmerisourceBergen | USA | 21,500 | 189,894 | −3409 | 44,275 |
| 2021 | Alphabet | USA | 135,301 | 182,527 | 40,269 | 319,616 |
| 2021 | Exxon Mobil | USA | 72,000 | 181,502 | −22,440 | 332,750 |
| 2021 | AT&T | USA | 230,760 | 171,760 | −5176 | 525,761 |
| 2021 | Costco Wholesale | USA | 214,500 | 166,761 | 4002 | 55,556 |
| 2021 | Cigna | USA | 72,963 | 160,401 | 8458 | 155,451 |
| 2021 | Cardinal Health | USA | 48,000 | 152,922 | −3696 | 40,766 |
| 2021 | Microsoft | USA | 163,000 | 143,015 | 44,281 | 301,311 |
| 2021 | Walgreens Boots Alliance | USA | 277,000 | 139,537 | 456 | 87,174 |
| 2021 | Kroger | USA | 465,000 | 132,498 | 2585 | 48,662 |
| 2021 | Home Depot | USA | 504,800 | 132,110 | 12,866 | 70,581 |
| 2021 | JPMorgan Chase | USA | 255,351 | 129,503 | 29,131 | 3,386,071 |
| 2021 | Verizon Communications | USA | 132,200 | 128,292 | 17,801 | 316,481 |
| 2021 | Ford Motor | USA | 186,000 | 127,144 | −1279 | 267,261 |
| 2021 | General Motors | USA | 155,000 | 122,485 | 6427 | 235,194 |
| 2021 | Anthem | USA | 83,400 | 121,867 | 4572 | 86,615 |
| 2021 | Centene | USA | 71,300 | 111,115 | 1808 | 68,719 |
| 2021 | Fannie Mae | USA | 7700 | 106,437 | 11,805 | 3,985,749 |
| 2021 | Comcast | USA | 168,000 | 103,564 | 10,534 | 273,869 |
| 2021 | Chevron | USA | 47,736 | 94,692 | −5543 | 239,790 |
| 2021 | Dell Technologies | USA | 158,000 | 94,224 | 3250 | 123,415 |
| 2021 | Bank of America | USA | 212,505 | 93,753 | 17,894 | 2,819,627 |
| 2021 | Target | USA | 409,000 | 93,561 | 4368 | 51,248 |
| 2021 | Lowe’s | USA | 280,000 | 89,597 | 5835 | 46,735 |
| 2021 | Marathon Petroleum | USA | 57,900 | 88,952 | −9826 | 85,158 |
| 2021 | Citigroup | USA | 210,153 | 88,839 | 11,047 | 2,260,090 |
| 2021 | USA | 58,604 | 85,965 | 29,146 | 159,316 | |
| 2021 | United Parcel Service | USA | 408,255 | 84,628 | 1343 | 62,408 |
| 2021 | Johnson & Johnson | USA | 134,500 | 82,584 | 14,714 | 174,894 |
| 2021 | Wells Fargo | USA | 268,531 | 80,303 | 3301 | 1,955,163 |
| 2021 | General Electric | USA | 184,000 | 79,619 | 5704 | 253,452 |
| 2021 | State Farm Insurance | USA | 57,582 | 78,898 | 3739 | 299,105 |
| 2021 | Intel | USA | 110,600 | 77,867 | 20,899 | 153,091 |
| 2021 | Humana | USA | 48,700 | 77,155 | 3367 | 34,969 |
| 2021 | International Business Machines | USA | 364,800 | 73,620 | 5590 | 155,971 |
| 2021 | U.S. Postal Service | USA | 569,987 | 73,133 | −9176 | 35,904 |
| 2021 | Procter & Gamble | USA | 99,000 | 70,950 | 13,027 | 120,700 |
| 2021 | PepsiCo | USA | 291,000 | 70,372 | 7120 | 92,918 |
| 2021 | Albertsons | USA | 300,000 | 69,690 | 850 | 26,598 |
| 2021 | FedEx | USA | 499,718 | 69,217 | 1286 | 73,537 |
| 2021 | MetLife | USA | 46,500 | 67,842 | 5407 | 795,146 |
| 2021 | Freddie Mac | USA | 6922 | 66,228 | 7326 | 2,627,415 |
| 2021 | Phillips 66 | USA | 14,300 | 65,494 | −3975 | 54,721 |
| 2021 | Lockheed Martin | USA | 114,000 | 65,398 | 6833 | 50,710 |
| 2021 | Walt Disney | USA | 203,000 | 65,388 | −2864 | 201,549 |
| 2021 | Archer Daniels Midland | USA | 38,332 | 64,355 | 1772 | 49,719 |
| 2021 | Valero Energy | USA | 9964 | 60,115 | −1421 | 51,774 |
| 2021 | Boeing | USA | 141,000 | 58,158 | −11,873 | 152,136 |
| 2021 | Prudential Financial | USA | 41,671 | 57,033 | −374 | 940,722 |
| 2021 | HP | USA | 53,000 | 56,639 | 2844 | 34,681 |
| 2021 | Raytheon Technologies | USA | 181,000 | 56,587 | −3519 | 162,153 |
| 2021 | StoneX Group | USA | 29,50 | 54,140 | 170 | 13,475 |
| 2021 | Goldman Sachs Group | USA | 40,500 | 53,498 | 9459 | 1,163,028 |
| 2021 | Sysco | USA | 57,000 | 52,893 | 216 | 22,628 |
| 2021 | Morgan Stanley | USA | 68,097 | 52,047 | 10,996 | 1,115,862 |
| 2021 | HCA Healthcare | USA | 235,000 | 51,533 | 3754 | 47,490 |
| 2021 | Cisco Systems | USA | 77,500 | 49,301 | 11,214 | 94,853 |
| 2021 | Charter Communications | USA | 96,100 | 48,097 | 3222 | 144,206 |
| 2021 | Merck | USA | 73,500 | 47,994 | 7067 | 91,588 |
| 2021 | Best Buy | USA | 81,600 | 47,262 | 1798 | 19,067 |
| 2021 | New York Life Insurance | USA | 11,506 | 46,712 | −822 | 359,313 |
| 2021 | AbbVie | USA | 47,000 | 45,804 | 4616 | 150,565 |
| 2021 | Publix Super Markets | USA | 227,000 | 45,204 | 3972 | 28,094 |
| 2021 | Allstate | USA | 42,010 | 44,791 | 5576 | 125,987 |
| 2021 | Liberty Mutual Insurance Group | USA | 45,000 | 43,796 | 758 | 145,377 |
| 2021 | American International Group | USA | 45,000 | 43,736 | −5944 | 586,481 |
| 2021 | Tyson Foods | USA | 139,000 | 43,185 | 2061 | 34,456 |
| 2021 | Progressive | USA | 43,326 | 42,658 | 5705 | 64,098 |
| 2021 | Bristol-Myers Squibb | USA | 30,250 | 42,518 | −9015 | 118,481 |
| 2021 | Nationwide | USA | 25,391 | 41,930 | −138 | 256,589 |
| 2021 | Pfizer | USA | 78,500 | 41,908 | 9616 | 154,229 |
| 2021 | Caterpillar | USA | 97,300 | 41,748 | 2998 | 78,324 |
| 2021 | TIAA | USA | 14,953 | 41,619 | 558 | 654,252 |
| 2021 | Bunge | USA | 23,000 | 41,404 | 1145 | 23,655 |
| 2021 | Oracle | USA | 135,000 | 39,068 | 10,135 | 115,438 |
| 2021 | Energy Transfer | USA | 11,421 | 38,954 | −648 | 95,144 |
| 2021 | Dow | USA | 35,700 | 38,542 | 1225 | 61,470 |
| 2021 | American Express | USA | 63,700 | 38,185 | 3135 | 191,367 |
| 2021 | General Dynamics | USA | 100,700 | 37,925 | 3167 | 51,308 |
| 2021 | Nike | USA | 75,400 | 37,403 | 2539 | 31,342 |
| 2021 | Northrop Grumman | USA | 97,000 | 36,799 | 3189 | 44,469 |
| 2021 | USAA | USA | 35,935 | 36,296 | 3907 | 200,348 |
| 2021 | Deere | USA | 69,634 | 35,540 | 2751 | 75,091 |
| 2021 | Abbott Laboratories | USA | 109,000 | 34,608 | 4495 | 72,548 |
| 2021 | Northwestern Mutual | USA | 6641 | 33,782 | 425 | 308,767 |
| 2021 | Dollar General | USA | 158,000 | 33,747 | 2655 | 25,863 |
| 2021 | Exelon | USA | 32,340 | 33,039 | 1963 | 129,317 |
| 2021 | Coca-Cola | USA | 80,300 | 33,014 | 7747 | 87,296 |
| 2021 | Honeywell International | USA | 103,000 | 32,637 | 4779 | 64,586 |
| 2021 | Thermo Fisher Scientific | USA | 84,362 | 32,218 | 6375 | 69,052 |
| 2021 | 3M | USA | 94,987 | 32,184 | 5384 | 47,344 |
| 2021 | TJX | USA | 320,000 | 32,137 | 91 | 30,814 |
| 2021 | Travelers | USA | 30,294 | 31,981 | 2697 | 116,764 |
| 2021 | Capital One Financial | USA | 51,985 | 31,643 | 2714 | 421,602 |
| 2021 | Tesla | USA | 70,757 | 31,536 | 721 | 52,148 |
| 2021 | Philip Morris International | USA | 71,000 | 28,694 | 8056 | 44,815 |
| 2021 | Arrow Electronics | USA | 19,600 | 28,673 | 584 | 17,054 |
| 2021 | CHS | USA | 10,493 | 28,406 | 422 | 15,994 |
| 2021 | Jabil | USA | 240,000 | 27,266 | 54 | 14,397 |
| 2021 | Enterprise Products Partners | USA | 7130 | 27,200 | 3776 | 64,107 |
| 2021 | Hewlett Packard Enterprise | USA | 59,400 | 26,982 | −322 | 54,015 |
| 2021 | United Natural Foods | USA | 28,300 | 26,743 | −274 | 7587 |
| 2021 | Mondelez International | USA | 79,000 | 26,581 | 3555 | 67,810 |
| 2021 | ViacomCBS | USA | 24,225 | 26,186 | 2422 | 52,663 |
| 2021 | Kraft Heinz | USA | 38,000 | 26,185 | 356 | 99,830 |
| 2021 | Dollar Tree | USA | 129,772 | 25,509 | 1342 | 20,696 |
| 2021 | Amgen | USA | 24,300 | 25,424 | 7264 | 62,948 |
| 2021 | U.S. Bancorp | USA | 68,108 | 25,241 | 4959 | 553,905 |
| 2021 | Performance Food Group | USA | 20,000 | 25,086 | −114 | 7720 |
| 2021 | Netflix | USA | 9400 | 24,996 | 2761 | 39,280 |
| 2021 | Gilead Sciences | USA | 13,600 | 24,689 | 123 | 68,407 |
| 2021 | Synnex | USA | 277,900 | 24,676 | 529 | 13,469 |
| 2021 | Eli Lilly | USA | 35,000 | 24,540 | 6194 | 46,633 |
| 2021 | Truist Financial | USA | 53,638 | 24,427 | 4482 | 509,228 |
| 2021 | Rite Aid | USA | 50,000 | 24,043 | −91 | 9335 |
Source: Compiled by the authors as a result of the systematization of Fortune (2024) materials.
Table A2.
Statistics for developing countries.
Table A2.
Statistics for developing countries.
| Year | Company Name | Country | Number of Employees | Revenues ($Millions) | Profits ($Millions) | Assets ($Millions) |
|---|---|---|---|---|---|---|
| 2023 | JBS | Brazil | 260,000 | 72,626 | 2995 | 39,370 |
| 2023 | Itaú Unibanco Holding | Brazil | 101,094 | 63,884 | 5755 | 439,546 |
| 2023 | Banco do Brasil | Brazil | 85,953 | 55,870 | 5353 | 379,820 |
| 2023 | Banco Bradesco | Brazil | 81,222 | 51,587 | 4066 | 340,449 |
| 2023 | Raízen | Brazil | 44,738 | 47,721 | 474 | 22,001 |
| 2023 | Vale | Brazil | 64,516 | 44,287 | 18,788 | 86,894 |
| 2023 | Caixa Econômica Federal | Brazil | 86,959 | 37,066 | 1894 | 300,664 |
| 2023 | Vibra Energia | Brazil | 3364 | 35,155 | 298 | 7777 |
| 2023 | State Grid | China | 870,287 | 530,009 | 8192 | 710,763 |
| 2023 | China National Petroleum | China | 1,087,049 | 483,019 | 21,080 | 637,223 |
| 2023 | Sinopec Group | China | 527,487 | 471,154 | 9657 | 368,751 |
| 2023 | China State Construction Engineering | China | 382,492 | 305,885 | 4234 | 386,249 |
| 2023 | Pacific Construction Group | China | 301,565 | 79,478 | 5188 | 55,154 |
| 2023 | Bank of Communications | China | 91,823 | 78,213 | 13,699 | 1,883,724 |
| 2023 | Jinneng Holding Group | China | 470,839 | 77,761 | 359 | 160,235 |
| 2023 | Guangzhou Automobile Industry Group | China | 119,425 | 77,345 | 623 | 57,256 |
| 2023 | Aluminum Corp. of China | China | 130,416 | 76,946 | 1698 | 90,619 |
| 2023 | Shaanxi Coal & Chemical Industry | China | 138,047 | 75,871 | 1386 | 104,788 |
| 2023 | Jiangxi Copper | China | 33,248 | 74,927 | 464 | 30,396 |
| 2023 | Shandong Weiqiao Pioneering Group | China | 98,100 | 74,923 | 931 | 37,309 |
| 2023 | China Vanke | China | 131,817 | 74,901 | 3362 | 254,765 |
| 2023 | China Merchants Group | China | 276,019 | 73,283 | 8474 | 381,608 |
| 2023 | China Merchants Bank | China | 112,999 | 72,317 | 20,517 | 1,470,004 |
| 2023 | Dongfeng Motor | China | 134,637 | 68,416 | 1211 | 73,288 |
| 2023 | China Poly Group | China | 118,007 | 67,696 | 1288 | 265,106 |
| 2023 | China Pacific Insurance (Group) | China | 104,502 | 67,696 | 3658 | 315,534 |
| 2023 | Beijing Automotive Group | China | 95,000 | 67,282 | 296 | 68,342 |
| 2023 | Greenland Holding Group | China | 70,177 | 64,802 | 150 | 197,953 |
| 2023 | Country Garden Holdings | China | 69,932 | 63,979 | −900 | 252,924 |
| 2023 | China Huaneng Group | China | 124,588 | 63,284 | 1125 | 205,184 |
| 2023 | BYD | China | 570,060 | 63,041 | 2471 | 71,603 |
| 2023 | Lenovo Group | China | 77,000 | 61,947 | 1608 | 38,920 |
| 2023 | Shenghong Holding Group | China | 39,059 | 61,251 | 428 | 29,893 |
| 2023 | Industrial Bank | China | 69,840 | 60,962 | 13,584 | 1,343,541 |
| 2023 | Zhejiang Geely Holding Group | China | 131,517 | 60,396 | 945 | 81,291 |
| 2023 | HBIS Group | China | 99,807 | 59,563 | 50 | 78,229 |
| 2023 | Zhejiang Hengyi Group | China | 21,261 | 57,332 | −153 | 19,554 |
| 2023 | China National Building Material Group | China | 208,857 | 56,514 | 629 | 101,920 |
| 2023 | China Electronics Technology Group | China | 235,912 | 55,848 | 2665 | 86,146 |
| 2023 | China Energy Engineering Group | China | 116,263 | 54,890 | 545 | 98,548 |
| 2023 | Tsingshan Holding Group | China | 100,982 | 54,711 | 1457 | 20,139 |
| 2023 | Shanghai Pudong Development Bank | China | 64,731 | 54,028 | 7607 | 1,262,056 |
| 2023 | State Power Investment | China | 123,401 | 54,022 | 744 | 229,339 |
| 2023 | China United Network Communications | China | 244,508 | 52,766 | 1085 | 93,471 |
| 2023 | Shaanxi Yanchang Petroleum (Group) | China | 129,525 | 52,224 | 870 | 70,896 |
| 2023 | China State Shipbuilding | China | 204,497 | 51,799 | 2710 | 136,965 |
| 2023 | Midea Group | China | 166,243 | 51,393 | 4393 | 61,265 |
| 2023 | Sinomach | China | 125,370 | 51,126 | −409 | 51,583 |
| 2023 | Ansteel Group | China | 163,992 | 50,041 | 608 | 69,740 |
| 2023 | Jinchuan Group | China | 28,930 | 49,467 | 1113 | 20,862 |
| 2023 | Contemporary Amperex Technology | China | 118,914 | 48,849 | 4568 | 87,130 |
| 2023 | Zhejiang Communications Investment Group | China | 41,757 | 46,617 | 859 | 121,861 |
| 2023 | Susun Construction Group | China | 151,135 | 46,138 | 1357 | 32,994 |
| 2023 | Jingye Group | China | 31,000 | 45,705 | 329 | 12,587 |
| 2023 | China Huadian | China | 92,857 | 45,113 | 1021 | 148,926 |
| 2023 | China Minsheng Banking | China | 62,615 | 44,582 | 5243 | 1,051,974 |
| 2023 | China South Industries Group | China | 156,613 | 43,429 | 1015 | 59,633 |
| 2023 | Jiangsu Shagang Group | China | 45,203 | 42,784 | 558 | 49,903 |
| 2023 | Shanghai Construction Group | China | 51,353 | 42,522 | 202 | 53,182 |
| 2023 | China National Coal Group | China | 147,293 | 41,997 | 1877 | 70,504 |
| 2023 | Shanxi Coking Coal Group | China | 214,769 | 41,662 | 355 | 75,193 |
| 2023 | Xiaomi | China | 32,543 | 41,631 | 368 | 39,655 |
| 2023 | New Hope Holding Group | China | 123,933 | 41,426 | 8 | 49,488 |
| 2023 | China Electronics | China | 184,940 | 40,326 | −501 | 61,129 |
| 2023 | Zijin Mining Group | China | 48,836 | 40,187 | 2979 | 44,372 |
| 2023 | S.F. Holding | China | 162,823 | 39,765 | 918 | 31,439 |
| 2023 | Guangzhou Municipal Construction Group | China | 44,825 | 39,258 | 150 | 28,664 |
| 2023 | China National Nuclear | China | 181,700 | 39,054 | 1281 | 166,795 |
| 2023 | China Taiping Insurance Group | China | 68,386 | 38,706 | 116 | 182,634 |
| 2023 | Shudao Investment Group | China | 48,713 | 38,019 | 646 | 172,256 |
| 2023 | Shenzhen Investment Holdings | China | 103,117 | 37,888 | 907 | 153,290 |
| 2023 | Jardine Matheson | China | 425,000 | 37,724 | 354 | 89,148 |
| 2023 | China Datang | China | 89,210 | 37,606 | 182 | 123,159 |
| 2023 | China Aerospace Science & Industry | China | 141,260 | 37,371 | 2167 | 75,170 |
| 2023 | Longfor Group Holdings | China | 31,565 | 37,249 | 3622 | 114,072 |
| 2023 | Shougang Group | China | 91,165 | 36,853 | 189 | 75,225 |
| 2023 | Hangzhou Iron and Steel Group | China | 11,771 | 36,818 | 246 | 11,939 |
| 2023 | Xinjiang Zhongtai Group | China | 42,193 | 36,762 | 112 | 21,604 |
| 2023 | Guangzhou Industrial Investment Holdings | China | 88,022 | 36,589 | 234 | 42,301 |
| 2023 | Haier Smart Home | China | 109,586 | 36,201 | 2187 | 34,194 |
| 2023 | Guangzhou Pharmaceutical Holdings | China | 35,057 | 35,383 | 311 | 11,489 |
| 2023 | Guangdong Guangxin Holdings | China | 40,613 | 35,368 | 356 | 18,453 |
| 2023 | Shaanxi Construction Engineering Holding | China | 36,715 | 34,735 | 391 | 56,144 |
| 2023 | Shanghai Delong Steel Group | China | 46,403 | 33,534 | 253 | 21,003 |
| 2023 | CK Hutchison Holdings | China | 300,000 | 33,523 | 4684 | 147,143 |
| 2023 | Anhui Conch Group | China | 61,637 | 32,991 | 871 | 43,732 |
| 2023 | Beijing Jianlong Heavy Industry Group | China | 56,300 | 32,878 | 229 | 25,337 |
| 2023 | Hunan Iron & Steel Group | China | 35,492 | 32,723 | 1176 | 22,772 |
| 2023 | Meituan | China | 91,932 | 32,699 | −994 | 35,446 |
| 2023 | Lu’an Chemical Group | China | 109,599 | 32,596 | 88 | 49,859 |
| 2023 | Tongwei Group | China | 42,381 | 31,944 | 1637 | 23,181 |
| 2023 | New China Life Insurance | China | 32,564 | 31,861 | 1460 | 181,964 |
| 2023 | Luxshare Precision Industry | China | 236,932 | 31,817 | 1362 | 21,514 |
| 2023 | China National Aviation Fuel Group | China | 13,796 | 31,650 | 411 | 10,472 |
| 2023 | Chengdu Xingcheng Investment Group | China | 39,094 | 31,304 | 186 | 157,644 |
| 2023 | Guangxi Investment Group | China | 33,856 | 31,263 | 84 | 108,649 |
| 2023 | Xinjiang Guanghui Industry Investment | China | 74,069 | 30,922 | 159 | 37,332 |
| 2023 | Ecopetrol | Colombia | 18,903 | 37,547 | 7435 | 62,548 |
| 2023 | Oil & Natural Gas | India | 37,047 | 78,746 | 4414 | 74,851 |
| 2023 | Bharat Petroleum | India | 9193 | 59,114 | 265 | 22,912 |
| 2023 | State Bank of India | India | 235,858 | 58,951 | 6930 | 725,264 |
| 2023 | Tata Motors | India | 81,811 | 43,661 | 301 | 40,936 |
| 2023 | Rajesh Exports | India | 135 | 42,306 | 178 | 2786 |
| 2023 | America Movil | Mexico | 176,014 | 42,724 | 3788 | 83,055 |
| 2023 | Fomento Económico Mexicano | Mexico | 354,309 | 33,482 | 1189 | 41,002 |
| 2023 | Sberbank | Russia | 210,661 | 55,877 | 3959 | 564,401 |
| 2023 | Magnit | Russia | 361,000 | 33,849 | 402 | 18,817 |
| 2023 | Saudi Aramco | Saudi Arabia | 70,496 | 603,651 | 159,069 | 663,541 |
| 2023 | Koç Holding | Turkey | 114,677 | 54,467 | 4216 | 84,577 |
| 2022 | Petrobras | Brazil | 45,532 | 83,966 | 19,875 | 174,348 |
| 2022 | JBS | Brazil | 250,000 | 65,036 | 3799 | 37,181 |
| 2022 | Vale | Brazil | 72,266 | 55,585 | 22,445 | 89,442 |
| 2022 | Itaú Unibanco Holding | Brazil | 99,598 | 41,175 | 4963 | 371,471 |
| 2022 | Raízen | Brazil | 30,359 | 35,858 | 590 | 21,234 |
| 2022 | Banco Bradesco | Brazil | 79,507 | 32,556 | 4297 | 300,805 |
| 2022 | Banco do Brasil | Brazil | 84,597 | 30,602 | 3402 | 340,976 |
| 2022 | State Grid | China | 871,145 | 460,617 | 7138 | 735,430 |
| 2022 | China National Petroleum | China | 1,090,345 | 411,693 | 9638 | 660,008 |
| 2022 | Sinopec Group | China | 542,286 | 401,314 | 8316 | 380,675 |
| 2022 | China State Construction Engineering | China | 368,327 | 293,712 | 4444 | 378,352 |
| 2022 | Industrial & Commercial Bank of China | China | 434,089 | 209,000 | 54,003 | 5,536,969 |
| 2022 | China Construction Bank | China | 375,531 | 200,434 | 46,899 | 4,762,831 |
| 2022 | Ping An Insurance | China | 355,982 | 199,629 | 15,754 | 1,596,641 |
| 2022 | Agricultural Bank of China | China | 455,174 | 181,412 | 37,391 | 4,576,306 |
| 2022 | Sinochem Holdings | China | 220,760 | 172,260 | −198 | 241,750 |
| 2022 | China Railway Engineering Group | China | 310,817 | 166,452 | 1853 | 215,913 |
| 2022 | China Railway Construction | China | 366,833 | 158,203 | 1704 | 213,452 |
| 2022 | China Life Insurance | China | 182,646 | 157,095 | 3087 | 903,090 |
| 2022 | Bank of China | China | 306,322 | 152,409 | 33,573 | 4,206,862 |
| 2022 | China Baowu Steel Group | China | 230,884 | 150,730 | 2995 | 175,861 |
| 2022 | JD.com | China | 385,357 | 147,526 | −552 | 78,164 |
| 2022 | Alibaba Group Holding | China | 254,941 | 132,936 | 9701 | 267,467 |
| 2022 | China Mobile Communications | China | 451,331 | 131,913 | 14,629 | 337,923 |
| 2022 | China Minmetals | China | 193,965 | 131,800 | 617 | 158,044 |
| 2022 | China Communications Construction | China | 220,519 | 130,664 | 1397 | 353,172 |
| 2022 | China National Offshore Oil | China | 80,957 | 126,920 | 9183 | 209,375 |
| 2022 | SAIC Motor | China | 146,145 | 120,900 | 3803 | 144,350 |
| 2022 | Shandong Energy Group | China | 243,124 | 120,012 | 174 | 118,292 |
| 2022 | China Resources | China | 362,706 | 119,601 | 4544 | 318,180 |
| 2022 | Hengli Group | China | 121,430 | 113,536 | 2375 | 48,073 |
| 2022 | Amer International Group | China | 22,398 | 112,049 | 2011 | 33,633 |
| 2022 | Xiamen C&D | China | 36,334 | 111,557 | 1114 | 103,720 |
| 2022 | China FAW Group | China | 118,648 | 109,405 | 3600 | 94,471 |
| 2022 | Sinopharm | China | 201,092 | 108,779 | 12,165 | 88,793 |
| 2022 | China Post Group | China | 748,920 | 108,669 | 5983 | 2,073,125 |
| 2022 | China Energy Investment | China | 317,168 | 107,095 | 5452 | 298,736 |
| 2022 | China Southern Power Grid | China | 282,006 | 104,119 | 1304 | 170,374 |
| 2022 | COFCO | China | 107,829 | 103,087 | 1498 | 107,998 |
| 2022 | Huawei Investment & Holding | China | 195,000 | 98,725 | 17,623 | 154,747 |
| 2022 | PowerChina | China | 181,330 | 96,422 | 679 | 180,336 |
| 2022 | CITIC Group | China | 148,108 | 96,126 | 4891 | 1,386,893 |
| 2022 | Xiamen ITG Holding Group | China | 28,977 | 93,791 | 383 | 38,713 |
| 2022 | People’s Insurance Co. of China | China | 184,364 | 92,182 | 3329 | 216,756 |
| 2022 | Wuchan Zhongda Group | China | 21,012 | 87,211 | 618 | 20,379 |
| 2022 | Tencent Holdings | China | 112,771 | 86,836 | 34,854 | 253,832 |
| 2022 | Dongfeng Motor | China | 141,681 | 86,122 | 1441 | 86,798 |
| 2022 | Greenland Holding Group | China | 79,999 | 84,454 | 958 | 231,278 |
| 2022 | COSCO Shipping | China | 107,551 | 84,130 | 6421 | 153,674 |
| 2022 | China Telecommunications | China | 394,600 | 83,596 | 1935 | 155,818 |
| 2022 | China North Industries Group | China | 213,957 | 81,785 | 1742 | 76,538 |
| 2022 | Country Garden Holdings | China | 100,705 | 81,091 | 4154 | 306,728 |
| 2022 | Aluminum Corp. of China | China | 138,717 | 80,407 | 1399 | 98,305 |
| 2022 | Aviation Industry Corp. of China | China | 380,000 | 79,332 | 855 | 194,947 |
| 2022 | Pacific Construction Group | China | 310,719 | 77,073 | 5594 | 52,675 |
| 2022 | China Merchants Group | China | 264,161 | 76,767 | 8526 | 394,950 |
| 2022 | Bank of Communications | China | 90,238 | 75,986 | 13,578 | 1,836,520 |
| 2022 | XMXYG | China | 14,372 | 75,094 | 410 | 33,035 |
| 2022 | Beijing Automotive Group | China | 100,000 | 74,687 | 318 | 78,756 |
| 2022 | Jinneng Holding Group | China | 506,364 | 74,588 | −341 | 167,062 |
| 2022 | Lenovo Group | China | 75,000 | 71,618 | 2030 | 44,510 |
| 2022 | China Merchants Bank | China | 103,669 | 71,064 | 18,592 | 1,456,057 |
| 2022 | Jiangxi Copper | China | 31,654 | 70,914 | 465 | 31,144 |
| 2022 | China Vanke | China | 139,494 | 70,198 | 3492 | 305,205 |
| 2022 | Zhejiang Rongsheng Holding Group | China | 22,750 | 69,503 | 1171 | 57,389 |
| 2022 | China Poly Group | China | 110,785 | 69,007 | 2035 | 273,950 |
| 2022 | China Pacific Insurance (Group) | China | 107,000 | 68,313 | 4160 | 306,381 |
| 2022 | Guangzhou Automobile Industry Group | China | 112,113 | 66,955 | 607 | 57,355 |
| 2022 | HBIS Group | China | 116,572 | 66,150 | 220 | 80,062 |
| 2022 | China National Building Material Group | China | 206,910 | 64,417 | 604 | 102,682 |
| 2022 | Shandong Weiqiao Pioneering Group | China | 96,782 | 63,739 | 1758 | 40,151 |
| 2022 | Industrial Bank | China | 62,537 | 61,331 | 12,818 | 1,354,359 |
| 2022 | Shaanxi Coal & Chemical Industry | China | 130,914 | 61,299 | 597 | 104,161 |
| 2022 | China Everbright Group | China | 95,000 | 61,194 | 3708 | 1,027,704 |
| 2022 | China Huaneng Group | China | 125,365 | 60,049 | 682 | 210,935 |
| 2022 | Ansteel Group | China | 173,597 | 59,448 | 1141 | 77,451 |
| 2022 | Sinomach | China | 132,147 | 57,446 | 458 | 57,369 |
| 2022 | Shanghai Pudong Development Bank | China | 63,361 | 56,795 | 8217 | 1,280,955 |
| 2022 | Zhejiang Geely Holding Group | China | 128,928 | 55,860 | 1471 | 81,584 |
| 2022 | China Electronics Technology Group | China | 202,561 | 55,457 | 2152 | 85,806 |
| 2022 | Tsingshan Holding Group | China | 85,553 | 54,574 | 2386 | 18,129 |
| 2022 | Shenghong Holding Group | China | 35,788 | 53,948 | 941 | 27,223 |
| 2022 | China State Shipbuilding | China | 213,849 | 53,671 | 2611 | 139,158 |
| 2022 | Midea Group | China | 165,799 | 53,232 | 4430 | 61,074 |
| 2022 | Shaanxi Yanchang Petroleum (Group) | China | 129,018 | 51,813 | 546 | 73,318 |
| 2022 | State Power Investment | China | 121,470 | 51,518 | −185 | 234,744 |
| 2022 | Zhejiang Hengyi Group | China | 23,222 | 50,974 | 178 | 20,085 |
| 2022 | Xiaomi | China | 33,427 | 50,898 | 2998 | 46,110 |
| 2022 | China United Network Communications | China | 242,661 | 50,828 | 978 | 93,400 |
| 2022 | China Energy Engineering Group | China | 119,574 | 50,345 | 600 | 85,423 |
| 2022 | China Minsheng Banking | China | 60,232 | 50,079 | 5330 | 1,094,565 |
| 2022 | AIA Group | China | 23,981 | 47,525 | 7427 | 339,874 |
| 2022 | Jiangsu Shagang Group | China | 45,398 | 47,072 | 2274 | 51,137 |
| 2022 | China National Coal Group | China | 149,898 | 46,665 | 691 | 69,829 |
| 2022 | Susun Construction Group | China | 153,242 | 46,478 | 1654 | 34,469 |
| 2022 | Zhejiang Communications Investment Group | China | 40,776 | 46,382 | 897 | 117,353 |
| 2022 | China South Industries Group | China | 162,498 | 44,374 | 737 | 61,762 |
| 2022 | Shanghai Construction Group | China | 51,369 | 43,572 | 584 | 55,693 |
| 2022 | China Aerospace Science & Technology | China | 180,521 | 43,420 | 3099 | 95,825 |
| 2022 | China Electronics | China | 191,126 | 43,118 | −158 | 62,094 |
| 2022 | China Huadian | China | 92,217 | 42,855 | 374 | 149,250 |
| 2022 | Shougang Group | China | 96,432 | 42,090 | 211 | 81,636 |
| 2022 | Shandong Iron & Steel Group | China | 34,171 | 41,319 | 852 | 41,173 |
| 2022 | China Taiping Insurance Group | China | 68,441 | 41,091 | 473 | 177,684 |
| 2022 | Hangzhou Iron and Steel Group | China | 11,179 | 41,009 | 350 | 14,133 |
| 2022 | Jinchuan Group | China | 29,100 | 40,958 | 965 | 19,009 |
| 2022 | China Aerospace Science & Industry | China | 141,678 | 40,856 | 2108 | 79,845 |
| 2022 | Taikang Insurance Group | China | 58,853 | 40,608 | 3826 | 209,345 |
| 2022 | Anhui Conch Group | China | 59,739 | 39,700 | 1922 | 44,445 |
| 2022 | New Hope Holding Group | China | 130,887 | 39,169 | 336 | 58,947 |
| 2022 | Guangzhou Municipal Construction Group | China | 43,052 | 38,624 | 145 | 28,163 |
| 2022 | Beijing Jianlong Heavy Industry Group | China | 57,568 | 38,357 | 557 | 26,450 |
| 2022 | China National Nuclear | China | 181,100 | 38,328 | 1186 | 161,377 |
| 2022 | Shenzhen Investment Holdings | China | 86,030 | 37,599 | 1649 | 147,160 |
| 2022 | CRRC Group | China | 172,869 | 36,964 | 889 | 75,295 |
| 2022 | Jingye Group | China | 31,000 | 36,882 | 891 | 12,191 |
| 2022 | CK Hutchison Holdings | China | 300,000 | 36,134 | 4308 | 155,670 |
| 2022 | Jardine Matheson | China | 400,000 | 35,862 | 1881 | 91,489 |
| 2022 | TongLing Nonferrous Metals Group | China | 20,164 | 35,511 | 50 | 14,621 |
| 2022 | Haier Smart Home | China | 104,874 | 35,278 | 2026 | 34,234 |
| 2022 | Zijin Mining Group | China | 43,876 | 34,898 | 2430 | 32,839 |
| 2022 | China Datang | China | 91,005 | 34,700 | −2904 | 130,691 |
| 2022 | Longfor Group Holdings | China | 44,065 | 34,630 | 3698 | 137,852 |
| 2022 | Shudao Investment Group | China | 49,493 | 34,549 | 428 | 157,911 |
| 2022 | China National Aviation Fuel Group | China | 13,877 | 34,519 | 430 | 10,848 |
| 2022 | New China Life Insurance | China | 34,434 | 34,476 | 2317 | 177,535 |
| 2022 | Hunan Iron & Steel Group | China | 33,764 | 34,061 | 1269 | 21,604 |
| 2022 | Lu’an Chemical Group | China | 99,132 | 34,043 | −272 | 46,429 |
| 2022 | Shanghai Pharmaceuticals Holding | China | 47,056 | 33,459 | 790 | 25,729 |
| 2022 | Shanxi Coking Coal Group | China | 202,079 | 33,380 | −427 | 71,504 |
| 2022 | Xinjiang Zhongtai Group | China | 39,141 | 32,890 | 48 | 19,770 |
| 2022 | BYD | China | 288,186 | 32,758 | 472 | 46,564 |
| 2022 | S.F. Holding | China | 177,129 | 32,120 | 662 | 33,044 |
| 2022 | Guangxi Investment Group | China | 35,369 | 31,962 | 79 | 105,327 |
| 2022 | Yunnan Provincial Investment Holding Group | China | 52,077 | 31,884 | 275 | 84,585 |
| 2022 | Weichai Power | China | 82,600 | 31,556 | 1435 | 43,615 |
| 2022 | Xinjiang Guanghui Industry Investment | China | 73,109 | 31,506 | 66 | 42,839 |
| 2022 | Shandong Hi-Speed Group | China | 52,407 | 31,136 | 686 | 179,340 |
| 2022 | Hailiang Group | China | 24,058 | 31,049 | 128 | 10,512 |
| 2022 | Chengdu Xingcheng Investment Group | China | 38,076 | 30,553 | 342 | 148,296 |
| 2022 | Guangzhou Pharmaceutical Holdings | China | 34,730 | 30,466 | 320 | 11,350 |
| 2022 | Shanghai Delong Steel Group | China | 46,054 | 30,343 | 788 | 19,515 |
| 2022 | Gree Electric Appliances | China | 81,884 | 29,402 | 3576 | 50,314 |
| 2022 | Life Insurance Corp. of India | India | 105,738 | 97,267 | 554 | 560,682 |
| 2022 | Reliance Industries | India | 342,982 | 93,982 | 8151 | 197,655 |
| 2022 | Indian Oil | India | 32,938 | 79,542 | 3370 | 54,120 |
| 2022 | Oil & Natural Gas | India | 38,252 | 65,962 | 6112 | 77,162 |
| 2022 | State Bank of India | India | 244,250 | 54,643 | 4750 | 706,560 |
| 2022 | Bharat Petroleum | India | 9193 | 46,867 | 1568 | 24,716 |
| 2022 | Tata Motors | India | 73,608 | 37,797 | −1536 | 43,575 |
| 2022 | Tata Steel | India | 72,551 | 32,861 | 5391 | 37,622 |
| 2022 | Rajesh Exports | India | 181 | 32,650 | 135 | 3152 |
| 2022 | Pertamina | Indonesia | 34,183 | 57,509 | 2046 | 78,051 |
| 2022 | Petronas | Malaysia | 46,884 | 59,874 | 10,091 | 152,499 |
| 2022 | Pemex | Mexico | 123,842 | 73,761 | −14,526 | 100,303 |
| 2022 | America Movil | Mexico | 181,205 | 49,702 | 9490 | 82,588 |
| 2022 | Gazprom | Russia | 468,000 | 137,732 | 28,405 | 360,802 |
| 2022 | Lukoil | Russia | 102,424 | 125,135 | 10,496 | 91,574 |
| 2022 | Rosneft Oil | Russia | 356,000 | 87,832 | 11,983 | 219,532 |
| 2022 | Sberbank | Russia | 287,866 | 50,278 | 16,973 | 549,136 |
| 2022 | Saudi Aramco | Saudi Arabia | 68,493 | 400,399 | 105,369 | 576,134 |
| 2022 | PTT | Thailand | 29,765 | 70,652 | 3389 | 92,767 |
| 2022 | Koç Holding | Turkey | 105,908 | 39,014 | 1710 | 77,018 |
| 2021 | Petrobras | Brazil | 49,050 | 56,683 | 1141 | 190,010 |
| 2021 | JBS | Brazil | 250,000 | 52,429 | 892 | 31,539 |
| 2021 | Vale | Brazil | 74,316 | 40,018 | 4881 | 92,007 |
| 2021 | Itaú Unibanco Holding | Brazil | 96,540 | 37,280 | 3667 | 388,789 |
| 2021 | Banco Bradesco | Brazil | 80,170 | 28,539 | 3073 | 308,962 |
| 2021 | Banco do Brasil | Brazil | 91,673 | 25,150 | 2300 | 326,125 |
| 2021 | State Grid | China | 896,360 | 386,618 | 5580 | 666,089 |
| 2021 | China National Petroleum | China | 1,242,245 | 283,958 | 4575 | 626,617 |
| 2021 | Sinopec Group | China | 553,833 | 283,728 | 6205 | 343,289 |
| 2021 | China State Construction Engineering | China | 356,864 | 234,425 | 3578 | 338,033 |
| 2021 | Ping An Insurance | China | 362,035 | 191,509 | 20,739 | 1,460,210 |
| 2021 | Industrial & Commercial Bank of China | China | 439,787 | 182,794 | 45,783 | 5,110,354 |
| 2021 | China Construction Bank | China | 373,814 | 172,000 | 39,283 | 4,311,457 |
| 2021 | Agricultural Bank of China | China | 462,592 | 153,885 | 31,293 | 4,169,356 |
| 2021 | China Life Insurance | China | 183,417 | 144,589 | 4648 | 776,309 |
| 2021 | China Railway Engineering Group | China | 308,483 | 141,384 | 1639 | 185,316 |
| 2021 | Bank of China | China | 309,084 | 134,046 | 27,952 | 3,739,871 |
| 2021 | China Railway Construction | China | 364,632 | 131,992 | 1486 | 190,916 |
| 2021 | Huawei Investment & Holding | China | 197,000 | 129,184 | 9362 | 134,384 |
| 2021 | China Mobile Communications | China | 455,721 | 111,826 | 12,920 | 304,528 |
| 2021 | JD.com | China | 314,906 | 108,087 | 7160 | 64,718 |
| 2021 | SAIC Motor | China | 143,261 | 107,555 | 2961 | 140,907 |
| 2021 | China Communications Construction | China | 213,438 | 106,868 | 1165 | 306,555 |
| 2021 | Alibaba Group Holding | China | 251,462 | 105,866 | 22,224 | 257,978 |
| 2021 | China Minmetals | China | 205,015 | 102,015 | 491 | 150,652 |
| 2021 | China FAW Group | China | 121,002 | 101,076 | 2867 | 74,933 |
| 2021 | Hengli Group | China | 118,496 | 100,773 | 2373 | 40,748 |
| 2021 | Amer International Group | China | 20,180 | 100,281 | 1852 | 31,047 |
| 2021 | China Resources | China | 370,955 | 99,438 | 4330 | 275,692 |
| 2021 | Shandong Energy Group | China | 244,832 | 97,861 | 1162 | 104,997 |
| 2021 | China Baowu Steel Group | China | 234,570 | 97,643 | 3629 | 155,413 |
| 2021 | China Post Group | China | 827,231 | 96,304 | 4698 | 1,811,048 |
| 2021 | Dongfeng Motor | China | 145,756 | 86,856 | 1116 | 85,096 |
| 2021 | People’s Insurance Co. of China | China | 193,494 | 84,290 | 2904 | 192,500 |
| 2021 | China Southern Power Grid | China | 288,974 | 83,699 | 999 | 155,172 |
| 2021 | China National Offshore Oil | China | 80,058 | 83,296 | 4802 | 193,366 |
| 2021 | China Energy Investment | China | 326,641 | 80,716 | 4102 | 274,035 |
| 2021 | PowerChina | China | 180,883 | 78,487 | 689 | 161,989 |
| 2021 | Sinopharm | China | 176,686 | 77,278 | 1259 | 70,865 |
| 2021 | COFCO | China | 109,839 | 76,856 | 1378 | 102,649 |
| 2021 | CITIC Group | China | 148,283 | 74,689 | 3843 | 1,265,206 |
| 2021 | China Evergrande Group | China | 123,276 | 73,514 | 1170 | 352,668 |
| 2021 | Beijing Automotive Group | China | 110,000 | 72,147 | 340 | 81,894 |
| 2021 | China Telecommunications | China | 400,945 | 71,401 | 1886 | 139,129 |
| 2021 | China North Industries Group | China | 212,960 | 71,018 | 1511 | 67,420 |
| 2021 | Tencent Holdings | China | 85,858 | 69,864 | 23,166 | 204,356 |
| 2021 | Bank of Communications | China | 90,716 | 67,606 | 11,409 | 1,639,481 |
| 2021 | Jinneng Holding Group | China | 472,860 | 67,535 | 8 | 157,498 |
| 2021 | Country Garden Holdings | China | 93,899 | 67,080 | 5076 | 308,936 |
| 2021 | Aviation Industry Corp. of China | China | 407,344 | 66,964 | 916 | 161,221 |
| 2021 | Greenland Holding Group | China | 86,251 | 66,096 | 2174 | 214,151 |
| 2021 | Xiamen C&D | China | 28,928 | 64,112 | 953 | 66,968 |
| 2021 | Pacific Construction Group | China | 295,281 | 64,038 | 2218 | 44,741 |
| 2021 | Sinochem | China | 72,237 | 63,544 | 809 | 97,620 |
| 2021 | China Pacific Insurance (Group) | China | 110,940 | 61,186 | 3563 | 271,418 |
| 2021 | Lenovo Group | China | 71,500 | 60,742 | 1178 | 37,991 |
| 2021 | China Vanke | China | 140,565 | 60,741 | 6017 | 286,474 |
| 2021 | ChemChina | China | 141,250 | 60,492 | −816 | 131,406 |
| 2021 | China Merchants Bank | China | 90,867 | 60,433 | 14,108 | 1,281,448 |
| 2021 | China Merchants Group | China | 246,002 | 60,281 | 5919 | 340,741 |
| 2021 | Wuchan Zhongda Group | China | 18,549 | 58,546 | 398 | 16,345 |
| 2021 | Xiamen ITG Holding Group | China | 21,374 | 58,279 | 286 | 23,534 |
| 2021 | China Poly Group | China | 106,403 | 58,072 | 1949 | 240,687 |
| 2021 | Guangzhou Automobile Industry Group | China | 103,688 | 57,724 | 576 | 51,345 |
| 2021 | China National Building Material Group | China | 202,844 | 57,115 | 103 | 91,973 |
| 2021 | XMXYG | China | 11,671 | 54,324 | 279 | 26,058 |
| 2021 | China Everbright Group | China | 78,600 | 53,429 | 2571 | 907,879 |
| 2021 | Industrial Bank | China | 59,630 | 53,314 | 9656 | 1,209,808 |
| 2021 | Aluminum Corp. of China | China | 152,681 | 53,191 | 321 | 96,920 |
| 2021 | HBIS Group | China | 121,247 | 52,761 | 6 | 74,411 |
| 2021 | Shanghai Pudong Development Bank | China | 61,686 | 52,628 | 8444 | 1,219,641 |
| 2021 | AIA Group | China | 23,397 | 50,359 | 5779 | 326,121 |
| 2021 | Shaanxi Coal & Chemical Industry | China | 126,707 | 49,314 | 121 | 91,350 |
| 2021 | China Minsheng Banking | China | 59,262 | 49,076 | 4972 | 1,065,170 |
| 2021 | Jiangxi Copper | China | 24,528 | 48,820 | 195 | 25,945 |
| 2021 | China COSCO Shipping | China | 110,338 | 47,998 | 1471 | 13,0251 |
| 2021 | Shaanxi Yanchang Petroleum (Group) | China | 131,093 | 47,529 | 161 | 68,054 |
| 2021 | Zhejiang Geely Holding Group | China | 125,764 | 47,191 | 1352 | 74,391 |
| 2021 | China State Shipbuilding | China | 218,956 | 46,845 | 1875 | 132,019 |
| 2021 | China Huaneng Group | China | 128,560 | 45,750 | 312 | 181,995 |
| 2021 | Zhejiang Rongsheng Holding Group | China | 20,493 | 44,726 | 627 | 40,749 |
| 2021 | China United Network Communications | China | 242,121 | 44,034 | 800 | 89,268 |
| 2021 | Tsingshan Holding Group | China | 75,102 | 42,448 | 1129 | 13,205 |
| 2021 | Shandong Weiqiao Pioneering Group | China | 100,395 | 41,879 | 1236 | 37,716 |
| 2021 | Sinomach | China | 139,453 | 41,712 | 571 | 54,391 |
| 2021 | Midea Group | China | 149,239 | 41,407 | 3945 | 55,231 |
| 2021 | State Power Investment | China | 123,727 | 40,323 | 344 | 202,933 |
| 2021 | China Energy Engineering Group | China | 120,963 | 39,439 | 508 | 73,015 |
| 2021 | China Aerospace Science & Technology | China | 179,085 | 38,742 | 2735 | 79,504 |
| 2021 | Jiangsu Shagang Group | China | 45,060 | 38,665 | 1145 | 46,318 |
| 2021 | Zhejiang Hengyi Group | China | 22,019 | 38,562 | 152 | 17,406 |
| 2021 | Shenghong Holding Group | China | 32,272 | 38,440 | 520 | 17,639 |
| 2021 | Anhui Conch Group | China | 59,823 | 37,930 | 1878 | 37,624 |
| 2021 | China Aerospace Science & Industry | China | 145,148 | 37,697 | 1955 | 58,852 |
| 2021 | Suning.com Group | China | 69,398 | 36,565 | −620 | 32,502 |
| 2021 | Yango Longking Group | China | 28,670 | 36,264 | 540 | 72,576 |
| 2021 | China Electronics | China | 180,822 | 35,931 | −97 | 53,588 |
| 2021 | Jinchuan Group | China | 29,220 | 35,907 | 360 | 17,602 |
| 2021 | Xiaomi | China | 22,074 | 35,633 | 2950 | 38,878 |
| 2021 | Taikang Insurance Group | China | 56,899 | 35,476 | 3484 | 173,121 |
| 2021 | China Taiping Insurance Group | China | 65,900 | 35,461 | 415 | 150,764 |
| 2021 | CRRC Group | China | 179,374 | 34,778 | 748 | 66,932 |
| 2021 | China South Industries Group | China | 164,918 | 34,455 | 853 | 54,926 |
| 2021 | China Huadian | China | 93,331 | 34,440 | 585 | 131,961 |
| 2021 | CK Hutchison Holdings | China | 300,000 | 34,347 | 3758 | 161,804 |
| 2021 | China Electronics Technology Group | China | 179,390 | 34,311 | 1880 | 69,212 |
| 2021 | Cedar Holdings Group | China | 23,856 | 33,837 | 50 | 18,875 |
| 2021 | Shanghai Construction Group | China | 48,609 | 33,526 | 486 | 49,250 |
| 2021 | Sunac China Holdings | China | 64,436 | 33,418 | 5166 | 169,871 |
| 2021 | China National Nuclear | China | 183,400 | 32,663 | 1188 | 139,810 |
| 2021 | Jardine Matheson | China | 403,000 | 32,647 | −394 | 93,526 |
| 2021 | Jingye Group | China | 31,000 | 32,528 | 607 | 10,709 |
| 2021 | Shandong Iron & Steel Group | China | 50,131 | 31,990 | 129 | 57,270 |
| 2021 | New Hope Holding Group | China | 140,757 | 31,606 | 515 | 48,435 |
| 2021 | Shenzhen Investment Holdings | China | 75,102 | 31,144 | 1661 | 129,558 |
| 2021 | Ansteel Group | China | 119,331 | 30,886 | 259 | 52,135 |
| 2021 | Shanxi Coking Coal Group | China | 212,698 | 30,454 | 160 | 67,853 |
| 2021 | Haier Smart Home | China | 99,299 | 30,395 | 1287 | 31,182 |
| 2021 | TongLing Nonferrous Metals Group | China | 22,501 | 30,301 | −26 | 14,266 |
| 2021 | Shougang Group | China | 97,235 | 30,054 | 43 | 78,469 |
| 2021 | New China Life Insurance | China | 36,309 | 29,545 | 2072 | 153,927 |
| 2021 | Weichai Power | China | 81,600 | 28,622 | 1334 | 41,494 |
| 2021 | Hailiang Group | China | 20,176 | 28,467 | 117 | 9348 |
| 2021 | China General Technology | China | 52,945 | 28,379 | 558 | 34,593 |
| 2021 | Beijing Jianlong Heavy Industry Group | China | 61,300 | 28,362 | 494 | 23,685 |
| 2021 | Zhejiang Communications Investment Group | China | 38,466 | 28,168 | 707 | 91,171 |
| 2021 | China Datang | China | 100,721 | 27,928 | 317 | 122,079 |
| 2021 | Shanghai Pharmaceuticals Holding | China | 48,136 | 27,813 | 652 | 22,864 |
| 2021 | Guangxi Investment Group | China | 33,005 | 27,708 | 41 | 91,595 |
| 2021 | Xinjiang Guanghui Industry Investment | China | 73,963 | 27,448 | 59 | 42,635 |
| 2021 | China National Coal Group | China | 131,121 | 27,105 | 485 | 63,259 |
| 2021 | Longfor Group Holdings | China | 35,426 | 26,746 | 2899 | 117,266 |
| 2021 | Guangzhou Municipal Construction Group | China | 38,367 | 26,682 | 127 | 23,703 |
| 2021 | Guangzhou Pharmaceutical Holdings | China | 34,371 | 26,070 | 299 | 9133 |
| 2021 | China Resources Land | China | 48,414 | 26,027 | 4352 | 133,186 |
| 2021 | Yunnan Provincial Investment Holding Group | China | 51,442 | 25,887 | 279 | 72,724 |
| 2021 | WH Group | China | 107,000 | 25,589 | 828 | 18,715 |
| 2021 | Huayang New Material Technology Group | China | 99,487 | 25,188 | −173 | 39,670 |
| 2021 | Zijin Mining Group | China | 36,860 | 24,855 | 943 | 27,941 |
| 2021 | Gree Electric Appliances | China | 83,952 | 24,710 | 3214 | 42,792 |
| 2021 | China Reinsurance (Group) | China | 63,914 | 24,376 | 828 | 69,514 |
| 2021 | Reliance Industries | India | 236,334 | 62,912 | 6619 | 180,649 |
| 2021 | State Bank of India | India | 245,652 | 51,919 | 3019 | 662,540 |
| 2021 | Indian Oil | India | 33,439 | 50,433 | 2916 | 48,528 |
| 2021 | Oil & Natural Gas | India | 30,105 | 46,597 | 2189 | 74,280 |
| 2021 | Rajesh Exports | India | 377 | 34,805 | 114 | 3209 |
| 2021 | Tata Motors | India | 75,278 | 34,013 | −1812 | 46,916 |
| 2021 | Bharat Petroleum | India | 9257 | 31,315 | 2178 | 22,012 |
| 2021 | Pertamina | Indonesia | 34,564 | 41,470 | 1051 | 69,144 |
| 2021 | Petronas | Malaysia | 48,679 | 42,563 | −5680 | 142,804 |
| 2021 | América Móvil | Mexico | 186,851 | 47,326 | 2181 | 81,591 |
| 2021 | Pemex | Mexico | 123,899 | 44,384 | −23,683 | 96,826 |
| 2021 | Gazprom | Russia | 467,000 | 87,870 | 1872 | 315,933 |
| 2021 | Lukoil | Russia | 100,769 | 71,856 | 210 | 81,061 |
| 2021 | Rosneft Oil | Russia | 356,000 | 53,376 | 2033 | 207,671 |
| 2021 | Sberbank | Russia | 285,555 | 43,264 | 10,527 | 487,263 |
| 2021 | Saudi Aramco | Saudi Arabia | 79,800 | 229,766 | 49,287 | 510,266 |
| 2021 | PTT | Thailand | 29,421 | 51,648 | 1207 | 84,834 |
| 2021 | Koç Holding | Turkey | 100,641 | 26,179 | 1321 | 84,826 |
Source: Compiled by the authors as a result of the systematization of Fortune (2024) materials.
References
- Beena, P. L., Murali Kallummal, and Santosh Kumar, eds. 2022. Indian Economy and Neoliberal Globalization: Finance, Trade, Industry and Employment. London: Routledge, pp. 1–384. [Google Scholar] [CrossRef]
- Bogoviz, Aleksei V., Yulia V. Ragulina, Alexander N. Alekseev, Evgeni S. Anichkin, and Viktor I. Dobrosotsky. 2018. Transformation of the role of human in the economic system in the conditions of knowledge economy creation. In The Impact of Information on Modern Humans. Edited by Elena G. Popkova. Cham: Springer, pp. 673–680. [Google Scholar] [CrossRef]
- Brewster, Chris, and Michael Brookes. 2024. Sustainable development goals and new approaches to HRM: Why HRM specialists will not reach the sustainable development goals and why it matters. German Journal of Human Resource Management 38: 183–201. [Google Scholar] [CrossRef]
- Chahal, Deepika, and Anju Rani. 2024. Productive and decent work employment opportunities: Reflections of Sustainable Development Goal 8. Journal Space and Culture, India 11: 90–101. [Google Scholar] [CrossRef]
- Clark, Ian. 2018. The political economy of finance-led capitalism: Connecting financialization, private equity, and employment outcomes. In The Routledge Companion to Management Buyouts. Edited by Mike Wright, Kevin Amess, Nick Bacon and Donald Siegel. London: Routledge, pp. 441–55. [Google Scholar] [CrossRef]
- De La Vega Caceres, Abraham Puente. 2024. Drivers of value creation and the effect of ESG risk rating on investor perceptions through financial metrics. Sustainability 16: 5347. [Google Scholar] [CrossRef]
- Dhasmana, Anubha. 2021. Employment growth in the face of exchange rate uncertainty: The role of trade and foreign equity finance. Southern Economic Journal 88: 79–117. [Google Scholar] [CrossRef]
- Ergasheva, Shakhlo T., Azizkhan A. Tillyakhodjaev, Yokutxon K. Karrieva, Elena G. Popkova, and Zhanna V. Gornostaeva. 2023. Business risks in COVID-19 crisis dataset modeling: Regulatory vs. marketing tools of risk management. Risks 11: 190. [Google Scholar] [CrossRef]
- Fernández-Portillo, Antonio, Nuria Ramos-Vecino, María Calzado-Barbero, and Rafael Robina-Ramírez. 2023. Does innovation create employment indirectly through the improvement generated in the company’s economic and financial results? Systems 11: 381. [Google Scholar] [CrossRef]
- Fortune. 2024. Global 500. Available online: https://fortune.com/ranking/global500/ (accessed on 1 August 2024).
- Galoyan, Diana R., Firuza N. Mayilyan, Yevgenya A. Bazinyan, Manuk E. Movsisyan, and Alik A. Torosyan. 2023. Triple exploitation of human capital in developing countries. In ESG Management of the Development of the Green Economy in Central Asia. Edited by Elena Gennadievna Popkova and Bruno Sergio Sergi. Cham: Springer, pp. 375–83. [Google Scholar] [CrossRef]
- Hajek, Petr, and Michal Munk. 2024. Corporate financial distress prediction using the risk-related information content of annual reports. Information Processing and Management 61: 103820. [Google Scholar] [CrossRef]
- Inshakova, Agnessa O., Anastasia A. Sozinova, and Tatiana N. Litvinova. 2021. Corporate fight against the COVID-19 risks based on technologies of industry 4.0 as a new direction of social responsibility. Risks 9: 212. [Google Scholar] [CrossRef]
- Jiang, Ruibo, and Wenjing Fan. 2022. Inclusive finance and employment: Can financial development improve peasant’s entrepreneurship? Managerial and Decision Economics 43: 630–46. [Google Scholar] [CrossRef]
- Kalandarovna, Abdurakhmanova Gulnora, Gaibnazarov Shukhrat Gaibnazarovich, Shayusupuva Nargiza Turgunovna, Fayziyeva Dilafruz Shuxratovna, and Tursunov Bobir Ortikmirzaevich. 2020. Methodical aspects of establishing a control system over compliance with principles of decent work and social security in textile enterprises. Journal of Advanced Research in Dynamical and Control Systems 12: 73–81. [Google Scholar] [CrossRef]
- Khasanov, Bakhodir Akramovich, Zafar Avazmuratovich Mukumov, Abdimumin Ismatovich Alikulov, Ayjan Baxtiyarovna Djumanova, Uktam Toshtemirovich Eshboev, and Risolat Bahodirovna Hasanova. 2019. Calculation of the invested capital profitability in the financial condition analysis process. International Journal of Advanced Science and Technology 28: 42–48. [Google Scholar]
- Kim, Cheol Young. 2024. Social entrepreneurship, employment, and financial performance: A latent growth modeling approach. SAGE Open 14: 21582440241249147. [Google Scholar] [CrossRef]
- Liang, Fucheng, and Yi Liu. 2024. Sustainable youth employment quality management: The impact of robotization in China. PLoS ONE 19: e0298081. [Google Scholar] [CrossRef] [PubMed]
- Lucchetta, Marcella. 2024. International aggregate risk: Effects on financial stability. Economics Letters 240: 111773. [Google Scholar] [CrossRef]
- Madhani, Pankaj M. 2017. Enhancing return on HR investment: Risk management with real options approach. Compensation and Benefits Review 49: 38–55. [Google Scholar] [CrossRef]
- Mardonov, Batir, Raya Karlibaeva, Gulnoza Yuldosheva, and Amina Aymuxammedova. 2021. Correlation analysis of the relationship between the time variable of output and the value of fixed assets. Paper presented at the ICFNDS ‘21: The 5th International Conference on Future Networks and Distributed Systems, Dubai, United Arab Emirates, December 15–16; New York: Association for Computing Machinery, pp. 647–50. [Google Scholar] [CrossRef]
- Milica, Dokić, and Jovanović Milica. 2019. Productive employment and working conditions as determinants of sustainable economic development in Serbia. Studies in Business and Economics 14: 84–96. [Google Scholar] [CrossRef]
- Mo, Yanan, Kuoti Liao, and Junqi Wang. 2024. Analysis of current research in the field of sustainable employment based on latent dirichlet allocation. Sustainability 16: 4557. [Google Scholar] [CrossRef]
- Mushtaq, Sonia, and Shazia Akhtar. 2024. Sustainable HRM strategies, enhancing organizational resilience and advancing sustainability goals. Journal of Management Development 43: 712–26. [Google Scholar] [CrossRef]
- Nasr-Allah, Ahmed, Alexandros Gasparatos, Alice Karanja, Eric Brako Dompreh, Seamus Murphy, Cristiano M. Rossignoli, Michael Phillips, and Harrison Charo-Karisa. 2020. Employment generation in the Egyptian aquaculture value chain: Implications for meeting the Sustainable Development Goals (SDGs). Aquaculture 520: 734940. [Google Scholar] [CrossRef]
- Odilova, Dilnoza. 2023. Social security of the population and its reflection in the human development index. E3S Web of Conferences 452: 07024. [Google Scholar] [CrossRef]
- Osovtsev, Victor Anisimovich, Natalia Vitovna Przhedetskaya, and Madina Seidullaevna Sagidullaeva. 2018. Conceptual model of adaptive management of strategic marketing: A system approach. European Research Studies Journal 21: 666–77. [Google Scholar]
- Raies, Asma. 2023. Sustainable employment in developing and emerging countries: Testing augmented Okun’s law in light of institutional quality. Sustainability 15: 3088. [Google Scholar] [CrossRef]
- Song, Xiaoling, Jiaqi Li, and Xueke Wu. 2024. Financial inclusion, education, and employment: Empirical evidence from 101 countries. Humanities and Social Sciences Communications 11: 172. [Google Scholar] [CrossRef]
- Thuan, Luong Duc, Mai Thi Hoang Minh, and Pham Quang Huy. 2024. Impact of social responsibility disclosure between implementation of environmental accounting, green HRM, energy efficiency, and sustainable development: A study of Vietnam. Cuadernos de Economia 47: 43–53. Available online: https://cude.es/submit-a-manuscript/index.php/CUDE/article/view/481/341 (accessed on 12 September 2024).
- Vásquez, Juanita Salinas, Juan Pablo Sarmiento Jara, María Paz Urgilés Salinas, and Diego Fernando Oña Avendaño. 2024. Social capital and credit risk in a financial cooperative of Ecuador. Journal of Co-operative Organization and Management 12: 100247. [Google Scholar] [CrossRef]
- Xin, Aifang, Muqaddas Khalid, Shoaib Nisar, and Iqra Riaz. 2024. Financial sustainability and corporate credit risk: Moderating role of earnings management. Sustainability 16: 5747. [Google Scholar] [CrossRef]
- You, Chengde, Huishan Qiu, Zhuojie Pi, and Mengyuan Yu. 2023. Sustainable Enterprise Development in the Manufacturing Sector: Flexible Employment and Innovation in China. Sustainability 15: 8180. [Google Scholar] [CrossRef]
- Zarova, Elena, and Bobir Tursunov. 2022. Methodology for assessing the financial security of enterprises in the post-pandemic period of digital economy. Paper presented at the ICFNDS ‘22: The 6th International Conference on Future Networks & Distributed Systems, Tashkent, Uzbekistan, December 15; New York: Association for Computing Machinery, pp. 110–15. [Google Scholar]
- Zhang, Dengjun, Nirosha Wellalage, and Viviana Fernandez. 2024. Temporary employment and financial distress in times of crisis. Journal of Risk Finance 25: 602–28. [Google Scholar] [CrossRef]
Disclaimer/Publisher’s Note: The statements, opinions and data contained in all publications are solely those of the individual author(s) and contributor(s) and not of MDPI and/or the editor(s). MDPI and/or the editor(s) disclaim responsibility for any injury to people or property resulting from any ideas, methods, instructions or products referred to in the content. |
© 2024 by the authors. Licensee MDPI, Basel, Switzerland. This article is an open access article distributed under the terms and conditions of the Creative Commons Attribution (CC BY) license (https://creativecommons.org/licenses/by/4.0/).