Abstract
Background: Healthcare providers encounter varying languages every day in patient care. The goal of this study was to examine whether a difference exists in pain scoring and treatment amongst pediatric patients whose families’ primary language was not English. We hypothesized that patients of both Arabic-speaking (AS) and Spanish-speaking (SS) backgrounds received higher pain scores and higher daily opioid equivalents (OEs) postoperatively compared to English-speaking (ES) patients. Methods: This was a retrospective cohort study of patients undergoing surgery for treatment of various esophageal and airway disorders from 2014 to 2019. Records were queried for patients undergoing thoracotomies for treatment of esophageal and airway disorders. Analysis was focused on the three most common languages in this selected population: English, Arabic, and Spanish. Propensity score matching was utilized for comparisons of pain scores between AS, SS, and ES patient groups. Primary outcomes were opioid equivalents (OEs) and pain scores postoperatively. Multivariable median regression analysis was used to perform an adjusted comparison of pain scores as well as OEs. Results: A total of 610 patient encounters were included in our analysis. In propensity matched analysis, there were no significant differences in OEs between all groups postoperatively. However, statistically significant higher pain scores were reported in the ES group matched AS groups. Conclusions: Language differences did not lead to difference in pain assessment and treatment.
1. Introduction
The United States has become a destination for international patients needing world class medical care. With the arrival of different nationalities, cultures, and races, differences in languages spoken by patients and their families is expected. A large quaternary children’s hospital in New England received 2700 international patients from over 110 countries in 2019 [1]. In addition to international patients, the U.S. has more than 350 different spoken languages [2]. In Massachusetts, just under 10 percent of the adult population lacks proficiency in English, amounting to over 500,000 people [3,4]. With this multitude of languages spoken, healthcare providers need to find adequate ways to communicate with their patients. Many resources are available, including on-site interpreters, video and audio interpreting services, a patient’s family members, friends, or other hospital staff. However, these resources are not continuously available at the bedside and are mainly utilized during procedural informed consents or treatment planning.
While racial and ethnic disparities in pain management have been well-documented [5,6,7,8,9,10,11,12,13,14,15,16,17,18], there is a paucity of data on these disparities in pediatric perioperative pain control [13,14]. Furthermore, pediatric studies assessing the impact of primary spoken language on perioperative pain management are limited [15,16,17]. Proficiency in English by a patient’s parent seems to be a factor in access to healthcare, quality of healthcare, and parental satisfaction of their child’s care [15]. Interviews conducted with Latina mothers in an urban setting also showed parents felt more satisfied with primary care experiences than specialty or emergency care, partly because of challenges with unfamiliarity in navigating such specialty services [15].
Many families with different primary languages travel to have a wide array of surgical procedures performed on their children at our quaternary children’s hospital. Arabic-speaking (AS) and Spanish-speaking (SS) patients come for treatment of esophageal and airway disorders, ranging from primary tracheoesophageal fistula (TEF) ligations and esophageal atresia repairs, to more complex, multi-staged procedures for management of long gap esophageal atresia. However, language may be a barrier in communication and hence, pain management.
While previously published studies show racial or ethnic disparity in pain recognition and treatment [19,20], race and ethnicity are not interchangeable with primary spoken language. Based on our institutional and clinical experiences with patients of diverse cultural backgrounds, we have noted potential over-scoring, and potential over-treatment of pain in non-English speakers, aiming to ensure adequate analgesia and patient satisfaction. This is in line with other institutional experiences where patients who are less proficient in English had higher chance of receiving pain treatment than those who were more proficient in English [15].
Recognizing cultural differences and potential language barriers when providing patient care, we sought to observe whether there were differences in the way pain is recognized and treated for non-English-speaking patients and their families compared to their English-speaking (ES) counterparts. We hypothesized that patients of both AS and SS families received higher pain scores and higher daily opioid equivalents (OEs) over the course of the first 48 h postoperatively, following TEF repair.
2. Materials and Methods
Following Institutional Review Board approval, this retrospective cohort study was a review of all patients who underwent surgery for open repair of TEF and/or open repair of esophageal atresia between 2014–2019. The institutional surgical approach to TEF and esophageal atresia is consistent, via open thoracotomy, and therefore, a consistent pain profile is expected. In addition to a consistent surgical technique, a select team of surgeons and anesthesiologists performed these operations during this time period, providing consistent surgical skills and anesthetic management among all patients. Regional anesthesia adjuncts used were either an epidural or paravertebral catheters, at the discretion of the anesthesiologist of record, with continuous local anesthetic infusion for at least 48 h. The electronic medical record was queried for patient encounters of those who underwent open thoracotomy for the following procedures (Current Procedural Terminology (CPT) codes in parenthesis): cervical tracheopexy (31750), thoracic tracheopexy (31760), aortopexy (33800), repair esophageal atresia and TEF, congenital (43314), repair esophageal atresia without TEF (43313), TEF repair, cervical approach (43305), and TEF repair, thoracic approach, not congenital (43312). Patients of all age groups and all primary spoken languages were included in data collection. Subsequently, analysis was then focused on the three most common languages in this selected population: English, Arabic, and Spanish. The primary variable of interest was parental primary language. As these patients tend to have multiple procedures over different encounters, only the initial and secondary encounters were included. Patient encounters were excluded from data analysis if they involved simultaneous cardiac surgery or if the surgical approach was a sternotomy. Data collection included age, weight, sex, primary language spoken, and concomitant regional anesthesia at time of surgery, surgical duration, postoperative ventilation method, and postoperative destination (intensive care unit versus inpatient floor). Additionally, the presence or absence of regional anesthesia at the time of surgery, as well as any diagnosis of chronic pain and developmental delay diagnosed after 1 month of age, were queried using International Classification of Disease (ICD) 9 and 10 codes (Appendix A). Primary outcomes were opioid equivalents/kilogram including both bolus and infusions. Secondary outcomes were pain scores assessed using the Face, Legs, Activity, Cry, and Consolability (FLACC) Score, Numerical Rating Scale (NRS), and Wong–Baker FACES scale [21,22,23] at 6, 12, 24, 36, and 48 h postoperatively. Depending on the scoring system used, there was a mix of observational pain scoring (FLACC and FACES scale) and verbal reporting of pain (NRS scale).
Statistical Analysis
Continuous data within each group were presented as medians and interquartile ranges, and categorical data were presented as frequencies and percentages. Univariate comparisons were done using the Wilcoxon rank sum test, Fisher’s exact test, or the Chi-square test, as appropriate. Propensity score matching was utilized for comparisons of pain scores between AS, SS, and ES patient groups. Propensity score matching (PSM) was performed using 1:5 between the AS and ES patient groups, and between the SS and ES patient groups with nearest neighbor matching and using the following matching variables: age, weight, sex, procedure type, encounter number, developmental delay, and history of chronic pain. Standardized mean differences (SMD) were calculated before and after propensity score matching, with values less than 0.2 considered as a reflection of good balance between the matched groups. Multivariable median regression analysis was used to perform an adjusted comparison of pain scores as well as OEs between AS, SS, and ES patient groups while accounting for clustering of multiple encounters per patient. A sensitivity analysis was performed using traditional multivariable median regression modeling, each adjusting for the following confounding variables: age, weight, sex, procedure, encounter number, developmental delay, history of chronic pain, regional use, opioid infusions, surgical duration, ventilation, and ICU admission.
Results from median regression analyses were presented as adjusted difference in medians between comparison groups with corresponding 95% confidence intervals and p values. A two-tailed p < 0.05 was considered statistically significant. Stata (version 16.0, StataCorp LLC., College Station, TX, USA) was implemented for all statistical analyses.
3. Results
A total of 985 patient encounters were queried during data collection. After exclusion criteria were applied, a total of 610 total patient encounters (537 ES patients, 45 AS patients, and 28 SS patients) were utilized during data analysis (Figure 1). Of the 610 encounters analyzed, 210 (39%) were female and 400 (61%) were male. The mean age was 0.9 years. The most common spoken language spoken was English and 10% of encounters were from non-English-speaking backgrounds.
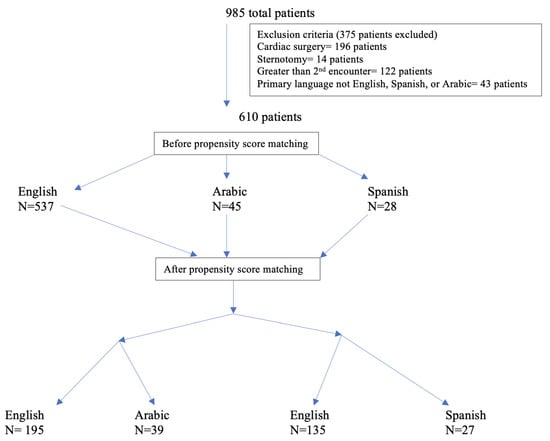
Figure 1.
Number of patients with exclusion criteria and propensity matching applied.
Median OEs per kilogram of body weight and median pain scores for each language group are reported in Table 1. Of note, out of the total reported 13,574 pain scores, 11,899 (87.6%) were FLACC scores. Other scores utilized were NRS (982 pain scores, 7% of total scores) and Wong–Baker Generalized pain scores (534 pain scores, 4% of total score). Opioid equivalents were both presented as continuous opioid infusions (morphine, fentanyl or hydromorphone) and as needed bolus opioids. A total of 105 of 961 had only continuous opioid infusions, 255 encounters had only bolus opioids, and 554 encounters had both bolus and continuous opioids. There was minimal difference in opioid consumption and lower pain scores in the AS patients compared to ES patients. There was a higher opioid consumption by SS patients compared to ES patients at all measured time periods in the first 48 h postoperatively, but no significant difference in pain scores between SS and ES patients.

Table 1.
Opioid Equivalents and Pain Scores by Language Prior to Propensity Score Matching.
Baseline variables of the patients before and after propensity score matching (PSM) are presented in Table 2 and Table 3, and reflect a balance of all variables between the matched groups. A total of 195 ES patients were matched to 39 AS patients (5 ES patients to 1 AS patient), and a total of 135 ES patients were matched to 27 SS patients (5 ES patients to 1 SS patient). There was minimal difference in OEs between the AS and ES patients, and no significant difference in OEs between SS and ES patients (Figure 2). Pain scores were lower for AS patients when compared to ES patients, statistically significant for the first pain score, 12 h and 24 h postoperatively. Finally, pain scores were higher in SS patients compared to ES patients, and statistically significant for 6 and 36 h postoperatively for SS patients (Figure 2).
Table 2.
Patient Characteristics Before and After Propensity Score Matching Between English- and Arabic-Speaking Patients.
Table 3.
Patient Characteristics Before and After Propensity Score Matching Between English- and Spanish-Speaking Patients.
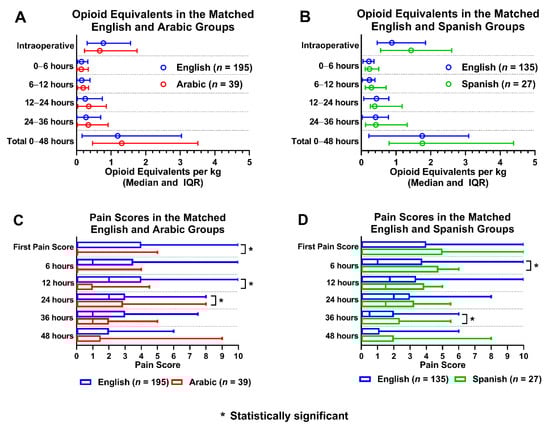
Figure 2.
Opioid equivalents and pain score comparisons amongst propensity matched language groups. (A): Opioid equivalent per kg vs. time in matched English and Arabic groups; (B): Opioid equivalent per kg vs. time in matched English and Spanish groups; (C): Pain score vs. time in matched English and Arabic groups; (D): Pain score vs time in matched English and Spanish groups.
Regional anesthesia was utilized as an adjunct in 68% of ES patients (369/537), 57% of AS patients (26/45), and 75% of SS patients (21/28). When the groups with regional anesthesia were compared, OEs between AS and ES patients were similar amongst the two groups. AS patients had statistically significant lower pain scores than ES patients for the first 24 h postoperatively (Figure 3). SS patients had higher OEs intraoperatively, at 12 h, and at 36 h postoperatively. SS patients had statistically significant lower pain scores only at 36 h postoperatively compared to ES patients. (Figure 4).
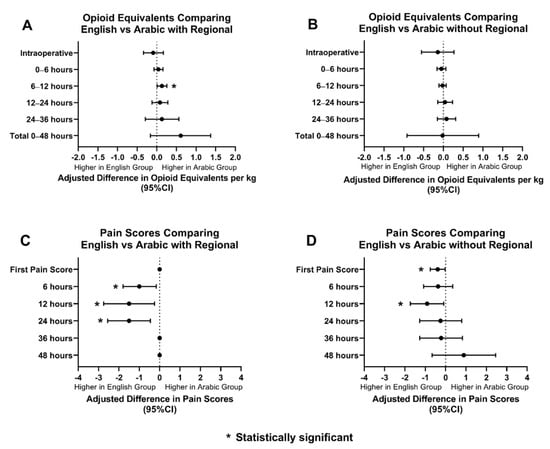
Figure 3.
Opioid equivalents and pain score comparisons amongst ES and AS patients with and without regional anesthesia. (A): Adjusted difference in opioid equivalents per kg vs. time in English vs. Arabic patients with regional anesthesia; (B): Adjusted difference in opioid equivalents per kg vs. time in English vs Arabic patients without regional anesthesia; (C): Adjusted difference in pain score vs. time in English vs. Arabic patients with regional anesthesia; (D): Adjusted difference pain score vs. time in English vs. Arabic patients without regional anesthesia.
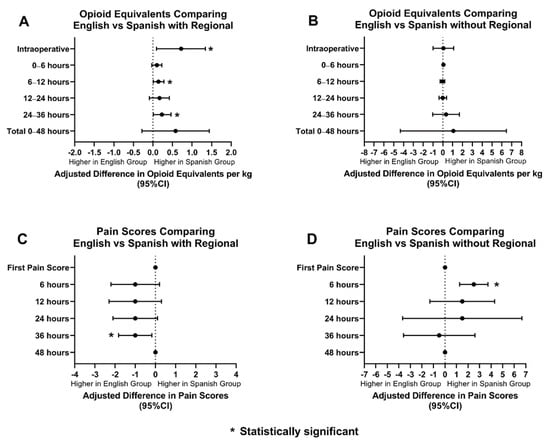
Figure 4.
Opioid equivalents and pain score comparisons amongst ES and SS patients with and without regional anesthesia. (A): Adjusted difference in opioid equivalents per kg vs. time in English vs. Spanish patients with regional anesthesia; (B): Adjusted difference in opioid equivalents per kg vs. time in English vs. Spanish patients without regional anesthesia; (C): Adjusted difference in pain score vs. time in English vs. Spanish patients with regional anesthesia; (D): Adjusted difference pain score vs. time in English vs. Spanish patients without regional anesthesia.
OEs and pain scores between AS and ES patients, without regional anesthesia, were also compared. AS patients received similar OEs when compared to ES patients. AS patients received statistically significant lower scores for the first pain score and at 12 h postoperatively (Figure 3). SS patients and ES patients had comparable OEs and pain scores, however, SS patients did have higher pain scores at 6 h postoperatively (Figure 4).
To further address variables that may affect pain scores and OEs, a sensitivity test using multivariable regression analysis was performed, adjusting for age, weight, sex, developmental delay diagnosis, chronic pain diagnosis, surgical duration, procedure type, first or second encounter, regional anesthesia utilization, ICU admission, postoperative ventilator status, and postoperative continuous opioid infusion (Table 4). OEs and pain scores between AS and ES, as well as SS and ES were comparable. The only statistically significant differences were at 12 and 24 h, when AS patients reported lower pain scores than ES patients, which mirrored the same findings in the PSM analysis.
Table 4.
Multivariable Median Regression Analysis of Outcomes Compared by Language Group.
4. Discussion
AS and SS patients had comparable pain scores and similar OEs per kilogram as their ES counterparts after surgical repair for conditions including and related to esophageal atresia (EA)/tracheoesophageal fistula (TEF). While unmatched data showed overall higher reported pain scores among ES patients compared to AS patients, there was no difference in pain scores or OEs between these two groups after propensity score matching. Although the additional multivariate analysis showed statistically significant higher pain scores for ES patients at 12 and 24 h postoperatively, there was no clinical significance in such differences. The interquartile range of pain scores between AS–ES and SS–ES compared groups ranged from 0 to 4 and 0 to 5, respectively. Considering a pain score of 0–4 is considered mild, large doses of opioids would not be administered within this range, and our results reflected this. Although a pain score of 5 is considered moderate pain, the few SS patients did not contribute to a significant increase to overall requirement of opioids. Only four SS patients had a first pain score of 5: one had a 6 h postoperative pain score of 5 and one had a pain score of 5 at both first pain score and 6 h postoperatively. Similarly, unmatched data showed SS patients had higher OEs, and initial analysis revealed no difference in pain scores or OEs between SS and ES patients, except for higher pain scores among ES patients at 6 and 36 h postoperatively (IQR 0–5, p = 0.029 and 0–2, p = 0.016, respectively). After multivariate analysis, there was no statistical difference in pain scores between the two groups, which supported that this difference, again, may not be clinically significant.
Despite the difference in languages in this surgical patient population, the lack of clinical difference in pain scores and management may be due to the consistency in surgical technique and anesthetic management. Patients with esophageal atresia and TEF were consistently operated on and cared for by the same small group of surgeons and anesthesiologists, as part of the esophageal atresia team. Thus, there was little variation in surgical technique, anesthetic plan and management, and postoperative management including opioid order sets. In this study, standardization of surgical and anesthetic management may have played a role in preventing differences in pain management among ES and non-ES patients.
There are several limitations to this study. The retrospective nature of our study cannot accurately address the complex, real-time clinical judgements and interactions between patient, parent, nurse, and physician postoperatively. There was a small sample size of AR and SS groups used in propensity score matching; however, our sensitivity test confirmed there was no significant differences in pain score or opioid consumption between compared groups. The patient’s place of residence, length of time residing in the United States, cultural background, and socioeconomic status were not collected since they were not available at the time of retrospective data collection, and may impact the patient–provider relationship and expectations. Furthermore, while it has been shown that race and ethnicity can play a role in disparities in pain management, race and ethnicity data were incomplete and hence, this was not included as a covariate in this analysis. Though we strove to study the effect of primary language on opioid consumption and pain scores, it was possible that there were some biases as a result of a patient’s race or ethnicity that impacted our data by underrepresenting moderate to severe pain. Parental satisfaction in each of our study groups was unattainable and unknown. A majority of pain scores reported relied on nonverbal cues from patients, with most scores (87%) being FLACC scores. While verbal cues were not readily used in most patients, it was possible that parental language could have played a part in observer scoring. Finally, an additional unobtainable piece of information was the primary language of the healthcare providers, including the post anesthesia care unit, intensive care unit, and floor nurses, who were interacting with these patients and their families. The potential benefit for enhanced patient–provider interactions between those with concordant primary language could alter the results.
5. Conclusions
Parental primary language did not impact pain recognition and pain management in our EA and TEF patient population. Standardization of surgical technique, anesthetic management, pain assessment, and postoperative management may have played a role in our results. Future prospective studies that assess language discordant parent–provider relationships and its impact on perioperative pediatric pain management, and patient or parent satisfaction, are needed.
Author Contributions
Conceptualization, R.E.S., V.G.N. and C.T.; methodology R.E.S., S.J.S., V.G.N. and C.T.; software, S.J.S.; validation, S.J.S.; formal analysis, R.E.S., S.J.S., V.G.N. and C.T. data curation, S.J.S.; writing—original draft preparation, R.E.S. and C.T.; writing—review and editing, R.E.S., S.J.S., V.G.N. and C.T. All authors have read and agreed to the published version of the manuscript.
Funding
This research received no external funding.
Institutional Review Board Statement
The study was conducted in accordance with the Declaration of Helsinki, and approved by the Institutional Review Board of Boston Children’s Hospital (IRB-P00034050, approved 25 November 2019).
Informed Consent Statement
Patient consent was waived due to retrospective nature of study and full deidentification of data.
Data Availability Statement
Data available upon request.
Conflicts of Interest
The authors declare no conflict of interest.
Appendix A. ICD 9 and 10 Codes Queried for Developmental Delay and Pain Disorders
- 315.4 development coordination disorder
- 315.5 mixed development disorder
- 315.8 other specified delays in development
- 315.9 unspecified delay in development
- 313.89 other emotional disturbances of childhood or adolescence
- 338.29 other chronic pain
- 338.4 chronic pain syndrome
- 338.19 other acute pain
- 780.98 generalized pain
- 783.42 delayed milestones
- 783.40 unspecified lack pf normal physiological development
- F94.9 Childhood disorder of social functioning, unspecified
- R62.0 Delayed milestone in childhood
- F81.9 Developmental disorder of scholastic skills, unspecified
- F88 Other disorders of psychological development
- R62.59/R62.50 Other lack of expected normal physiological development in childhood/Unspecified lack of expected normal in childhood
- F82 Specific developmental disorder of motor function
- F89 Unspecified disorder of psychological development
- G89.21 chronic pain due to trauma
- G89.4 chronic pain syndrome
- G89.22 chronic post-thoracotomy pain
- G89.3 neoplasm related pain (acute) (chronic)
- G89.29 other chronic pain
- G89.28 other chronic postprocedural pain
- R52 Pain, unspecified/generalized chronic body pains
- M54.6 Pain in thoracic spine
References
- Ford, B. This Local Hospital Is Making an International Impact, Boston Globe. 30 September 2019. Available online: https://sponsored.bostonglobe.com/bostonchildrens/international-care/ (accessed on 5 April 2022).
- US Census Bureau. Census Bureau Reports at Least 350 Languages Spoken in U.S. Homes, The United States Census Bureau. 3 November 2015. Available online:www.census.gov/newsroom/press-releases/2015/cb15-185.html (accessed on 4 April 2021).
- Boston Planning & Development Agency, Research Division. Demographic Profile of Adult Limited English Speakers in Massachusetts; Boston Planning & Development Agency, Research Division: Boston, MA, USA, 2019. [Google Scholar]
- Bernier, R.; Halpin, E.; Staffa, S.J.; Benson, L.; DiNardo, J.A.; Nasr, V.G. Inclusion of non-English-speaking patients in research: A single institution experience. Paediatr. Anaesth. 2018, 28, 415–420. [Google Scholar] [CrossRef] [PubMed]
- Toledo, P.T.; Eosakul, S.A.; Grobman, W.; Feinglass, J.; Hasnain-Wynia, R. Primary Spoken Language and Neuraxial Labor Analgesia Use Among Hispanic Medicaid Recipients. Anesth. Analg. 2016, 122, 204–209. [Google Scholar] [CrossRef]
- Goyal, M.; Kuppermann, N.; Cleary, S.; Teach, S.; Chamberlain, J. Racial Disparities in Pain Management of Children with Appendicitis in Emergency Departments. JAMA Pediatr. 2015, 169, 996–1002. [Google Scholar] [CrossRef]
- Campbell, C.M.; Edwards, R.R. Ethnic differences in pain and pain management. Pain Manag. 2012, 2, 219–230. [Google Scholar] [CrossRef] [PubMed] [Green Version]
- Edwards, C.L.; Fillingim, R.B.; Keefe, F. Race, ethnicity and pain. Pain 2001, 94, 133–137. [Google Scholar] [CrossRef]
- Green, C.R.; Anderson, K.O.; Baker, T.A.; Campbell, L.C.; Decker, S.; Fillingim, R.B.; Kaloukalani, D.A.; Lasch, K.E.; Myers, C.; Tait, R.C.; et al. The unequal burden of pain: Confronting racial and ethnic disparities in pain. Pain Med. 2005, 6, 99. [Google Scholar] [CrossRef] [Green Version]
- Rahim-Williams, F.B.; Riley, J.L., 3rd; Herrera, D.; Campbell, C.M.; Hastie, B.A.; Fillingim, R.B. Ethnic identity predicts experimental pain sensitivity in African Americans and Hispanics. Pain 2007, 129, 177–184. [Google Scholar] [CrossRef] [PubMed] [Green Version]
- Kelly, A.M. The minimum clinically significant difference in visual analogue scale pain score does not differ with severity of pain. Emerg. Med. J. 2001, 18, 205–207. [Google Scholar] [CrossRef] [Green Version]
- Hirsh, A.T.; Hollingshead, N.A.; Ashburn-Nardo, L.; Kroenke, K. The interaction of patient race, provider bias, and clinical ambiguity on pain management decisions. J. Pain 2015, 16, 558–568. [Google Scholar] [CrossRef] [PubMed] [Green Version]
- Miller, M.M.; Williams, A.E.; Zapolski, T.C.B.; Rand, K.L.; Hirsh, A.T. Assessment and Treatment Recommendations for Pediatric Pain: The Influence of Patient Race, Patient Gender, and Provider Pain-Related Attitudes. J. Pain 2020, 21, 225–237. [Google Scholar] [CrossRef] [PubMed]
- Nafiu, O.O.; Chimbira, W.T.; Stewart, M.; Gibbons, K.; Porter, L.K.; Reynolds, P.I. Racial differences in the pain management of children recovering from anesthesia. Paediatr. Anaesth. 2017, 27, 760–767. [Google Scholar] [CrossRef] [PubMed]
- Dixit, A.A.; Elser, H.; Chen, C.L.; Ferschl, M.; Manuel, S.P. Language-Related Disparities in Pain Management in the Post-Anesthesia Care Unit for Children Undergoing Laparoscopic Appendectomy. Children 2020, 7, 163. [Google Scholar] [CrossRef] [PubMed]
- Jimenez, N.; Jackson, D.L.; Zhou, C.; Ayala, N.C.; Ebel, B.E. Postoperative pain management in children, parental English proficiency, and access to interpretation. Hosp. Pediatr. 2014, 4, 23–30. [Google Scholar] [CrossRef] [PubMed] [Green Version]
- Jimenez, N.; Seidel, K.; Martin, L.D.; Rivara, F.P.; Lynn, A.M. Perioperative analgesic treatment in Latino and non-Latino pediatric patients. J. Health Care Poor Underserved. 2010, 21, 229–236. [Google Scholar] [CrossRef] [PubMed]
- Sadhasivam, S.; Chidambaran, V.; Ngamprasertwong, P.; Esslinger, H.R.; Prows, C.; Zhang, X.; Martin, L.J.; McAuliffe, J. Race and unequal burden of perioperative pain and opioid related adverse effects in children. Pediatrics 2012, 129, 832–838. [Google Scholar] [CrossRef] [PubMed] [Green Version]
- Tomaszewski, D.M.; Arbuckle, C.; Yang, S.; Linstead, E. Trends in Opioid Use in Pediatric Patients in US Emergency Departments From 2006 to 2015. JAMA Netw. Open 2018, 1, e186161. [Google Scholar] [CrossRef] [PubMed] [Green Version]
- Chavez, L.J.; Cooper, J.N.; Deans, K.J.; Wrona, S.; Zaim, H.; Sebastião, Y.; Chisolm, D.J. Evaluation of racial disparities in postoperative opioid prescription filling after common pediatric surgical procedures. J. Pediatr. Surg. 2020, 55, 2575–2583. [Google Scholar] [CrossRef] [PubMed]
- Duhn, L.J.; Medves, J.M. A systematic integrative review of infant pain assessment tools. Adv. Neonatal. Care 2004, 4, 126–140. [Google Scholar] [CrossRef] [PubMed]
- Crellin, D.J.; Harrison, D.; Santamaria, N.; Huque, H.; Babl, F.E. The Psychometric Properties of the FLACC Scale Used to Assess Procedural Pain. J. Pain 2018, 19, 862–872. [Google Scholar] [CrossRef] [PubMed]
- American Academy of Pediatrics Committee on Psychosocial Aspects of Child Family Health; American Pain Society Task Force on Pain in Infants Children Adolescents. The assessment and management of acute pain in infants, children, and adolescents. Pediatrics 2001, 108, 793–797. [Google Scholar] [CrossRef] [PubMed] [Green Version]
Publisher’s Note: MDPI stays neutral with regard to jurisdictional claims in published maps and institutional affiliations. |
© 2022 by the authors. Licensee MDPI, Basel, Switzerland. This article is an open access article distributed under the terms and conditions of the Creative Commons Attribution (CC BY) license (https://creativecommons.org/licenses/by/4.0/).