Abstract
(1) Background: An estimated 78% of South African children aged 9–10 years have not mastered basic reading, therefore potentially excluding them from self-reporting on health-related outcome measures. Thus, the aim of this study was to compare the performance of the EQ-5D-Y-3L self-complete to the newly developed interviewer-administered version in children 8–10 years. (2) Methods: Children (n = 207) with chronic respiratory illnesses, functional disabilities, orthopaedic conditions and from the general population completed the EQ-5D-Y-3L self-complete and interviewer-administered versions, Moods and Feelings Questionnaire (MFQ) and Faces Pain Scale-Revised (FPS-R). A functional independence measure (WeeFIM) was completed by the researcher. (3) Results: The 8-year-olds had significantly higher missing responses (x2 = 14.23, p < 0.001) on the self-complete version. Known-group and concurrent validity were comparable across dimensions, utility and VAS scores for the two versions. The dimensions showed low to moderate convergent validity with similar items on the MFQ, FPS-R and WeeFIM with significantly higher correlations between the interviewer-administered dimensions of Mobility and WeeFIM mobility total (z = 1.91, p = 0.028) and Looking After Myself and WeeFIM self-care total (z = 3.24, p = 0.001). Children preferred the interviewer-administered version (60%) (x2 = 21.87, p < 0.001) with 22% of the reasons attributed to literacy level. (4) Conclusions: The EQ-5D-Y-3L interviewer-administered version is valid and reliable in children aged 8–10 years. The results were comparable to the self-complete version indicating that versions can be used interchangeably.
1. Introduction
Background
Health-Related Quality of Life (HRQoL) is a multi-faceted and subjective measure of how a person perceives their functional, social, and mental well-being in their environment [1]. HRQoL can be measured using Patient-Reported Outcome Measures (PROMs) by which the descriptive information generated from these PROMs can be used to guide healthcare professionals in tailoring patient interventions [2,3,4] and improving treatment outcomes [3,4]. PROMs can further be used to inform population health, clinical research studies and decision making and health technology assessment [1]. In the past, an emphasis was placed on adult HRQoL, which limited the research available in paediatric populations [5,6,7,8,9]. A contributing factor was the lack of paediatric PROMs, however, with more being developed, a shift to paediatric HRQoL is now being seen [10]. Children who have the cognitive ability to self-report should be encouraged, as far as possible, to do so on valid and reliable PROMs [2].
The EQ-5D-Y-3L is one of approximately 30 generic HRQoL instruments that were developed over the last two decades specifically for the paediatric population [3]. It was adapted from the adult version, the EQ-5D, and measures health across five dimensions namely Mobility (walking about), Looking After Myself (washing and dressing), doing Usual Activities (going to school, hobbies, sports, playing, doing things with family or friends), having Pain or Discomfort and feeling Worried, Sad or Unhappy. The original youth version, EQ-5D-Y-3L, describes health on three levels (no problems, some problems and a lot of problems) which results in 243 (35) health states [4,11]. It further measures general health on a visual analogue scale (VAS) of 0 (worst imaginable health) to 100 (best imaginable health). The first preference-based value sets have been published for Japan and Slovenia [12,13] following the protocol suggested by Romos-Goñi et al. 2020 [14]. The EQ-5D-Y-3L self-complete has been used in studies in South Africa to measure health and changes over time in children from 8 years of age, which is the recommended lower age for self-report [3,4,11,12,13].
In South Africa, as of 2016, the Progress in International Reading Literacy Study estimated that 78% of children between the ages of 9 and 10 years had not mastered basic reading by the end of their fourth year of formal schooling compared to a mere 4% internationally [15]. This problem may be more evident in lower socioeconomic settings [16]. It is anticipated that lower literacy levels would directly affect their ability to accurately self-complete any HRQoL instrument despite their age or level of education suggesting otherwise. However, this may not affect their self-report ability if the concepts of health are understood. Furthermore, children with conditions requiring prolonged periods of hospitalization, need for isolation or being too unwell to attend school may be further restricted in their access to schooling and impacted with regards their ability to progress their literacy skills, therefore affecting their reading ability. These children should not be excluded from self-reporting on their health due to difficulties with reading ability.
Despite the development of approximately 30 generic paediatric PROMs, the modes of administration remain limited to largely self-complete or proxy report [17]. An interviewer-administered version of the EQ-5D-Y-3L has recently been developed by the EuroQoL foundation with a standardised script and instructions for the interviewer. This version has the potential to allow children who struggle to read but are able to cognitively comprehend health-related questions the opportunity to self-report on their health. If this method of administration is successful, it may negate the need for proxy report, which is often the default method of administration despite this mode having been proved to be problematic in some cases with responses often mismatched between children and parents [5,6,7,18]. Studies have found that children and parents prioritise their physical and emotional wellbeing differently and parents are more aware of their child’s physical wellbeing compared to their psychosocial wellbeing, therefore, conflicting information may be reported in these dimensions [19,20]. The aim of this study was thus to determine the performance of the EQ-5D-Y-3L interviewer-administered version compared to the self-complete version in children aged 8–10 years.
2. Materials and Methods
2.1. Study Design
A cross-sectional, descriptive observational, analytical cohort design was conducted in children aged 8–10 years in the Western Cape, South Africa.
2.2. Research Settings
Three research settings, each with children in different health states, but from similar socioeconomic backgrounds (low to middle income), were used in Cape Town, South Africa. Children attending a mainstream school, with generally healthy learners, were used to recruit a general population sample. Children with a functional disability were recruited from three schools for learners with special educational needs. These schools have specialised education services for learners with normal intellect diagnosed with a functional disability (e.g., cerebral palsy, spina bifida or muscle disease). Children with a chronic respiratory illness were recruited at routine outpatient visits at a tertiary paediatric hospital. Children requiring acute medical treatment post fracture or corrective orthopaedic surgery were recruited from the outpatient fracture clinic or the inpatient wards of an acute tertiary paediatric hospital and a paediatric orthopaedic hospital.
2.3. Participants and Sample Size
Participants were included and excluded based on the criteria outlined in Table 1.

Table 1.
Inclusion and exclusion criteria.
The sample size was adequately powered (95%) to detect a difference in correlation and proportion of scores between the three condition groups with a small effect size of 0.4 and a significance of 0.05.
2.4. Instruments
2.4.1. EQ-5D-Y
The official EQ-5D-Y-3L self-complete English version for South Africa was used in this study. The interviewer-administered version for the United Kingdom was tested for equivalence in English for South Africa by the EuroQol group before it was used in this study. The EQ-5D-Y-3L consists of five dimensions namely Mobility (walking about), Looking After Myself (washing and dressing), doing Usual Activities (going to school, hobbies, sports, playing, doing things with family or friends), having Pain or Discomfort and feeling Worried, Sad or Unhappy. Each dimension has three levels of report categorised as level 1 indicating ‘no problems’, level 2 indicating ‘some problems’ or level 3 indicating ‘a lot of problems’ [5]. The EQ-5D-Y-3L includes a VAS which is a vertical, graduated number scale from worst imagined health state (0) to best imagined health state (100) on which the participant rates their overall health status also on the day of testing [6,7]. The EQ-5D-Y-3L has been successfully tested for validity, reliability and responsiveness in South African children aged 8–15 years [11,16,18,21]. As there is no preference-based value set available for South Africa, the recently published value set produced for Slovenia was used [12]. To ensure that the societal preference-based score did not influence performance, comparison was made to the Japanese value set [13]. The Japanese and Slovenian value sets were the only two value sets available at the time of data analysis thus no consideration was given to additional factors such as literacy levels, social structure, etc.
2.4.2. Faces Pain Scale-Revised (FPS-R)
The Faces Pain Scale-Revised (FPS-R) is a self-report measure intended to determine the intensity of pain felt by children on the day of testing. It was developed using a series of six facial expressions depicting an increase in pain intensity from left to right. The scoring ranges from 0–10 and increases by increments of 2. It can be used to self-rate pain intensity in children aged four years or older [22]. The FPS-R was used successfully to determine concurrent validity for the dimension of Pain or Discomfort on the EQ-5D-Y-3L in South Africa at baseline [4].
2.4.3. Moods and Feelings Questionnaire (MFQ)
The Moods and Feelings Questionnaire (MFQ) consists of 13 questions about the child’s psychological wellbeing in the two weeks before testing. Participants were asked to answer questions on a scale of ‘not true’, ‘sometimes’ or ‘true’. The measure was found valid and reliable in an international study in children from age five years [23].
2.4.4. WeeFIM
The WeeFIM is an observational instrument used to assess functional independence in children [24,25]. Functional performance was measured across three dimensions, namely self-care, mobility and cognition. There is a total of 18 items, each rated on an ordinal scale from 1 to 7. The scale gives scores for sub-scales (mobility, cognition and self-care) or a total score for functional performance; the higher the score, the more independent the child is considered to be in that dimension. The WeeFIM sub-scale of mobility and self-care was previously used to determine concurrent validity in the corresponding dimensions of Mobility and Looking After Myself on the EQ-5D-Y-3L in South Africa [4] and was similarly used in this study.
2.4.5. Preference for the Version
The interviewer captured the child’s preference for the interviewer-administered or self-complete version and the reasoning behind their preference.
2.5. Procedure
Ethics approval was obtained from the University of Cape Town, Faculty of Health Sciences, Human Research Ethics Committee (HREC 369_2020). The study was carried out following the declaration of Helsinki involving human participants [26] and the recommended COVID precautions and restrictions set out by the local government.
Information leaflets detailing the study were sent home with eligible learners at the mainstream school and schools for learners with special educational needs. Those parents who were willing, returned signed informed consent and demographic information to school. Children were interviewed in a private room after providing assent. Children attending outpatient clinics were recruited on the day of their routine appointments and those admitted to the inpatient setting were recruited from the ward. All children completed the EQ-5D-Y-3L, FPS-R and MFQ in random order, with the interviewer-administered and self-complete versions separated by the FSP-R, MFQ and the WeeFIM completed by the researcher.
2.6. Data Management and Analysis
The Shapiro-Wilk test was used to test the normality of the data, and as it was not normally distributed, non-parametric tests were used. The level of statistical significance was set at p < 0.05.
2.6.1. General Performance and Feasibility
The EQ-5D-Y-3L responses and descriptive data were summarised in terms of frequency of responses. The feasibility was assessed by comparing the number of missing values for two of the EQ-5D-Y-3L measures. The ceiling effect of the EQ-5D-Y-3L was defined as the proportion of children scoring no problems in a dimension or across all five dimensions (11,111). The floor effect is the proportion of children scoring the most severe problems for a dimension or across all five dimensions (33,333). Differences in reporting were determined via a chi-square statistic (x2).
2.6.2. Inconsistent Responses
Paired dimension responses on the interviewer-administered and self-complete versions were assessed for the respondents who had no missing responses and the proportion of inconsistencies was recorded.
2.6.3. Known-Group Validity
Known-group validity was tested for the dimensions of the interviewer-administered and self-complete versions for age (continuous variable), sex (male and female) and by health condition (orthopaedic, chronic respiratory illness, functional disability and general population) using Spearman rank-order coefficients (rs). It was expected that children with an orthopaedic condition and those with a functional disability would report more problems in the Mobility dimension compared to other groups [7,11,24]. It was also anticipated that children with an orthopaedic condition (being more acutely ill) would report more problems with Usual Activities and Pain or Discomfort [11,25]. Lastly, it was expected that all children with a health condition (orthopaedic, respiratory and functional disability) would report greater feelings of Worried, Sad or Unhappy than children from the general population [11,25]. No difference by age or sex was anticipated.
The known-group validity across health conditions was assessed for the median utility score and VAS score across the health conditions using the Kruskal Wallis test. It was anticipated that the VAS and utility scores would be higher for those from the general population, functional disability, respiratory condition and orthopaedic condition in that order.
2.6.4. Concurrent Validity
The Pearson’s correlation of the utility score and VAS score was computed for the EQ-5D-Y-3L self-complete and interviewer-administered versions and compared using the Fisher r-to-z transformation [http://vassarstats.net (accessed on 30 August 2021)]. It was expected that there would be no difference in concurrent validity between the two versions.
2.6.5. Convergent Validity
Convergent validity between the interviewer-administered and self-complete versions was evaluated using individual dimension response pairs, using Gamma correlations statistics. Utility scores were compared with the Pearson correlation coefficient. Correlation coefficients were interpreted according to Cohen: 0.1–0.29 low association, 0.3–0.49 moderate association and ≥0.5 high association [27]. It was expected that similar dimensions would show similar correlations [11,18]. The convergent validity of the dimension scores of the EQ-5D-Y-3L self-complete and interviewer-administered versions were compared to similar items on the MFQ, FPS-R and WeeFIM using Spearman correlations (rs). Correlation coefficients were compared between the versions of the EQ-5D-Y-3L using the Fisher r-to-z transformation [http://vassarstats.net (accessed on 30 August 2021)].
2.6.6. Preference between Versions
Preference between the interviewer-administered and self-complete versions was assessed during cognitive debriefing. It was expected that participants would prefer the interviewer-administered version as the respondent burden was reduced [20].
All data analyses were conducted using SPSS Windows 27.0 (IBM SPSS Inc., Chicago, IL, USA) and Statistica Windows Version 13.0 (TIBCO Software Inc., Palo Alto, CA, USA).
3. Results
3.1. Recruitment Summary
Figure 1 details the recruitment of children with a total of 207 included for analysis across children known to have an acute orthopaedic condition (n = 81), functional disability (n = 36), chronic respiratory illness (n = 26) or from the school-going general population (n = 64). A total of 211 children were recruited, however, only 207 were included in this study as four children did not complete the EQ-5D-Y-3L self-complete. There was a high proportion of non-responders in the 8–10-year-olds (n = 260, 55%). Reasons for not responding or refusal of consent/assent was not collected. There was also a high number of children with orthopaedic problems who withdrew (n = 21, 20%) during interviews due to personal reasons, transport issues, multiple medical appointments and time constraints.
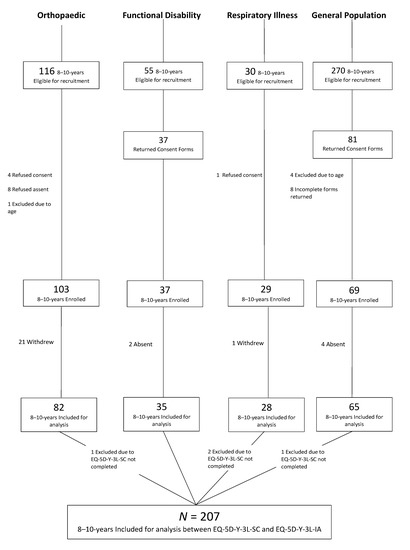
Figure 1.
Recruitment of sample.
3.2. Descriptive Statistics of Sample
There was no difference between sex (x2 = 0.03, p = 0.985) and health condition (x2 = 3.61, p = 0.729) across 8-, 9- and 10-year-olds (Table 2). In the total group, there were more children with orthopaedic conditions (n = 81, 39%) and from the general population (n = 64, 31%) than children with functional disabilities (n = 36, 13%) and chronic respiratory illnesses (n = 26, 13%). The specific conditions included in these disease groups are shown in Table 2. The general population reported relatively few health conditions most frequently including asthma, eczema and allergies (atopy).
Table 2.
Descriptive statistics of participants aged 8–10 years.
3.3. General Instrument Performance and Feasibility
Table 3 shows that there were more problems reported across the dimensions of Looking After Myself, Pain or Discomfort and Worried, Sad or Unhappy on the interviewer-administered version compared to self-complete, although these were not significant. The utility score (analysis with the Slovenian utility score is presented and there was no significant difference between results using the Slovenian or Japanese utility scores) and VAS score were similarly higher on the interviewer-administered version, although not significantly so. The ceiling effect was not significantly different between versions either. There were 22 children with missing responses on the self-complete version. The proportion of missing responses across the five dimensions was significantly higher in the 8-year-olds (n = 34, 10%) than 9-year-olds (n = 14, 4%) or 10-year-olds (n = 17, 5%) (x2 = 14.23, p < 0.001)
Table 3.
Comparison of the self-complete and interviewer-administered dimension responses.
Overall, the interviewer-administered version took less time to complete (median = 110 s, IQR = 98, 124 s) compared to the self-complete version (median = 157 s, IQR = 123 s, 209 s). When comparing the time taken across ages, 8-year-olds took the longest to complete both versions but were able to complete the interviewer-administered version quicker than the self-complete version.
3.4. Inconsistency between Interviewer-Administered and Self-Complete Versions
Table 4 shows that the highest report of inconsistent responses between the interviewer-administered and self-complete versions was in the dimension of Pain or Discomfort. The highest inconsistency across dimensions is moving from reporting no problems on the self-complete version and some problems on the interviewer-administered version. An exception to this was the dimension of Worried, Sad or Unhappy and Pain or Discomfort where the highest inconsistency was reporting no problems on the interviewer-administered version but some problems on the self-complete version.
Table 4.
Inconsistent responses across dimensions on the self-complete and interviewer-administered dimension versions.
There were no significant inconsistencies noted by sex (x2 = 0.43, p = 0.980), age (x2 = 2.46, p = 0.640) or health condition (x2 = 7.8, p = 0.801).
3.5. Known-Group Validity
There were no significant differences in rank order correlations of dimension scores for either version (Table 5) by age, sex or health condition.
Table 5.
Spearman’s rank correlation of self-complete and interviewer-administered scores across health groups, age and sex.
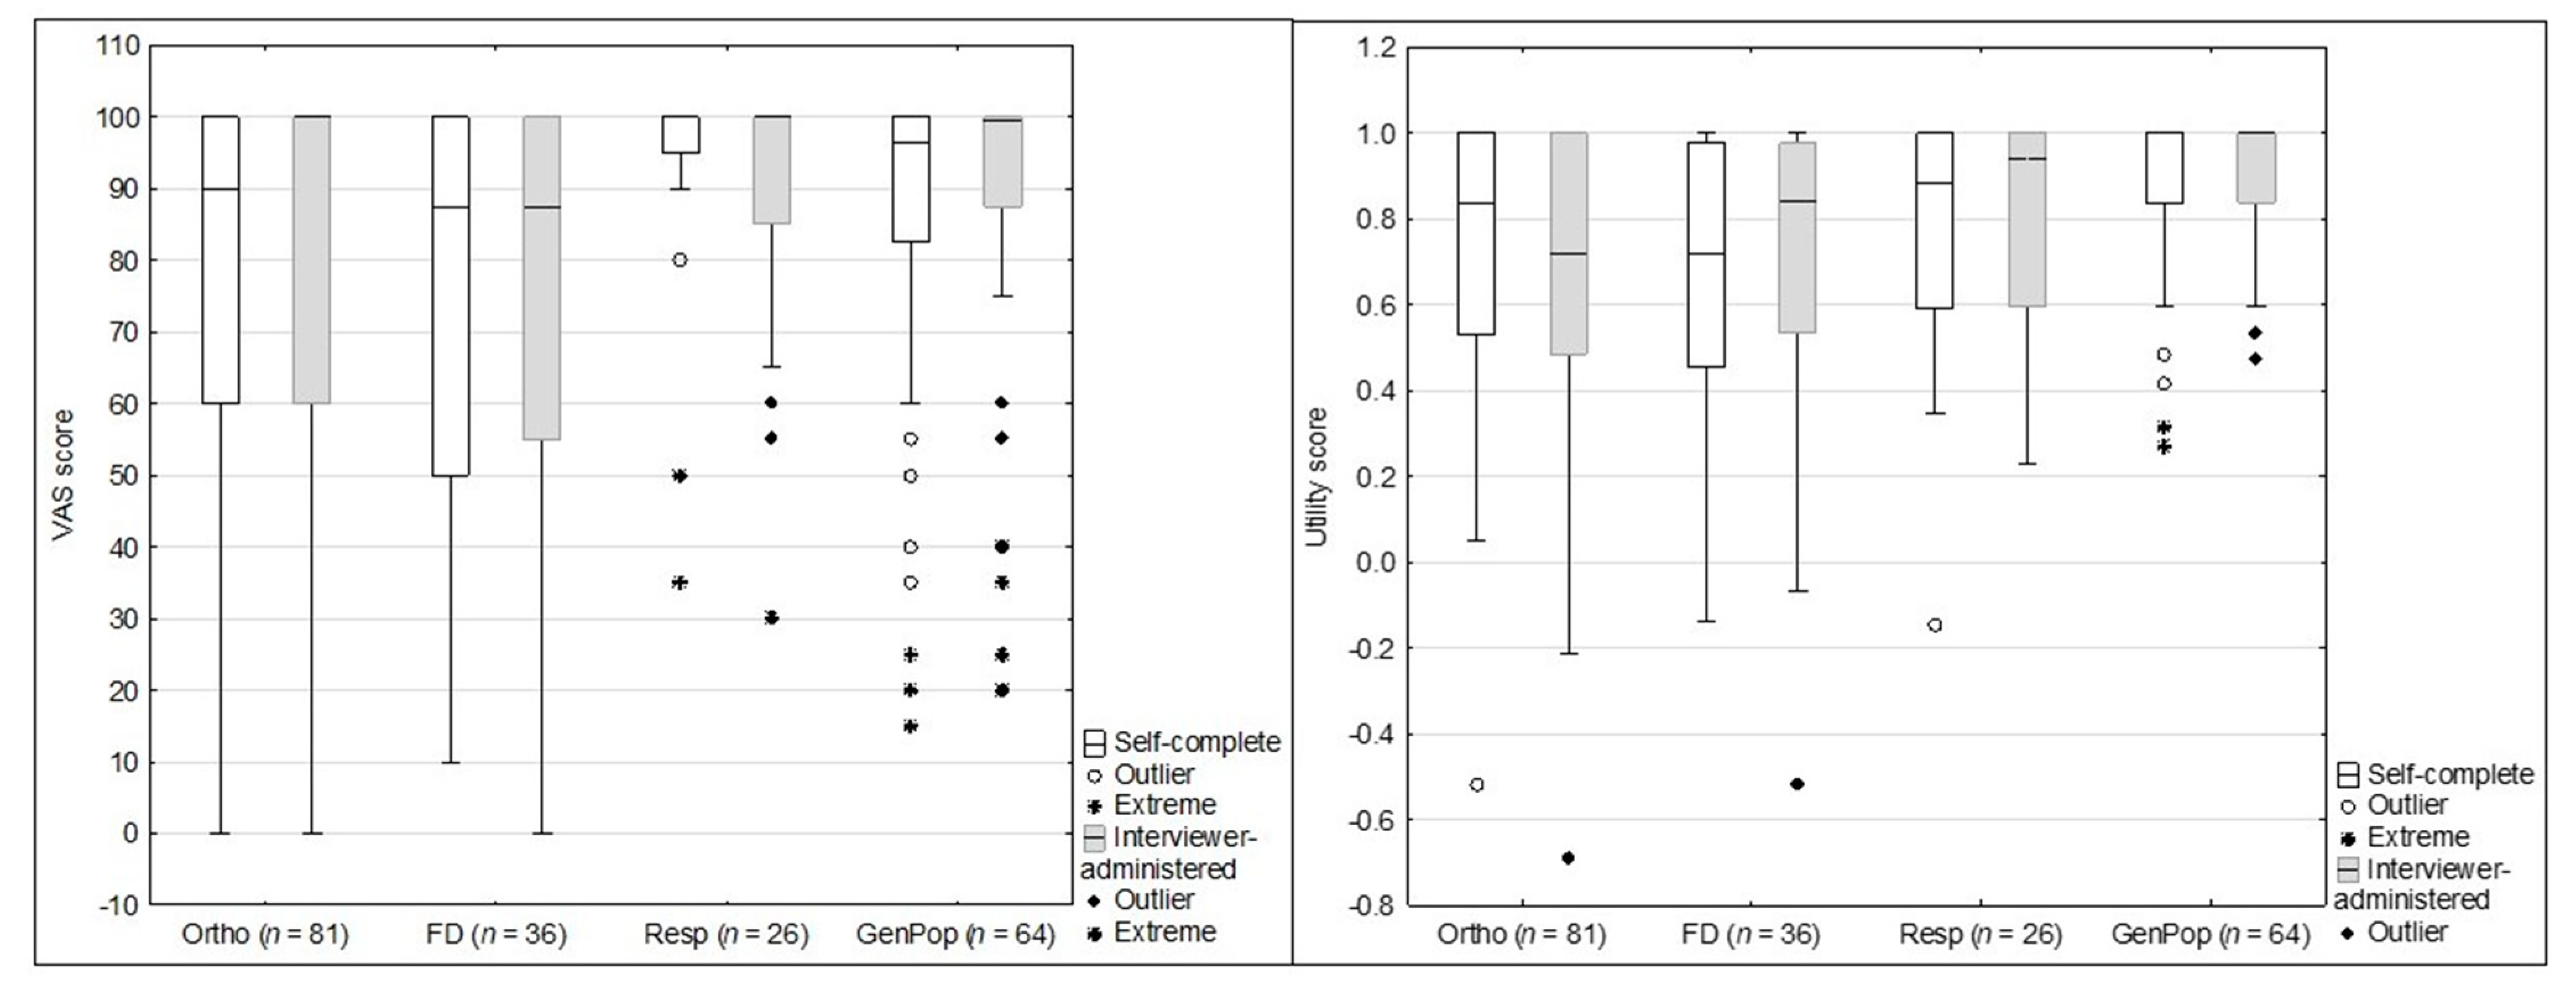
As seen in Figure 2, the utility scores (analysis with the Slovenian utility score is presented and there was no significant difference between results using the Slovenian or Japanese utility scores) were significantly different between groups on the self-complete version (H = 15.84, p = 0.001) and interviewer-administered version (H = 26.306, p < 0.001). Post-hoc analysis showed that differences on the self-complete version were between those from the general population and children with an acute orthopaedic condition and (H = −3.59, p = 0.001) and functional disability (H = −3.135, p = 0.002). The interviewer-administered version similarly found differences between the general population and an acute orthopaedic condition (H = 4.939, p < 0.001), functional disability (H = −3.252, p < 0.001) and additionally those with a chronic respiratory illness (H = −2.124, p < 0.001).
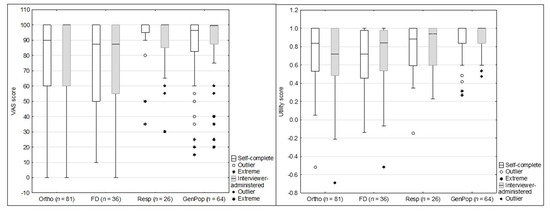
Figure 2.
VAS and utility scores for the self-complete and interviewer-administered versions across known health groups. Boxes indicate first (25th) to third (75th) quartiles, the dividing line indicates the median, whiskers indicate the remaining points up to the length of 1.5 times the interquartile range and markers indicate any remaining outliers.
The VAS score was significantly different between groups on the self-complete version (H = 15.84, p = 0.001) but not the interviewer-administered version (H = 6.59, p = 0.086). Post-hoc analysis showed differences on the self-complete version between children with a chronic respiratory illness and functional disability (H = −2.54, p = 0.011) and orthopaedic condition (H = 2.626, p = 0.009).
3.6. Concurrent Validity
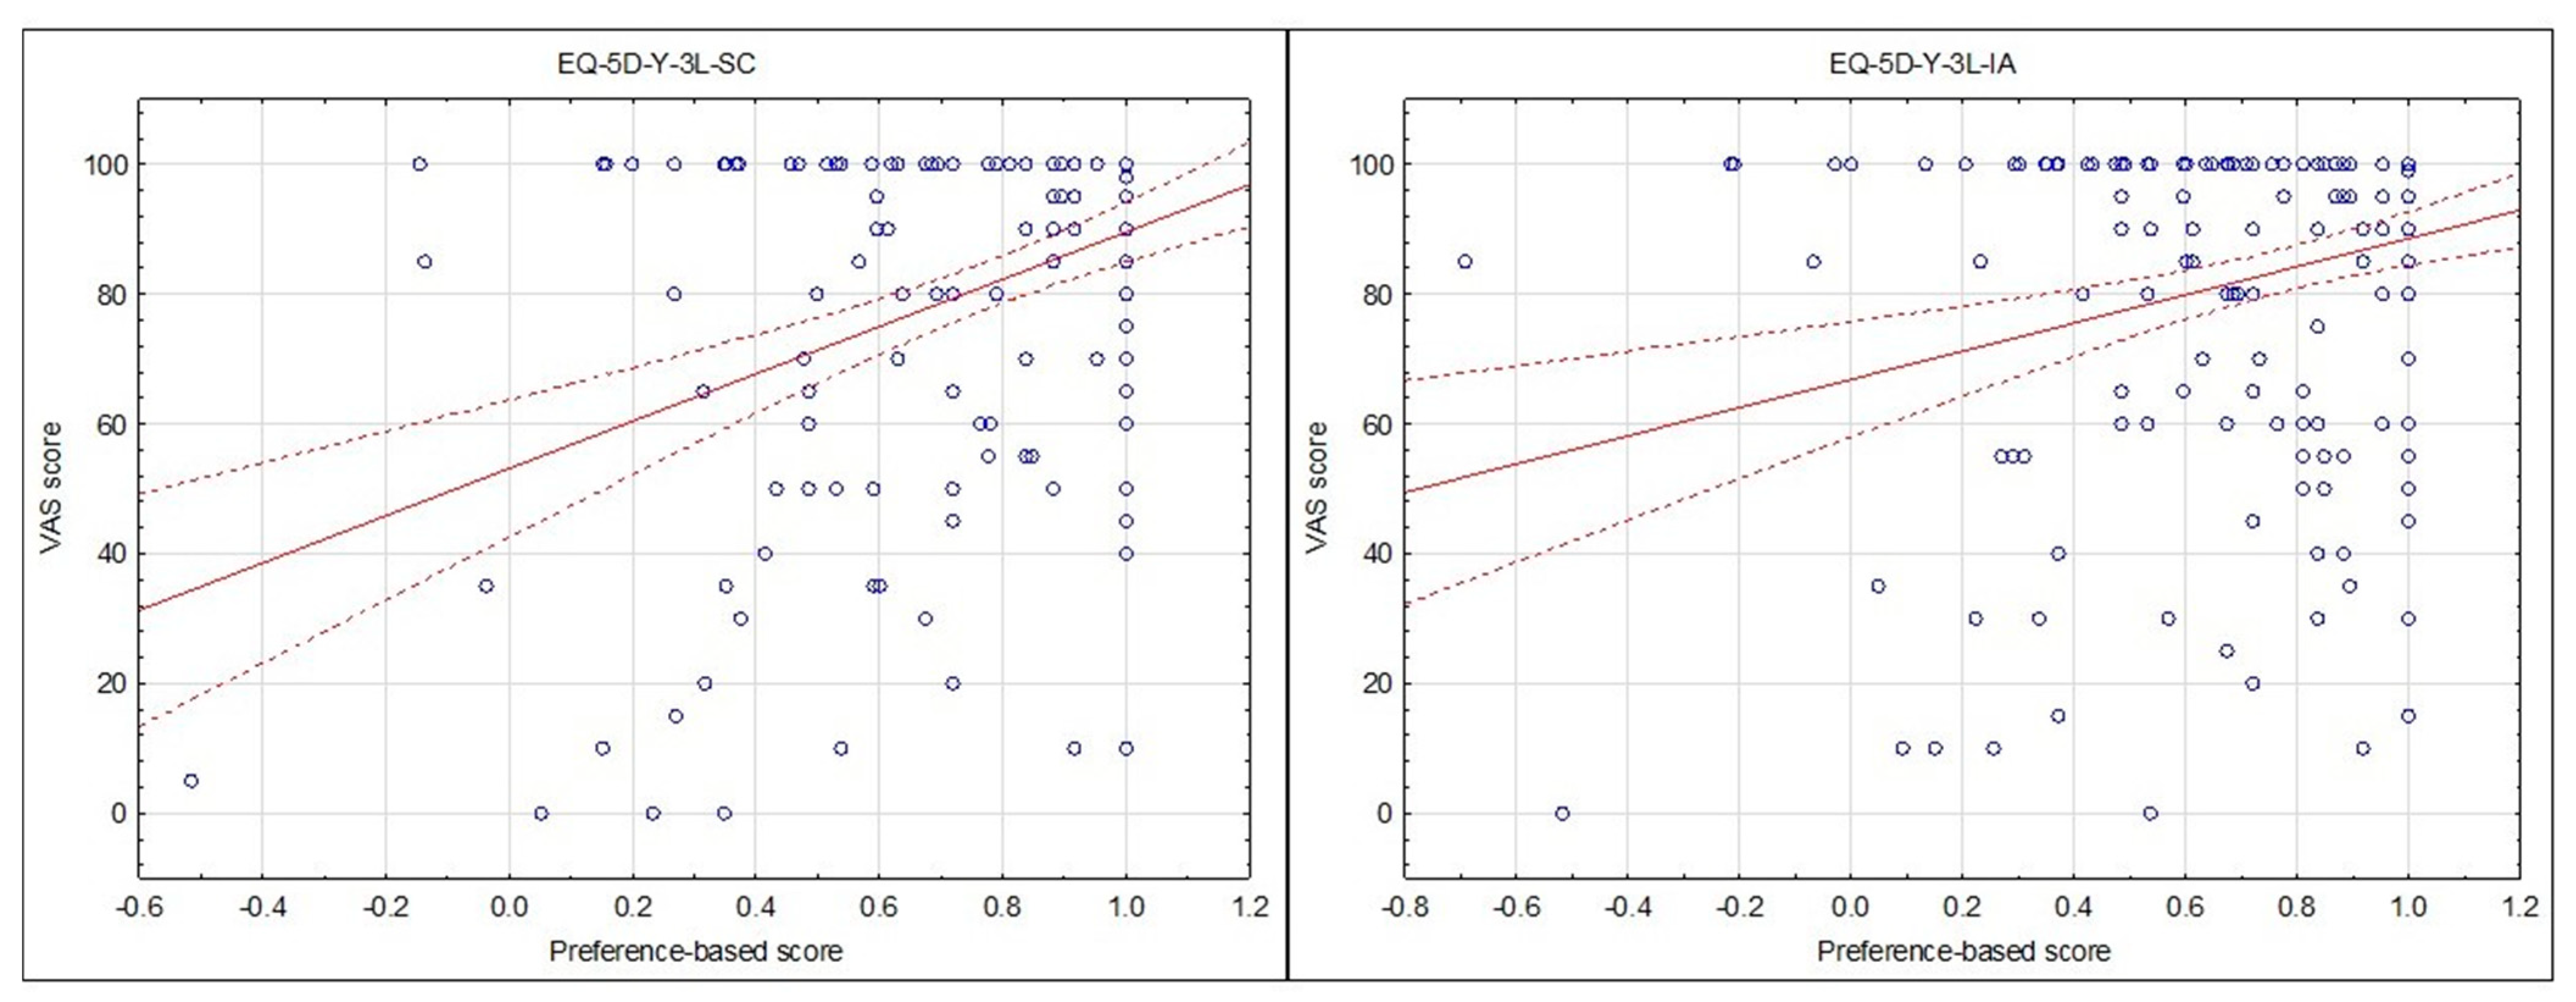
The concurrent validity was assessed via the correlation of the VAS score and utility score (analysis with the Slovenian utility score is presented and there was no significant difference between results using the Slovenian or Japanese utility scores), which was significant and moderate for the self-complete version (r = 0.38, p < 0.001) and significant and low for the interviewer-administered version (r = 0.27, p < 0.001). There was however no significant difference between the correlations on the interviewer-administered and self-complete versions (z = 1.34, p = 0.090) (Figure 3).
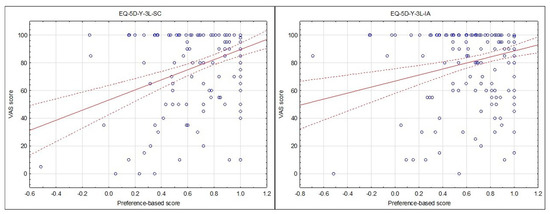
Figure 3.
Scatterplot of utility scores versus VAS scores for the EQ-5D-Y-3L Self-Complete (SC) and EQ-5D-Y-3L Interviewer-Administered (IA) versions in children 8–10 years (n = 207).
3.7. Convergent Validity
The dimension correlations between the self-complete and interviewer-administered versions were all high and significant. The gamma correlation for the physical dimensions of Mobility, Looking After Myself and Usual Activities showed similar high correlations with Pain or Discomfort and Worried, Sad or Unhappy showing lower correlations when considering all children aged 8–10 years (Table 6). The dimension of Mobility showed a significantly higher correlation than Pain or Discomfort (z = 2.28, p = 0.011) and Worried, Sad or Unhappy (z = 1.59, p = 0.05).
Table 6.
Gamma correlations of self-complete and interviewer-administered dimension responses.
The 8-year-olds showed significantly lower correlations than the 10-year-olds in the dimensions of Mobility (z = −2.88, p = 0.002), Usual Activities (z = −4.08, p < 0.001) and Pain or Discomfort (z = −3.75, p < 0.001). The 9-year-olds similarly showed significantly lower correlations than the 10-year-olds for dimensions of Mobility (z = −2.88, p = 0.002), Usual Activities (z = −3.17, p < 0.001), Pain or Discomfort (z = −2.88, p = 0.002) and Worried, Sad or Unhappy (z = −1.97, p = 0.020). However, the correlation for Looking After Myself was significantly higher in the 9-year-olds when compared to the 10-year-olds (z = 1.71, p = 0.04).
Both EQ-5D-Y-3L versions showed moderate to high convergent validity with individual items that were hypothesised to show an association and the dimension total scores on the WeeFIM, FPS-R and MFQ (Table 7). The only exception was the dimension of Usual Activities which showed no association with social interaction measured on the WeeFIM but showed low to moderate associations with the physical dimensions of the WeeFIM. There were significantly higher correlations on the WeeFIM and the interviewer-administered versions for items of locomotion, stairs, dressing and the total scores when compared to EQ-5D-Y-3L dimensions of Mobility and Looking After Myself.
Table 7.
Convergent validity of the self-complete and interviewer-administered version and corresponding items in the WeeFIM, Faces Scale-Revised and Moods and Feelings Questionnaire.
3.8. Preference between Versions
There were more 8–10-year-olds who preferred the EQ-5D-Y-3L interviewer-administered version (n = 125, 60%) compared to those who preferred the EQ-5D-Y-3L self-complete (n = 77, 37%) or had no preference (n = 5, 2%) (x2 = 21.87, p < 0.001). There was no significant difference between preferences for sex (x2 = 5.07, p = 0.079), age (x2 = 5.12, p = 0.275) or health conditions (x2 = 3.72, p = 0.715).
As seen in Table 8 the interviewer-administered version was preferred across all age groups as they reported that they did not yet have the literacy skills for self-completion: “I can’t read yet, I am still learning to read”. This was notably higher in those aged 8–9 years. However, the 10-year-olds did report that they preferred it to the self-complete version as it was easier, quicker, more understandable and factors associated with the interviewer (e.g., from Respondent “you read it nice and slow”), which could all indicate some difficulty with literacy. The general preference included children stating that it was “better” or “nicer”.
Table 8.
Reason for preference between the self-complete and interviewer-administered versions.
The preference for the self-complete version across the age groups was related to independence on completion with children stating, “I liked to do it on my own”. General preference for the measure was not specific and included “I liked it more, it was better”.
The reason for no preferences included: “both were fine”, “both were easy” or “I liked both”.
4. Discussion
This was the first study to compare the performance of the self-complete and interviewer-administered versions of the EQ-5D-Y-3L. The interviewer-administered version of the EQ-5D-Y-3L proved to be valid by performing as well as the self-complete version in children aged 8–10 years. The feasibility of the instrument is improved with no missing responses on the interviewer-administered version compared to 19% of missing responses on the self-complete version across the five dimensions. Considering the administration in a clinical setting, the interviewer-administered version was however feasible with a relatively low completion time of under three minutes (median = 110 s, IQR = 98 s, 124 s). This is lower than the times reported for self-complete on other generic measures of HRQoL, i.e., Child Health Utility-9D (CHU-9D) (3–5 min), Health Utilities Index (8–10 min), KIDSCREEN (5–20 min) and Paediatric Quality of Life Inventory 4.0 Generic Core Scales (PedsQL) (10–15 min) [27]. The results of the self-complete and interviewer-administered versions are comparable, which would further allow researchers to use the versions inter-changeably in a study and select a version most appropriate to the child’s literacy level and/or medical condition. As the number of missing responses was significantly higher in 8-year-olds, it may be beneficial to have targeted use of interviewer administration in settings where the literacy level may negatively influence self-completion. Based on the reasons for preference of the interviewer-administered version, this sample of children all struggled with literacy skills, and this decreased with the increasing age of the child with 25% of 8-year-olds using literacy skills as their reason followed by 23% in 9-year-olds and 18% in 10-year-olds. The low level of literacy skills may be a problem that is unique to the South African sample recruited, which is reported to have lower literacy levels in this age group compared to international levels [15]. Other reasons for preferring the interviewer-administered version may be associated with acquiescence bias [28], which is mostly associated with interviewer-administered versions rather than self-complete as participants often find it easier to respond with a positive response option, the simplest answer or the first answer [19]. In the context of the EQ-5D-Y-3L, this translates to reporting level one (no problems) therefore presenting with better HRQoL.
Concurrent validity between the utility and VAS scores were significant for the self-complete and interviewer-administered version (p < 0.001) but ranged from low (r = 0.28) to moderate (r = 0.38) in terms of associations. One would expect that the dimensions on the EQ-5D-Y-3L would account for the measure of general health as scored on the VAS and there would be no difference between the self-complete and interviewer-administered descriptive systems. The association between the scores was lower in this study than a previous comparison between the VAS and composite score in children with acute illness (r = −0.786, p < 0.001) [20]. Composite scores are a summary of the EQ-5D-Y-3L dimensions using quality-adjusted life year weightings as suggested by Craig et al. (2016) and therefore provide a total score for all five dimensions [29]. It should be noted though that Scott et al. (2017) did not find any association between the composite score and VAS in children with chronic illness or the general population [20]. As this study analysed a heterogenous group of children including those with acute and chronic illness and from the general population it could account for the lower correlation. This could be due to the disability paradox reported in previous studies where children with chronic health conditions, such as cystic fibrosis and functional disabilities, did not necessarily report poorer HRQoL as one would have expected, as children with long-term conditions often find ways to adapt to their environment or the manner in which they complete a task so that it suits their abilities [21,30,31]. Importantly, there was no difference between the utility and VAS scores on the self-complete and interviewer-administered version.
The inconsistency in responses between the interviewer-administered and self-complete versions, although not significant, may be attributed to social desirability bias [32] as face-to-face interviews have been shown to produce more socially desirable responses compared to self-complete versions as participants often feel as though they need to present themselves in the best way when interviewed [33]. Studies comparing these two modes of administration found that self-report instruments were mostly associated with poorer results while face-to-face interviews were associated with more positive results [34]. Similarly, when comparing HRQoL in asthmatic patients, a higher HRQoL was reported on the interviewer-administered version of the instrument [35]. Conversely, no meaningful difference was found between self-report and interviewer-administration when assessing HRQoL in children and adolescents with oral health conditions and adults with acquired immunodeficiency syndrome [36,37].
Inconsistencies in this study were most evident with the higher reporting of problems with Worried, Sad or Unhappy and Pain or Discomfort on the self-complete version. This was similarly noted by the lower correlation between Pain or Discomfort and the FPS-R on the self-complete (rs = 0.33) compared to the interviewer-administered version (rs = 0.38) and between Worried, Sad or Unhappy and the MFQ on the self-complete (rs = 0.17–0.33) compared to the interviewer-administered version (rs = 0.16–0.34). Conversely, there was a higher report of problems on the interviewer-administered versions for physical dimensions which may be attributed to observation bias. This may have been further strengthened by the interviewer being a physiotherapist and assessing functional ability on the WeeFIM. A similar observation was seen in a study by Scott et al. (2017) whereby 14% of children reported problems with Mobility which was not observed by the researcher on completion of the WeeFIM. It was found that the report of problems was not only associated with physical impairments but also environmental barriers linked to safety in the areas in which they live [20]. The influence of the interviewer may further be contributing to the significantly higher convergent validity noted with the interviewer-administered dimensions of Mobility and Looking After Myself and the corresponding interviewer-rated WeeFIM items. When looking at the psychosocial dimensions separately, the Worried, Sad or Unhappy dimension on both versions had a moderate association with the MFQ total and showed significant associations with individual items of feeling unhappy, lack of enjoyment during activities of daily living and feeling restless. However, the self-complete version showed slightly stronger associations compared to the interviewer-administered version. This study is the first to use the MFQ as a comparison to the Worried, Sad or Unhappy dimension on either version of the EQ-5D-Y-3L, and therefore, comparisons to other studies were unfortunately not possible. Previous studies have tested convergent validity of the Worried, Sad or Unhappy dimension against psychosocial dimensions on other generic HRQoL instruments such as the KIDSCREEN, PedsQL and CHU-9D and found strong associations between instruments [7,38]. The Pain or Discomfort dimension has previously been compared to the FPS-R, which showed a significant correlation between instruments for acutely ill children only (p < 0.001) [20]. Similarly, significant and moderate associations were found in this study between the FPS-R and the interviewer-administered version (rs = 0.33, p <0.001) and self-complete version (rs = 0.38, p < 0.001) with no significant difference between versions (p = 0.281). As a result, this may suggest that the Pain or Discomfort dimension was accurately able to reflect children’s experience of feeling pain and/or discomfort using either version. Assessing psychosocial dimensions remains a challenge due to its subjectivity when compared to physical dimensions such as Mobility, Looking After Myself and Usual Activities, which may be objectively observed [28], therefore, physical dimensions were expected to present with better convergent validity between instruments than psychosocial dimensions. At a dimension level, there was no difference in the ranking by sex, age or health condition, but at a composite level, there were differences in the utility scores between those with and without a health condition on both versions. It is noteworthy that the difference between those with a chronic respiratory illness and the general population was only noted on the interviewer-administered version. This was an expected difference but could not be attributed to any single factor, but it is likely multi-factorial with a difference in reporting of health improved understanding on the interviewer-administered version and/or bias.
The general population group was from the same geographical catchment area as the tertiary paediatric hospital from where those with a health condition were recruited. The issues found seemed to be reflective of the general population; the results cannot be generalised to the greater Western Cape region as no data on race, home language or socioeconomic status were collected for comparison to the general population of the Western Cape.
5. Conclusions
The EQ-5D-Y-3L interviewer-administered version is valid and reliable for use in children aged 8–10 years. The results were comparable to the self-complete version indicating that versions can be used interchangeably based on the ability of the child instead of defaulting to proxy report if the child is unable to self-complete the PROM.
The feasibility of the interviewer-administered version is supported by the lack of missing responses; therefore, the burden of interview administration, with regards to increased time and resources [36,39], may be outweighed by the benefit of reduction in missing responses.
Further studies are recommended to assess whether social desirability bias significantly impacts the reporting of Worried, Sad or Unhappy and Pain or Discomfort in children with conditions that are hypothesised to impact these dimensions, i.e., children experiencing anxiety and/or depression and children with acute pain.
Author Contributions
Conceptualization, J.V. and D.S.; data curation, R.A.; formal analysis, R.A., J.V. and D.S.; funding acquisition, J.V. and D.S.; investigation, R.A.; methodology, J.V. and D.S.; project administration, R.A., J.V. and D.S.; supervision, J.V. and D.S.; visualization, R.A., J.V. and D.S.; writing—original draft, R.A., J.V. and D.S.; writing—review and editing, R.A., J.V. and D.S. All authors have read and agreed to the published version of the manuscript.
Funding
This research was funded by EuroQoL Research Foundation, project EQ142-2020RA.
Institutional Review Board Statement
The study was conducted according to the guidelines of the Declaration of Helsinki and approved by the Institutional Review Board (or Ethics Committee) of the University of Cape Town, Faculty of Health Sciences (HREC 369_2020, 14 August 2020).
Informed Consent Statement
No identifying information has been included in this manuscript. All participants consented to the publication of the analyzed data.
Data Availability Statement
The data presented in this study are available on request from the corresponding author. The data are not publicly available as per the ethical permission obtained so as to ensure anonymity and confidentiality of participants and their information.
Conflicts of Interest
Janine Verstraete and Desiree Scott are members of the EuroQoL Research Group. This did not influence any reporting in the research study. The views expressed by the authors in the publication do not necessarily reflect the views of the EuroQoL group.
References
- Kreimeier, S.; Greiner, W. EQ-5D-Y as a Health-Related Quality of Life Instrument for Children and Adolescents: The Instrument’s Characteristics, Development, Current Use, and Challenges of Developing Its Value Set. Value Health 2019, 22, 31–37. [Google Scholar] [CrossRef] [Green Version]
- Matza, L.S.; Patrick, D.L.; Riley, A.W.; Alexander, J.J.; Rajmil, L.; Pleil, A.M.; Bullinger, M. Pediatric patient-reported outcome instruments for research to support medical product labeling: Report of the ISPOR PRO good research practices for the assessment of children and adolescents task force. Value Health 2013, 16, 461–479. [Google Scholar] [CrossRef] [Green Version]
- Kenzik, K.M.; Tuli, S.Y.; Revicki, D.A.; Shenkman, E.A.; Huang, I.C. Comparison of 4 pediatric health-related quality-of-life instruments: A study on a Medicaid population. Med. Decis. Mak. 2014, 34, 590–602. [Google Scholar] [CrossRef] [PubMed] [Green Version]
- Wille, N.; Badia, X.; Bonsel, G.; Burström, K.; Cavrini, G.; Devlin, N.; Egmar, A.C.; Greiner, W.; Gusi, N.; Herdman, M.; et al. Development of the EQ-5D-Y: A child-friendly version of the EQ-5D. Qual. Life Res. 2010, 19, 875–886. [Google Scholar] [CrossRef] [PubMed] [Green Version]
- Varni, J.W.; Burwinkle, T.M.; Lane, M.M. Health-related quality of life measurement in pediatric clinical practice: An appraisal and precept for future research and application. Health Qual. Life Outcomes 2005, 3, 34. [Google Scholar] [CrossRef] [Green Version]
- Scalone, L.; Tomasetto, C.; Matteucci, M.C.; Selleri, P.; Broccoli, S.; Pacelli, B.; Cavrini, G. Assessing quality of life in children and adolescents: Development and validation of the Italian version of the EQ-5D-Y. Ital. J. Public Health 2011, 8, 331–341. [Google Scholar]
- Ravens-Sieberer, U.; Wille, N.; Badia, X.; Bonsel, G.; Burström, K.; Cavrini, G.; Devlin, N.; Egmar, A.C.; Gusi, N.; Herdman, M.; et al. Feasibility, reliability, and validity of the EQ-5D-Y: Results from a multinational study. Qual. Life Res. 2010, 19, 887–897. [Google Scholar] [CrossRef] [PubMed] [Green Version]
- Scott, D.; Scott, C.; Jelsma, J.; Abraham, D.; Verstraete, J. Validity and feasibility of the self-report EQ-5D-Y generic Health-related Quality of Life outcome measure in children and adolescents with Juvenile Idiopathic Arthritis in Western Cape, South Africa. S. Afr. J. Physiother. 2019, 75, 1–9. [Google Scholar] [CrossRef] [PubMed] [Green Version]
- Kim, S.K.; Jo, M.W.; Kim, S.H. A cross sectional survey on health-related quality of life of elementary school students using the Korean version of the EQ-5D-Y. Peer-Rev. J. 2017, 5, e3115. [Google Scholar] [CrossRef] [PubMed]
- Varni, J.W.; Limbers, C.A.; Burwinkle, T.M. How young can children reliably and validly self-report their health-related quality of life? An analysis of 8591 children across age subgroups with the PedsQLTM 4.0 Generic Core Scales. Health Qual. Life Outcomes 2007, 5, 1–13. [Google Scholar] [CrossRef] [Green Version]
- EuroQol Research Foundation. EQ-5D-Y User Guide. EuroQol Research Foundation 2020 [Internet]. Available online: www.impact-test.co.uk (accessed on 20 September 2020).
- Prevolnik Rupel, V.; Ogorevc, M.; Greiner, W.; Kreimeier, S.; Ludwig, K.; Ramos-Goni, J.M. EQ-5D-Y Value Set for Slovenia. PharmacoEconomics 2021, 39, 463–471. [Google Scholar] [CrossRef] [PubMed]
- Shiroiwa, T.; Ikeda, S.; Noto, S.; Fukuda, T.; Stolk, E. Valuation Survey of EQ-5D-Y Based on the International Common Protocol: Development of a Value Set in Japan. Med. Decis. Mak. 2021, 41, 597–606. [Google Scholar] [CrossRef]
- Ramos-Goñi, J.M.; Oppe, M.; Stolk, E.; Shah, K.; Kreimeier, S.; Rivero-Arias, O.; Devlin, N. International Valuation Protocol for the EQ-5D-Y-3L. Pharmacoeconomics 2020, 38, 653–663. [Google Scholar] [CrossRef] [PubMed] [Green Version]
- Howie, S.J.; Combrinck, C.; Roux, K.; Tshele, M.; Mokoena, G.M.; McLeod Palane, N. PIRLS Literacy 2016: South African Highlights Report; University of Pretoria: Pretoria, South Africa, 2017; pp. 1–12. [Google Scholar]
- Ferguson, G.D.; Jelsma, J.; Derrett, S. The use of the Visual Analogue Scale in the European Quality of Life -5 Dimension Scale- Youth Version (EQ5DY). In Proceedings of the 1st EuroQol African Regional Meeting, Cape Town, South Africa, 13–14 February 2020. [Google Scholar]
- Janssens, A.; Thompson Coon, J.; Rogers, M.; Allen, K.; Green, C.; Jenkinson, C.; Tennant, A.; Logan, S.; Morris, C. A systematic review of generic multidimensional patient-reported outcome measures for children, part I: Descriptive characteristics. Value Health 2015, 18, 315–333. [Google Scholar] [CrossRef] [Green Version]
- Verstraete, J.; Lloyd, A.; Scott, D.; Jelsma, J. How does the EQ-5D-Y Proxy version 1 perform in 3, 4 and 5-year-old children? Health Qual. Life Outcomes 2020, 18, 1–10. [Google Scholar] [CrossRef]
- Petrou, S. Methodological issues raised by preference-based approaches to measuring the health status of children. Health Econ. 2003, 12, 697–702. [Google Scholar] [CrossRef] [PubMed]
- Scott, D.; Ferguson, G.D.; Jelsma, J. The use of the EQ-5D-Y health related quality of life outcome measure in children in the Western Cape, South Africa: Psychometric properties, feasibility and usefulnes—A longitudinal, analytical study. Health Qual. Life Outcomes 2017, 15, 12. [Google Scholar] [CrossRef] [Green Version]
- Jelsma, J.; Ramma, L. How do children at special schools and their parents perceive their HRQoL compared to children at open schools? Health Qual. Life Outcomes 2010, 8, 72. [Google Scholar] [CrossRef] [Green Version]
- Åström, M.; Persson, C.; Lindén-Boström, M.; Rolfson, O.; Burström, K. Population health status based on the EQ-5D-Y-3L among adolescents in Sweden: Results by sociodemographic factors and self-reported comorbidity. Qual. Life Res. 2018, 27, 2859–2871. [Google Scholar] [CrossRef] [PubMed] [Green Version]
- Angold, A.; Costello, J.; Van Kämmen, W.; Stouthamer-Loeber, M. Development of a short questionnaire for use in epidemiological studies of depression in children and adolescents: Factor composition and structure across development. Int. J. Methods Psychiatr. Res. 1996, 5, 251–262. [Google Scholar]
- Graham, J.E.; Granger, C.V.; Karmarkar, A.M.; Deutsch, A.; Niewczyk, P.; Divita, M.A.; Ottenbacher, K.J. The uniform data system for medical rehabilitation: Report of follow-up information on patients discharged from inpatient rehabilitation programs in 2002–2010. Am. J. Phys. Med. Rehabil. 2014, 93, 231–244. [Google Scholar] [CrossRef] [PubMed] [Green Version]
- Ottenbacher, K.J.; Msall, M.E.; Lyon, N.; Duffy, L.C.; Ziviani, J.; Granger, C.V.; Braun, S.; Feidler, R.C. The WeeFIM instrument: Its utility in detecting change in children with developmental disabilities. Arch. Phys. Med. Rehabil. 2000, 81, 1317–1326. [Google Scholar] [CrossRef] [PubMed] [Green Version]
- World Medical Association Declaration of Helsinki Ethical Principles for Medical Research Involving Human Subjects. J. Am. Med. Assoc. 2013, 310, 2191–2194. [CrossRef] [PubMed] [Green Version]
- Canaway, A.G.; Frew, E.J. Measuring preference-based quality of life in children aged 6–7 years: A comparison of the performance of the CHU-9D and EQ-5D-Y—The WAVES Pilot Study. Qual. Life Res. 2013, 22, 173–183. [Google Scholar] [CrossRef]
- Olsen, J.A.; Misajon, R.A. A conceptual map of health-related quality of life dimensions: Key lessons for a new instrument. Qual. Life Res. 2020, 29, 733–743. [Google Scholar] [CrossRef] [Green Version]
- Craig, B.M.; Greiner, W.; Brown, D.S.; Reeve, B.B. Valuation of child health-related quality of life in the United States. Health Econ. 2016, 25, 768–777. [Google Scholar] [CrossRef]
- Huber, M.; André Knottnerus, J.; Green, L.; Van Der Horst, H.; Jadad, A.R.; Kromhout, D.; Leonard, B.; Lorig, K.; Loureiro, M.I.; Van Der Meer, J.W.M.; et al. How should we define health? Br. Med. J. 2011, 343, d4163. [Google Scholar] [CrossRef] [Green Version]
- Eidt-Koch, D.; Mittendorf, T.; Greiner, W. Cross-sectional validity of the EQ-5D-Y as a generic health outcome instrument in children and adolescents with cystic fibrosis in Germany. BioMed Cent. Pediatrics 2009, 9, 55. [Google Scholar] [CrossRef] [Green Version]
- Nederhof, A.J. Methods of coping with social desirability bias: A review. Eur. J. Soc. Psychol. 1985, 15, 263–280. [Google Scholar] [CrossRef]
- Bowling, A. Mode of questionnaire administration can have serious effects on data quality. J. Public Health 2005, 27, 281–291. [Google Scholar] [CrossRef] [Green Version]
- Lang, F.R.; John, D.; Lüdtke, O.; Schupp, J.; Wagner, G.G. Short assessment of the Big Five: Robust across survey methods except telephone interviewing. Behav. Res. Methods 2011, 43, 548–567. [Google Scholar] [CrossRef] [Green Version]
- Cook, D.J.; Guyatt, G.H.; Juniper, E.; Griffith, L.; McIlroy, W.; Willan, A.; Jaeschke, R.; Epstein, R. Interviewer versus self-administered questionnaires in developing a disease-specific, health-related quality of life instrument for asthma. J. Clin. Epidemiol. 1993, 46, 529–534. [Google Scholar] [CrossRef]
- Tsakos, G.; Bernabé, E.; O’Brien, K.; Sheiham, A.; de Oliveira, C. Comparison of the self-administered and interviewer-administered modes of the child-OIDP. Health Qual. Life Outcomes 2008, 6, 40. [Google Scholar] [CrossRef] [PubMed] [Green Version]
- Puhan, M.A.; Ahuja, A.; Van Natta, M.L.; Ackatz, L.E.; Meinert, C. Interviewer versus self-administered health-related quality of life questionnaires—Does it matter? Health Qual. Life Outcomes 2011, 9, 30. [Google Scholar] [CrossRef] [PubMed] [Green Version]
- Chen, G.; Flynn, T.; Stevens, K.; Brazier, J.; Huynh, E.; Sawyer, M.; Roberts, R.; Ratcliffe, J. Assessing the Health-Related Quality of Life of Australian Adolescents: An Empirical Comparison of the Child Health Utility 9D and EQ-5D-Y Instruments. Value Health 2015, 18, 432–438. [Google Scholar] [CrossRef] [PubMed] [Green Version]
- Lozano, F.; Lobos, J.M.; March, J.R.; Carrasco, E.; Barros, M.B.; González-Porras, J.R. Self-administered versus interview-based questionnaires among patients with intermittent claudication: Do they give different results? A cross-sectional study. Sao Paulo Med. J. 2016, 134, 63–69. [Google Scholar] [CrossRef] [PubMed] [Green Version]

Publisher’s Note: MDPI stays neutral with regard to jurisdictional claims in published maps and institutional affiliations. |
© 2022 by the authors. Licensee MDPI, Basel, Switzerland. This article is an open access article distributed under the terms and conditions of the Creative Commons Attribution (CC BY) license (https://creativecommons.org/licenses/by/4.0/).