A Reverse Design Method for Convective PCR Chips Featuring Precise Control of Steady-State Flow Fields


Abstract
1. Introduction
2. Materials and Methods
2.1. Modeling
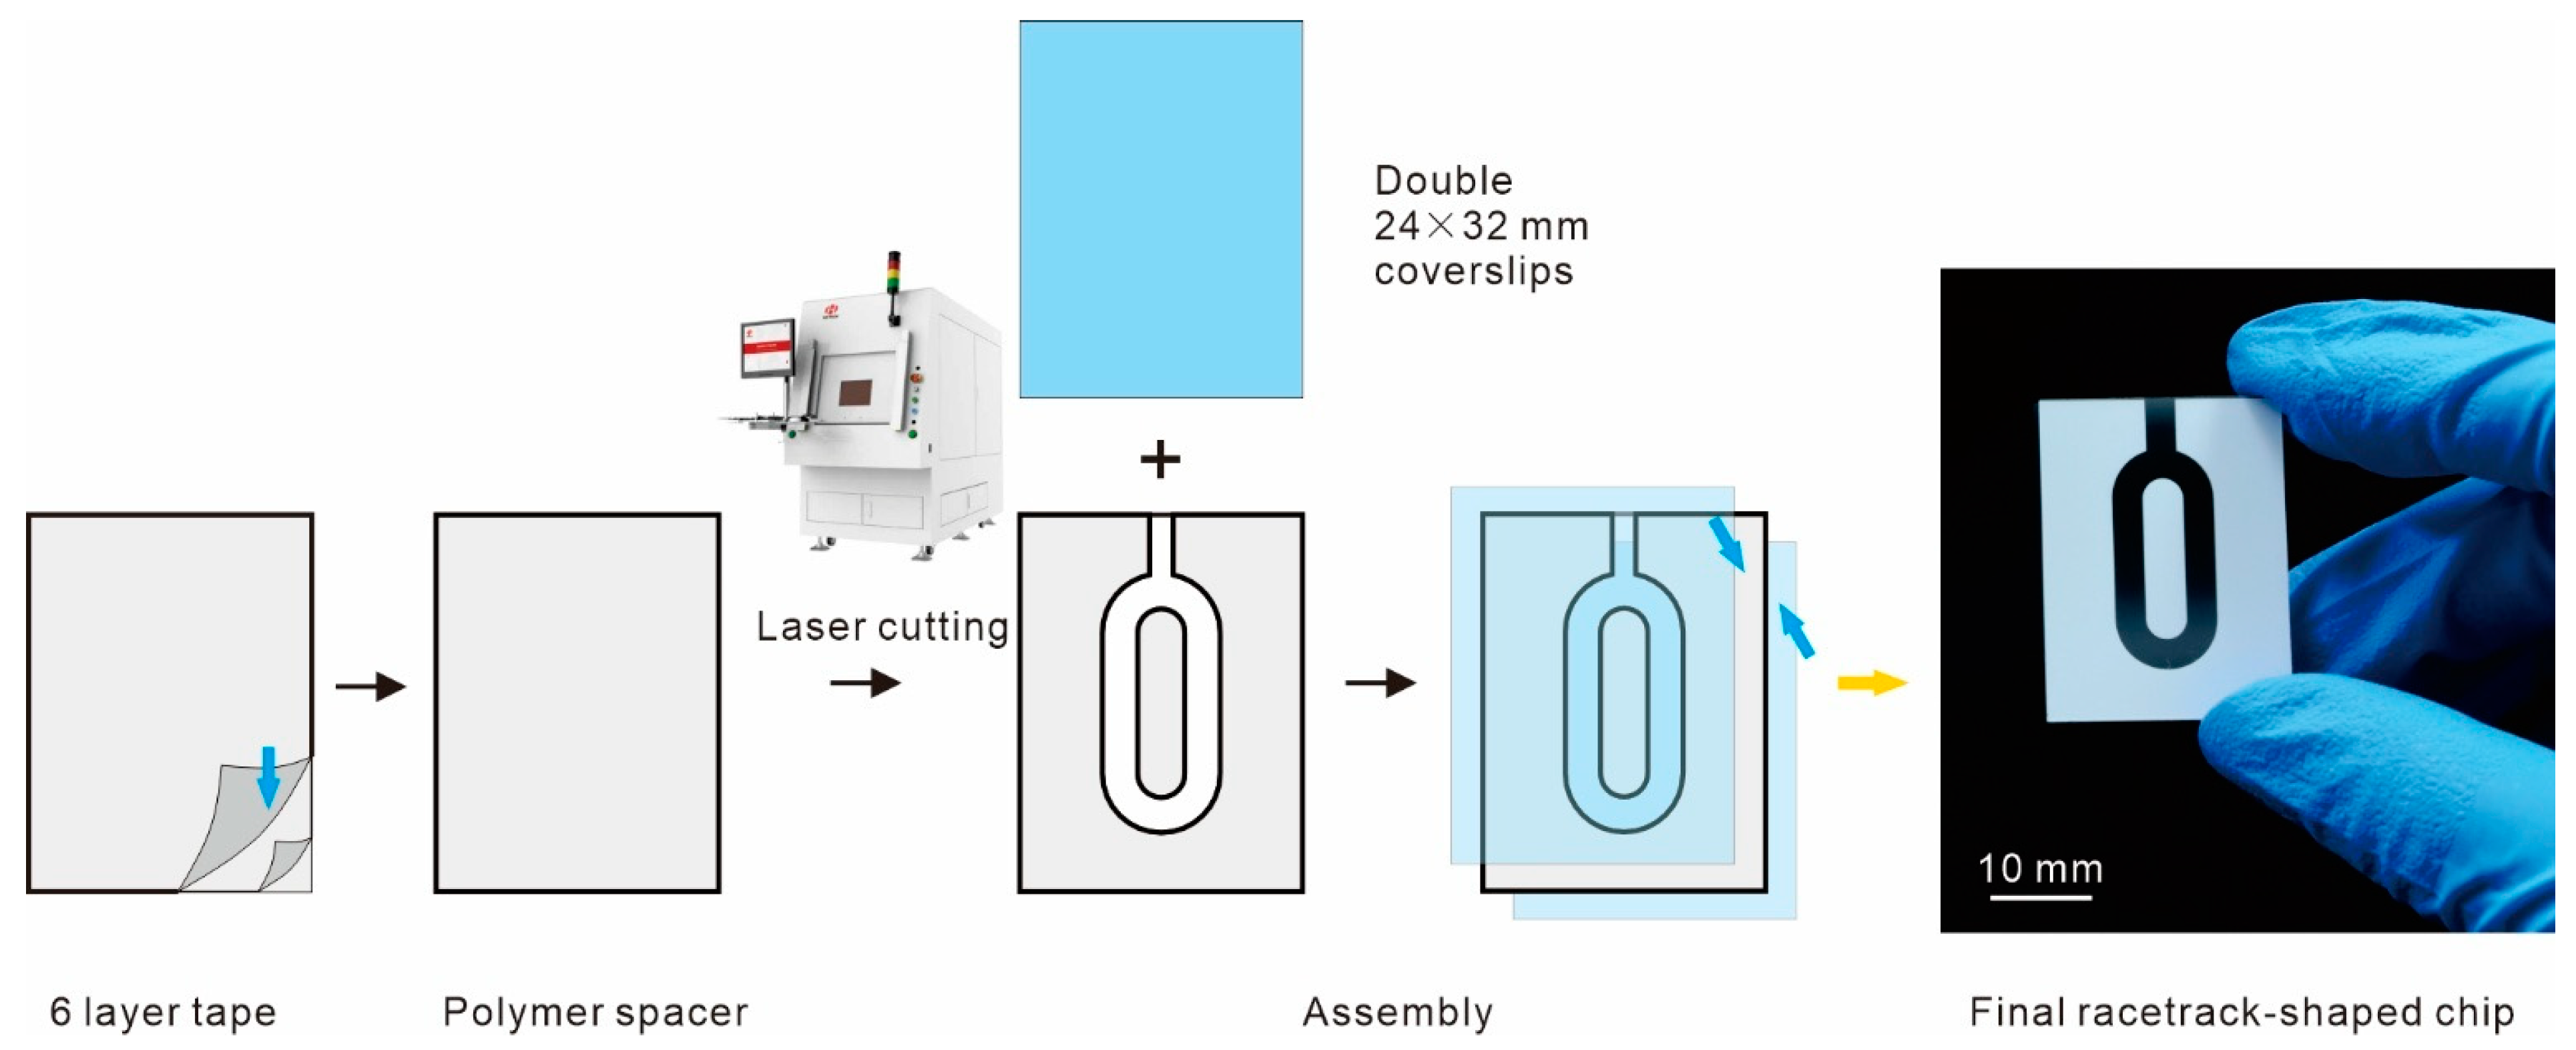
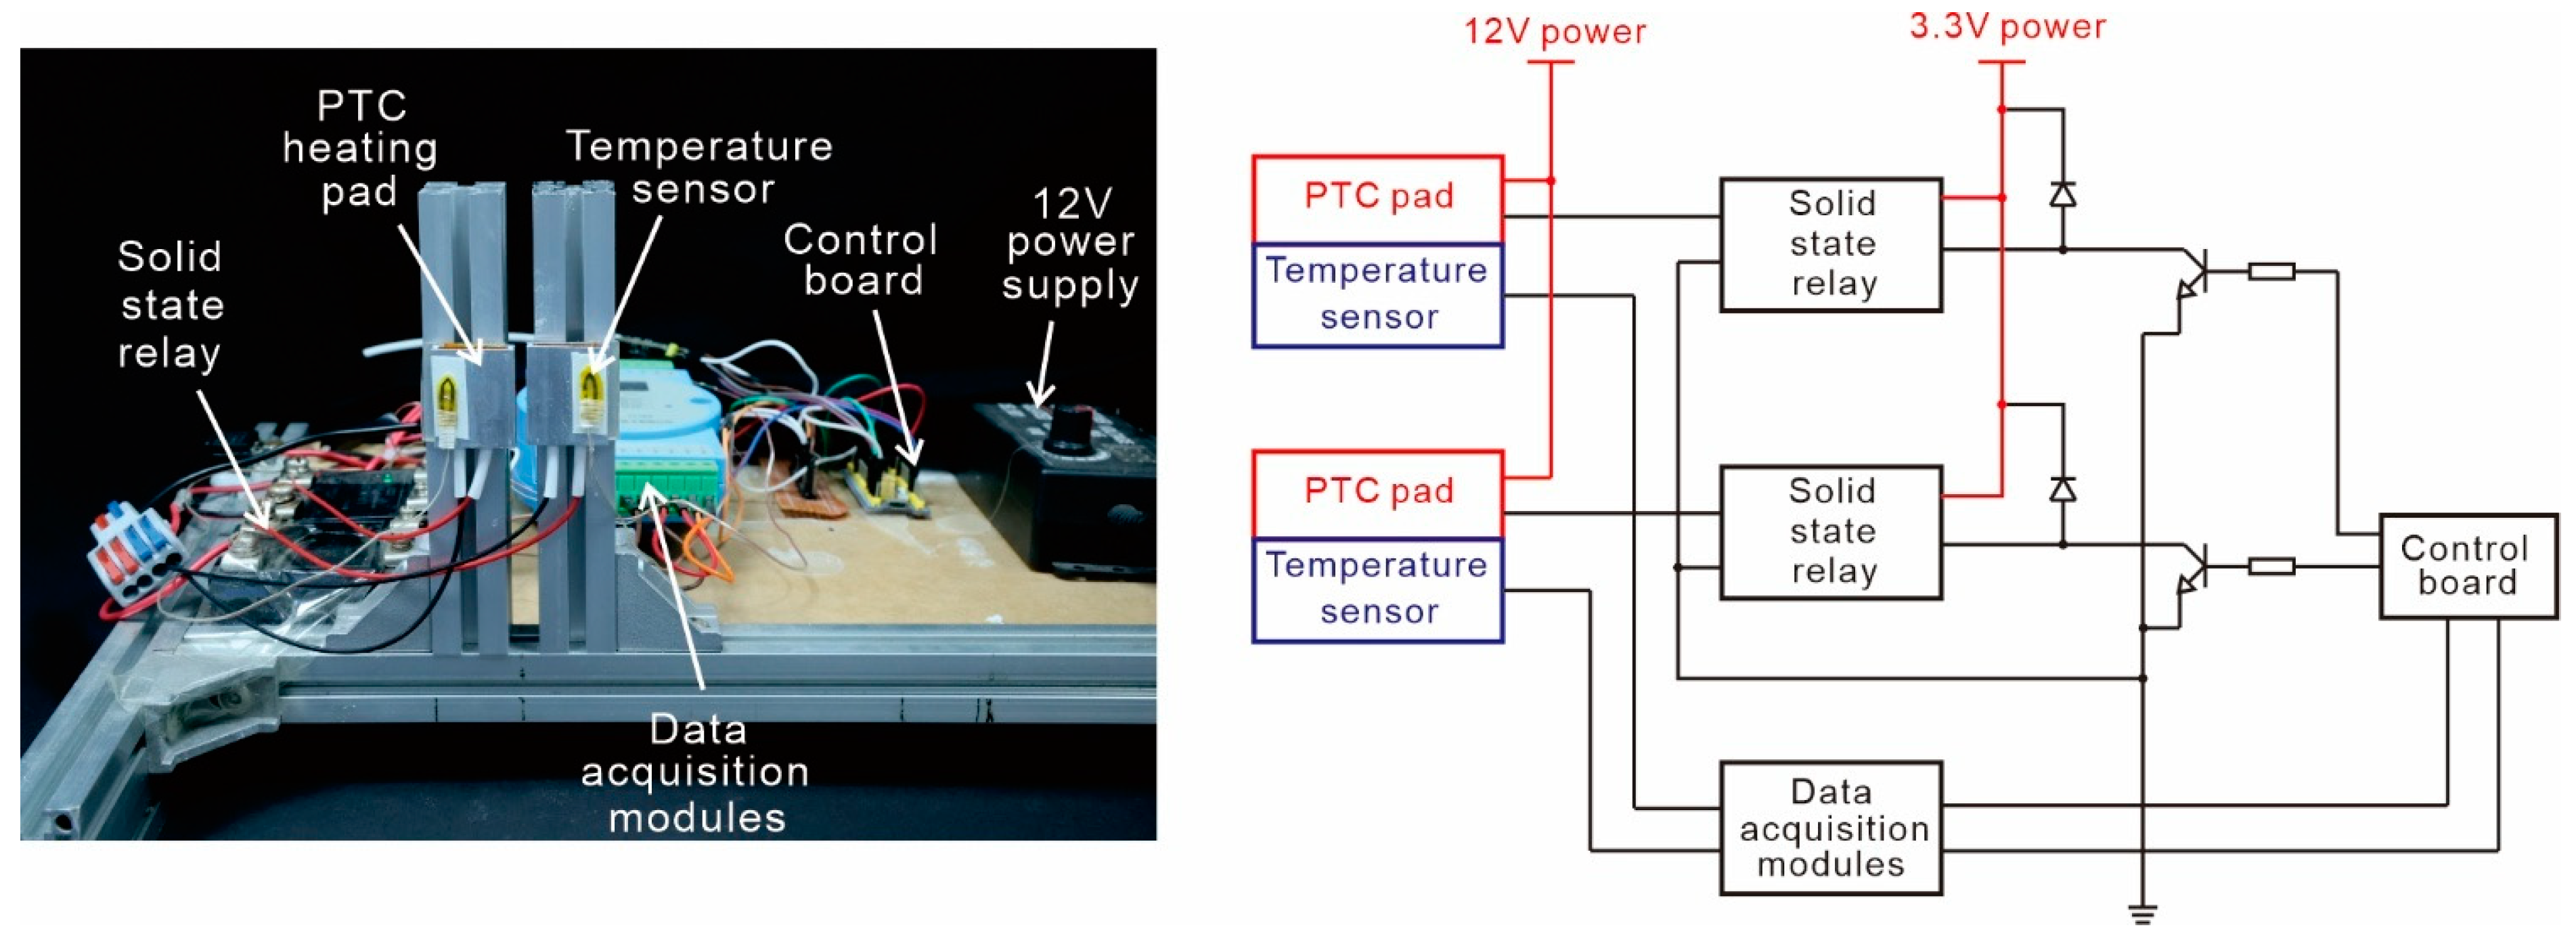
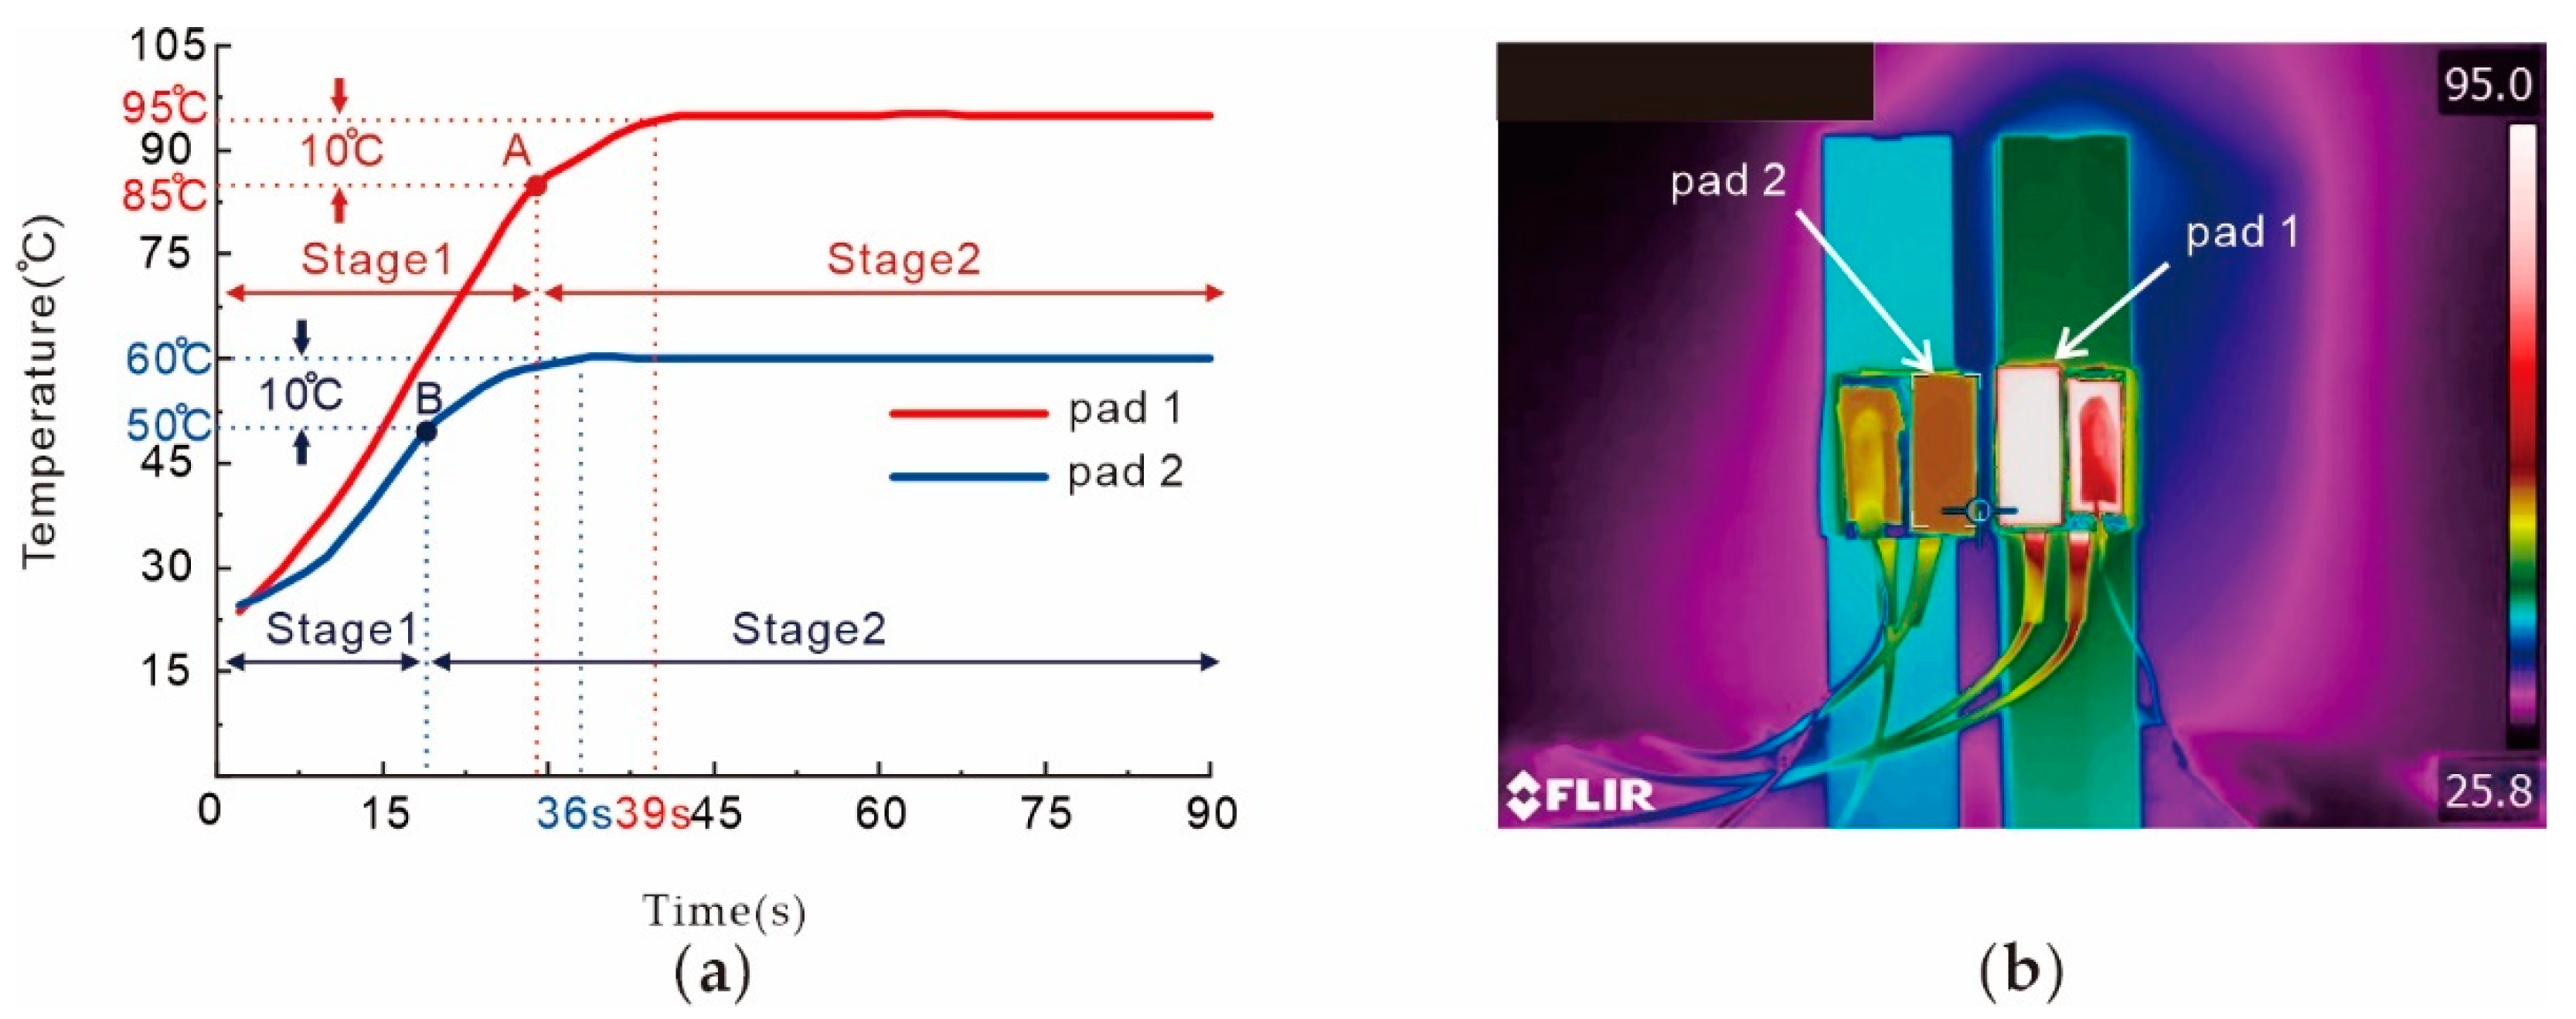
2.2. Chip Fabrication and Temperature Control Platform
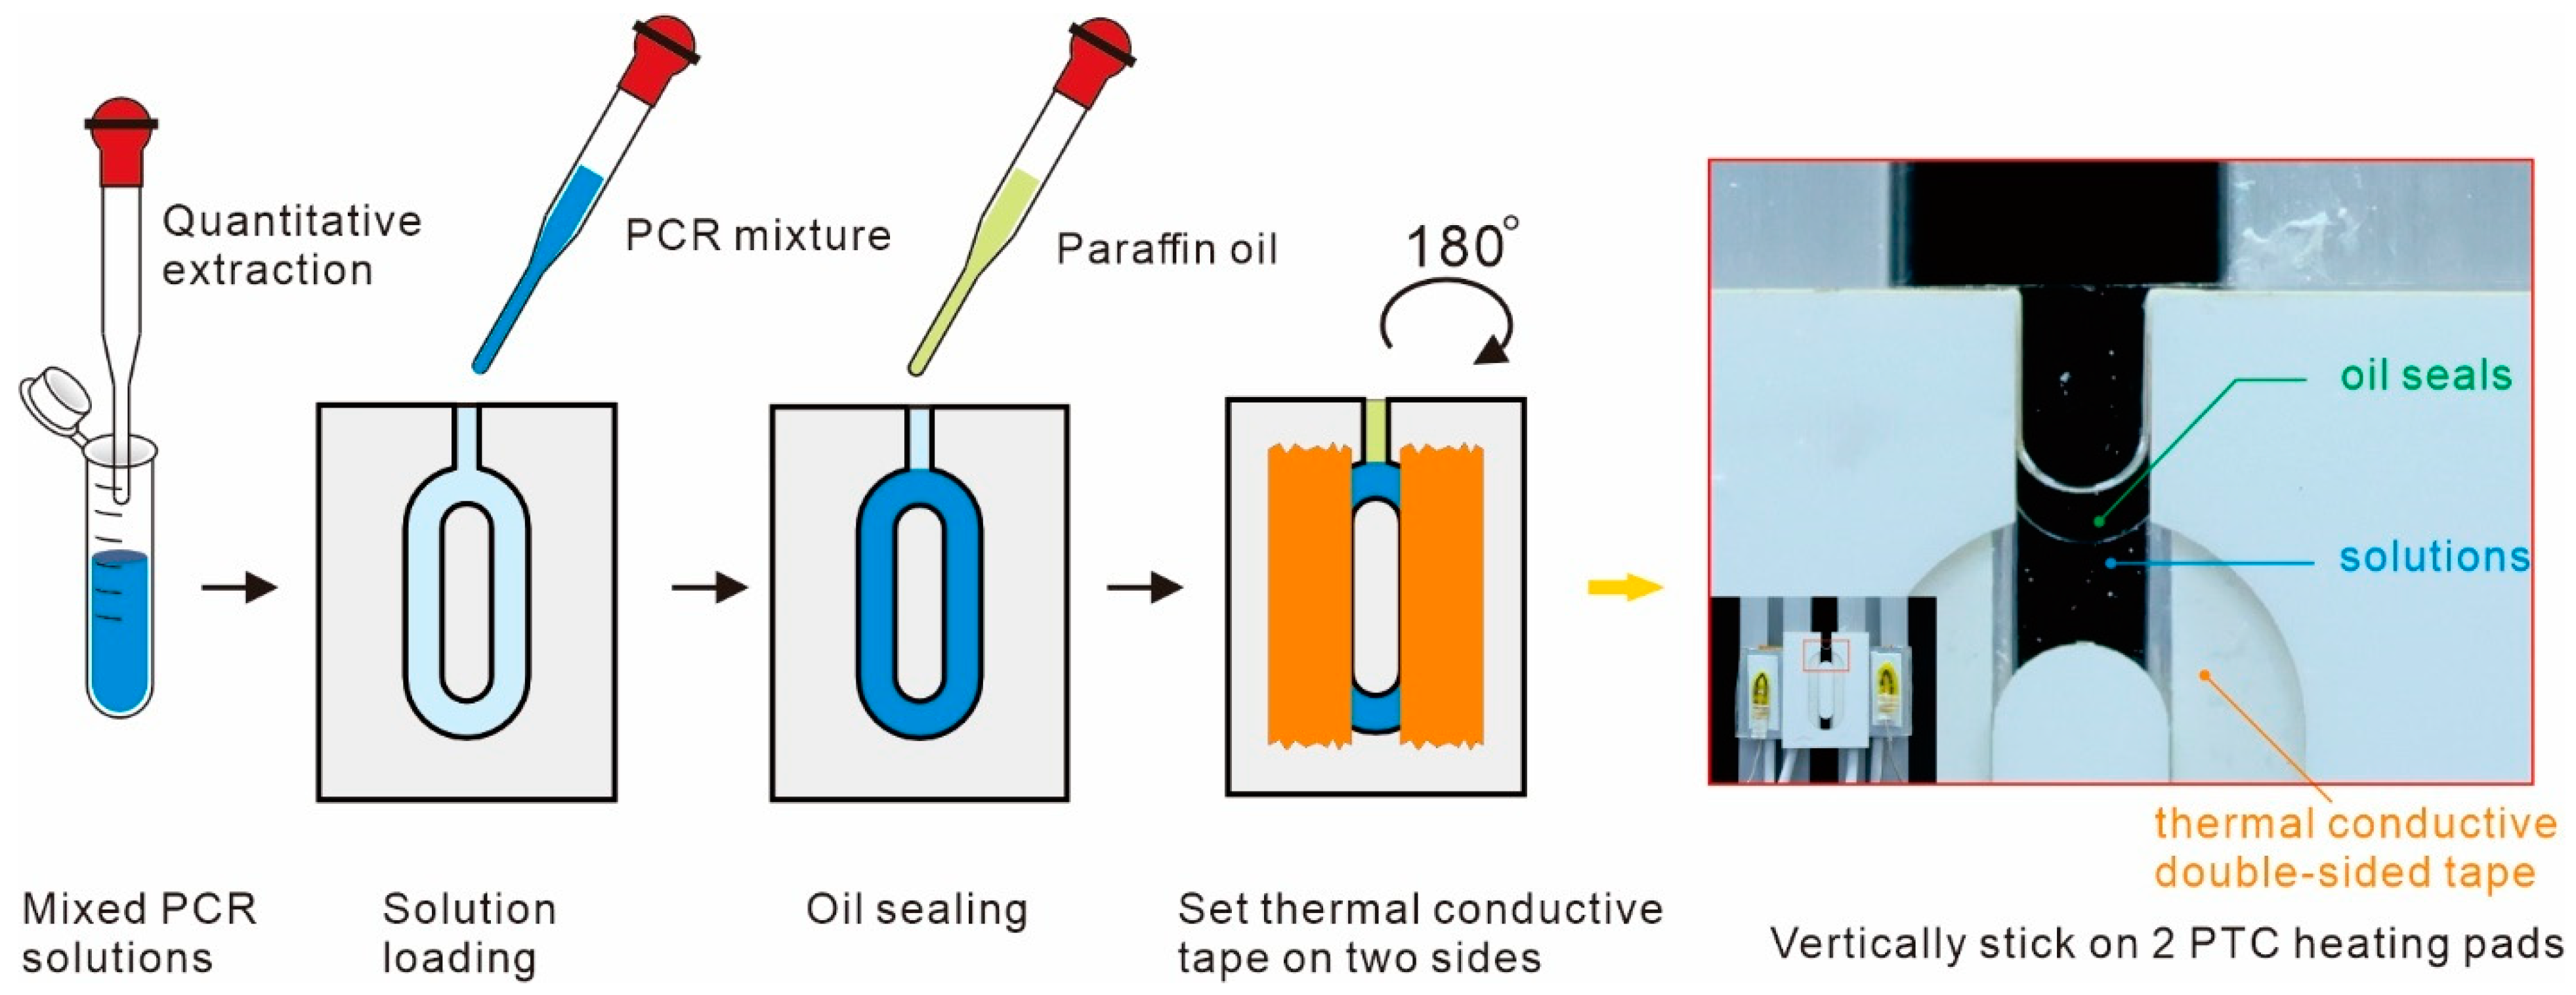
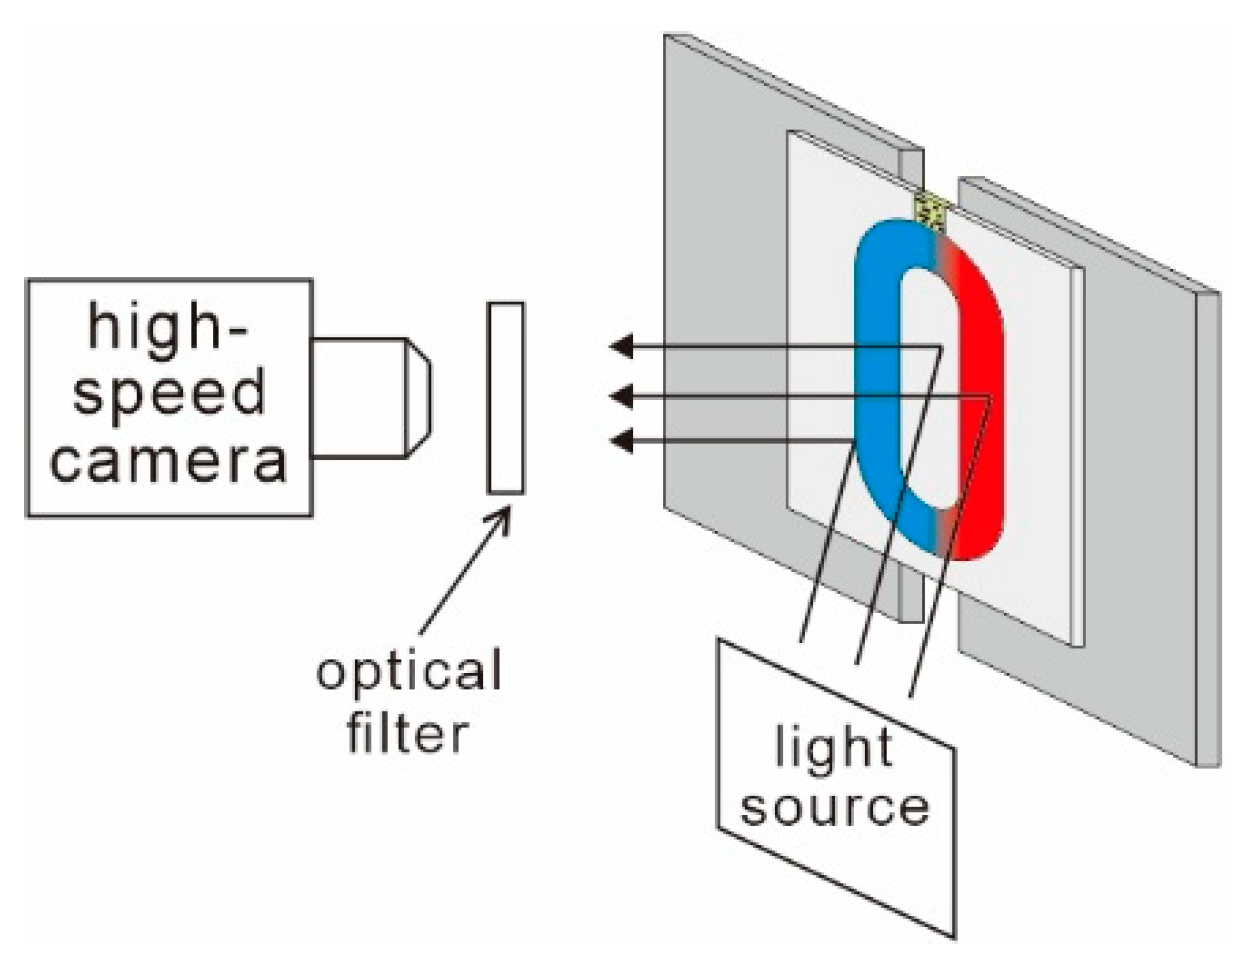
2.3. Loading Process and Observation Method
2.4. Simulation
2.5. Reagents
- For 2019-nCoV:
- For Hepatitis B Virus:
3. Results
4. Discussion
4.1. Reverse Design Methodologies
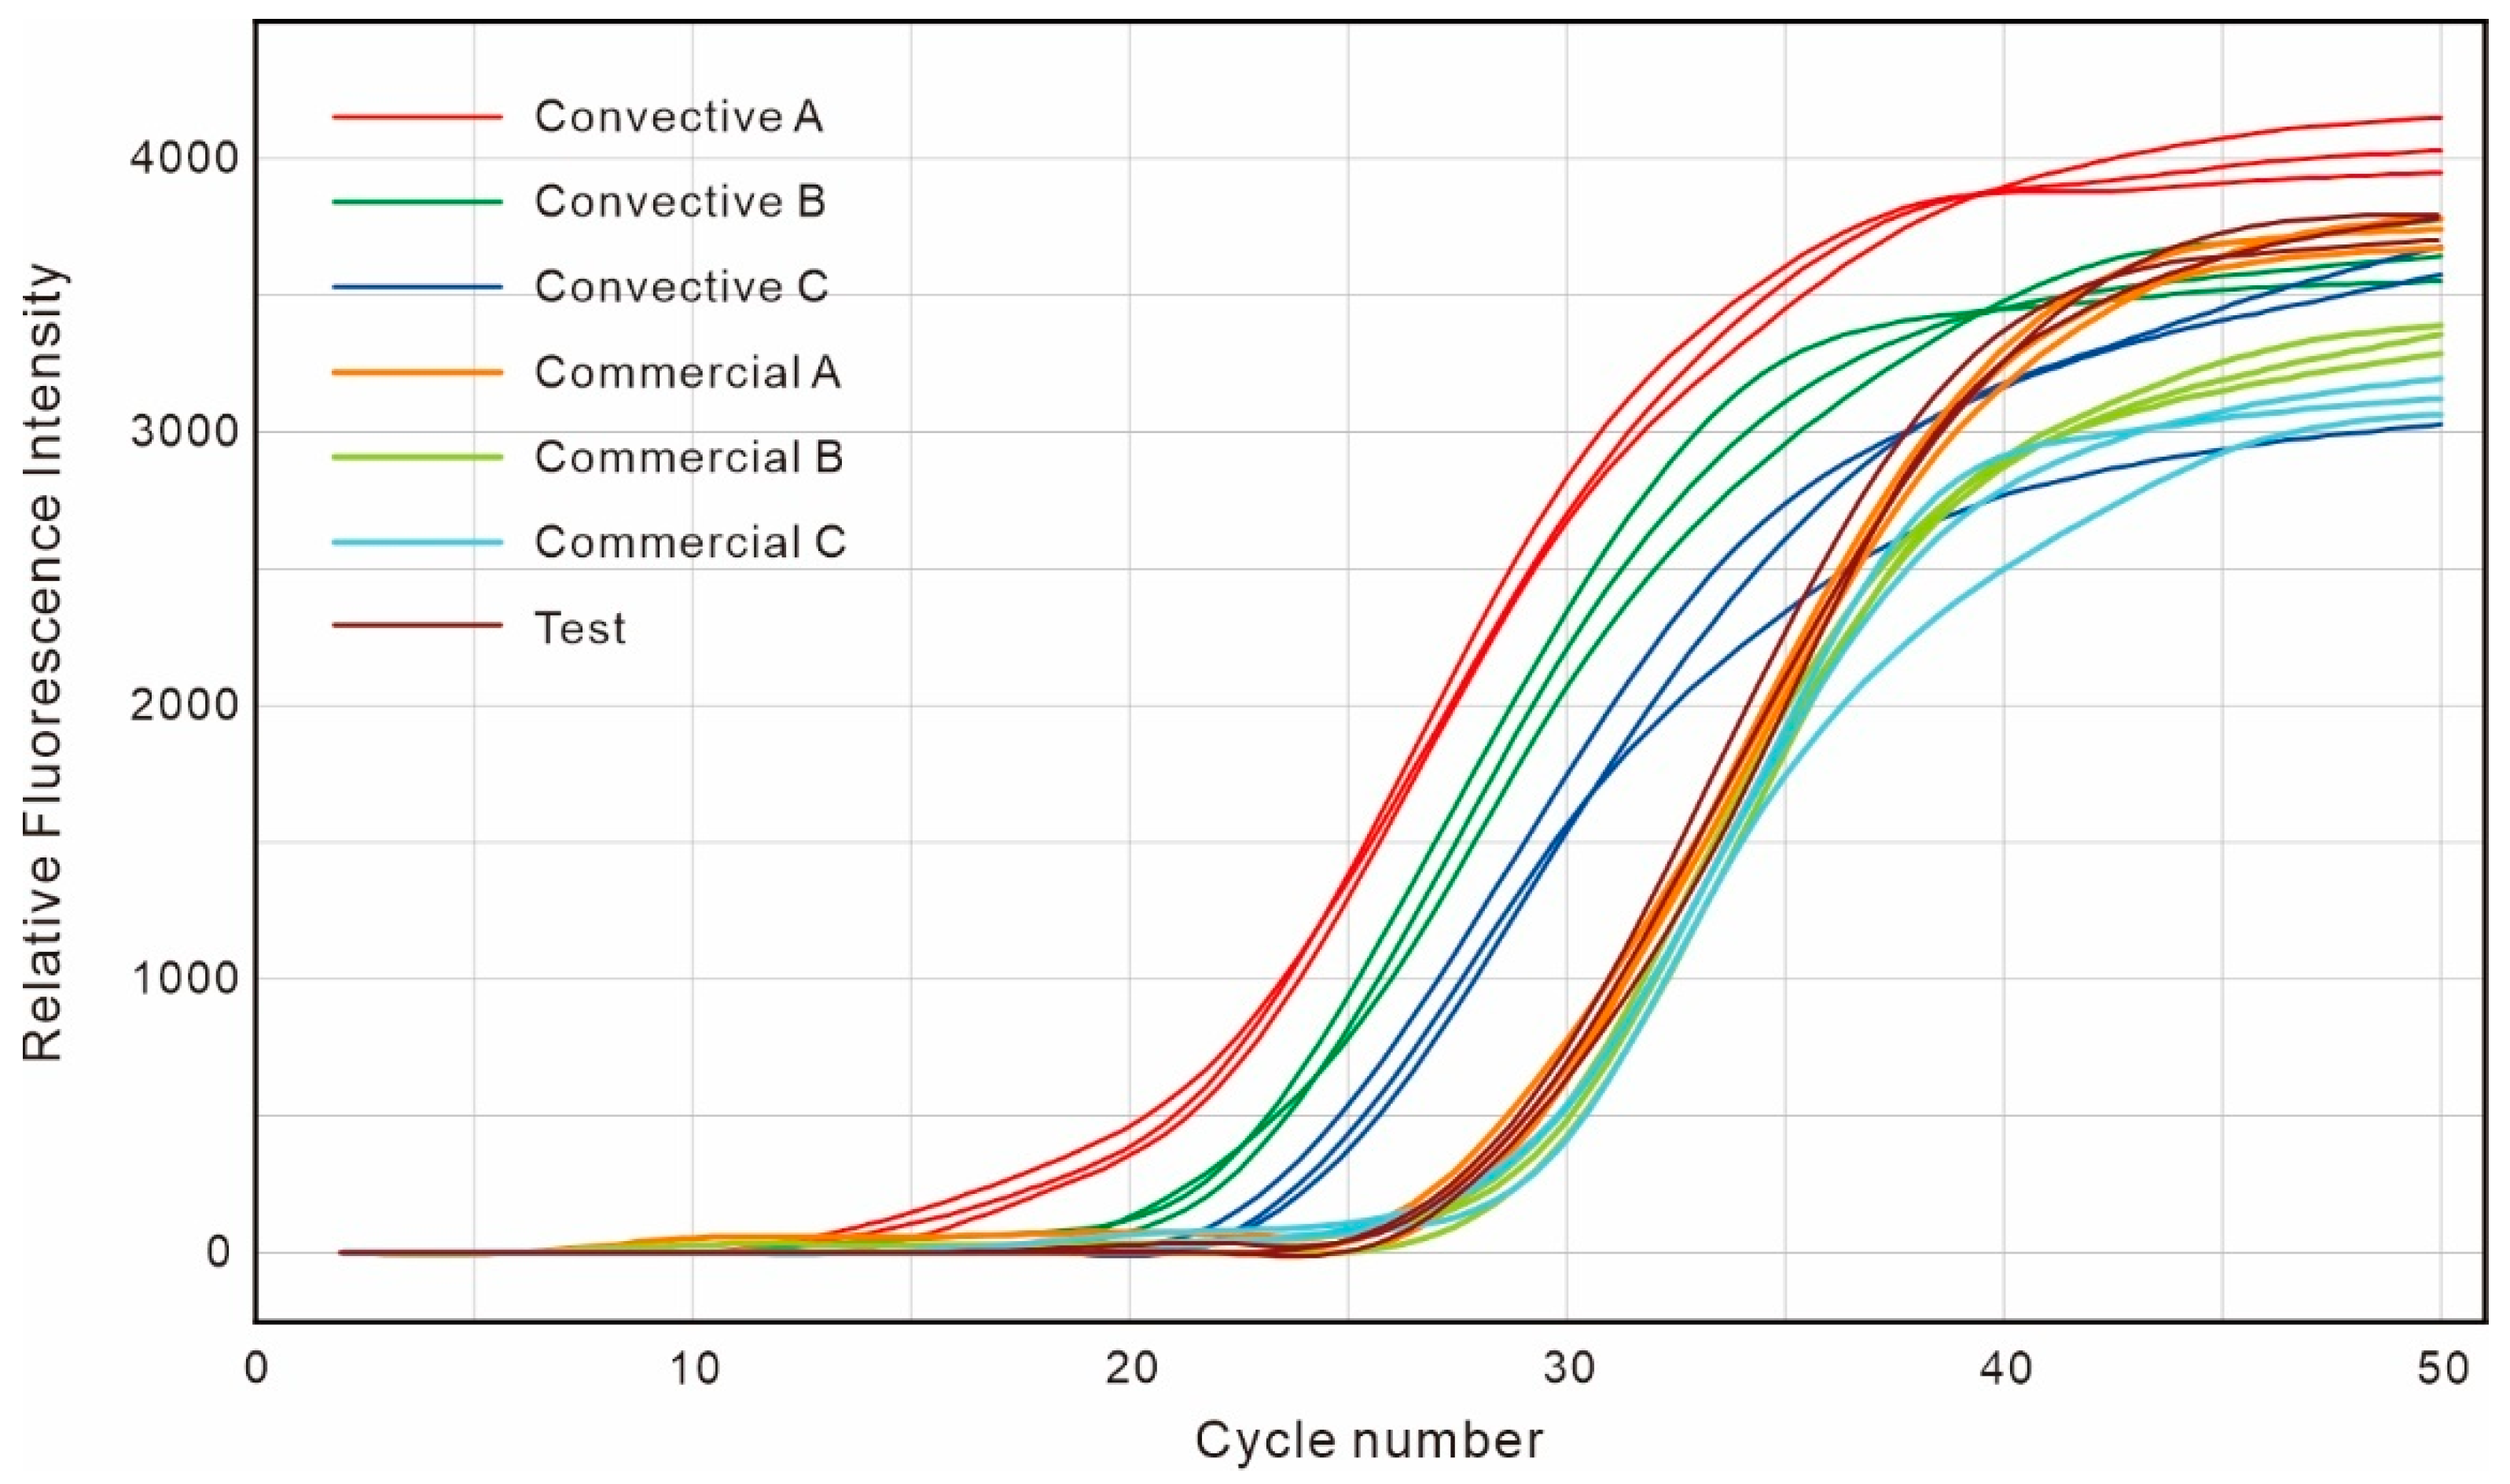
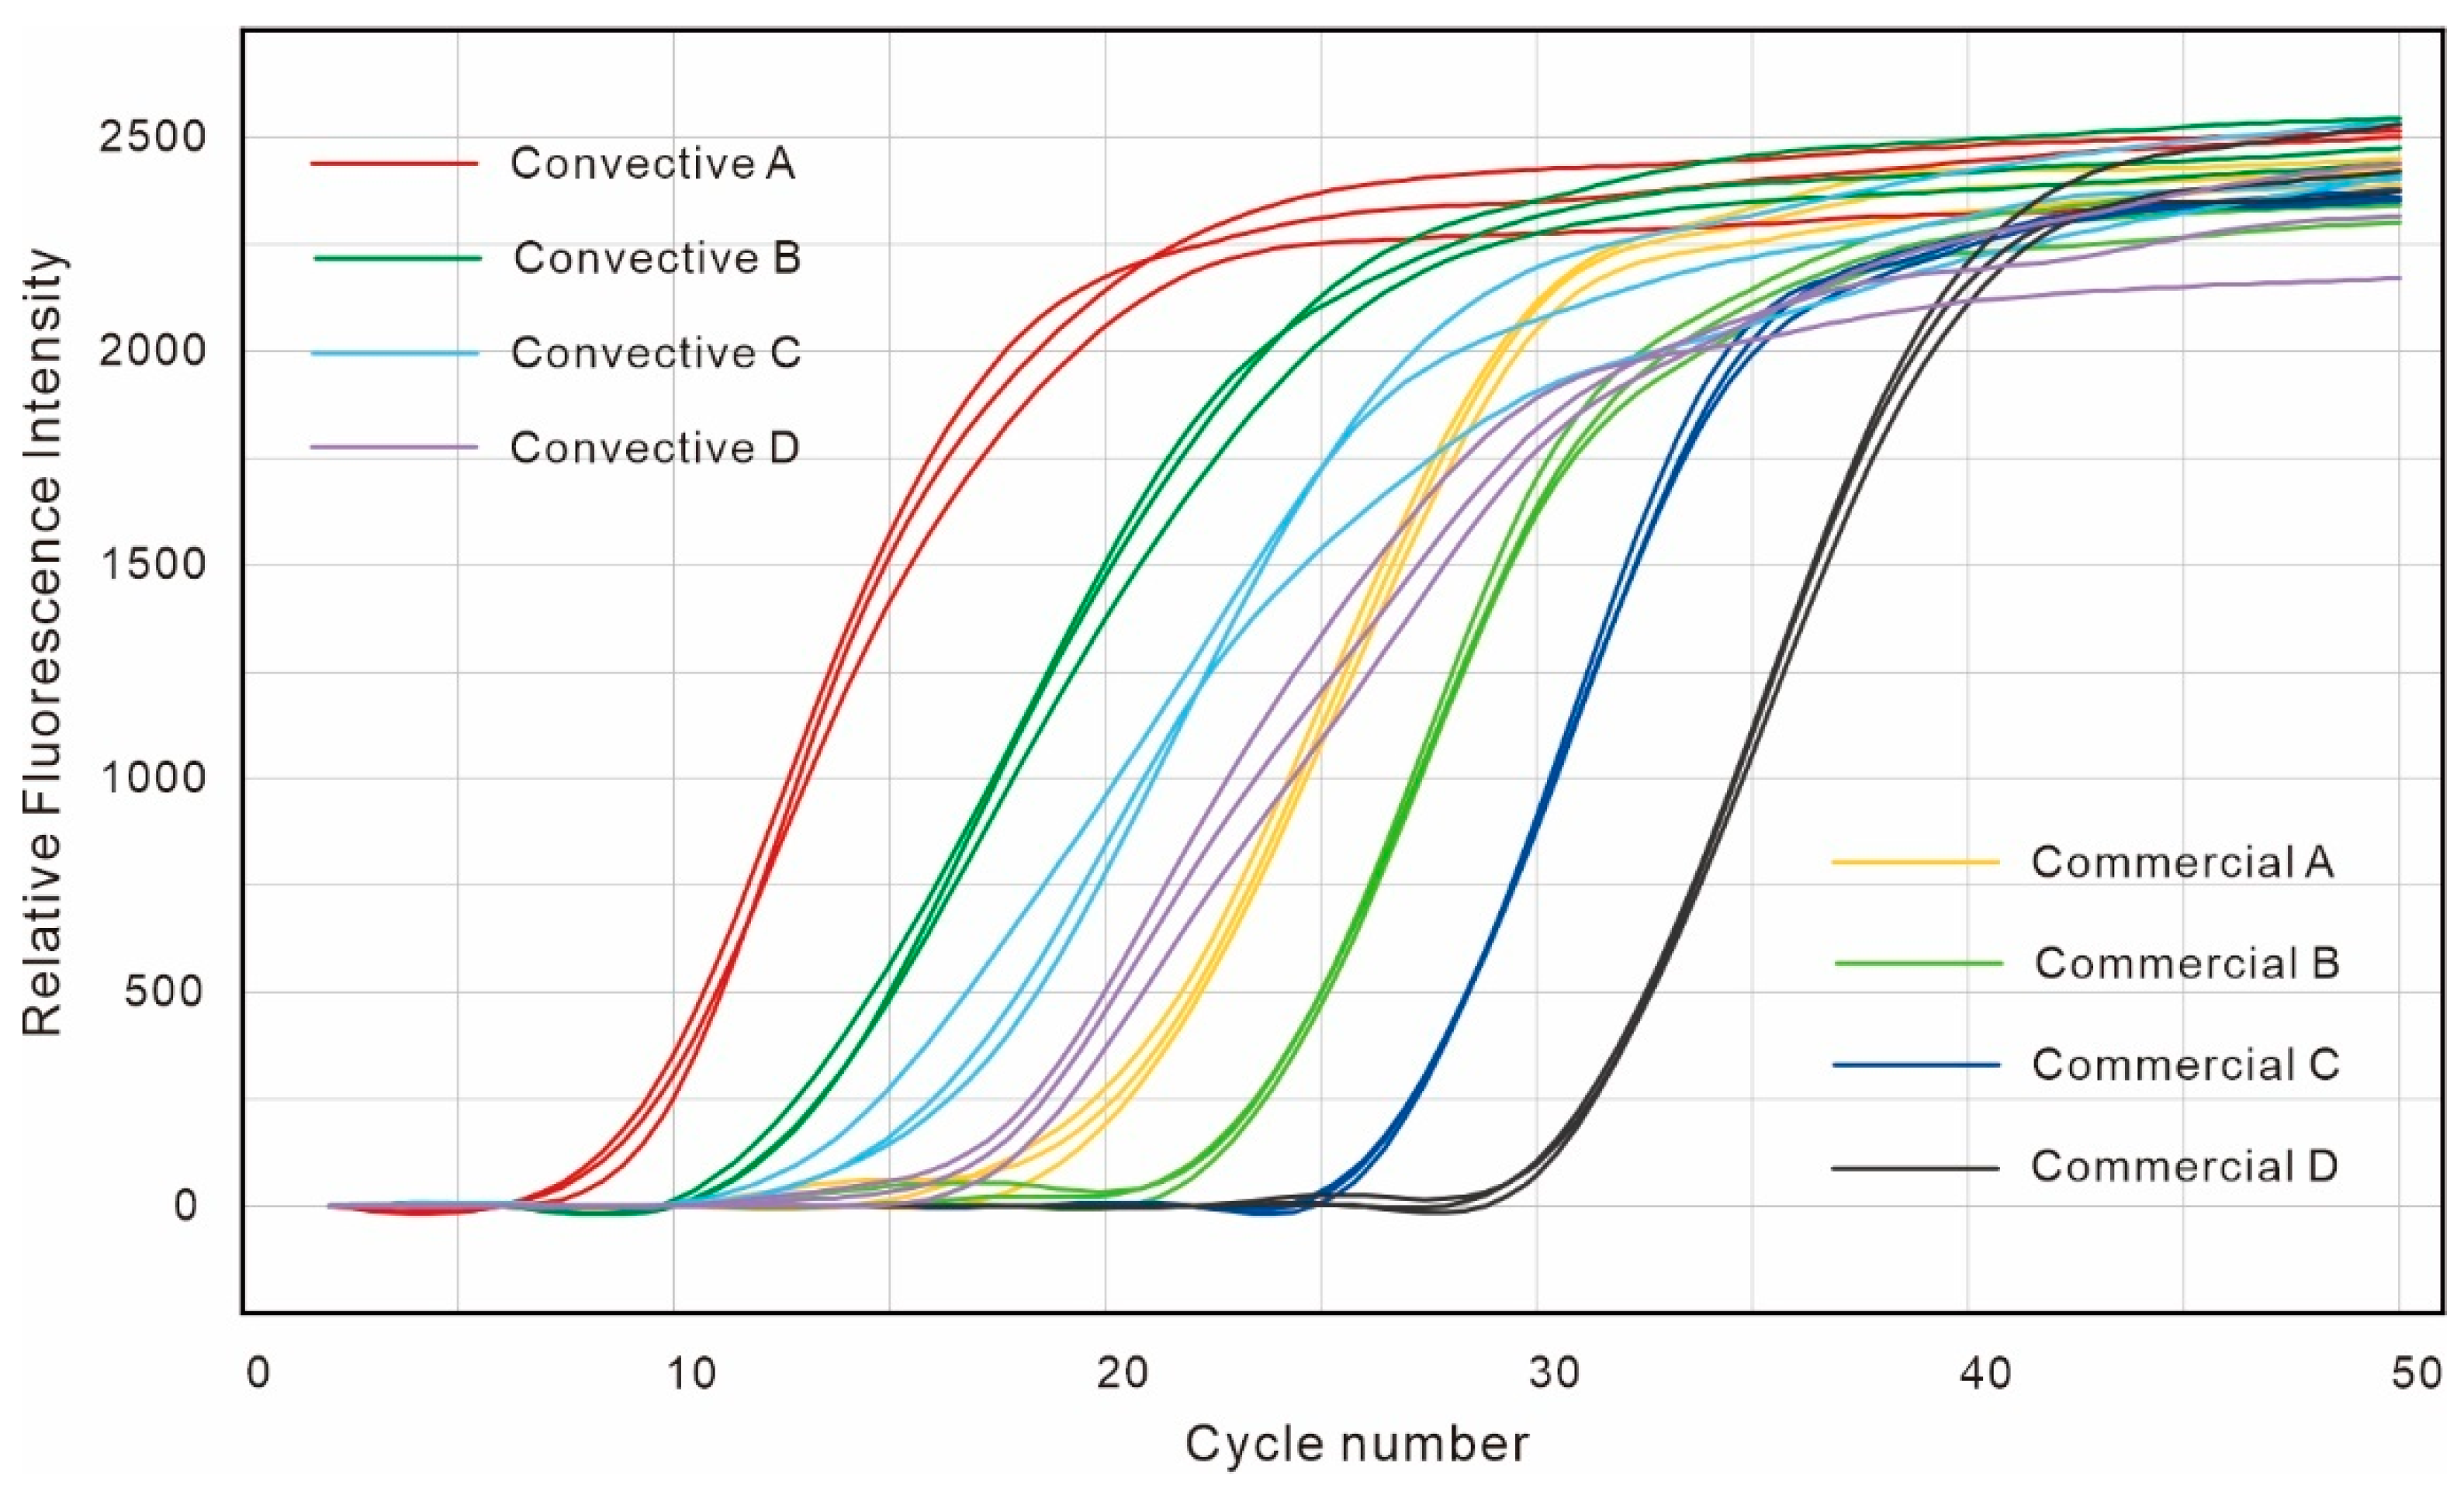
4.2. Analysis of PCR Amplification Results
5. Conclusions
Author Contributions
Funding
Institutional Review Board Statement
Informed Consent Statement
Data Availability Statement
Acknowledgments
Conflicts of Interest
References
- Ecke, R.E.; Shishkina, O. Turbulent Rotating Rayleigh-Bénard Convection. Annu. Rev. Fluid. Mech. 2024, 55, 603–638. [Google Scholar] [CrossRef]
- Zhang, Y.; Zhou, Q. Low-Prandtl-Number Effects on Global and Local Statistics in Two-Dimensional Rayleigh-Bénard Convection. Phys. Fluids 2024, 36, 015107. [Google Scholar] [CrossRef]
- Baïri, A.; Zarco-Pernia, E.; García De María, J.M. A Review on Natural Convection in Enclosures for Engineering Applications. the Particular Case of the Parallelogrammic Diode Cavity. Appl. Therm. Eng. 2014, 63, 304–322. [Google Scholar] [CrossRef]
- Krishnan, M.; Ugaz, V.M.; Burns, M.A. PCR in a Rayleigh-Bénard Convection Cell. Science 2002, 298, 793. [Google Scholar] [CrossRef] [PubMed]
- Braun, D.; Goddard, N.L.; Libchaber, A. Exponential DNA Replication by Laminar Convection. Phys. Rev. Lett. 2003, 91, 158103. [Google Scholar] [CrossRef] [PubMed]
- Lee, D.; Chou, W.P.; Yeh, S.H.; Chen, P.J.; Chen, P.H. DNA Detection Using Commercial Mobile Phones. Biosens. Bioelectron. 2011, 26, 4349–4354. [Google Scholar] [CrossRef] [PubMed]
- Hsieh, Y.F.; Lee, D.S.; Chen, P.H.; Liao, S.K.; Yeh, S.H.; Chen, P.J.; Yang, A.S. A Real-Time Convective PCR Machine in a Capillary Tube Instrumented with a CCD-Based Fluorometer. Sens. Actuators B Chem. 2013, 183, 434–440. [Google Scholar] [CrossRef]
- Miao, G.; Guo, M.; Li, K.; Ye, X.; Mauk, M.G.; Ge, S.; Xia, N.; Yu, D.; Qiu, X. An Integrated, Real-Time Convective PCR System for Isolation, Amplification, and Detection of Nucleic Acids. Chemosensors 2022, 10, 271. [Google Scholar] [CrossRef]
- Xu, D.; Jiang, X.; Zou, T.; Miao, G.; Fu, Q.; Xiang, F.; Feng, L.; Ye, X.; Zhang, L.; Qiu, X. A Microfluidic System for Rapid Nucleic Acid Analysis Based on Real-Time Convective PCR at Point-of-Care Testing. Microfluid. Nanofluid. 2022, 26, 69. [Google Scholar] [CrossRef]
- Qiu, X.; Shu, J.I.; Baysal, O.; Wu, J.; Qian, S.; Ge, S.; Li, K.; Ye, X.; Xia, N.; Yu, D. Real-Time Capillary Convective PCR Based on Horizontal Thermal Convection. Microfluid. Nanofluid. 2019, 23, 39. [Google Scholar] [CrossRef]
- Zhang, S.; Wang, J.; Zhuo, Z.; Su, X.; Chen, M.; Chen, W.; Li, T.; Zhang, D.; Min, X.; Ge, S.; et al. An Efficient Isothermal PCR Method for On-Site Detection of Nucleic Acid. Biotechniques 2019, 67, 63–69. [Google Scholar] [CrossRef]
- Qiu, X.; Zhang, S.; Mei, L.; Wu, D.; Guo, Q.; Li, K.; Ge, S.; Ye, X.; Xia, N.; Mauk, M.G. Characterization and Analysis of Real-Time Capillary Convective PCR toward Commercialization. Biomicrofluidics 2017, 11, 024103. [Google Scholar] [CrossRef]
- Wu, J.; Jiang, K.; Mi, H.; Qiu, Y.; Son, J.; Park, H.J.; Nam, J.M.; Lee, J.H. A Rapid and Sensitive Fluorescence Biosensor Based on Plasmonic PCR. Nanoscale 2021, 13, 7348–7354. [Google Scholar] [CrossRef]
- Chang, H.F.G.; Tsai, Y.L.; Tsai, C.F.; Lin, C.K.; Lee, P.Y.; Teng, P.H.; Su, C.; Jeng, C.C. A Thermally Baffled Device for Highly Stabilized Convective PCR. Biotechnol. J. 2012, 7, 662–666. [Google Scholar] [CrossRef] [PubMed]
- Agrawal, N.; Ugaz, V.M. A Buoyancy-Driven Compact Thermocycler for Rapid PCR. Clin. Lab. Med. 2007, 27, 215–223. [Google Scholar] [CrossRef] [PubMed]
- Agrawal, N.; Hassan, Y.A.; Ugaz, V.M. A Pocket-Sized Convective PCR Thermocycler. Angew. Chem.-Int. Ed. 2007, 46, 4316–4319. [Google Scholar] [CrossRef]
- Khodakov, D.; Li, J.; Zhang, J.X.; Zhang, D.Y. Highly Multiplexed Rapid DNA Detection with Single-Nucleotide Specificity via Convective PCR in a Portable Device. Nat. Biomed. Eng. 2021, 5, 702–712. [Google Scholar] [CrossRef]
- Sullivan, A.T.; Rao, V.; Rockwood, T.; Gandhi, J.; Gruzka, S.; O’Connor, L.; Wang, B.; Ragan, K.B.; Zhang, D.Y.; Khodakov, D. Rapid, Tunable, and Multiplexed Detection of RNA Using Convective Array PCR. Commun. Biol. 2023, 6, 973. [Google Scholar] [CrossRef]
- Wheeler, E.K.; Benett, W.; Stratton, P.; Richards, J.; Chen, A.; Christian, A.; Ness, K.D.; Ortega, J.; Li, L.G.; Weisgraber, T.H.; et al. Convectively Driven Polymerase Chain Reaction Thermal Cycler. Anal. Chem. 2004, 76, 4011–4016. [Google Scholar] [CrossRef] [PubMed]
- Mulberry, G.; White, K.A.; Vaidya, M.; Sugaya, K.; Kim, B.N. 3D Printing and Milling a Real-Time PCR Device for Infectious Disease Diagnostics. PLoS ONE 2017, 12, e0179133. [Google Scholar] [CrossRef]
- Shishkina, O. Rayleigh-Bénard Convection: The Container Shape Matters. Phys. Rev. Fluids 2021, 6, 090502. [Google Scholar] [CrossRef]
- Sposito, A.; Hoang, V.; DeVoe, D.L. Rapid Real-Time PCR and High Resolution Melt Analysis in a Self-Filling Thermoplastic Chip. Lab Chip 2016, 16, 3524–3531. [Google Scholar] [CrossRef]
- Houssin, T.; Cramer, J.; Grojsman, R.; Bellahsene, L.; Colas, G.; Moulet, H.; Minnella, W.; Pannetier, C.; Leberre, M.; Plecis, A.; et al. Ultrafast, Sensitive and Large-Volume On-Chip Real-Time PCR for the Molecular Diagnosis of Bacterial and Viral Infections. Lab Chip 2016, 16, 1401–1411. [Google Scholar] [CrossRef]


| Convective A | Convective B | Convective C | Convective D | Commercial A | Commercial B | Commercial C | Commercial D | |
|---|---|---|---|---|---|---|---|---|
| 9.82 | 13.04 | 16.23 | 20.10 | 20.25 | 23.96 | 27.41 | 30.88 | |
| 0.53 | 0.39 | 1.02 | 0.81 | 0.60 | 0.14 | 0.08 | 0.19 |
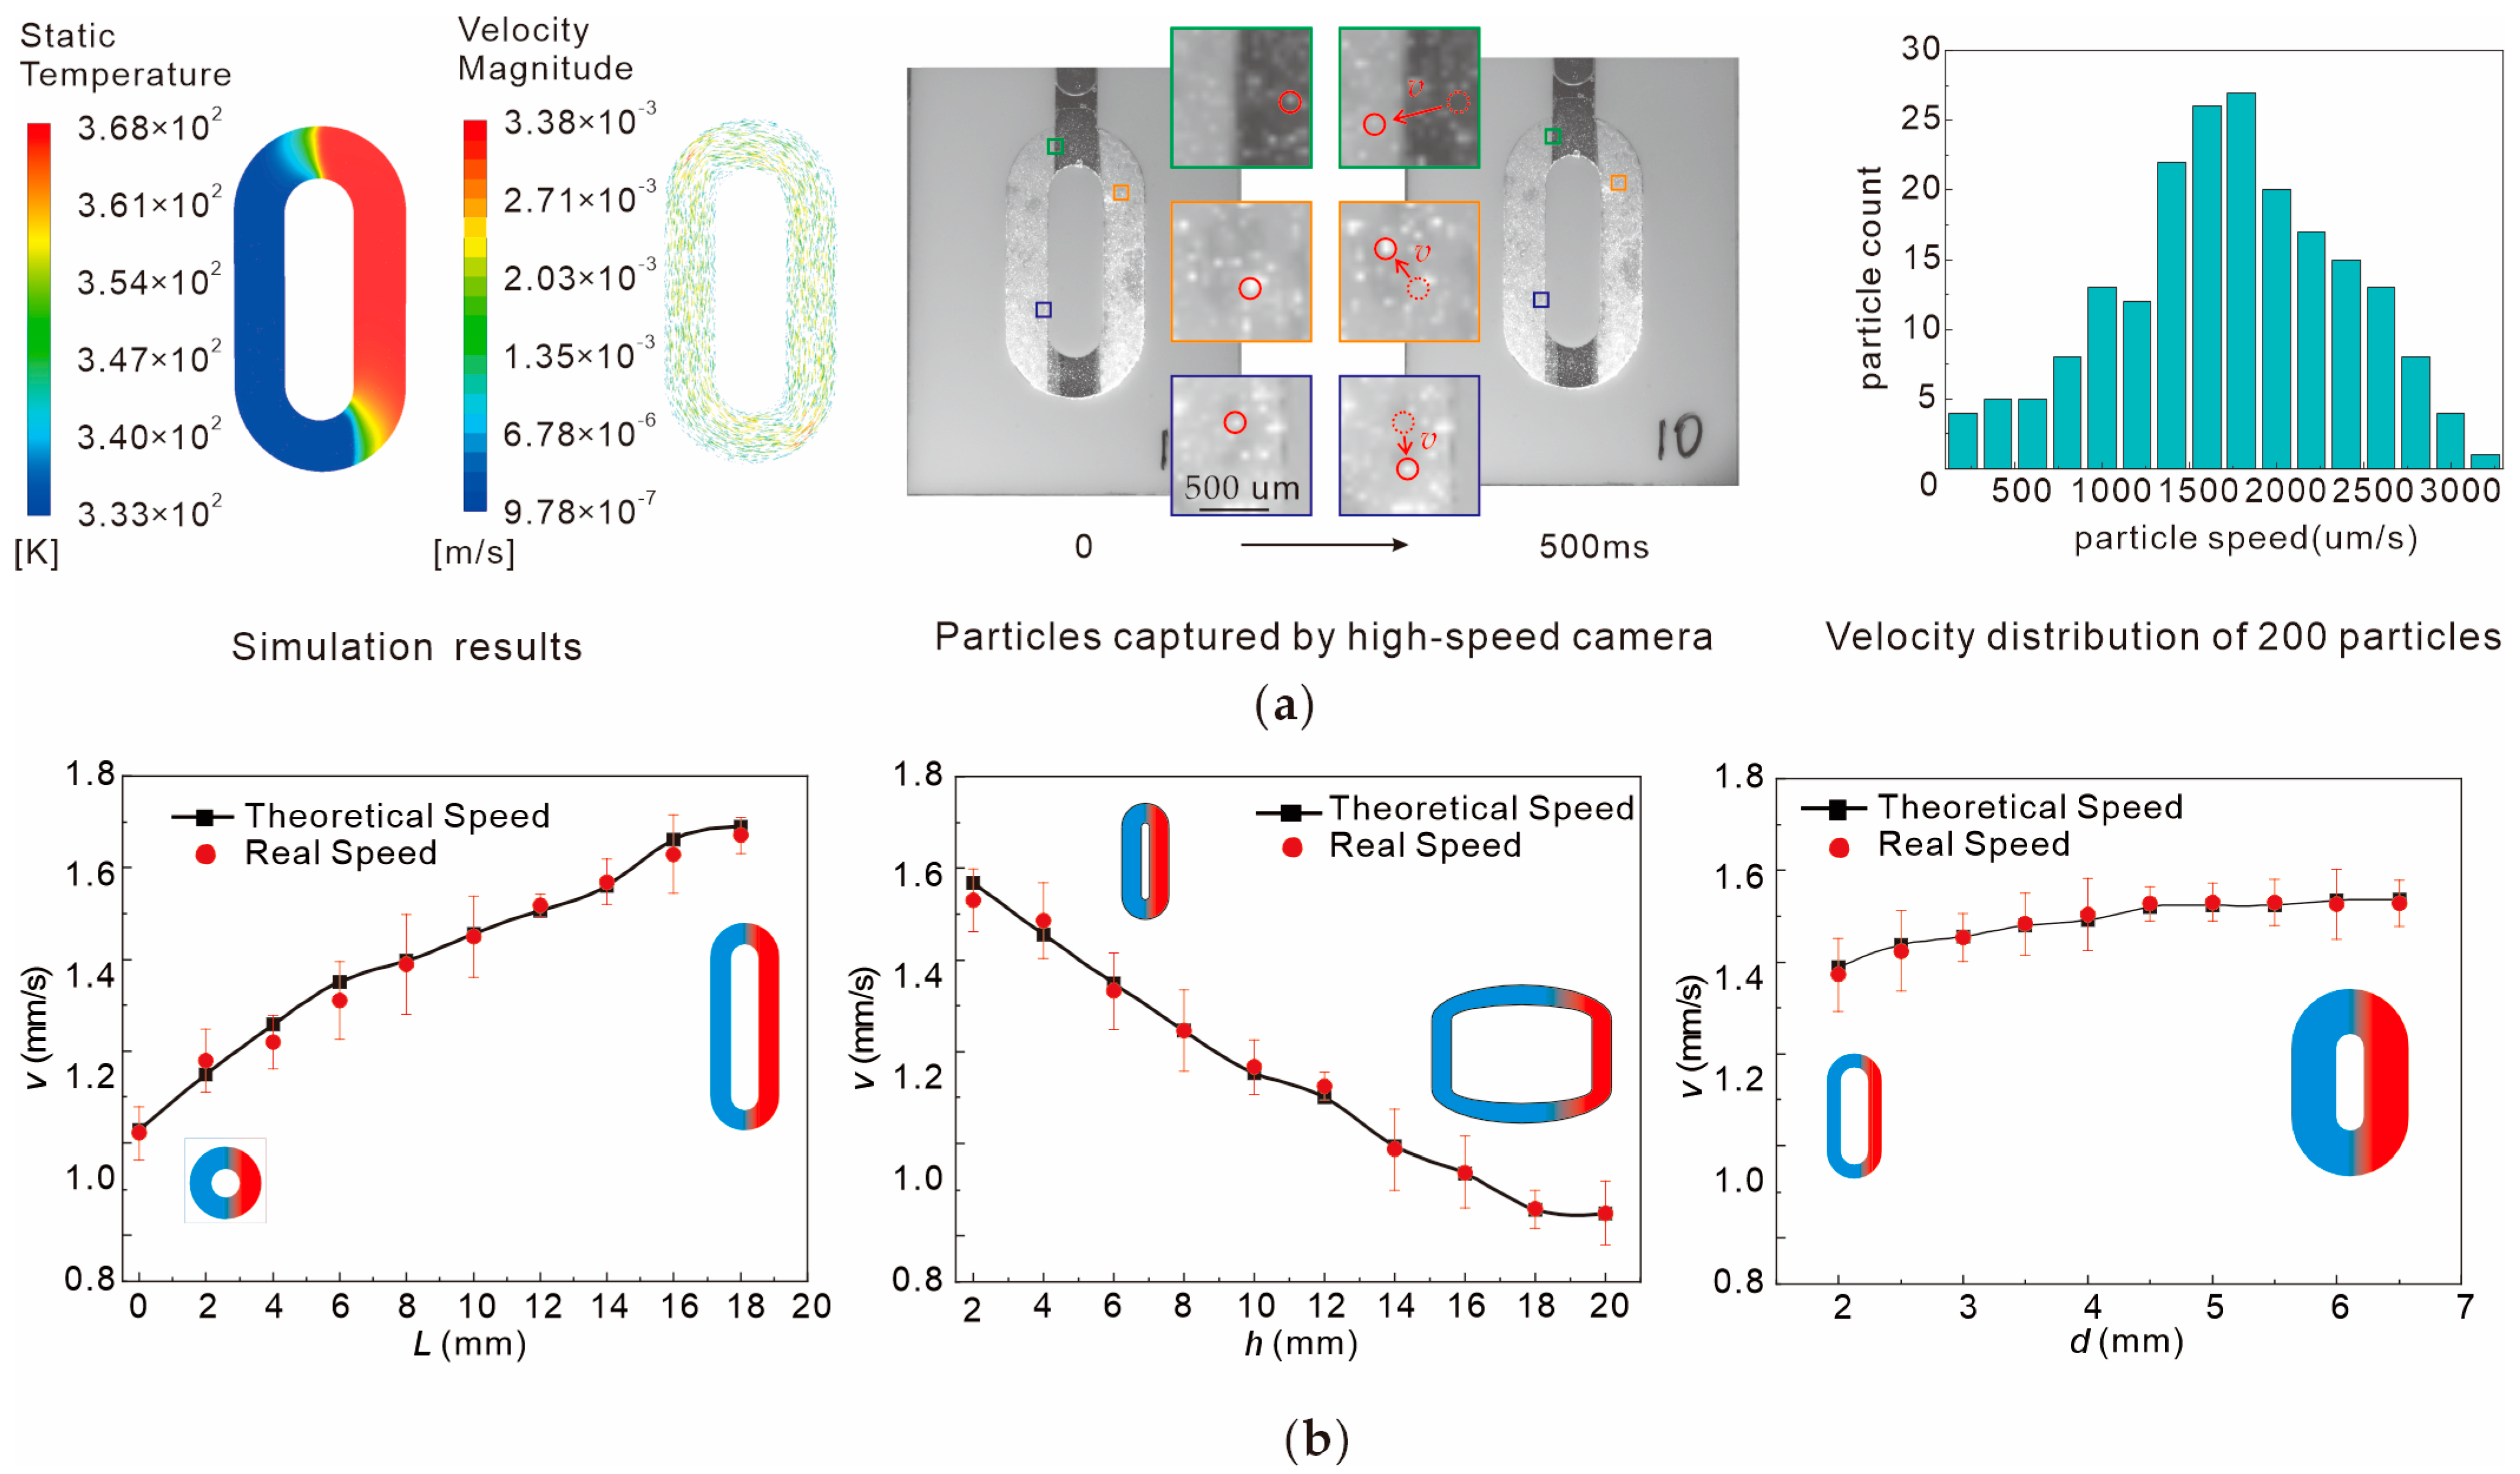
| No. | Target V (μL) | Target (s) | Target (s) | Designed L (mm) | Designed h (mm) | Designed d (mm) | Calculated v (mm/s) | Real v (mm/s) | Relative Error δ |
|---|---|---|---|---|---|---|---|---|---|
| 1 | 50 | 15 | 30 | 17.11 | 9.77 | 1.55 | 1.30 | 1.28 | 1.53% |
| 2 | 75 | 15 | 30 | 16.56 | 10.05 | 2.26 | 1.34 | 1.33 | 0.74% |
| 3 | 100 | 15 | 30 | 15.77 | 10.21 | 2.97 | 1.36 | 1.39 | 2.21% |
| 4 | 50 | 8 | 22 | 6.19 | 8.75 | 2.42 | 1.25 | 1.27 | 1.60% |
| 5 | 50 | 10 | 20 | 9.86 | 6.70 | 2.26 | 1.34 | 1.37 | 2.24% |
| 6 | 50 | 12 | 18 | 13.68 | 4.25 | 2.14 | 1.42 | 1.40 | 1.41% |
| 7 | 50 | 14 | 16 | 17.65 | 1.49 | 2.04 | 1.49 | 1.45 | 2.68% |
Disclaimer/Publisher’s Note: The statements, opinions and data contained in all publications are solely those of the individual author(s) and contributor(s) and not of MDPI and/or the editor(s). MDPI and/or the editor(s) disclaim responsibility for any injury to people or property resulting from any ideas, methods, instructions or products referred to in the content. |
© 2025 by the authors. Licensee MDPI, Basel, Switzerland. This article is an open access article distributed under the terms and conditions of the Creative Commons Attribution (CC BY) license (https://creativecommons.org/licenses/by/4.0/).
Share and Cite
Li, C.; Xie, Y.; Yong, H.; Zhao, X.; Ke, X.; Wu, Z. A Reverse Design Method for Convective PCR Chips Featuring Precise Control of Steady-State Flow Fields. Chemosensors 2025, 13, 6. https://doi.org/10.3390/chemosensors13010006
Li C, Xie Y, Yong H, Zhao X, Ke X, Wu Z. A Reverse Design Method for Convective PCR Chips Featuring Precise Control of Steady-State Flow Fields. Chemosensors. 2025; 13(1):6. https://doi.org/10.3390/chemosensors13010006
Chicago/Turabian StyleLi, Chenfei, Yaping Xie, Haochen Yong, Xin Zhao, Xingxing Ke, and Zhigang Wu. 2025. "A Reverse Design Method for Convective PCR Chips Featuring Precise Control of Steady-State Flow Fields" Chemosensors 13, no. 1: 6. https://doi.org/10.3390/chemosensors13010006
APA StyleLi, C., Xie, Y., Yong, H., Zhao, X., Ke, X., & Wu, Z. (2025). A Reverse Design Method for Convective PCR Chips Featuring Precise Control of Steady-State Flow Fields. Chemosensors, 13(1), 6. https://doi.org/10.3390/chemosensors13010006