Abstract
Background: This paper aimed to measure and characterize eleven monochromatic filters and twenty-two combinations used empirically to treat patients with visual dysfunctions to propose enhanced protocols based on solid evidence. Their wavelength, transmittance, and relative sensitivity were defined on the retinal cone cells. Methods: A double-beam UV-VIS-NIR spectrophotometer, VARIAN brand, Cary 5000 model, owned by the National Center of Metrology, with high precision and accuracy, was used to characterize all filters. Filters were purchased from Optomatters Corporation, Belgium. Results: When two or three filters are combined, their transmittance and relative sensitivity on the retinal cone cells decrease regardless of wavelength. As a result, the efficiency of combined filters may decrease during treatments. Additionally, most filters and combinations, regardless of the wavelength, transmit a considerable percentage of light from the red spectrum. A depressant is the best monochromatic filter, and Upsilon–Neurasthenic is the strongest combination to stimulate blue cone cells. In contrast, Stimulant and Delta–Theta are best for red and green cone cells. Mu–Delta and Mu–Theta can be interchangeable, as well as Alpha–Delta and Alpha–Theta. Conclusions: Results suggest that the current phototherapy treatment protocol must be deeply revised, and the number of filters and combinations should be reduced to reduce costs and time and boost efficiency.
1. Introduction
This paper aimed to characterize eleven monochromatic spectral filters and twenty-two combinations empirically used to treat patients with visual dysfunctions. For the first time, properties such as wavelengths, transmissions, and relative sensitivities are measured and presented to propose innovative, scientifically based treatments.
Currently, light stimulation and phototherapy utilizing a combination of two or more spectral filters have been empirically applied as part of the therapeutic process for patients with visual dysfunctions [1,2]. In clinical settings, the choice of filters is guided by the patient’s medical history, symptoms, and clinical findings, following the protocol established by the College of Syntonic Optometry (CSO) for patients with visual deficiencies [1,3]. These monochromatic filters transmit light from the blue to the red spectrum, representing the visible light spectrum (VLS). Their effect on brain activity begins in cells that respond to luminance, color, or both, located in the primary visual cortex (V1) [4], and extends to additional cortical regions through the extensive neural network and brain connectome.
Moreover, the theory posits that low-energy, long-wavelength light (red) stimulates the sympathetic nervous system; mid-length wavelengths (green) balance physiology; and high-energy, short-wavelength light (blue) activates the parasympathetic nervous system, modulating the autonomic nervous system through the retinohypothalamic tract (i.e., the non-visual pathway of light perception) and its projections to subcortical and cortical regions [5]. Therefore, the neural activity of patients with neurodevelopmental and neurological conditions may be altered and enhanced by wavelength-dependent processes and other energy-based stimulation [6].
Visual-evoked potentials (VEPs) have demonstrated that monochromatic filters can alter VEP responses by influencing axonal activation and the number of fibers that become connected [7,8]. Similarly, quantitative electroencephalography (qEEG) studies have shown that light stimulation and phototherapy, utilizing a combination of two or more spectral filters, can modulate Alpha waves, interhemispheric connections, the anteroposterior gradient, and brain coherence [9,10]. Additionally, functional connectivity patterns in brain networks of neurotypically developed individuals, as measured by fMRI, have been found to be light-dependent [11].
The earliest clinical studies using monochromatic and combined filters reported changes in form visual fields in reading disabled children and in certain visual and cognitive functions [12,13].
A more recent study which combined clinical and neuroimaging data showed the positive impact of spectral filters in patients with strabismus and amblyopia on the angle of deviation, visual acuity, stereopsis degrees, and visual fields [9]. Moreover, the modulation effect of the spectral filters on the brain connectome can be extended to patients with traumatic brain injuries [14], children diagnosed with visual stress [15], patients with symptoms of visual processing disorder and migraine [16,17], etc. Hence, their impact on brain activity is undeniable. However, there is an essential difference among these papers; the filters’ wavelengths and transmittances differ substantially. In the field of neuro-optometry, light stimulation and phototherapy have become a substantial part of the visual treatment of patients with visual dysfunctions, and filters are used based on a specified protocol [1,3], but their properties are not available to clinicians.
As a consequence, there needs to be solid scientific evidence to support their use. However, light stimulation using these spectral filters became popular in the late 1980s and early 1990s, but it changed the understanding of the mechanism by which light stimulation affects patients with visual disorders, and the cortical electrical response to such stimulation was a paper published in 1996 [18].
Since then, the protocol of filters used has been updated several times based on empirical and clinical evidence by the CSO, but information is mostly transmitted during seminars and conferences or case reports published in the CSO journal.
In our previous study, wavelength and transmittance of six monochromatic filters were measured [8], and their effect was analyzed through VEPs, which raised more questions concerning the vast number of combinations used in visual therapy. Additionally, the use of these specific twenty-two combined filters, their impact on the retinal cone cells of the retina, as well as their different impact on the cerebral cortex despite patients presenting the same visual dysfunction [9,10] remain unclear. Consequently, we need more scientific data to personalize treatments and guarantee results. Another point worth mentioning is the elevated purchasing cost of these filters and the uncertainty of their effectiveness. As for every scientific unknown, identifying the problem and analyzing its component leads to new knowledge, which is the goal of this paper. Our scientific contribution is to understand their physical characteristics in order to properly apply them and propose improved protocols in the forthcoming future. This would not only reduce costs, time and boost the effect of the treatment, but also provide a solid scientific base.
2. Methods and Results
This is a descriptive quantitative study that measures the wavelength, transmittance, and relative sensitivity on the retinal cone cells of eleven monochromatic filters and twenty-two combinations used empirically in the clinical practice of visual health professionals to treat patients with visual dysfunctions. This paper aims to define their physical properties to propose enhanced protocols based on solid scientific evidence. Six high-energy, short-wavelength filters (Omega, Lambda, Pi, Neurasthenic, Upsilon, Depressant) and five low-energy, long-wavelength filters (Alpha, Delta, Theta, stimulant) used in clinical practice are presented. Mu, on the other hand, is a mid-wavelength filter. Combinations result from combining two or three monochromatic filters. Filters were purchased from Optomatters Corporation, Belgium.
Results section is divided into 3 sub-sections:
- Section 2.1 presents the wavelength and transmittance of all monochromatic and combined filters.
- Section 2.2 measures the response of the three cone cells of the retina to each filter, represented by the relative sensitivity.
- Section 2.3 compares five glass and polymer filters.
2.1. Characterization of the Filters
The spectral transmittance of each monochromatic filter was measured using a double-beam UV-VIS-NIR spectrophotometer, model Cary 5000, manufactured by VARIAN and owned by the National Center of Metrology. This device provides high precision and accuracy and is calibrated for transmittance values (expressed as percentages) and wavelengths (expressed in nanometers). These measurements allow for determining the transmittance values as a percentage for each wavelength, ranging from 380.0 nm to 750.0 nm, with increments of 0.5 nm. Both sets of measurements are traceable to the National Spectral Transmittance, Absorbance, and Reflectance Standard maintained by the NCM [19]. Additional details on the calibration uncertainty for transmittance and wavelength measurements, as well as the characterization of the filters, can be found in the methodology section of our previous study [8]. Table 1 presents the range of the Visible Light Spectrum (VLS), while Table 2 illustrates the wavelength range of the monochromatic filters used in visual therapy.

Table 1.
Shows the range of the wavelength expressed in (nm) of the Visible Light Spectrum.
Table 2.
Represents the wavelength and transmittance of each monochromatic filter measured in this study.
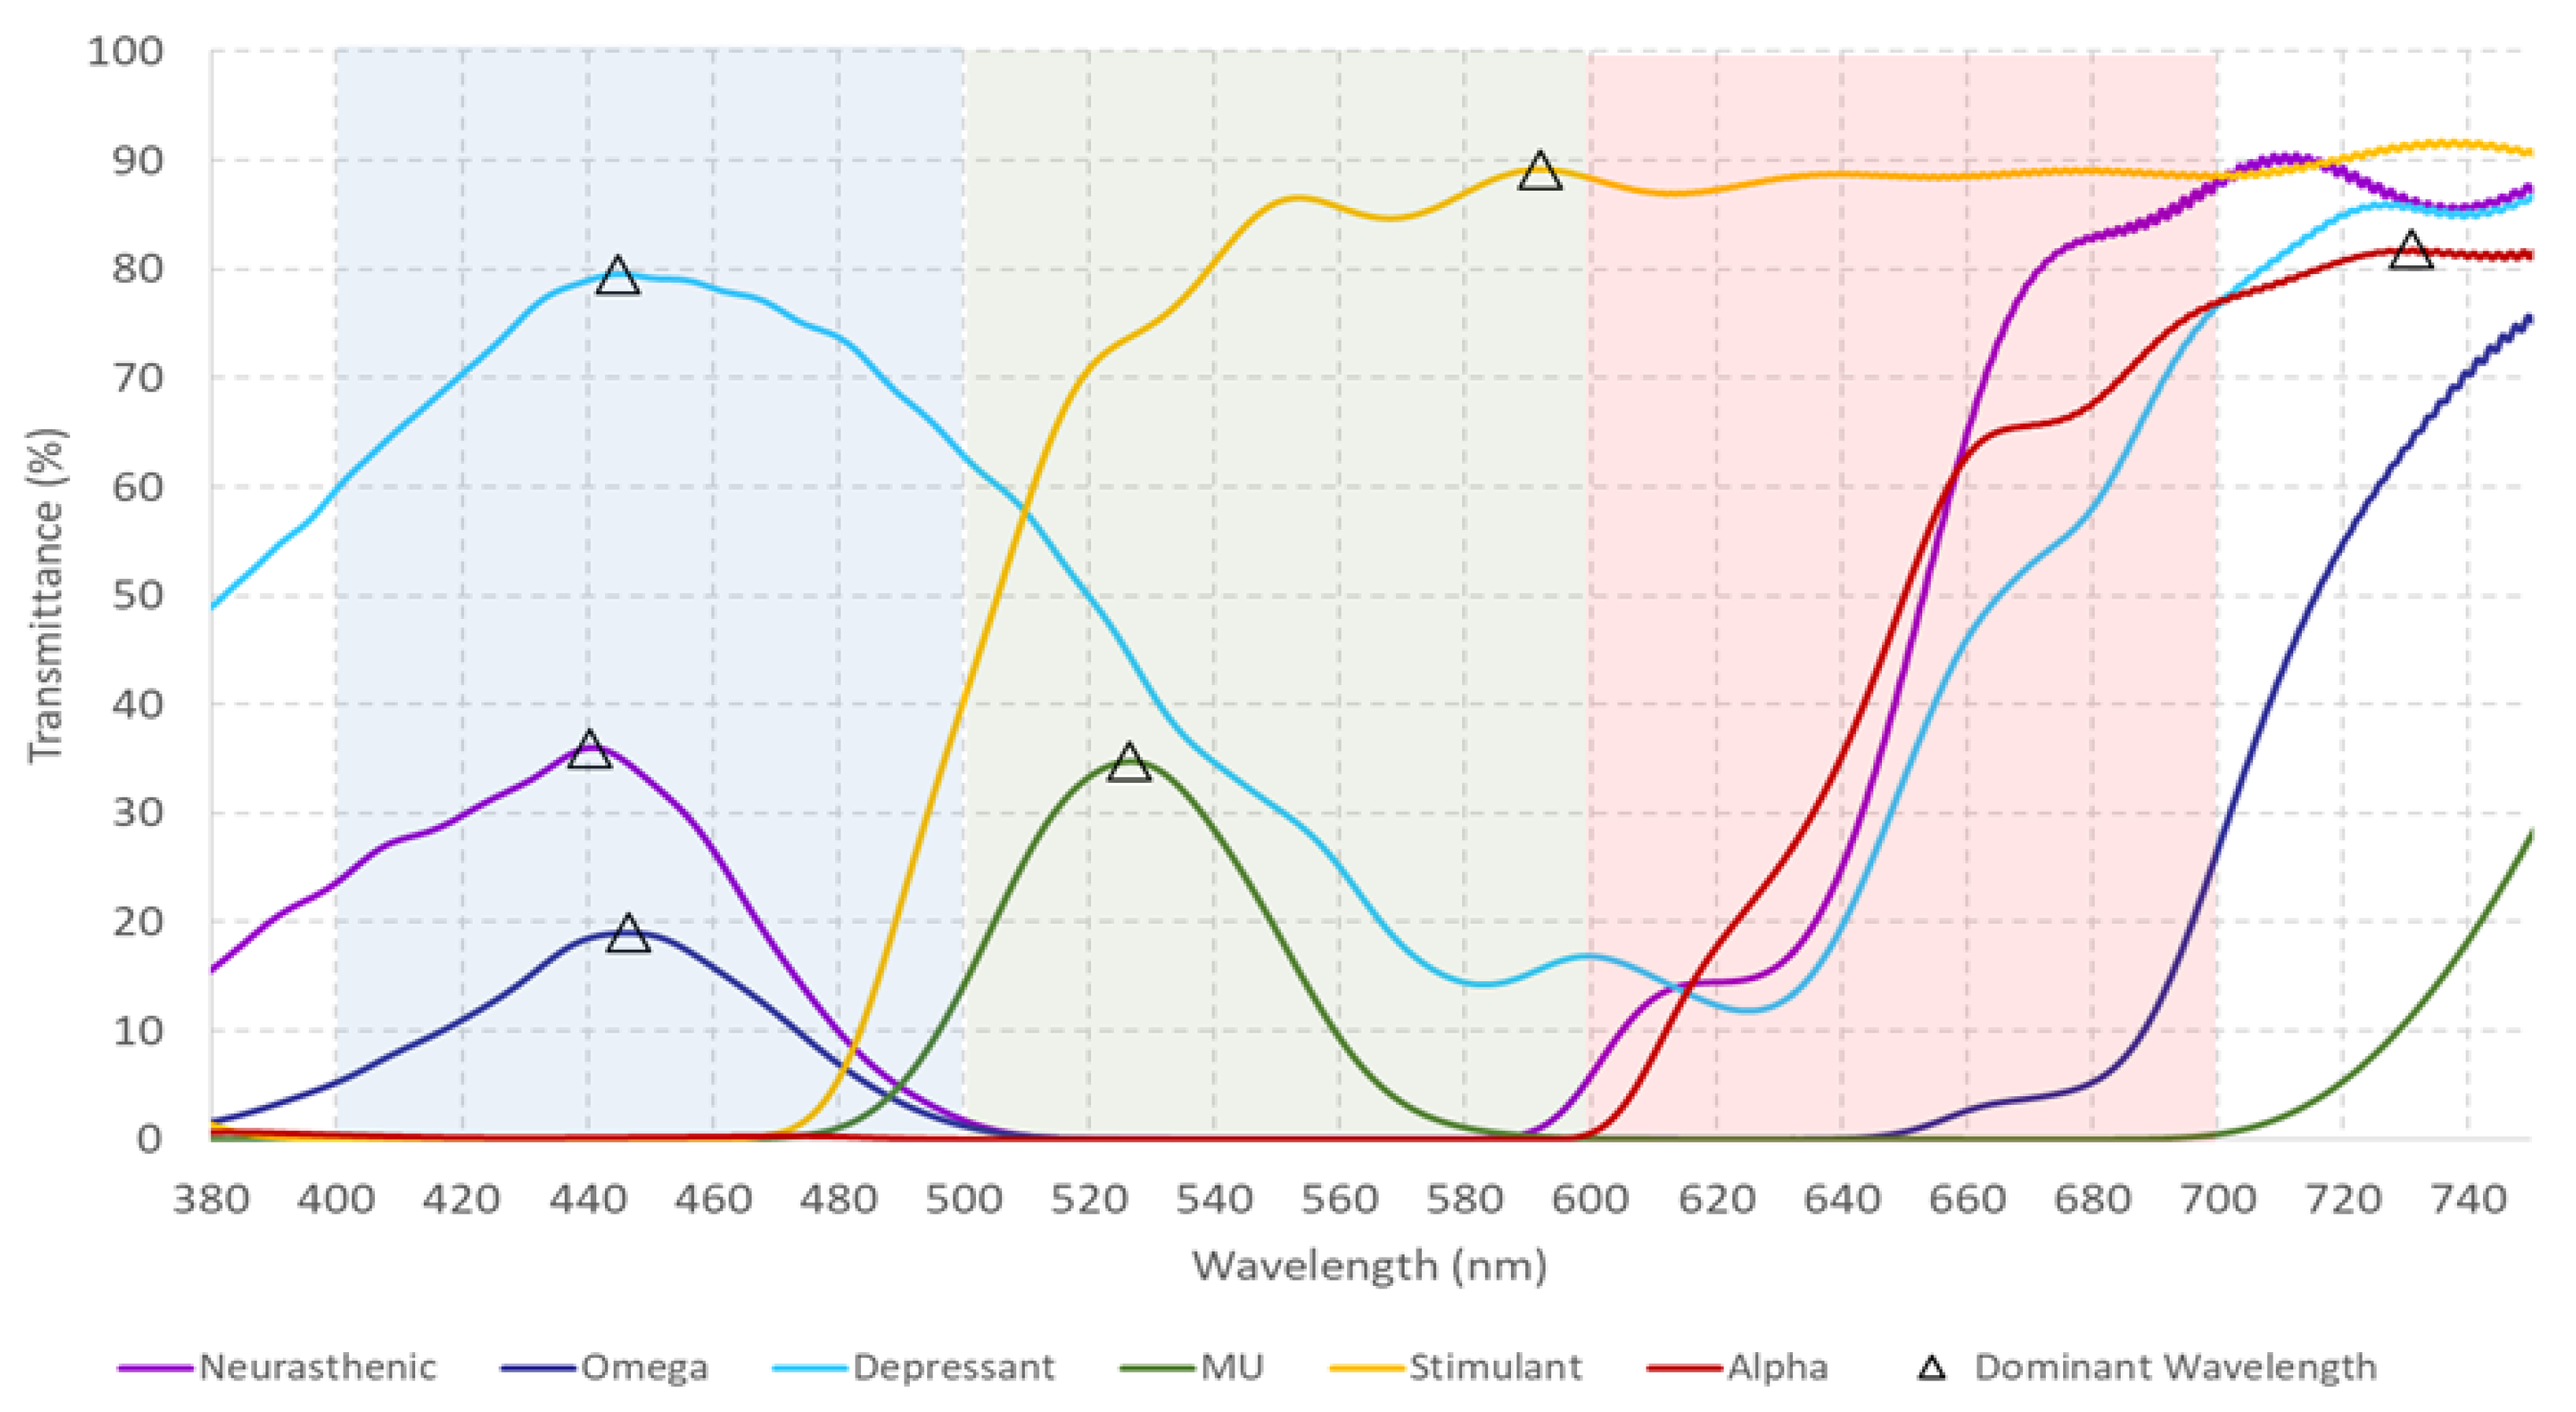
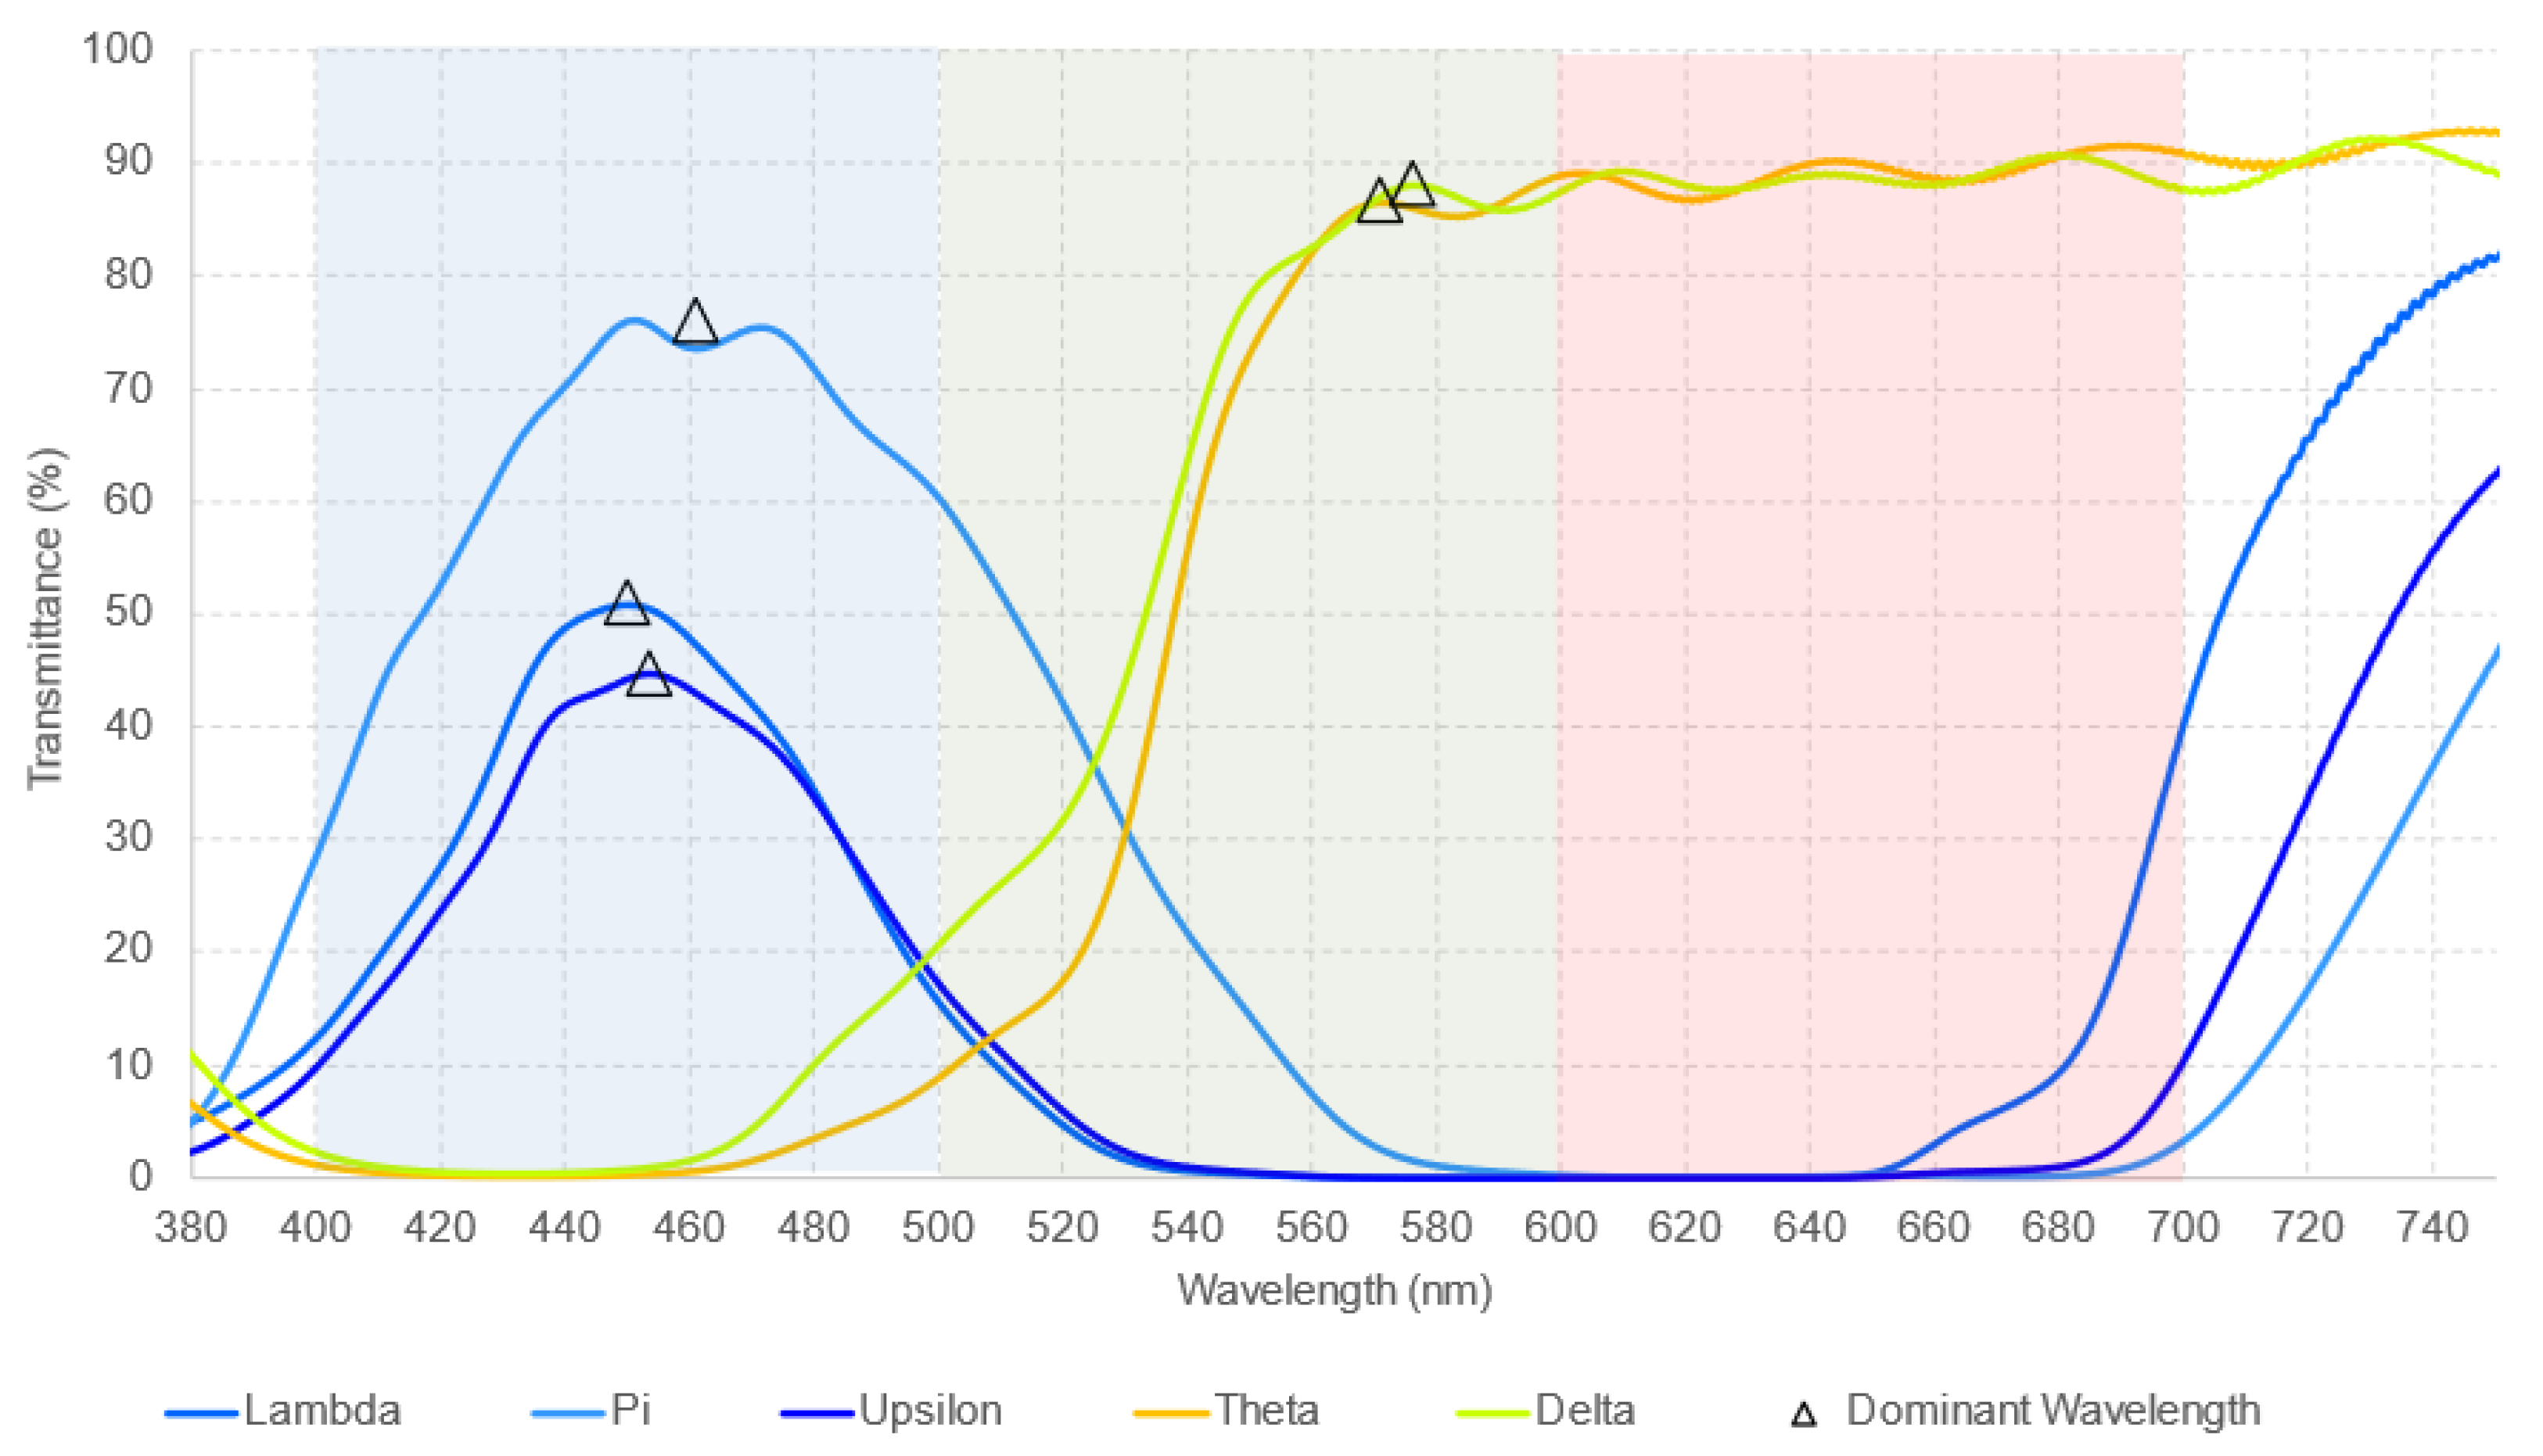
Figure 1 presents the transmittance obtained with the six monochromatic filters previously reported in [8]. In contrast, Figure 2 shows the transmittance corresponding to the analysis of the five new monochromatic filters.
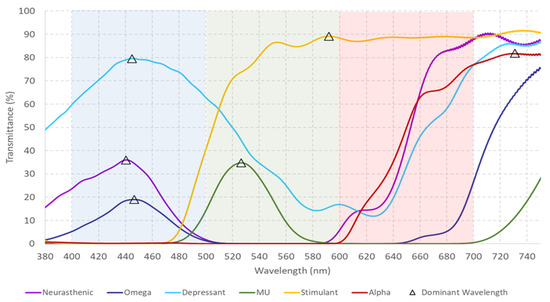
Figure 1.
Spectral transmittance measurements (ranging from 380 to 750 nm) for six monochromatic filters, with the dominant wavelength marked by a triangle. The colors displayed in the graphs correspond to the actual colors of the filters. The dominant wavelength, defined as “the wavelength with the highest transmittance in the measured spectra”, is within the ranges specified in the Visible Light Spectrum (Table 1) and aligns with the perceived color of each filter. Reprinted from [8].
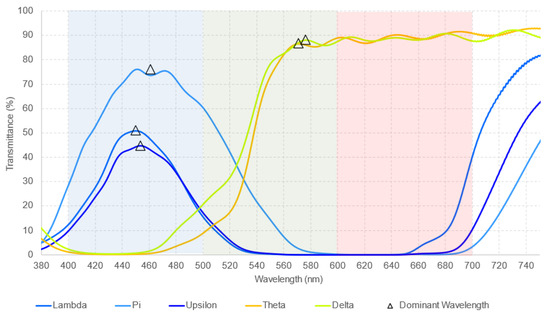
Figure 2.
Measured spectral transmittance (from 380 to 750 nm) for the dominant wavelength of five additional monochromatic filters, with each dominant wavelength represented by a triangle. The colors used in the graphs are selected to best represent the actual colors of the filters. The dominant wavelength, defined as “the wavelength with the highest transmittance in the measured spectra”, falls within the specified ranges of the Visible Light Spectrum (Table 1) and corresponds to the perceived color of each filter.
Afterward, to generate greater knowledge and understanding of these filters, the VLS was analyzed in its seven basic wavelength ranges, ranging from violet (360 to 440 nm) to red (620 to 780 nm), and the average transmittance of each monochromatic filter and their combinations in every wavelength range was measured. Table 3 shows the average transmittance of monochromatic filters, while Table 4, Table 5, Table 6 and Table 7 refer to all combinations used to treat patients with visual dysfunctions.
Table 3.
The average transmittance of each monochromatic filter in the seven basic wavelength ranges of the VLS.
Table 4.
The average transmittance of Omega combinations in seven different wavelength ranges of the VLS.
Table 5.
The average transmittance of Alpha combinations in seven basic wavelength ranges of the VLS. The Delta–Theta filter is added to this table as it transmits light from the red spectrum.
Table 6.
Illustrates the average transmittance of Upsilon combinations in the seven wavelength ranges of the VLS.
Table 7.
The average transmittance of Mu combinations in seven different wavelength ranges of the VLS.
Table 3 indicates that the Depressant and Pi filter dominates the rest of the monochromatic filters, which transmit light from the blue spectrum. Likewise, Stimulant, Delta, and Theta filters, which transmit light from the red spectrum similarly, show a higher transmittance than Alpha.
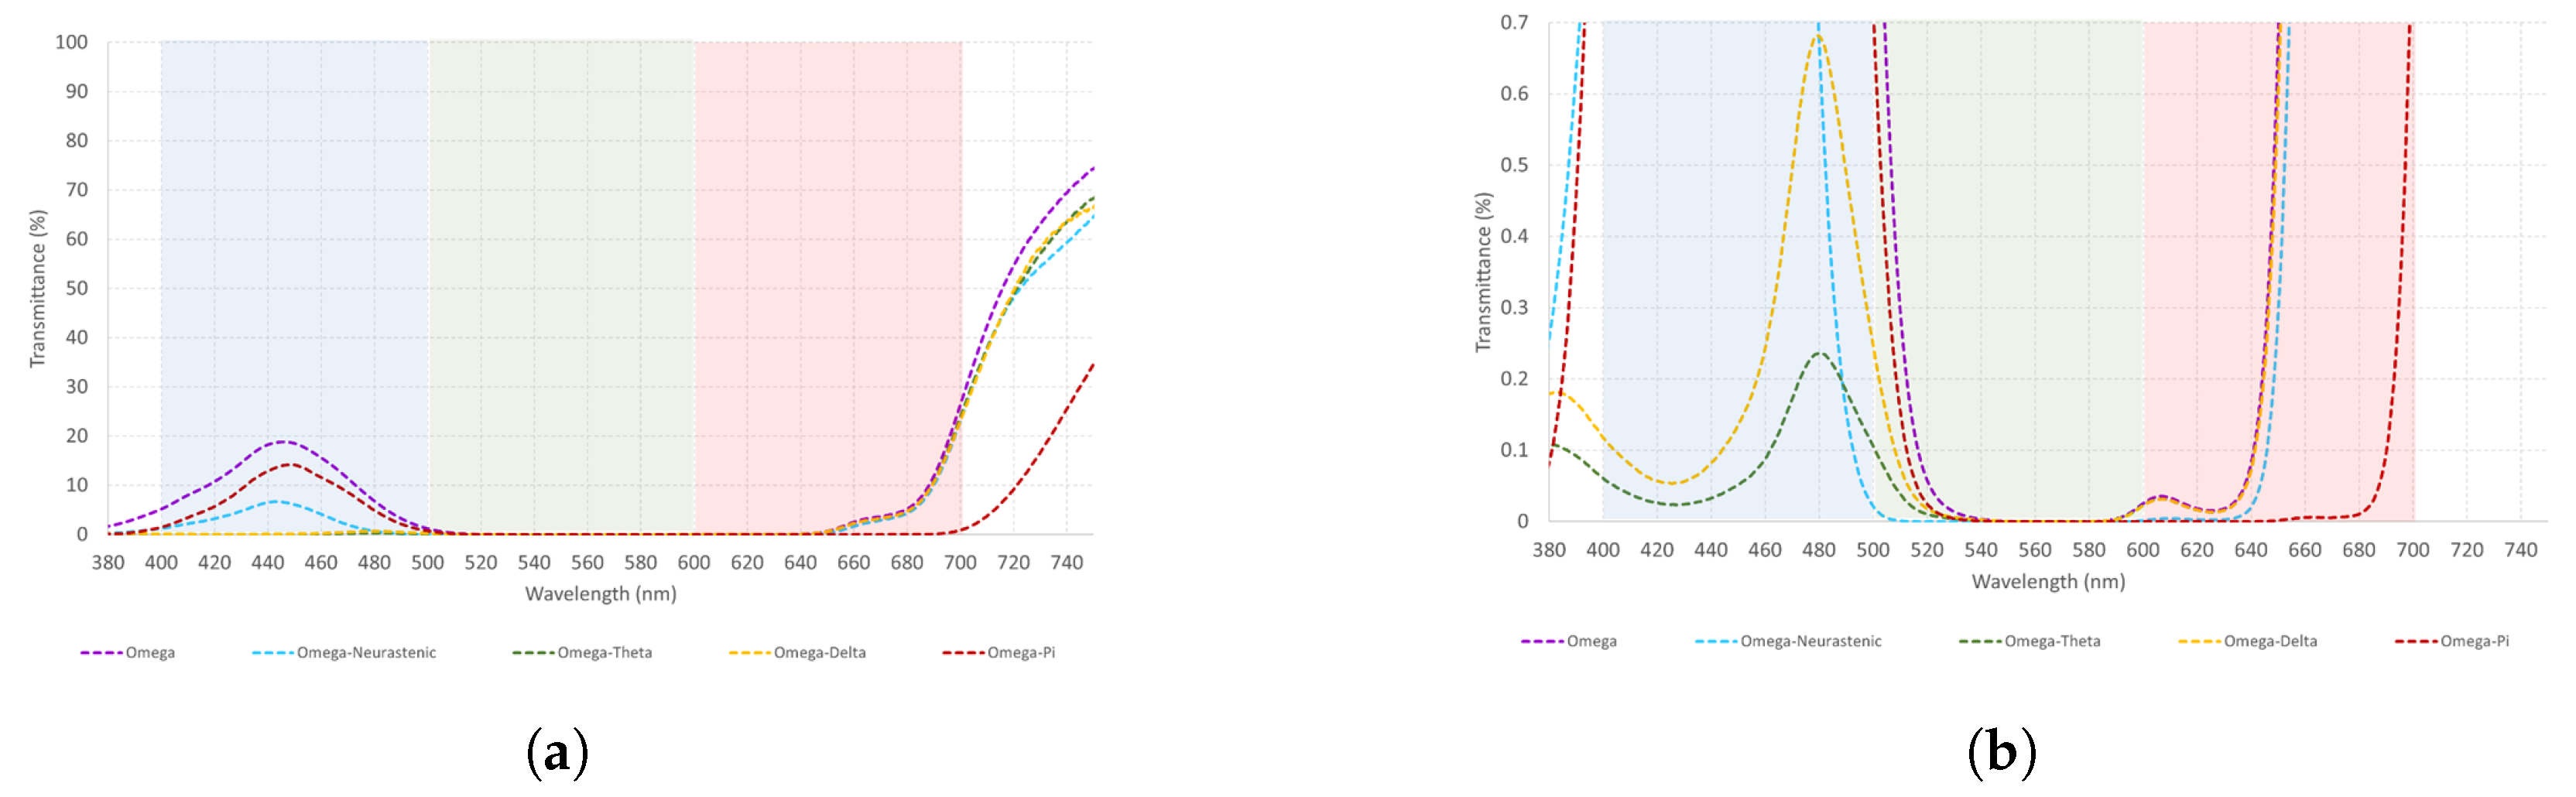
Omega is a short-wavelength filter. Table 4 shows how Omega combinations show a higher light transmittance to the red spectrum than blue, with Omega–Pi being the best combination to transmit light from the blue spectrum. This means that Omega loses power when combined with other monochromatic filters. A graphical representation of these data is illustrated in Figure 3a,b.
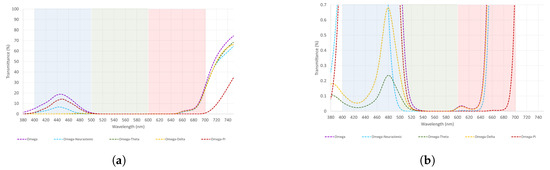
Figure 3.
(a,b) The measured spectral transmittance (from 380 to 750 nm) of Omega combinations in two different scales for its better understanding. The colors on the graphs are chosen to represent in the best possible way the colors perceived through each combination.
Taking into consideration that Omega and its combinations are used to transmit light from the blue spectrum, as seen from Figure 3, Omega–Pi should be the first choice. Nonetheless, this combination transmits light from the blue and red spectrum in the same way as well.
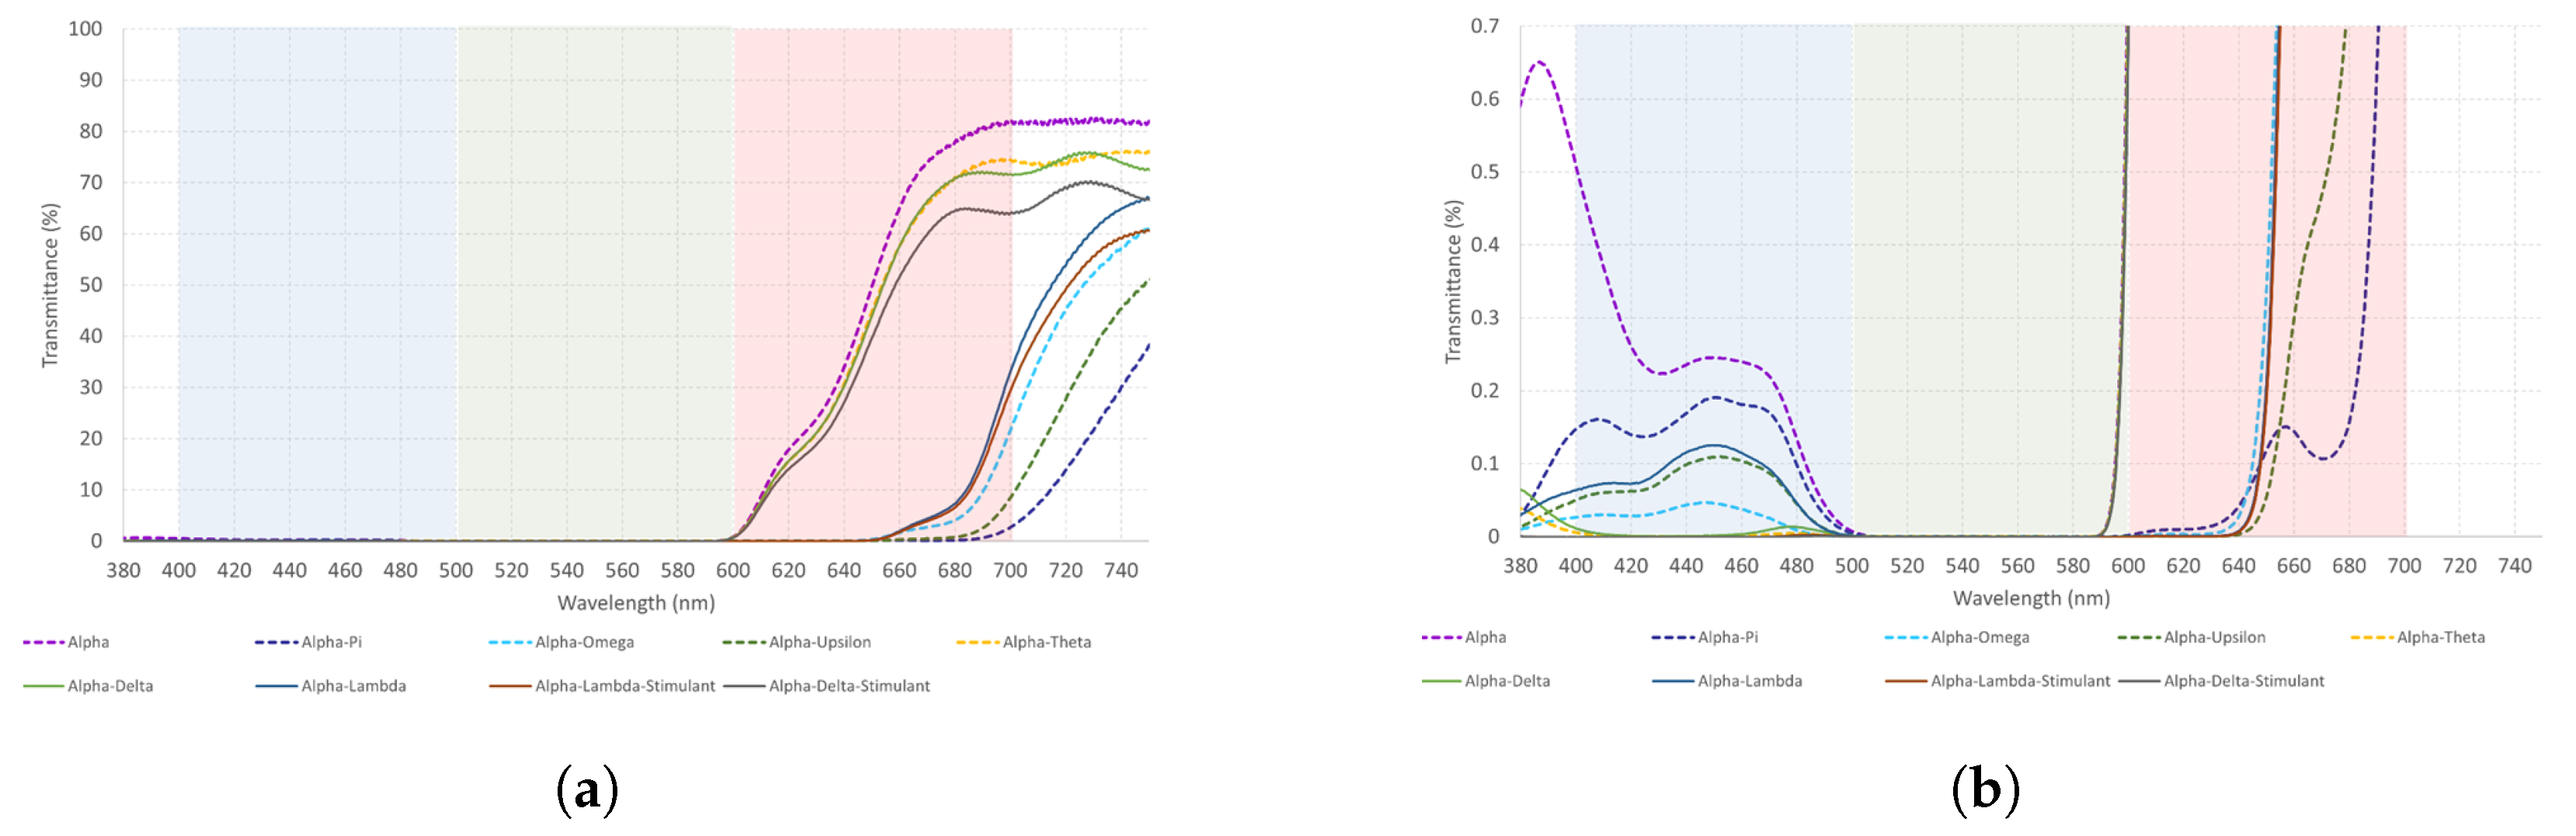
Alpha is a long-wavelength filter. Table 5 shows that Alpha–Delta and Alpha–Theta transmit light from the red spectrum almost the same way, followed by Alpha–Delta–S. However, when Delta and Theta are combined, transmittance increases. Even though there is a decrease in Alpha transmittance when combined with short-wavelength filters, it remains higher in the red than blue spectrum. See Figure 4a,b and Figure 5 for a more visual representation of these results.
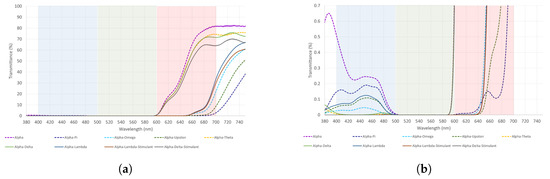
Figure 4.
(a,b) The measured spectral transmittance (from 380 to 750 nm) of Alpha combinations in two different scales for its better understanding. Considering the vast number of Alpha combinations, the colors on the graphs are chosen arbitrarily and do not represent the colors perceived through each combination.
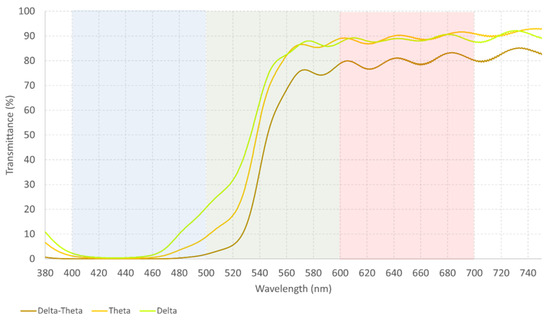
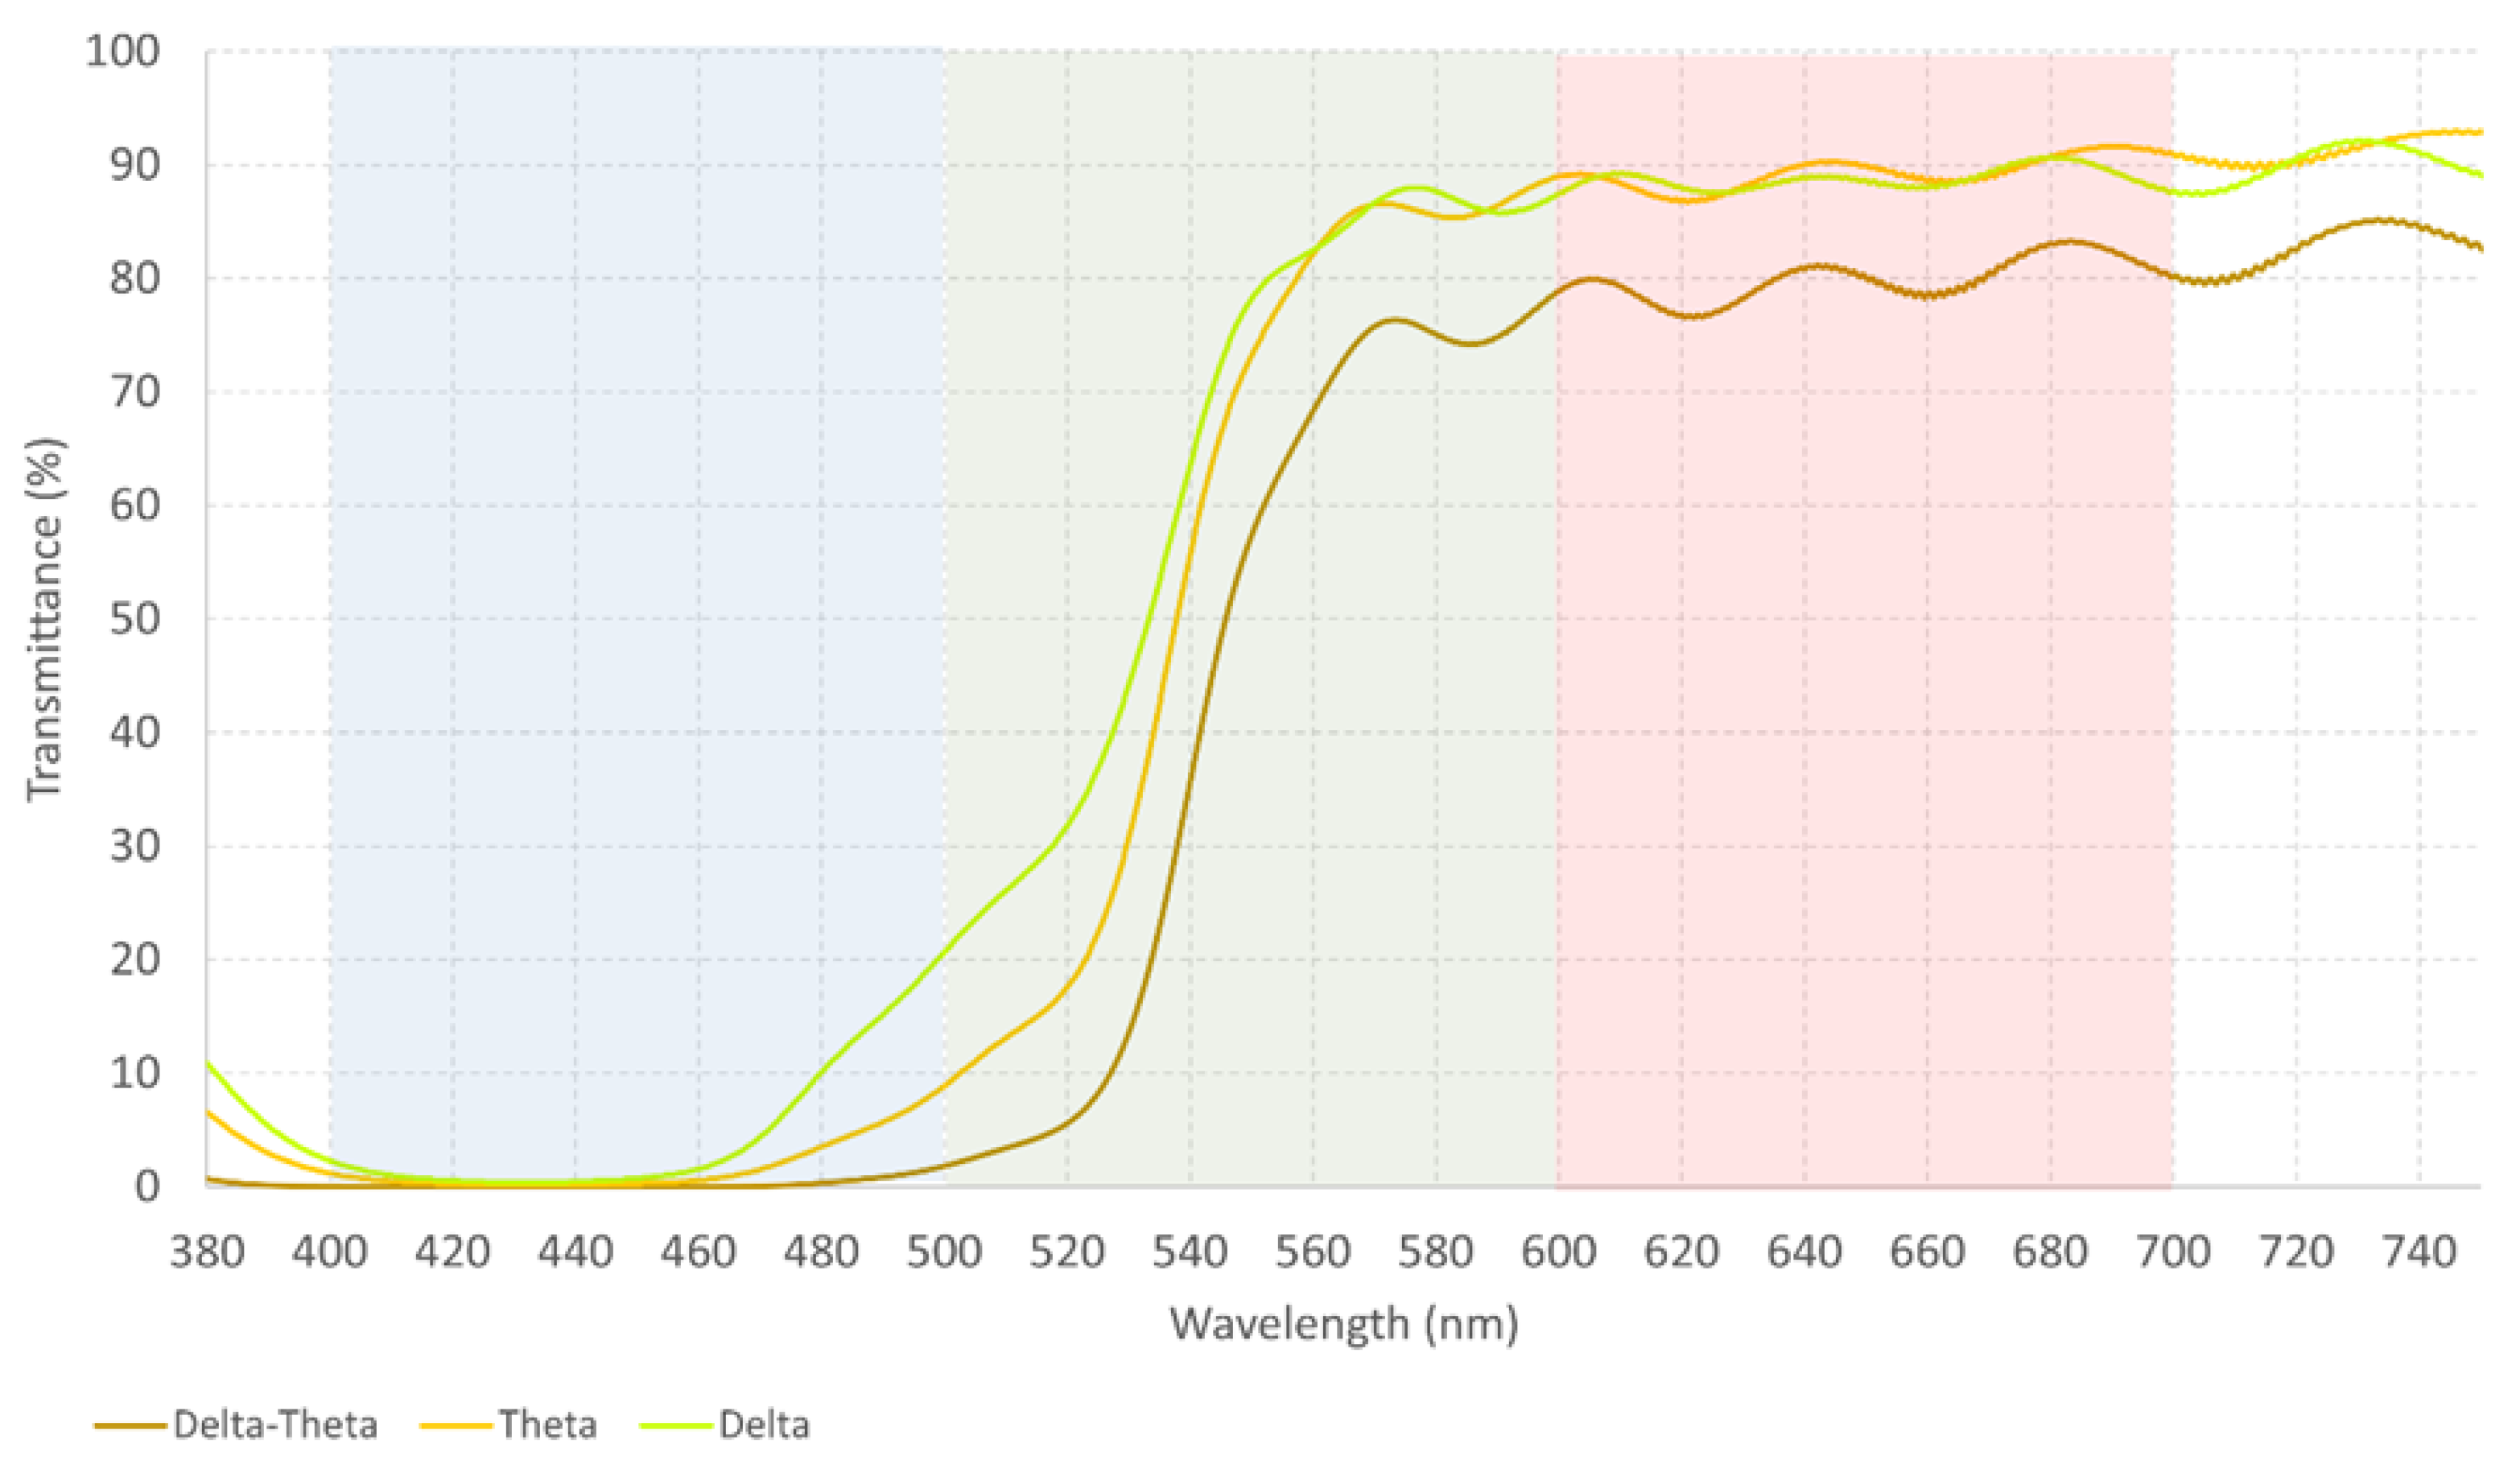
Figure 5.
The measured spectral transmittance (from 380 to 750 nm) of the Delta–Theta filter. The colors on the graphs are chosen to approximately represent the colors perceived through each filter and its combination.
Figure 4 illustrates that no significant changes are found between Alpha–Delta and Alpha–Theta combinations. They transmit light from the red spectrum almost exactly the same way and could be interchangeable. Nonetheless, if we are looking for a stronger reaction, Delta–Theta should be used as Figure 5 shows.
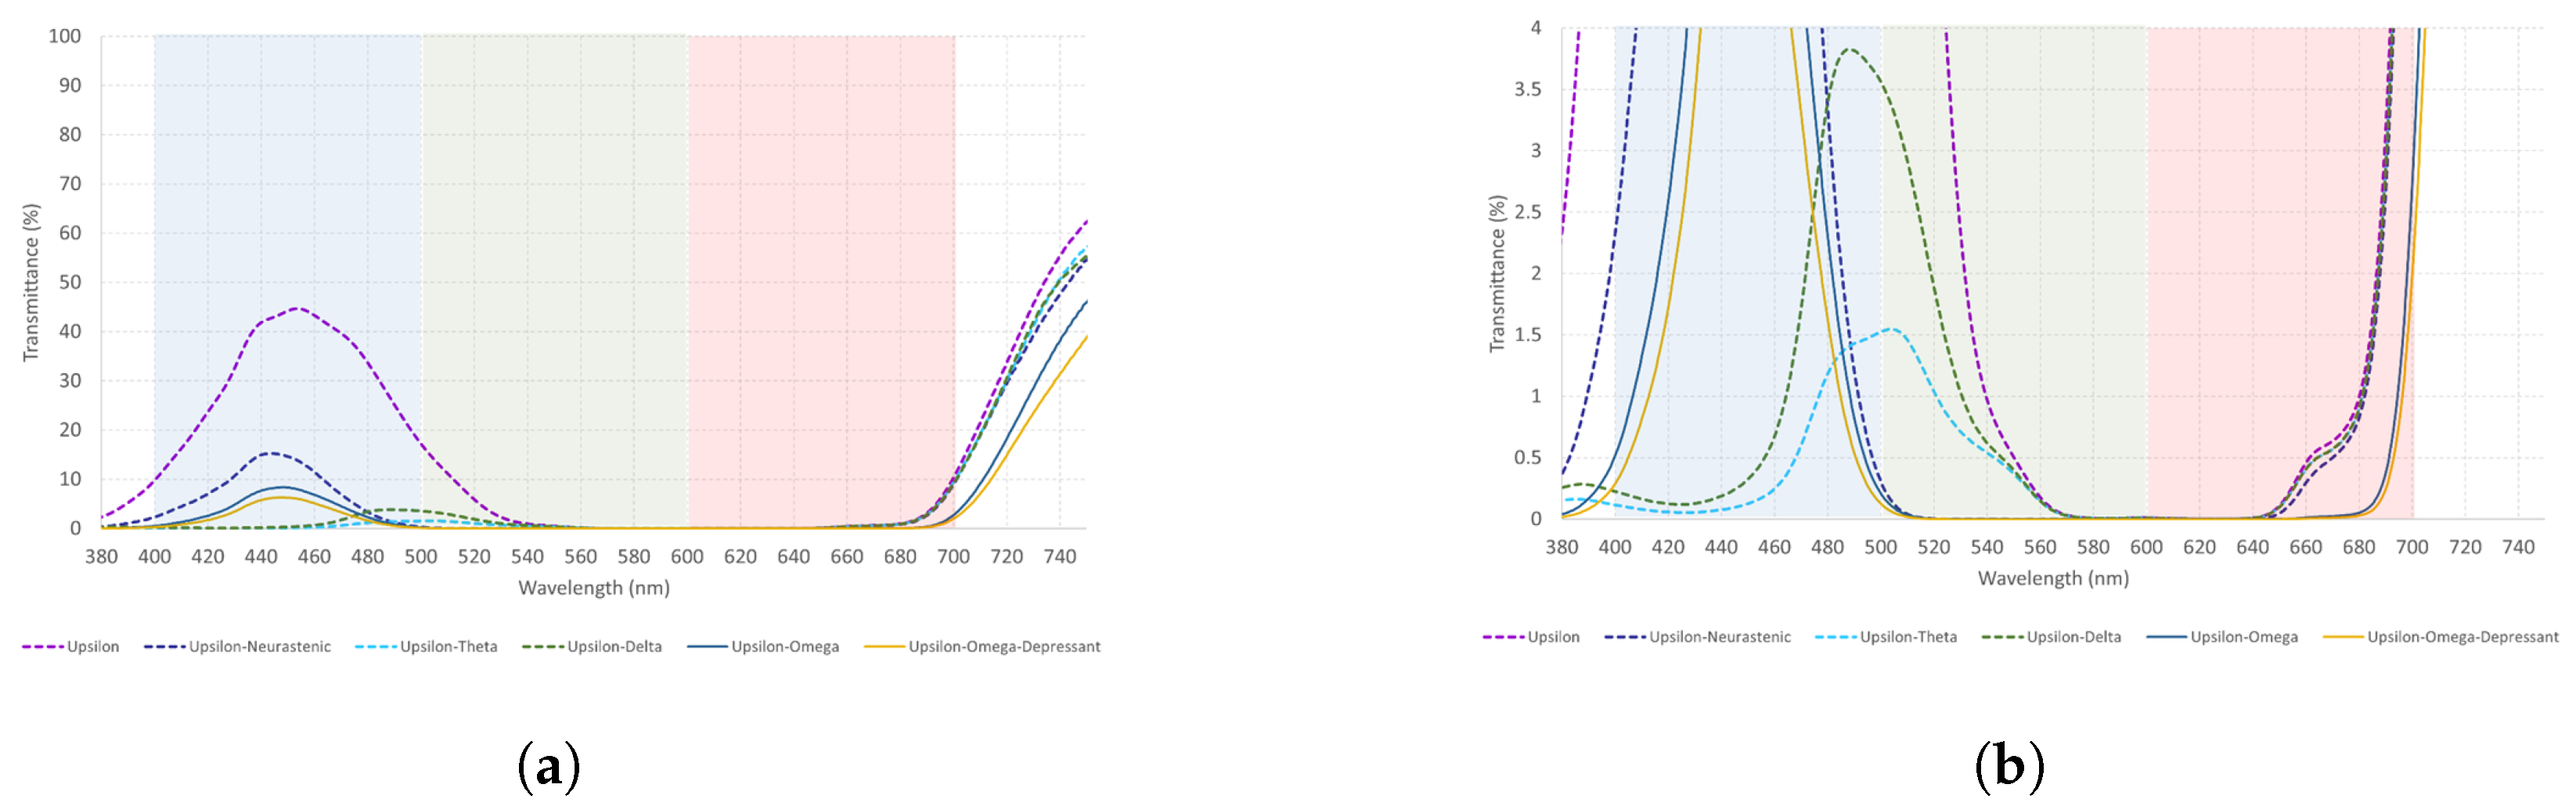
Upsilon is a short-wavelength filter. From Table 6, it can be seen that even when combined with other short-wavelength filters, there is a higher light transmittance to the red than blue spectrum, Upsilon–Neurasthenic the best combination to transmit light from the blue spectrum, followed by Upsilon–Omega and Upsilon–O–D. A graphical representation of these results is illustrated in Figure 6a,b.
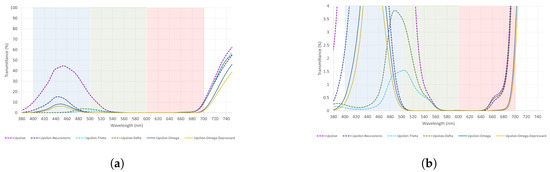
Figure 6.
(a,b) The measured spectral transmittance (from 380 to 750 nm) of Upsilon combinations in two different scales for its better understanding. Considering the number of combinations, the colors on the graphs are chosen arbitrarily and do not represent the colors perceived through each combination.
From Figure 6, it can be seen that Upsilon combinations have a higher light transmittance to the red than blue spectrum. Therefore, their use should not be recommended when the goal is to transmit light from the blue spectrum.
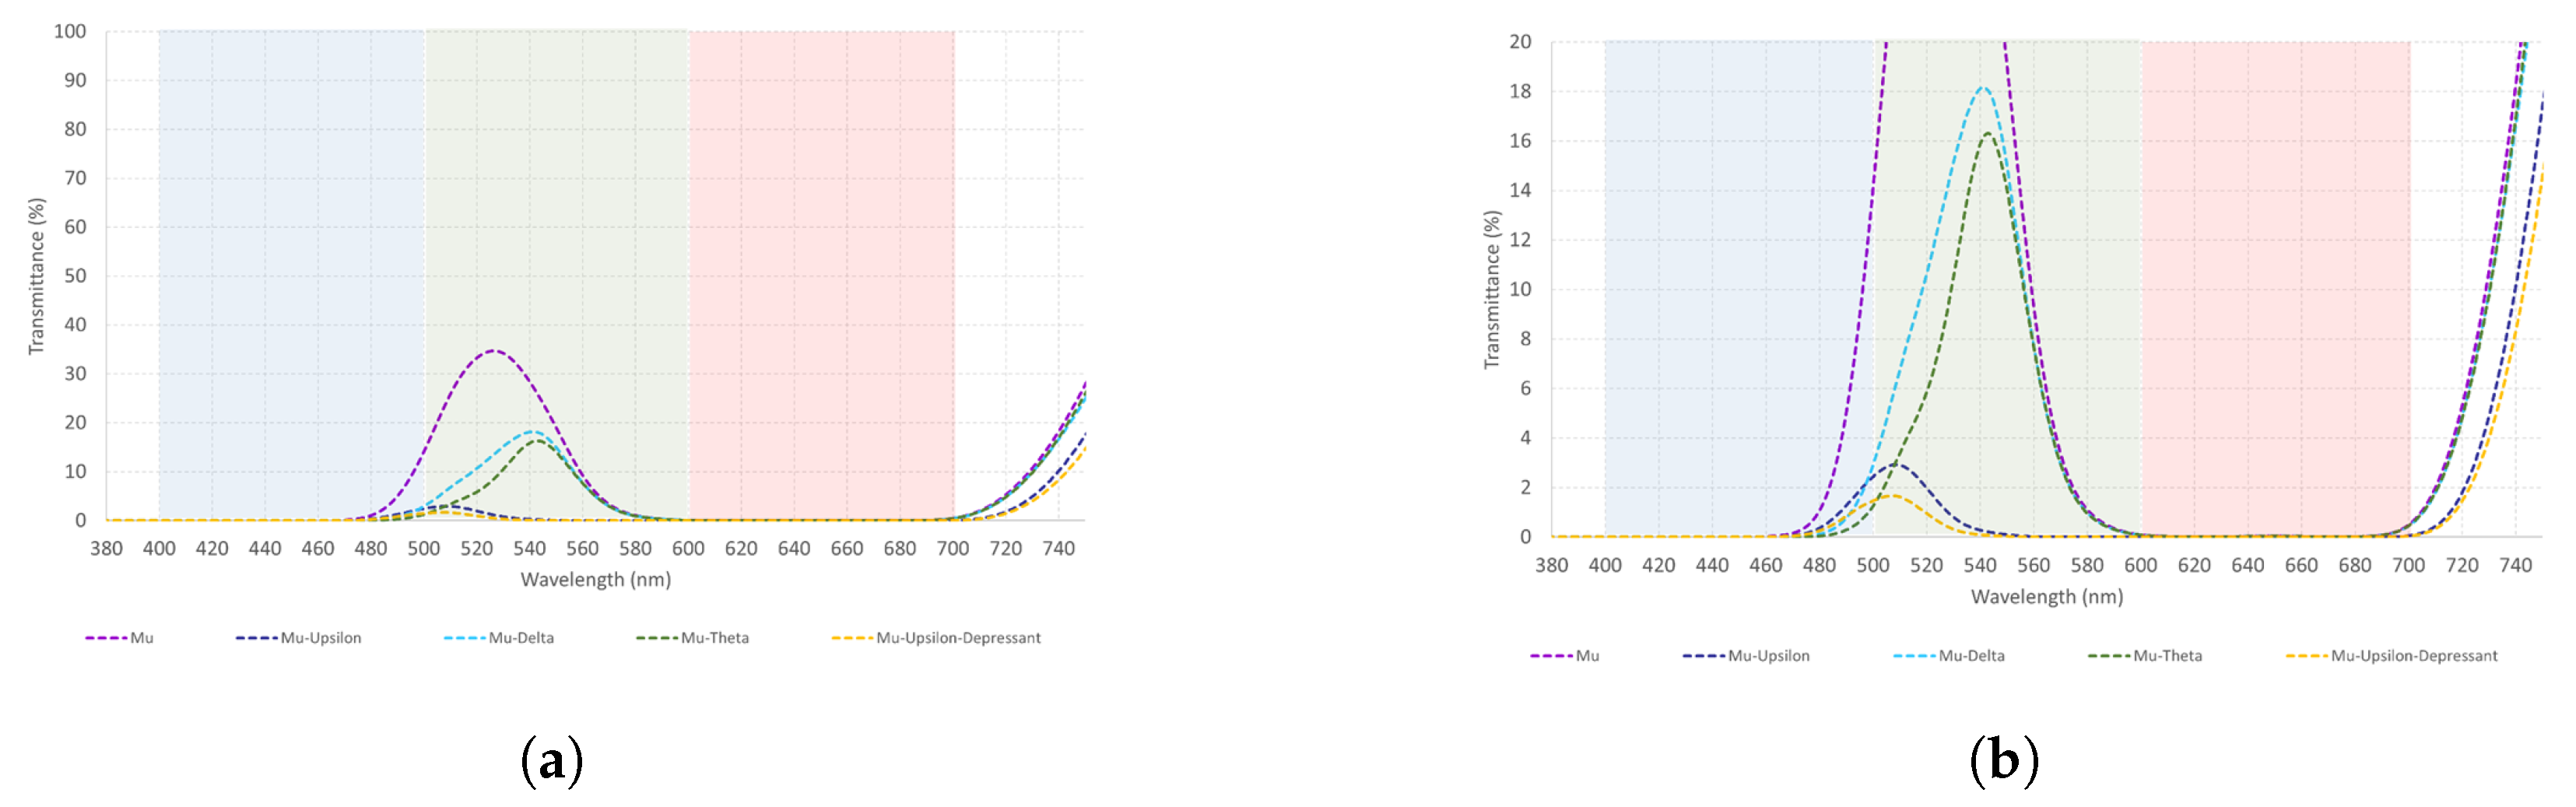
Mu is a mid-wavelength filter. Results from Table 7 suggest that Mu–Delta is the best filter to transmit light to the green spectrum, followed by Mu–Theta. Additionally, these combinations transmit light from the red spectrum in almost the same way. Refer to Figure 7a,b, for a better visual understanding of the data.
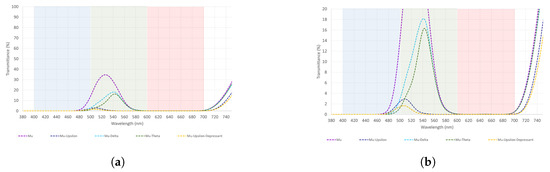
Figure 7.
(a,b) The measured spectral transmittance (from 380 to 750 nm) of Mu combinations in two different scales for its better understanding. The colors on the graphs are chosen arbitrarily and do not represent the colors perceived through each combination.
As shown in Figure 7, Mu–Delta and Mu–Theta transmit light to the green and red spectrum in a very similar way. These combinations could be used in both cases interchangeably. Nevertheless, Mu–Delta should be preferred as transmittance from the green spectrum is higher than the red one.
2.2. Effect on the Three Cone Cells of the Retina and Their Relative Sensitivity to Each Wavelength
The examination consisted of analyzing the response of the retinal cone cells to all filters measured in this paper. The sensitivity functions of the cones used in the graphs (, and x-bar) were obtained from the International Commission on Illumination (ICN). These functions are described as CIE 1931 Color Matching Functions. This set of color-matching functions is representative of the color-matching properties of observers with normal color vision for visual field sizes of angular subtense from about to about for vision at photopic levels of adaptation. The eye sensitivity under their effect is presented in Table 8, Table 9, Table 10, Table 11 and Table 12. These values correspond to the percentage perceived by the cone at each wavelength interval under the effect of the filter. The five most representative wavelength ranges were chosen for the analysis to simplify the sensitivity functions of the three cone cells and only focus on the most relevant data. Likewise, Figure 8 was added to help visualize the maximum and minimum effect of the measured filters on each cone.
Table 8.
The response of the three cone cells of the retina to each monochromatic filter. The z, y, and x-bars represent “the sensitivity functions of the blue, green and red cone cells” as determined by the ICN. The percentage of “relative sensitivity” was calculated for the five most representative wavelength ranges of the VLS.
Table 9.
The response of the retinal cone cells to every Omega combination. The z, y, and x-bars represent “the sensitivity functions of the blue, green and red cone cells” as determined by the ICN. The percentage of “relative sensitivity” was calculated for the five wavelength ranges of the VLS.
Table 10.
The response of the three cone cells of the retina to all alpha combinations. The z, y, and x-bars represent “the sensitivity functions of the blue, green and red cone cells” as determined by the ICN. The percentage of “relative sensitivity” was calculated for the five wavelength ranges of the VLS.
Table 11.
The response of the retinal cone cells to each Upsilon combination. The z, y, and x-bars represent “the sensitivity functions of the blue, green and red cone cells” as determined by the ICN. The percentage of “relative sensitivity” was calculated for the five wavelength ranges of the VLS.
Table 12.
The response of the three cone cells of the retina to all Mu combinations. The z, y, and x-bars represent “the sensitivity functions of the blue, green and red cones” as determined by the ICN. The percentage of “relative sensitivity” was calculated for the five wavelength ranges of the VLS.
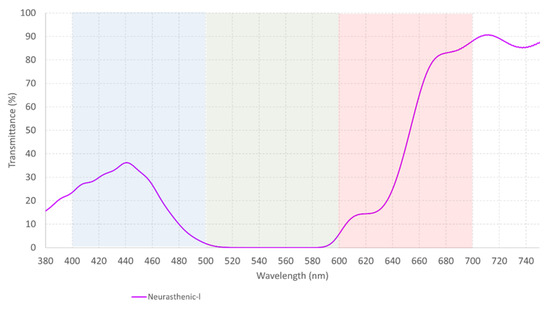
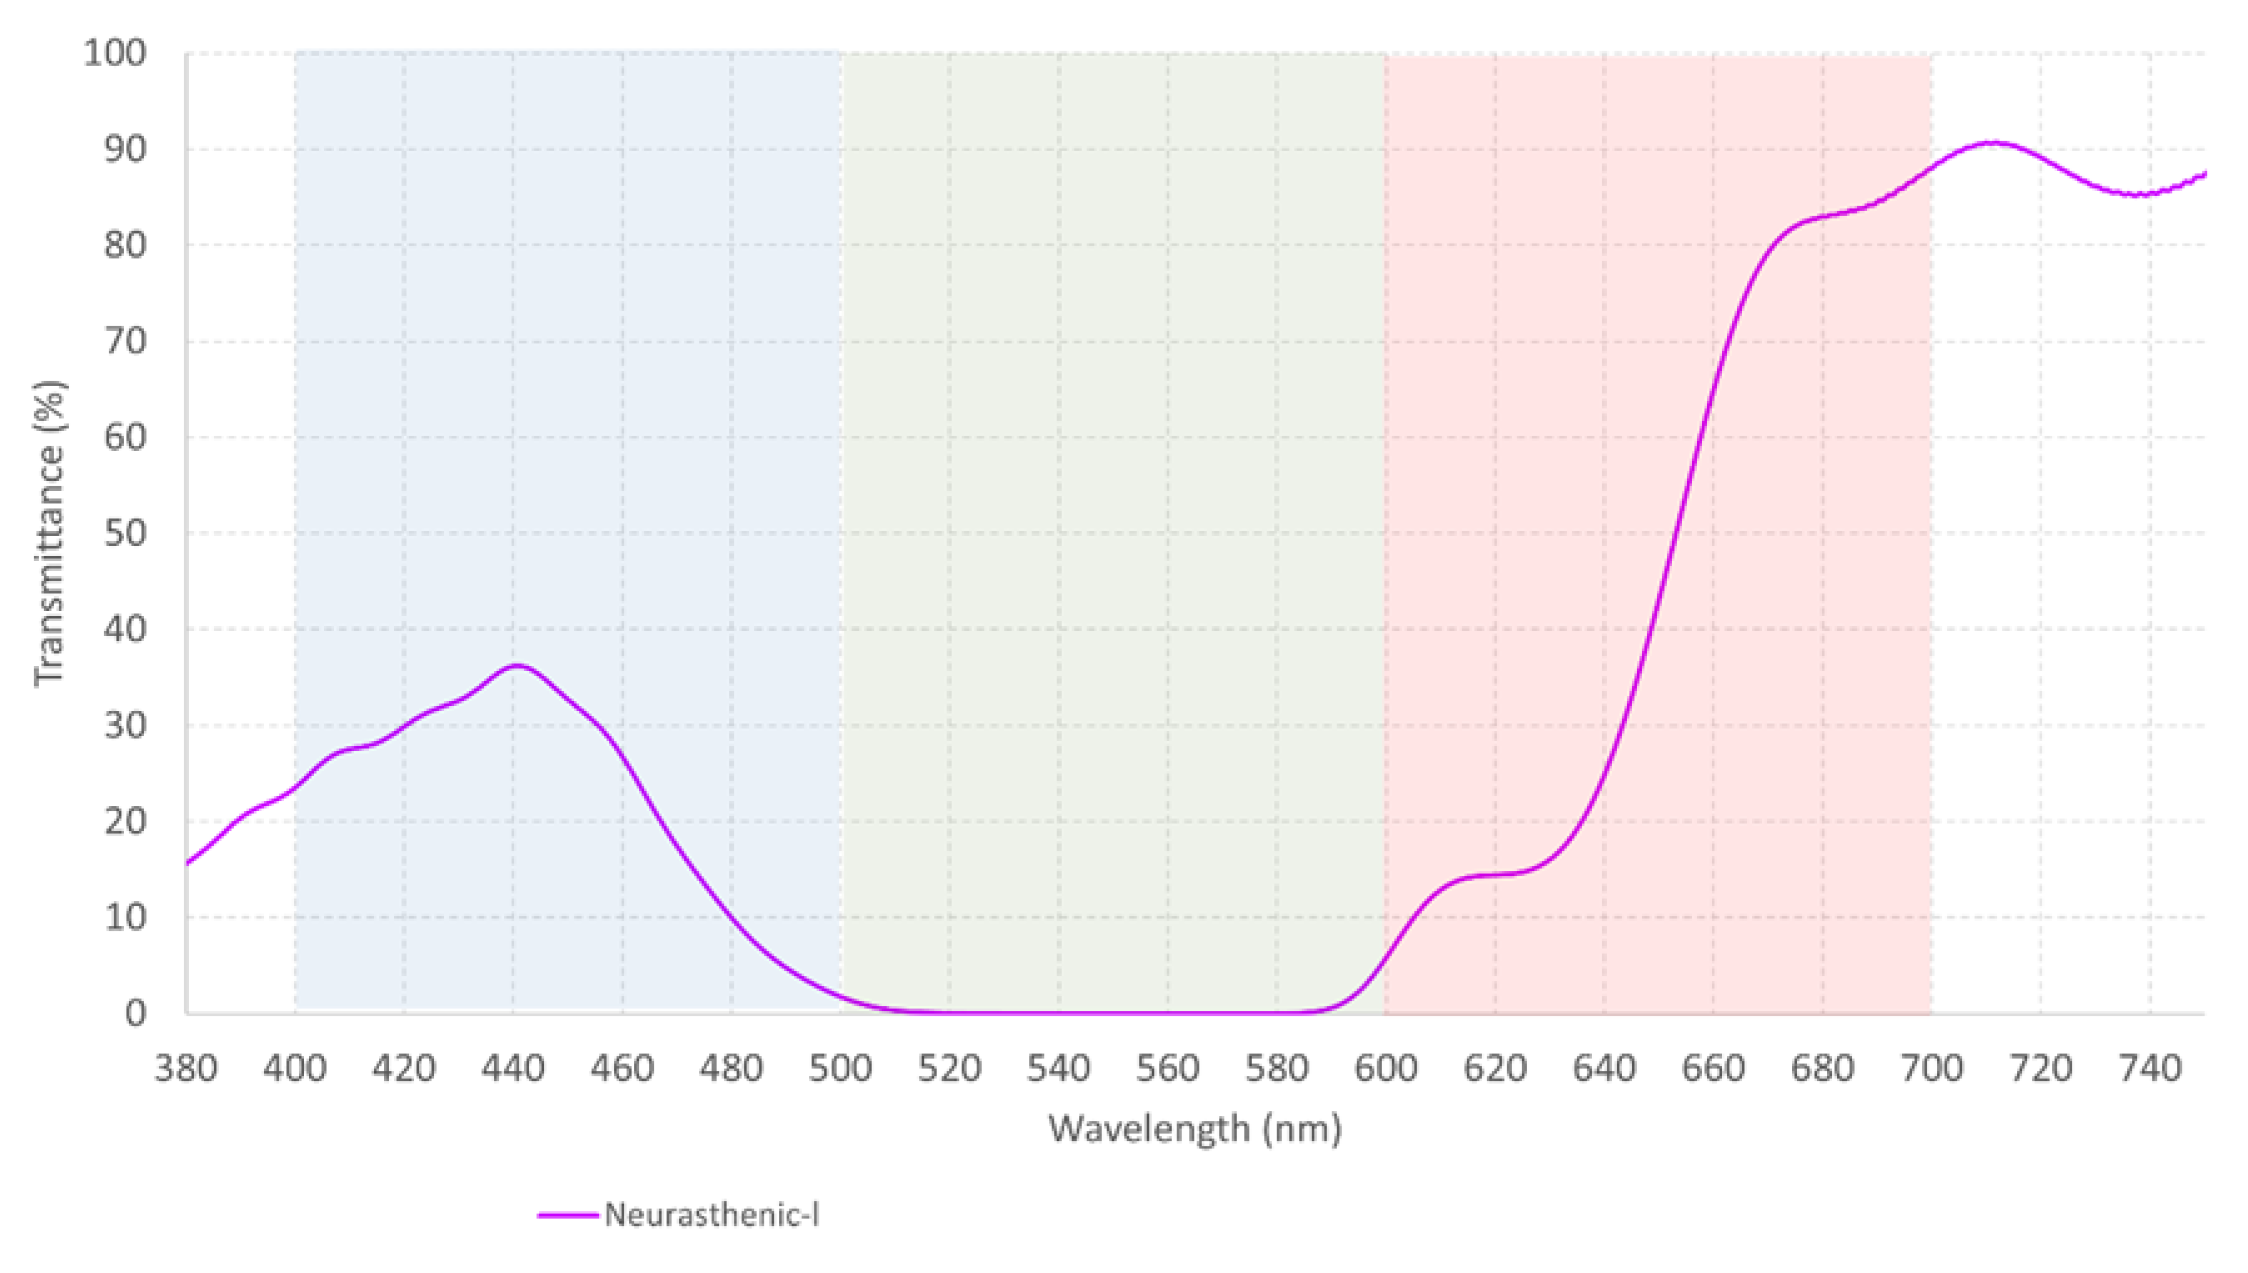
Figure 8.
The measured spectral transmittance (from 380 to 750 nm) of the neurasthenic filter. The color on the graph represents the color perceived through the filter.
Table 8 illustrates that short-wavelength filters show a higher sensitivity to the blue cone cells (numbers in bold), followed by the red cones, except for the Pi filter, which has its second peak on the green cones. Long-wavelength filters have a more significant impact on the green cones, followed by the red cone cells, but for the Alpha filter, its higher peak on the red cones is followed by the green cones.
We can see in Table 9 how combined short-wavelength filters show a weak effect on the cone cells of the retina. There is a remarkable decrease in their power, Omega–Neurasthenic and Omega–Pi the only two combinations with a weak effect on the blue cone. Nevertheless, the percentage of the relative sensitivity on the green and red cones is insignificant.
Results from Table 10 indicate that when a long-wavelength filter (Alpha) is combined with a short-wavelength one (Omega, Upsilon, Pi, Lambda), the relative sensitivity on the three cone cells of the retina is insignificant. Only the Alpha–Delta and Alpha–Theta combinations show a weak effect on the red cone cell and even weaker on the green cone. When three long-wavelength filters are combined, the effect on the red cone decreases even more, as represented by the Alpha–Delta–S filter. Delta–Theta is the best combination, with a higher impact on the green and posteriorly the red cone cell.
Table 11 suggests that the Upsilon–Neurasthenic and Upsilon–Omega are the strongest combinations despite their weak impact on the blue cone cells. The more filters are combined, the weaker their effect on the retinal cone cells, as Upsilon–O–D represents.
Table 12 indicates that Mu–Delta and Mu–Theta are the only two combinations worth analyzing, despite their weak effect on the green cone cells and even weaker effect on the red ones. When a mid-wavelength filter is combined with a short-wavelength one, the effect on the cone cells of the retina is insignificant.
As already mentioned, to simplify the understanding of the eye’s reaction (cone cells response) to each filter and their combinations, a graphical example is presented in Figure 8 and Figure 9a–d. The neurasthenic graphs were arbitrarily chosen for this purpose.

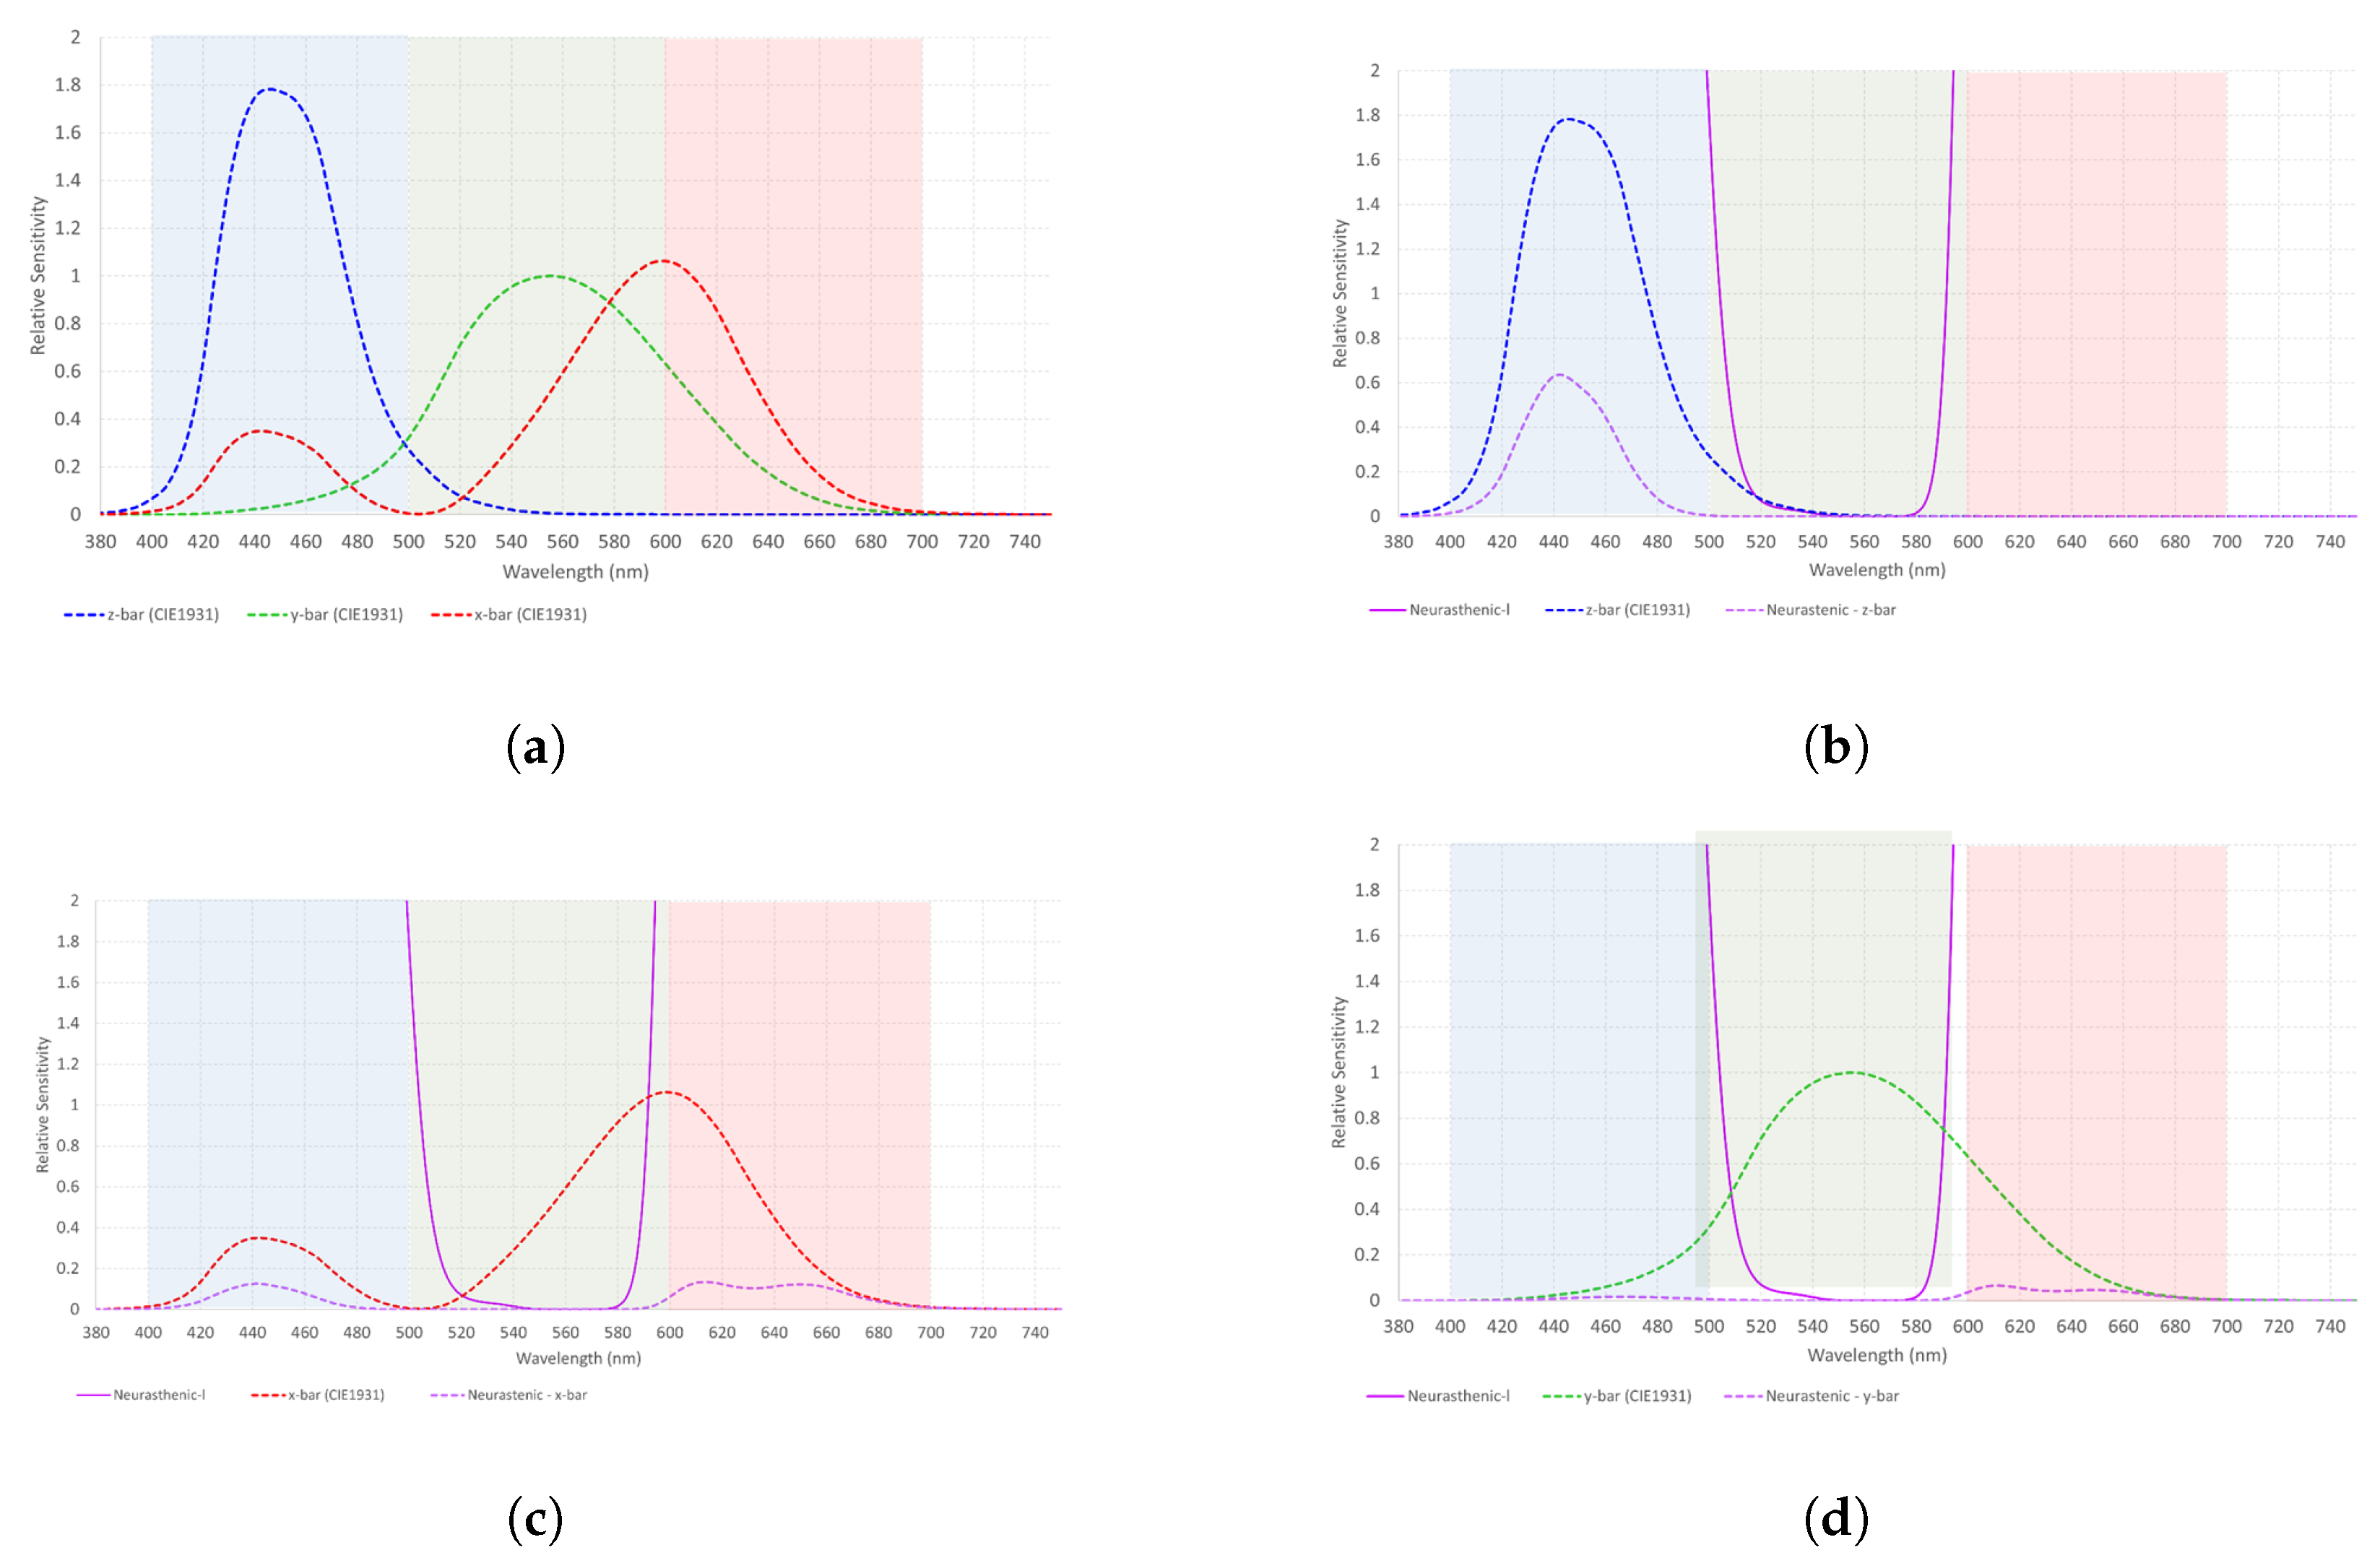
Figure 9.
(a) The relative sensitivity of the blue, green, and red cone cells obtained from the International Commission on Illumination; (b) The relative sensitivity of the blue cone cells obtained from the International Commission on Illumination and how it changes under the effect of the neurasthenic filter. There is a diminished response of the blue cone cell with the filter on; (c) The relative sensitivity of the red cone cells obtained from the International Commission on Illumination and its diminished response with the neurasthenic filter on; and (d) The relative sensitivity of the green cone cells obtained from the International Commission on Illumination and how it reacts to the neurasthenic filter. There is a significant decrease on its value with the filter on.
2.3. Comparison of Five Glass and Polymer Filters
In clinical practice, two different devices are used to treat patients with visual dysfunction. The first uses glass filters (commonly used at the office for the evaluation protocol), and the other one (frequently used by patients at home during 20 consecutive days, the complete cycle of phototherapy) uses polymer filters. We considered it interesting to compare their wavelength, transmittance, and relative sensitivity to see their similarities and/or differences. These five short- and long-wavelength glass filters were arbitrarily chosen to be compared to the polymer ones. The characterization and properties of the five monochromatic glass filters chosen for this purpose are illustrated in Table 12, Table 13, Table 14 and Table 15 and Figure 10 and Figure 11.
Table 13.
The wavelength and transmittance of five monochromatic glass filters measured in this study.
Table 14.
The average transmittance of five monochromatic glass filters in the seven basic wavelength ranges of the VLS.
Table 15.
The response of the retinal cone cells to these five monochromatic glass filters. The z, y, and x-bars represent “the sensitivity functions of the blue, green and red cones” as determined by the ICN. The percentage of “relative sensitivity” was calculated for the five wavelength ranges of the VLS.

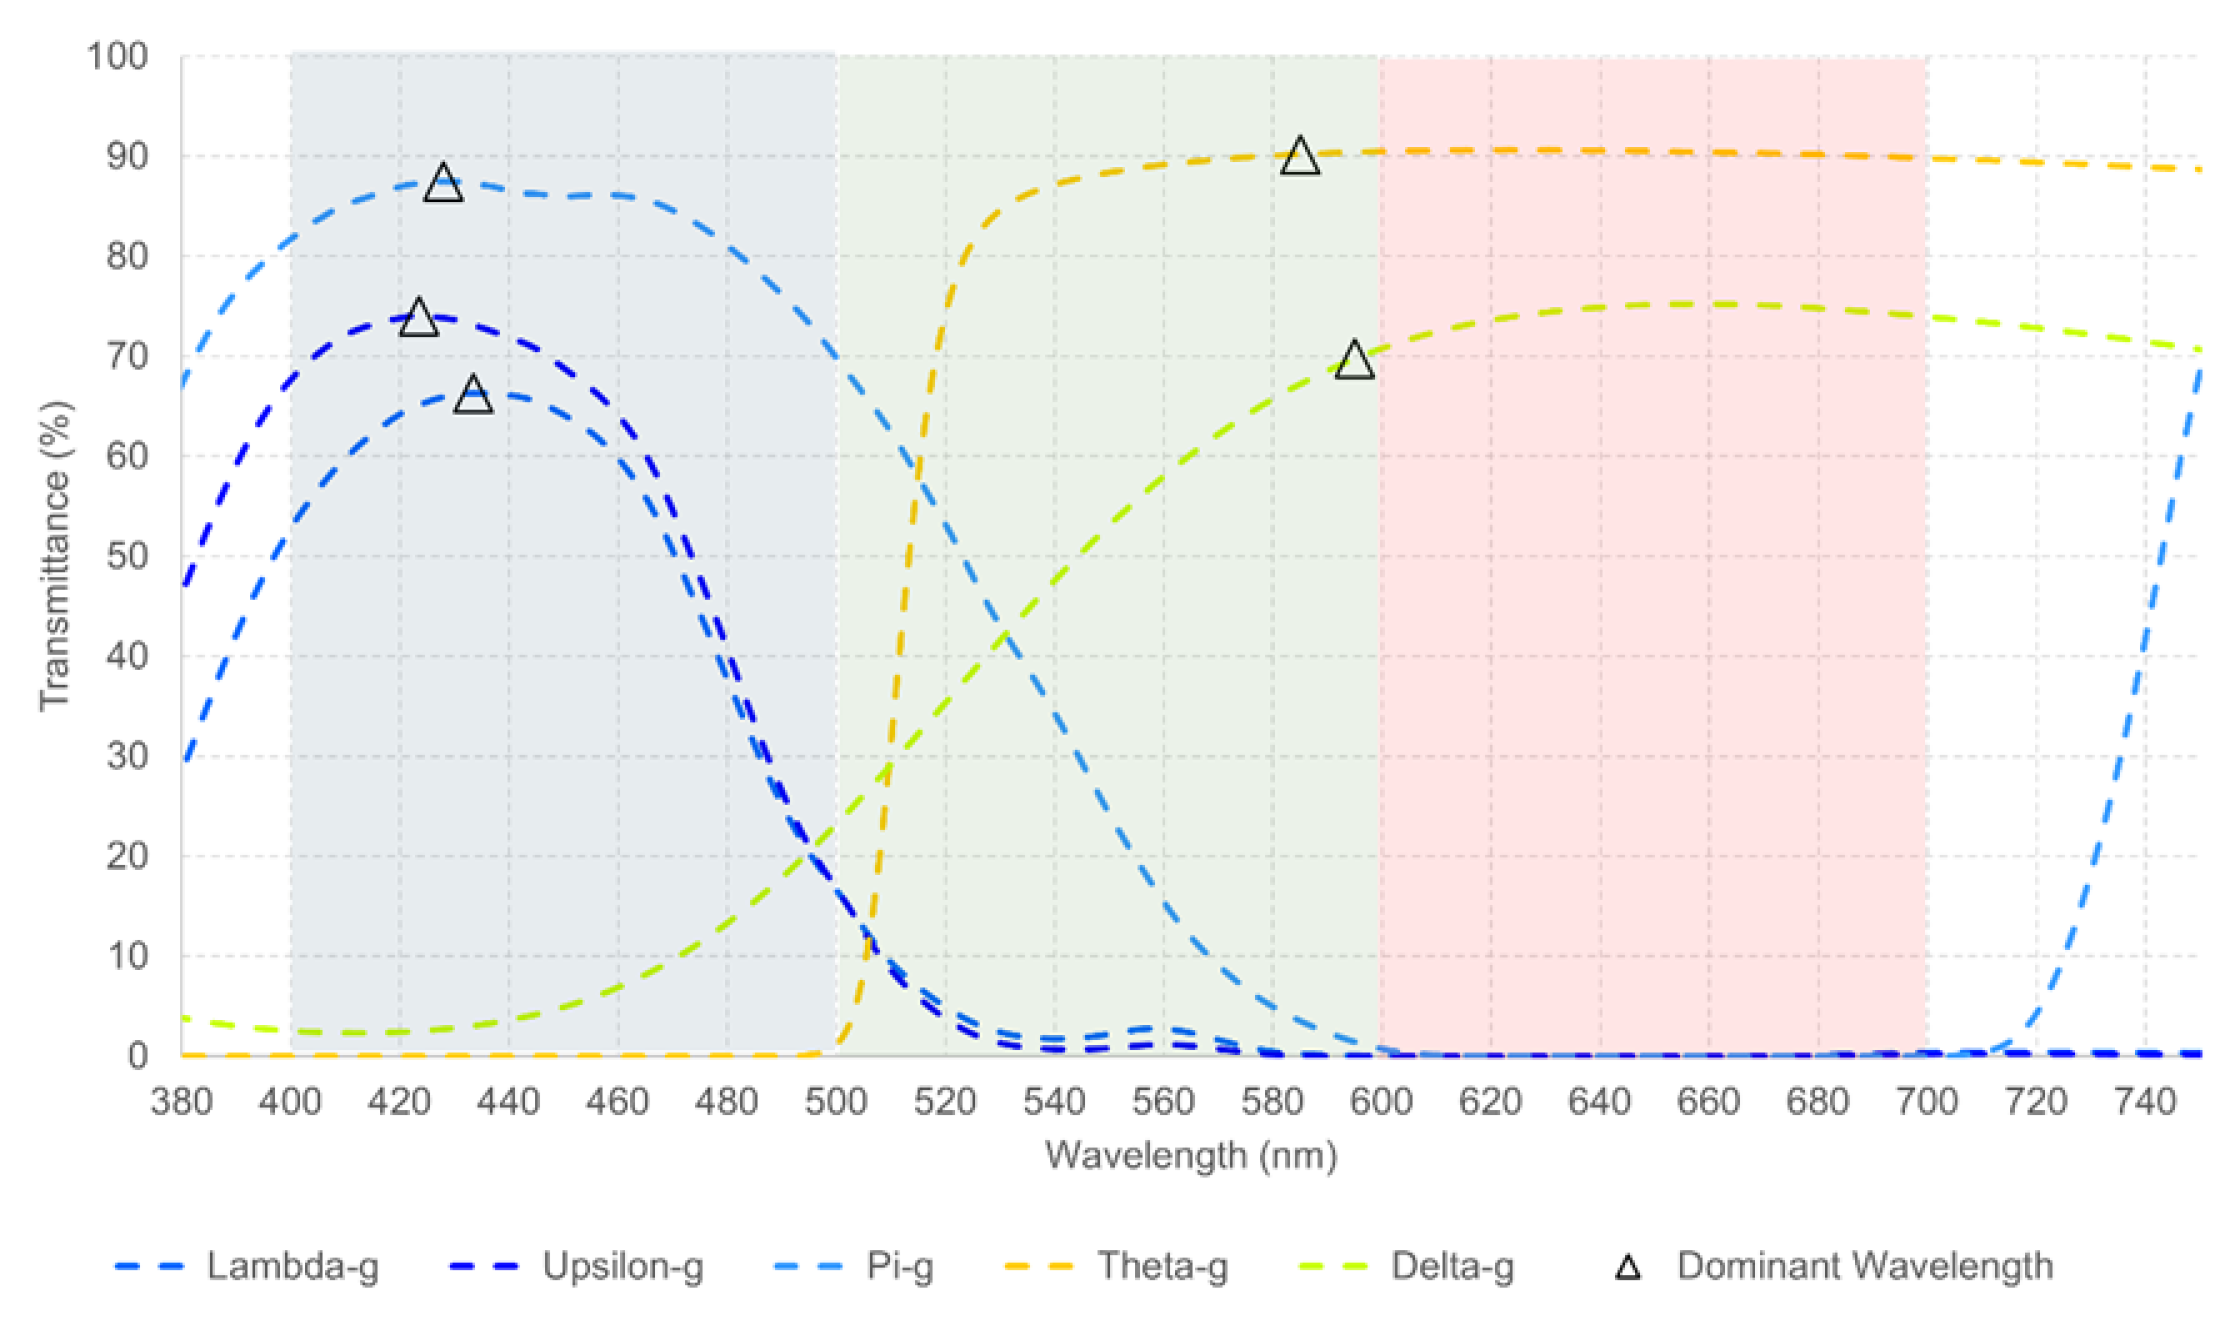
Figure 10.
The measured spectral transmittance (from 380 to 750 nm) for the dominant wavelength of five monochromatic glass filters, with each dominant wavelength marked by a triangle. The colors shown in the graphs closely resemble the colors perceived through each filter. The dominant wavelength, defined as “the wavelength with the highest transmittance in the measured spectra”, falls within the ranges specified in the Visible Light Spectrum (Table 1) and corresponds to the perceived color of each filter.
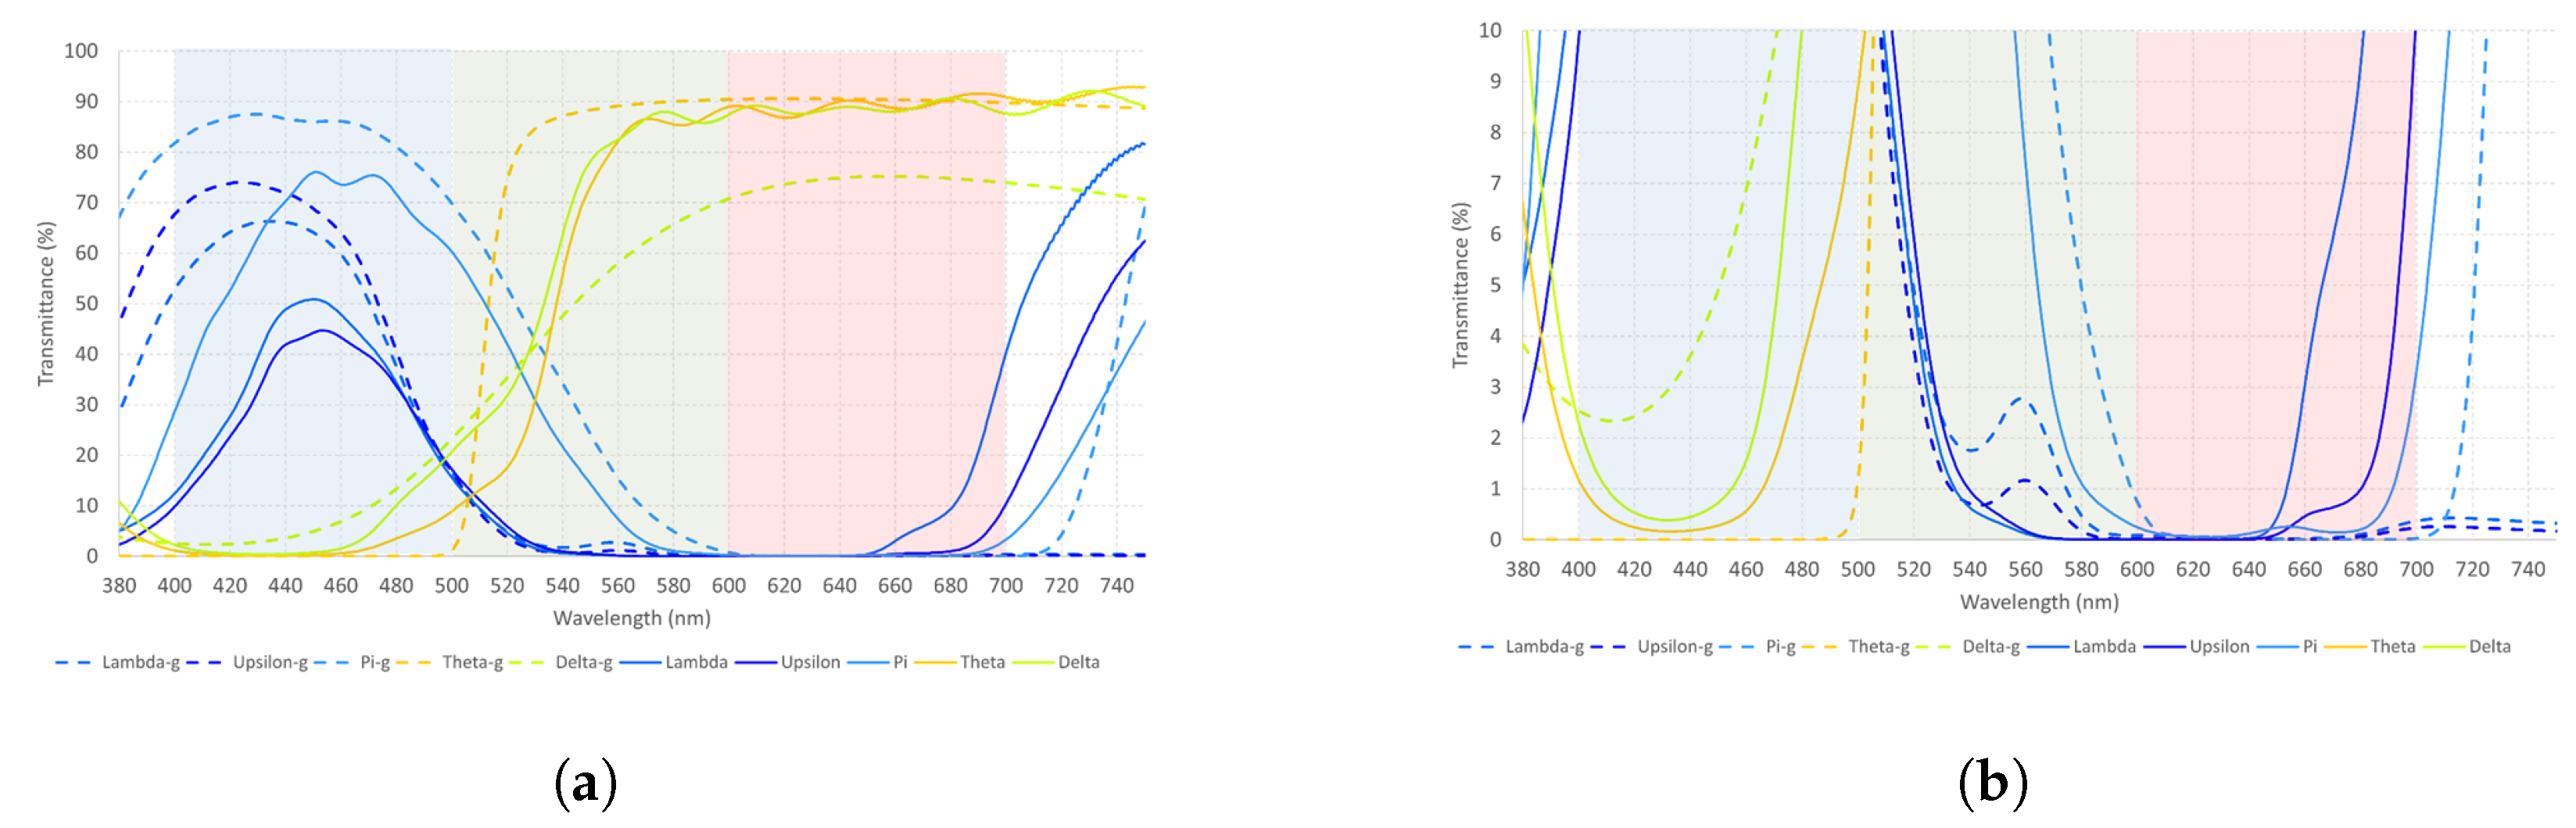
Figure 11.
(a,b) The measured spectral transmittance (from 380 to 750 nm) of the five glass filters (dotted line) and their polymer counterparts (whole line) in two different scales. The colors on the graphs are chosen to approximately represent the colors perceived through each filter.
Table 14 indicates that the Pi filter transmits light from the blue spectrum at a higher % than Upsilon and Lambda. Theta, on the other hand, transmits light from the red spectrum better than Delta. Moreover, some differences can be appreciated if these results are compared to those in Table 3. The most significant difference is the transmittance on the red spectrum when glass is compared to polymer filters. For Lambda and Upsilon, the transmittance of light to the red spectrum is insignificant. Additionally, glass filters show a greater transmittance in their corresponding wavelengths than polymer ones.
Data in Table 15 illustrate that short-wavelength filters have a significant impact on the blue cone cells and a second peak on the red cone, except for the Pi filter, with its second peak on the green cone cell. Likewise, the long-wavelength filters have a bigger effect on the green cone cells, followed by the red ones. If we compare these data with those of Table 8, the effect on the cone cells is higher for Theta, Lambda, and Pi but lower for Delta and Upsilon. Their transmittances and wavelengths are presented in Figure 11a,b to compare glass and polymer filters visually.
Figure 11 shows a higher transmittance rate for the glass filters compared to the polymers. Differences are greater for filters that transmit light from the blue spectrum when compared to the red spectrum. The significance of this in clinical practice remains unknown. It should be analyzed to measure whether there is an important change in the cortical networks of patients with visual dysfunctions when using glass or polymer filters.
Considering that light entering the visual system is transmitted to the retina and captured by its photoreceptors, Table 16 was added, recommending the principal filters and combinations to be considered when treating patients with visual dysfunctions.
Table 16.
The effect of monochromatic and combined filters on the relative sensitivity of cone cells of the retina, identified by the number of “x”.
Table 16 suggests that combinations could be reduced by half or more (considering that at least four combinations can be interchangeable), as the effect on the relative sensitivity of cone cells of the retina for the other half is insignificant. This would reduce the cost of the treatment and time and boost efficiency. Based on these new data and results from our previous studies using VEPs and qEEGs, a new protocol is being elaborated to increase light stimulation and phototherapy achievements.
3. Conclusions
This paper focused on measuring and characterizing eleven monochromatic filters and twenty-two combinations used empirically in the field of neuro-optometry as an essential part of the visual treatment of patients with visual dysfunctions. This is the first time that their properties were made available to visual health professionals, a crucial step towards the complete understanding of their physical characteristics to propose innovative and enhanced protocols to reduce costs and time and boost the effect of the treatment. One of the most relevant findings was that when two or three filters are combined, regardless of the wavelength, their transmittance and relative sensitivity on the retinal cone cells decrease. Therefore, combined filters may lose efficiency when used in treatments, suggesting that monochromatic filters should be preferred when looking for faster and bigger changes. Nonetheless, considering that filters are also used in patients with mild head trauma and/or patients with different neurological conditions, some combinations should be considered, because of their more attenuated effect on the cone cell response. This would help the visual system to react and recover at its own pace avoiding any disruption to a fragile brain. Additionally, most filters and combinations, regardless of the wavelength, transmit a considerable percentage of light from the red spectrum. These results suggest that the phototherapy treatment protocol used nowadays must be deeply revised, and the number of filters and combinations should be reduced to cut costs and time and boost efficiency.
Author Contributions
Conceptualization, D.I.; methodology, D.I. and G.V.L.; software, D.I. and G.V.L.; validation, M.A. and J.R.R.; formal analysis, D.I.; investigation, D.I., G.V.L. and M.A.; resources, D.I. and J.R.R.; data curation, D.I., G.V.L. and M.A.; writing—original draft preparation, D.I. and M.A.; writing—review and editing, M.A. and J.R.R.; visualization, M.A. and J.R.R.; supervision, J.R.R.; project administration, D.I. All authors have read and agreed to the published version of the manuscript.
Funding
This research received no external funding.
Institutional Review Board Statement
Not applicable.
Informed Consent Statement
Not applicable.
Data Availability Statement
The database is available upon request to the authors.
Conflicts of Interest
The authors declare no conflicts of interest.
References
- Wallace, L. The Theory and Practice of Syntonic Phototherapy: A Review; Editorial Essay: New York, NY, USA, 2009; Volume 40. [Google Scholar]
- Hegedus, B.; Viharos, L.; Gervain, M.; Gálfi, M. The effect of low-level laser in knee osteoarthritis: A double-blind, randomized, placebo-controlled trial. Photomed. Laser Surg. 2009, 27, 577–584. [Google Scholar] [CrossRef] [PubMed]
- Gottlieb, R.L.; Wallace, L.B. Syntonic Phototherapy. Photomed. Laser Surg. 2010, 28, 449–452. [Google Scholar] [CrossRef] [PubMed]
- Kinoshita, M.; Komatsu, H. Neural Representation of the Luminance and Brightness of a Uniform Surface in the Macaque Primary Visual Cortex. J. Neurophysiol. 2001, 86, 2559–2570. [Google Scholar] [CrossRef] [PubMed]
- Gooley, J.J.; Saper, C.B. Anatomy of the Mammalian Circadian System. In Principles and Practice of Sleep Medicine; Elsevier: Amsterdam, The Netherlands, 2017; pp. 343–350.e4. [Google Scholar] [CrossRef]
- Steinhardt, C.R.; Sacré, P.; Sheehan, T.C.; Wittig, J.H.; Inati, S.K.; Sarma, S.; Zaghloul, K.A. Characterizing and predicting cortical evoked responses to direct electrical stimulation of the human brain. Brain Stimul. 2020, 13, 1218–1225. [Google Scholar] [CrossRef] [PubMed]
- Willeford, K.T.; Fimreite, V.; Ciuffreda, K.J. The effect of spectral filters on VEP and alpha-wave responses. J. Optom. 2016, 9, 110–117. [Google Scholar] [CrossRef] [PubMed]
- Ibrahimi, D.; Crúz-Martínez, E.; Valencia Luna, G.; Romero Turrubiates, J.; Rodríguez-Reséndiz, J. The Impact of the Wavelength and Its Transmittance on the Visual Evoked Potentials, at Baseline, and under the Effect of Six Monochromatic Filters Used for Visual Treatments. Sensors 2023, 23, 5227. [Google Scholar] [CrossRef] [PubMed]
- Ibrahimi, D.; Mendiola-Santibañez, J.; Cruz-Martínez, E.; Gómez-Espinosa, A.; Torres-Pacheco, I. Changes in the Brain Activity and Visual Performance of Patients with Strabismus and Amblyopia after a Compete Cycle of Light Therapy. Brain Sci. 2021, 11, 657. [Google Scholar] [CrossRef] [PubMed]
- Ibrahimi, D.; Mendiola-Santibanez, J.D.; Martinez, E.C.; Rodriguez, J.; Pacheco, I.T. Cortical Activity at Baseline and During Light Stimulation in Patients with Strabismus and Amblyopia. IEEE Access 2021, 9, 22430–22446. [Google Scholar] [CrossRef]
- Argilés, M.; Sunyer-Grau, B.; Arteche-Fernandez, S.; Peña-Gómez, C. Functional connectivity of brain networks with three monochromatic wavelengths: A pilot study using resting-state functional magnetic resonance imaging. Sci. Rep. 2022, 12, 16197. [Google Scholar] [CrossRef] [PubMed]
- Kaplan, R. Changes in form visual fields in reading disabled children produced by syntonic (colored light) stimulation. Int. J. Biosoc. Res. 1983, 5, 20–33. [Google Scholar]
- Liberman, J.I. The effect of syntonic (colored light) stimulation on certain visual and cognitive functions. Int. J. Biosoc. Res. 1986, 8, 169–184. [Google Scholar]
- Truong, J.Q.; Ciuffreda, K.J.; Han, M.H.E.; Suchoff, I.B. Photosensitivity in mild traumatic brain injury (mTBI): A retrospective analysis. Brain Inj. 2014, 28, 1283–1287. [Google Scholar] [CrossRef] [PubMed]
- Riddell, P.M.; Wilkins, A.; Hainline, L. The Effect of Colored Lenses on the Visual Evoked Response in Children with Visual Stress. Optom. Vis. Sci. 2006, 83, 299–305. [Google Scholar] [CrossRef] [PubMed]
- Friederichs, E.; Wahl, S. (Re)-wiring a brain with light: Clinical and visual processing findings after application of specific coloured glasses in patients with symptoms of a visual processing disorder (CVPD): Challenge of a possible new perspective? Med. Hypotheses 2017, 105, 49–62. [Google Scholar] [CrossRef] [PubMed]
- Huang, J.; Zong, X.; Wilkins, A.; Jenkins, B.; Bozoki, A.; Cao, Y. fMRI evidence that precision ophthalmic tints reduce cortical hyperactivation in migraine. Cephalalgia 2011, 31, 925–936. [Google Scholar] [CrossRef] [PubMed]
- Downing, J. Clinical EEG and neurophysiological case studies in ocular light therapy. In Proceedings of the Conference *Light Years Ahead*, San José, CA, USA, 9–14 February 1992; Breiling, B., ArgIsle, B., Eds.; Celestial Press: Berkeley, CA, USA, 1996; pp. 133–162. [Google Scholar]
- Commission Internationale de L’Eclairage. ILV: International Lighting Vocabulary; Commission Internationale de L’Eclairage: Vienna, Austria, 2011. [Google Scholar]
Disclaimer/Publisher’s Note: The statements, opinions and data contained in all publications are solely those of the individual author(s) and contributor(s) and not of MDPI and/or the editor(s). MDPI and/or the editor(s) disclaim responsibility for any injury to people or property resulting from any ideas, methods, instructions or products referred to in the content. |
© 2024 by the authors. Licensee MDPI, Basel, Switzerland. This article is an open access article distributed under the terms and conditions of the Creative Commons Attribution (CC BY) license (https://creativecommons.org/licenses/by/4.0/).