Abstract
Background/Objectives: In Korea’s emergency medical system, when an emergency patient arises, patients receive on-site treatment and care during transport at the pre-hospital stage, followed by inpatient treatment upon hospitalization. From the perspective of emergency patient management, it is critical to identify the high death rate of patients with certain conditions in the emergency room. Therefore, it is necessary to compare and analyze the determinants of the death rate of patients admitted via the emergency room and generally hospitalized patients. In fact, previous studies investigating determinants of survival periods or length of stay (LOS) primarily used multiple or logistic regression analyses as their main research methodology. Although medical data often exhibit censored characteristics, which are crucial for analyzing survival periods, the aforementioned methods of analysis fail to accommodate these characteristics, presenting a significant limitation. Methods:Therefore, in this study, survival analyses were performed to investigate factors affecting the dying risk of general inpatients as well as patients admitted through the emergency room. For this purpose, this study collected and analyzed the sample cohort DB for a total of four years from 2016 to 2019 provided by the Korean National Health Insurance Services (NHIS). After data preprocessing, the survival probability was estimated according to sociodemographic, patient, health checkup records, and institutional features through the Kaplan–Meier survival estimation. Then, the Cox proportional hazards models were additionally utilized for further econometric validation. Results: As a result of the analysis, in terms of the ‘city’ feature among the sociodemographic characteristics, the small and medium-sized cities exert the most influence on the death rate of general inpatients, whereas the metropolitan cities exert the most influence on the death rate of inpatients admitted through the emergency room. In terms of institution characteristics, it was found that there is a difference in determinants affecting the death rate of the two groups of study, such as the number of doctors per 100 hospital beds, the number of nurses per 100 hospital beds, the number of hospital beds, the number of surgical beds, and the number of emergency beds. Conclusions: Based on the study results, it is expected that an efficient plan for distributing limited medical resources can be established based on inpatients’ LOS.
1. Introduction
Despite the higher demand for emergency medical care due to various accidents, many patients could not receive proper emergency treatment, leading to an increase in the death rate. Following the COVID-19 era, there have been disruptions in the management and operation of emergency medical services since many of the medical resources, including medical staff, emergency rooms, and hospital beds, were specifically dedicated to being utilized in the COVID-19 emergency medical centers [1].
In Korea’s emergency medical system, upon the emergence of an emergency patient, treatment is administered on-site and during transport at the pre-hospital stage, followed by inpatient care at the hospital stage [2,3]. As such, the role of emergency rooms in this emergency medical system is becoming increasingly important. Generally, under Article 31 of the Emergency Medical Service Act, emergency rooms are designed to provide emergency care and other medical tasks and are staffed 24 h by specialist physicians who provide efficient and prompt treatments. In fact, emergency rooms have confronted the issue of overcrowding due to an influx of visits by both patients who require immediate care and those with non-emergency conditions.
Overcrowding in emergency rooms is a phenomenon resulting from the lack of medical resources and treatments, which are insufficient to meet the demands of emergency care. This phenomenon leads to several negative impacts, including a prolonged waiting time in the emergency room, an increase in the death rate due to ambulance delay, an inability to prepare for major disasters, and a decline in the quality of emergency medical services due to the allocation of resources to non-emergency patients. To address such issues, there have been many studies suggesting causes and solutions of emergency room overcrowding [4,5,6,7]. Despite the foundation of such issues stemming from knowing the determinants of patients’ death in the emergency room, it is often neglected from the perspective of emergency management and treatment. In fact, the post-traumatic death rate in 2019 in Korea is preventable by 15.7%, which is not significantly different from the rates in other developed countries [8]. It has been reported that the post-traumatic death rate could be reduced to below 10% with an augmented emergency medical system [9]. Therefore, to reduce the preventable post-traumatic death rate, it is vital to identify determinants affecting the surviving period of inpatients admitted through the emergency room. However, if the study observes the time of death for inpatients admitted through the emergency room only, it remains ambiguous whether one survived during the observation period, and, thus, preventing full identification of their exact survival time. Moreover, if an inpatient died due to other factors besides one’s post-traumatic conditions, it is impossible to know one’s survival time. Therefore, the aforementioned types of records regarding patients’ death all correspond to the censored data, which is a significant characteristic to be considered prior to conducting data analyses. In fact, multivariate and logistic regression analyses do not account for the censored nature of data, and, thus, this places a limitation to the investigation of determinants affecting the surviving period of patients admitted through the emergency room. It is necessary to minimize the inappropriate use of emergency room treatments by non-emergency patients because care consists of emergency room treatment and inpatient care at the hospital stage of the emergency medical system. In particular, considering an increase in the death rate within the emergency room department in Korea, it is urgent to carefully identify the determinants of survival time for ER-admitted patients. For this purpose, this study aims to identify factors influencing the survival time of general inpatients and those admitted through the emergency room and to compare the results between the two groups of patients. Since data regarding an individual’s death are the censored data, it is important to consider the survival time prior to analyzing its determinants. Therefore, we decided to utilize survival analysis as the main methodological tool for our research. In fact, survival analysis enables us to statistically analyze not only the duration until the death of inpatients admitted in the emergency room but also the determinants of the survival time [10,11]. This study aims to compare the survival probabilities over time for ER-admitted patients and general inpatients using the non-parametric statistical method of the Kaplan–Meier survival estimation. Then, using the semi-parametric statistical method of the Cox proportional hazards model, this study seeks to analyze and compare features influencing death rates between inpatients admitted in the emergency room and general inpatients. The Cox proportional hazards model is expressed by the hazard function. That is, the hazard function can be interpreted as the risk of death at time. Therefore, the measure of effect in the Cox model is the hazard rate, i.e., the risk of death given that the patient survived until a specific time. We use the cohort database of the National Health Insurance Corporation of Korea. The data include information on the date of death of emergency patients and general patients after hospitalization, but there is no information on whether the patient was discharged after full recovery or if transferred to another hospital. Therefore, we assume death as a terminal event and perform survival analysis.
In terms of features utilized in this study, we referred to the extant literature and selected ones from the cohort DB provided by the Korean NHIS. The data analysis was conducted in a virtual environment of NHIS using the R statistical program (version 3.7.6). Since this study identifies the main determinants affecting the dying risk of inpatients, we expect medical institutions to allocate medical resources in an effective manner. We also expect guidelines to be established to address emergency room overcrowding, based on information about patients prioritized for emergency care.
2. Theoretical Background
2.1. Emergency Medical Services (EMS)
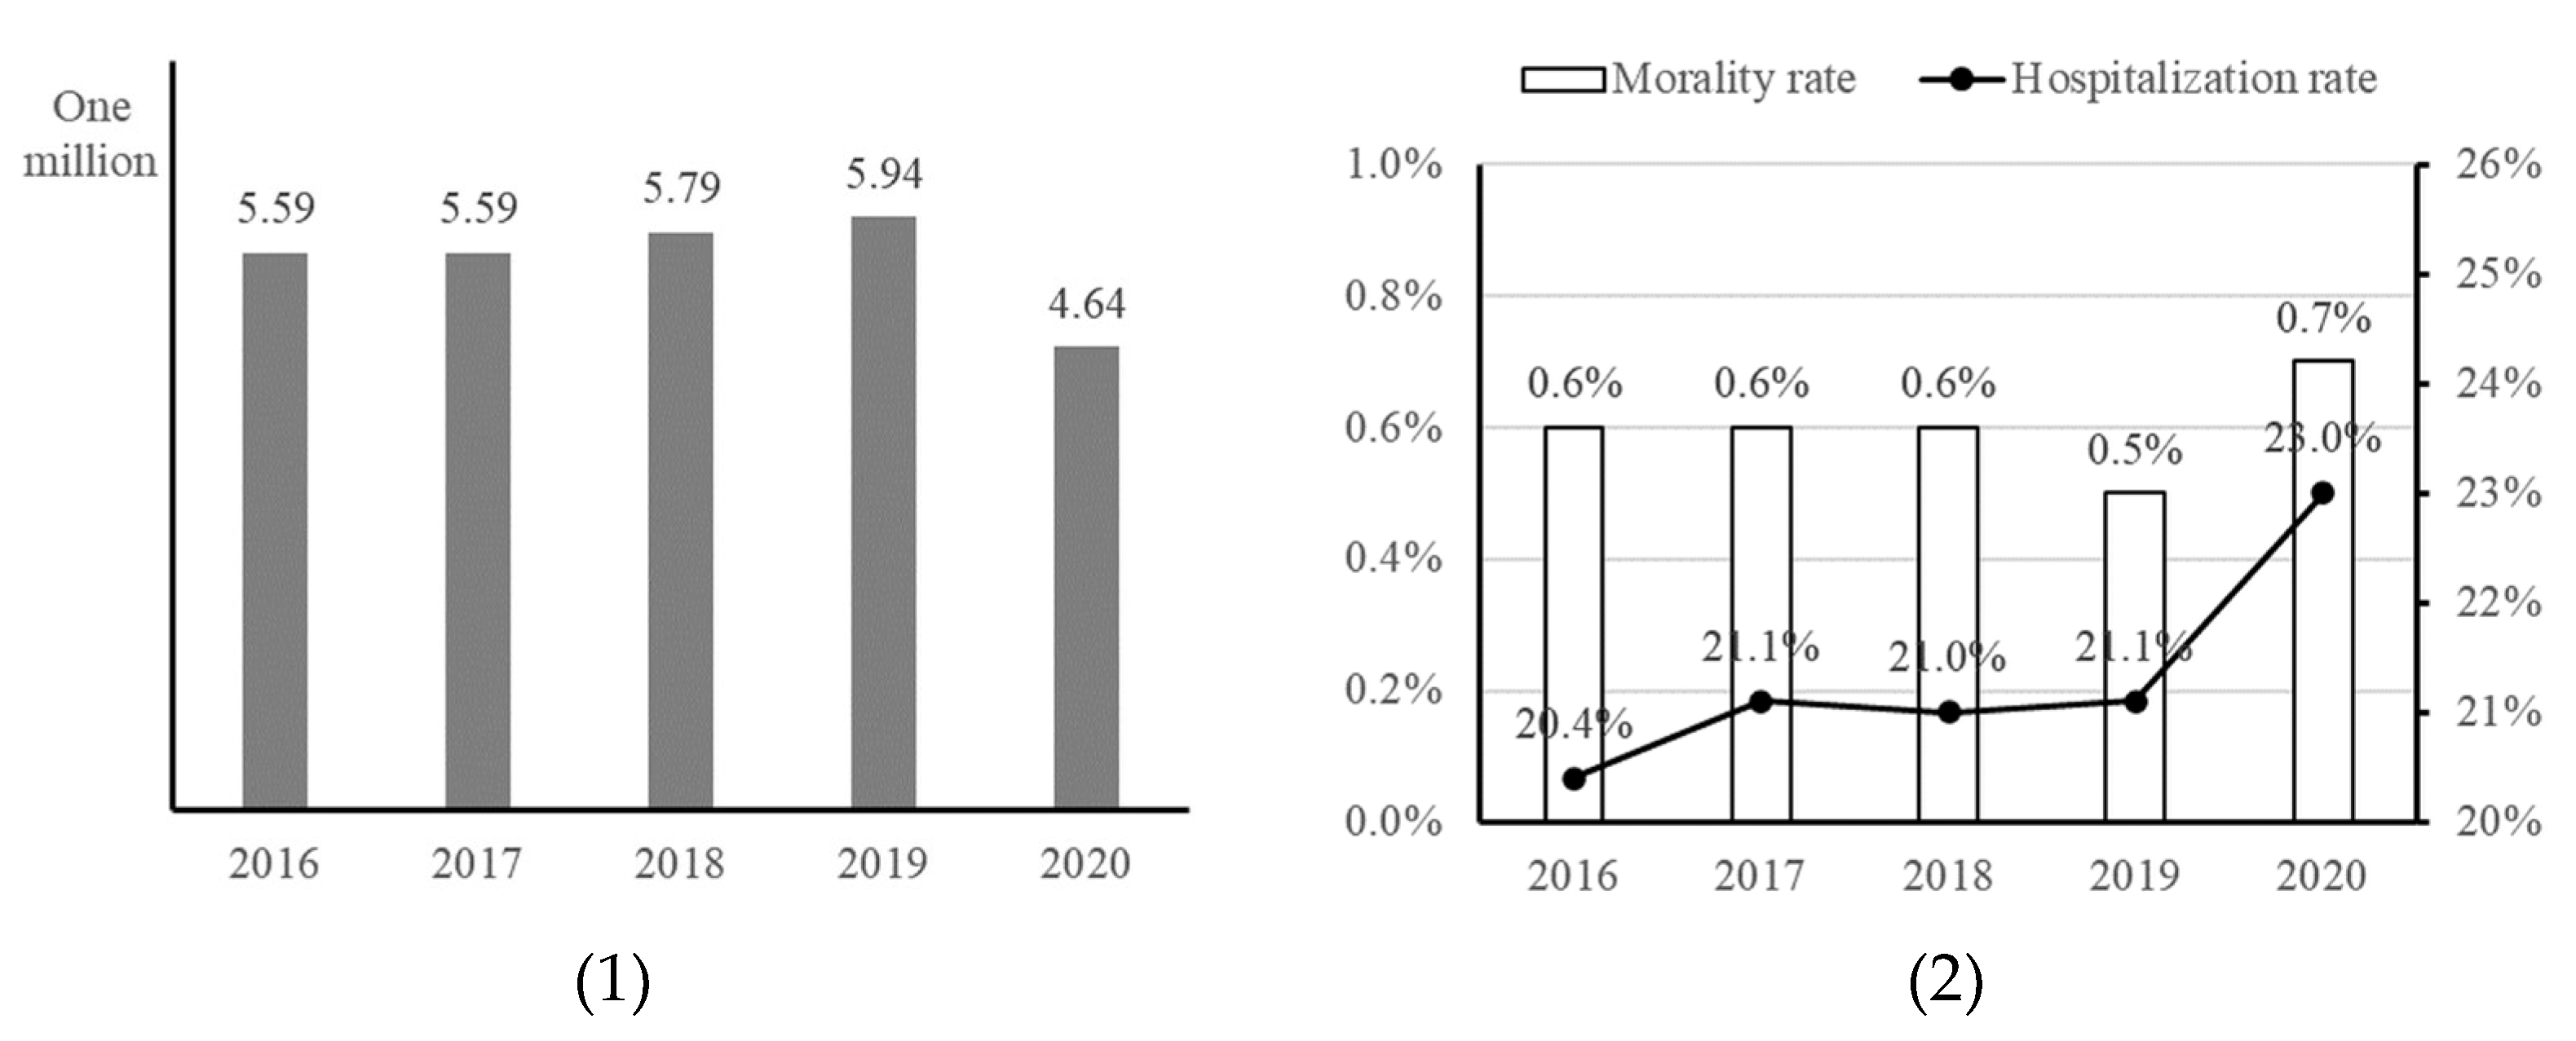
The emergency medical services (EMS) encompass actions taken for patients from the onset of an emergency until they recover from life-threatening conditions or are alleviated from physical and psychological harm [12]. As a part of public goods, these services include consultation, rescue, transport, emergency treatment, and medical care [13]. As shown in Figure 1(1), the number of patients using emergency rooms increased from 5.59 million in 2016 and 2017 and 5.79 million in 2018 to 5.94 million in 2019, which then decreased to 4.64 million in 2020. The admission and death rates in the emergency room are shown in Figure 1(2). The death rates gradually increased from 0.6% in 2016, 0.6% in 2017, 0.6% in 2018, 0.5% in 2019, and 0.7% in 2020. The admission rates also increased from 20.4% in 2016, 21.1% in 2017, 21.0% in 2018, 21.1% in 2019, and 23.0% in 2020.
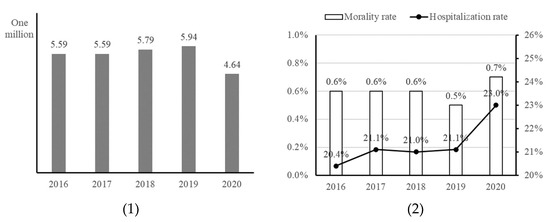
Figure 1.
Current state of EMS in Korea (Source: KOSIS (Korean Statistical Informational Service, Statistics of EMS, 21 November 2022)). The two represent (1) use of emergency room, and (2) admission and death rate in emergency (from left to right).
Despite the increasing trends in death and admission rates of emergency patients, it is difficult to find existing studies examining the relationship of death and admission rates of emergency patients with their survival time. In fact, most existing research related to emergency room is often focused on ER overcrowding; however, it is necessary to analyze the survival time for ER-admitted patients prior to scrutinizing the death and admission rates of these individuals.
2.2. Survival Analysis
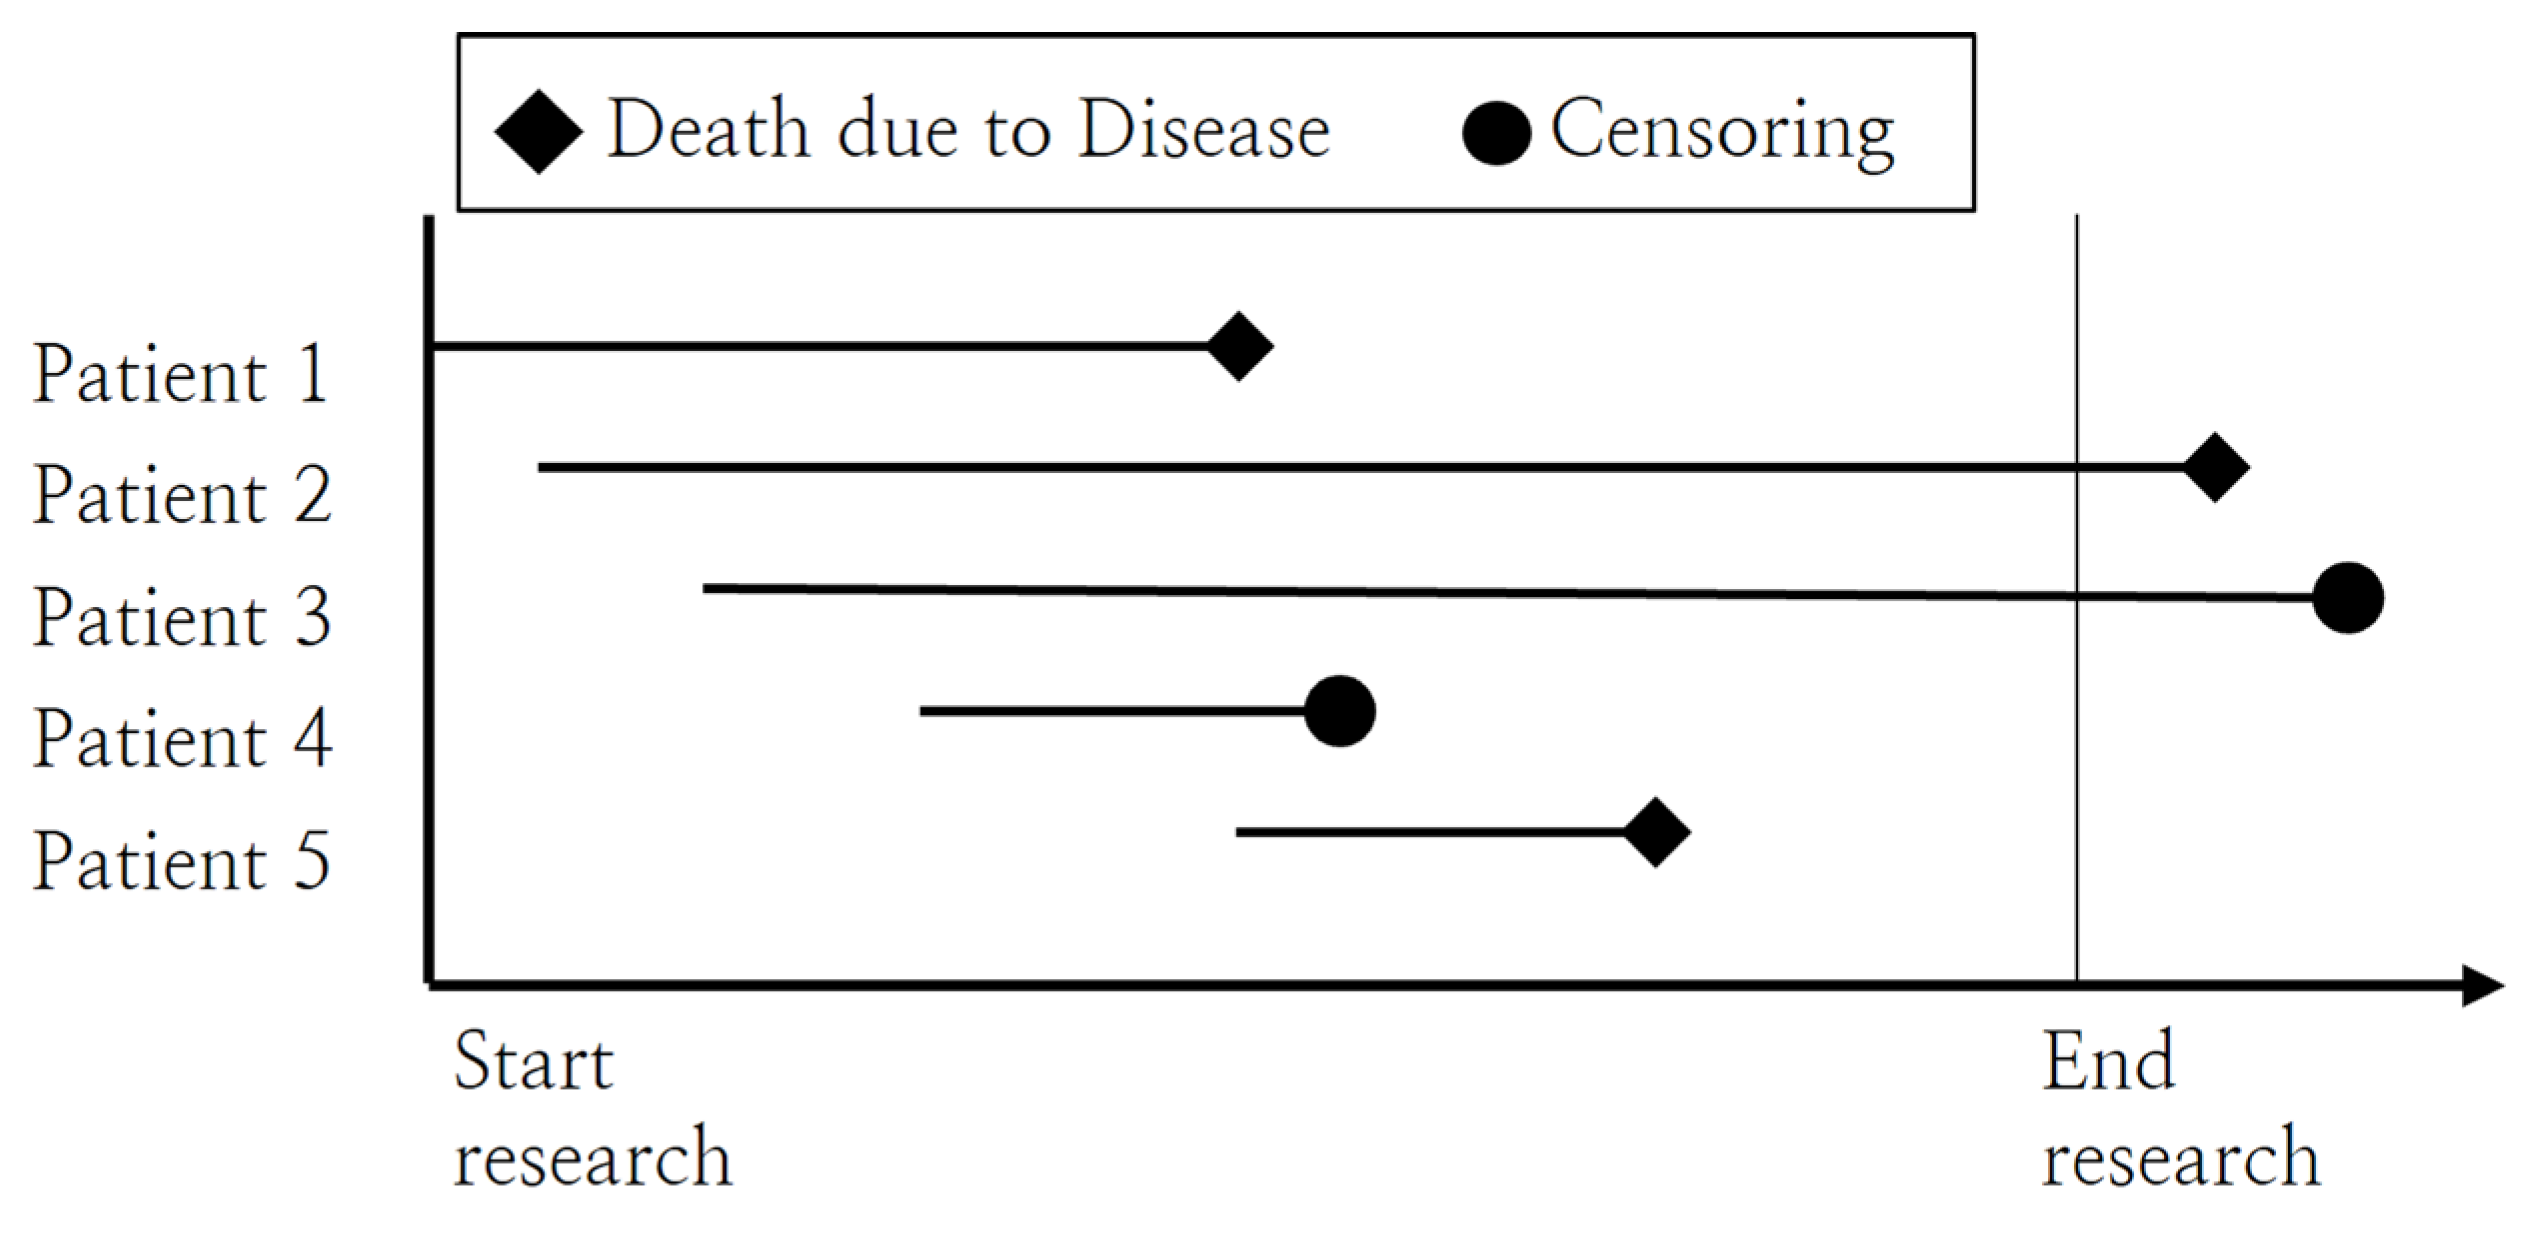
Survival analysis is a method widely used in the fields of biology and medicine, which utilizes censored data containing information, such as patients’ survival and death, and assesses differences in the elapsed time to an event of interest [11,14,15,16]. Here, censored data refers to data with unknown occurrence of an event from the beginning of the study to the end. For instance, when observing the time of death among patients as in Figure 2, the characteristics for each data set are as follows. The data for patients 1 and 5 fall under complete data, while patient 2, 3, and 4 correspond to censored data. In particular, the data for patient 4 is considered censored because the cause of death was unrelated to the aggravated disease.
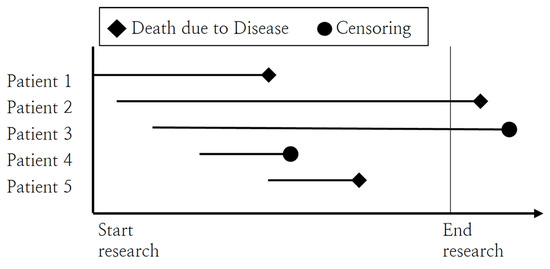
Figure 2.
Example of censored data.
Since survival analysis is a statistical approach that estimates the survival time between two events of interest, it is explicitly different from other approaches such as regression and logistic regression, as demonstrated in Table 1. While linear regression considers time as a dependent variable, it is limited by not accounting for the presence of censored data. On the other hand, logistic regression can only include an event, such as whether one has died or has been hospitalized, as a dependent variable, but it cannot consider time in its analysis.

Table 1.
Comparison of research methodologies for analyzing survival period.
In fact, survival analysis can be conducted using three types of methods: non-parametric, semi-parametric, and parametric methods. First, a non-parametric method does not require an assumption that the data follow a certain probability distribution. Second, a semi-parametric method still does not require an assumption regarding data distribution yet estimates regression coefficients. Lastly, a parametric method carries an assumption that the data follows a distribution, such as the Weibull distribution, with respect to survival time, t.
Among non-parametric methods, there are the Kaplan–Meier estimation analysis and the log-rank test. The Kaplan–Meier estimation assumes that events are to occur independently of one another and calculates survival probabilities from one interval to the next under the assumption that censoring is independent of the survival time [17]. These probabilities can be illustrated in a survival plot [17]. The log-rank test compares the time-to-event distributions across two or more independent groups, utilizing a chi-squared test of the time occurrence between the observed and expected counts. This test is particularly used to validate the null hypothesis that no significant difference exists in the survival curves between the groups being compared.
Here, Table 2 demonstrates the existing literature that utilized survival analysis for research purposes across various fields of study. In fact, there is one semi-parametric method, which is the Cox proportional hazards model. This model is a multivariate regression method that tests the significance of various predictors relevant to time and processes the censored data, assuming that there is a log-linear relationship between the survival function and the variables [18]. Having acknowledged that the data used in this study do not satisfy a certain distribution over time, such as the Weibull distribution, we decided to utilize the Kaplan–Meier estimation and the Cox proportional hazards model. In other words, this study aims to estimate and compare the survival time of general inpatients and patients admitted through the emergency room using the Korean NHIS cohort DB based on the Kaplan–Meier survival analyses.
Table 2.
Extant literature using survival analysis.
3. Research Methodology
3.1. Research Framework
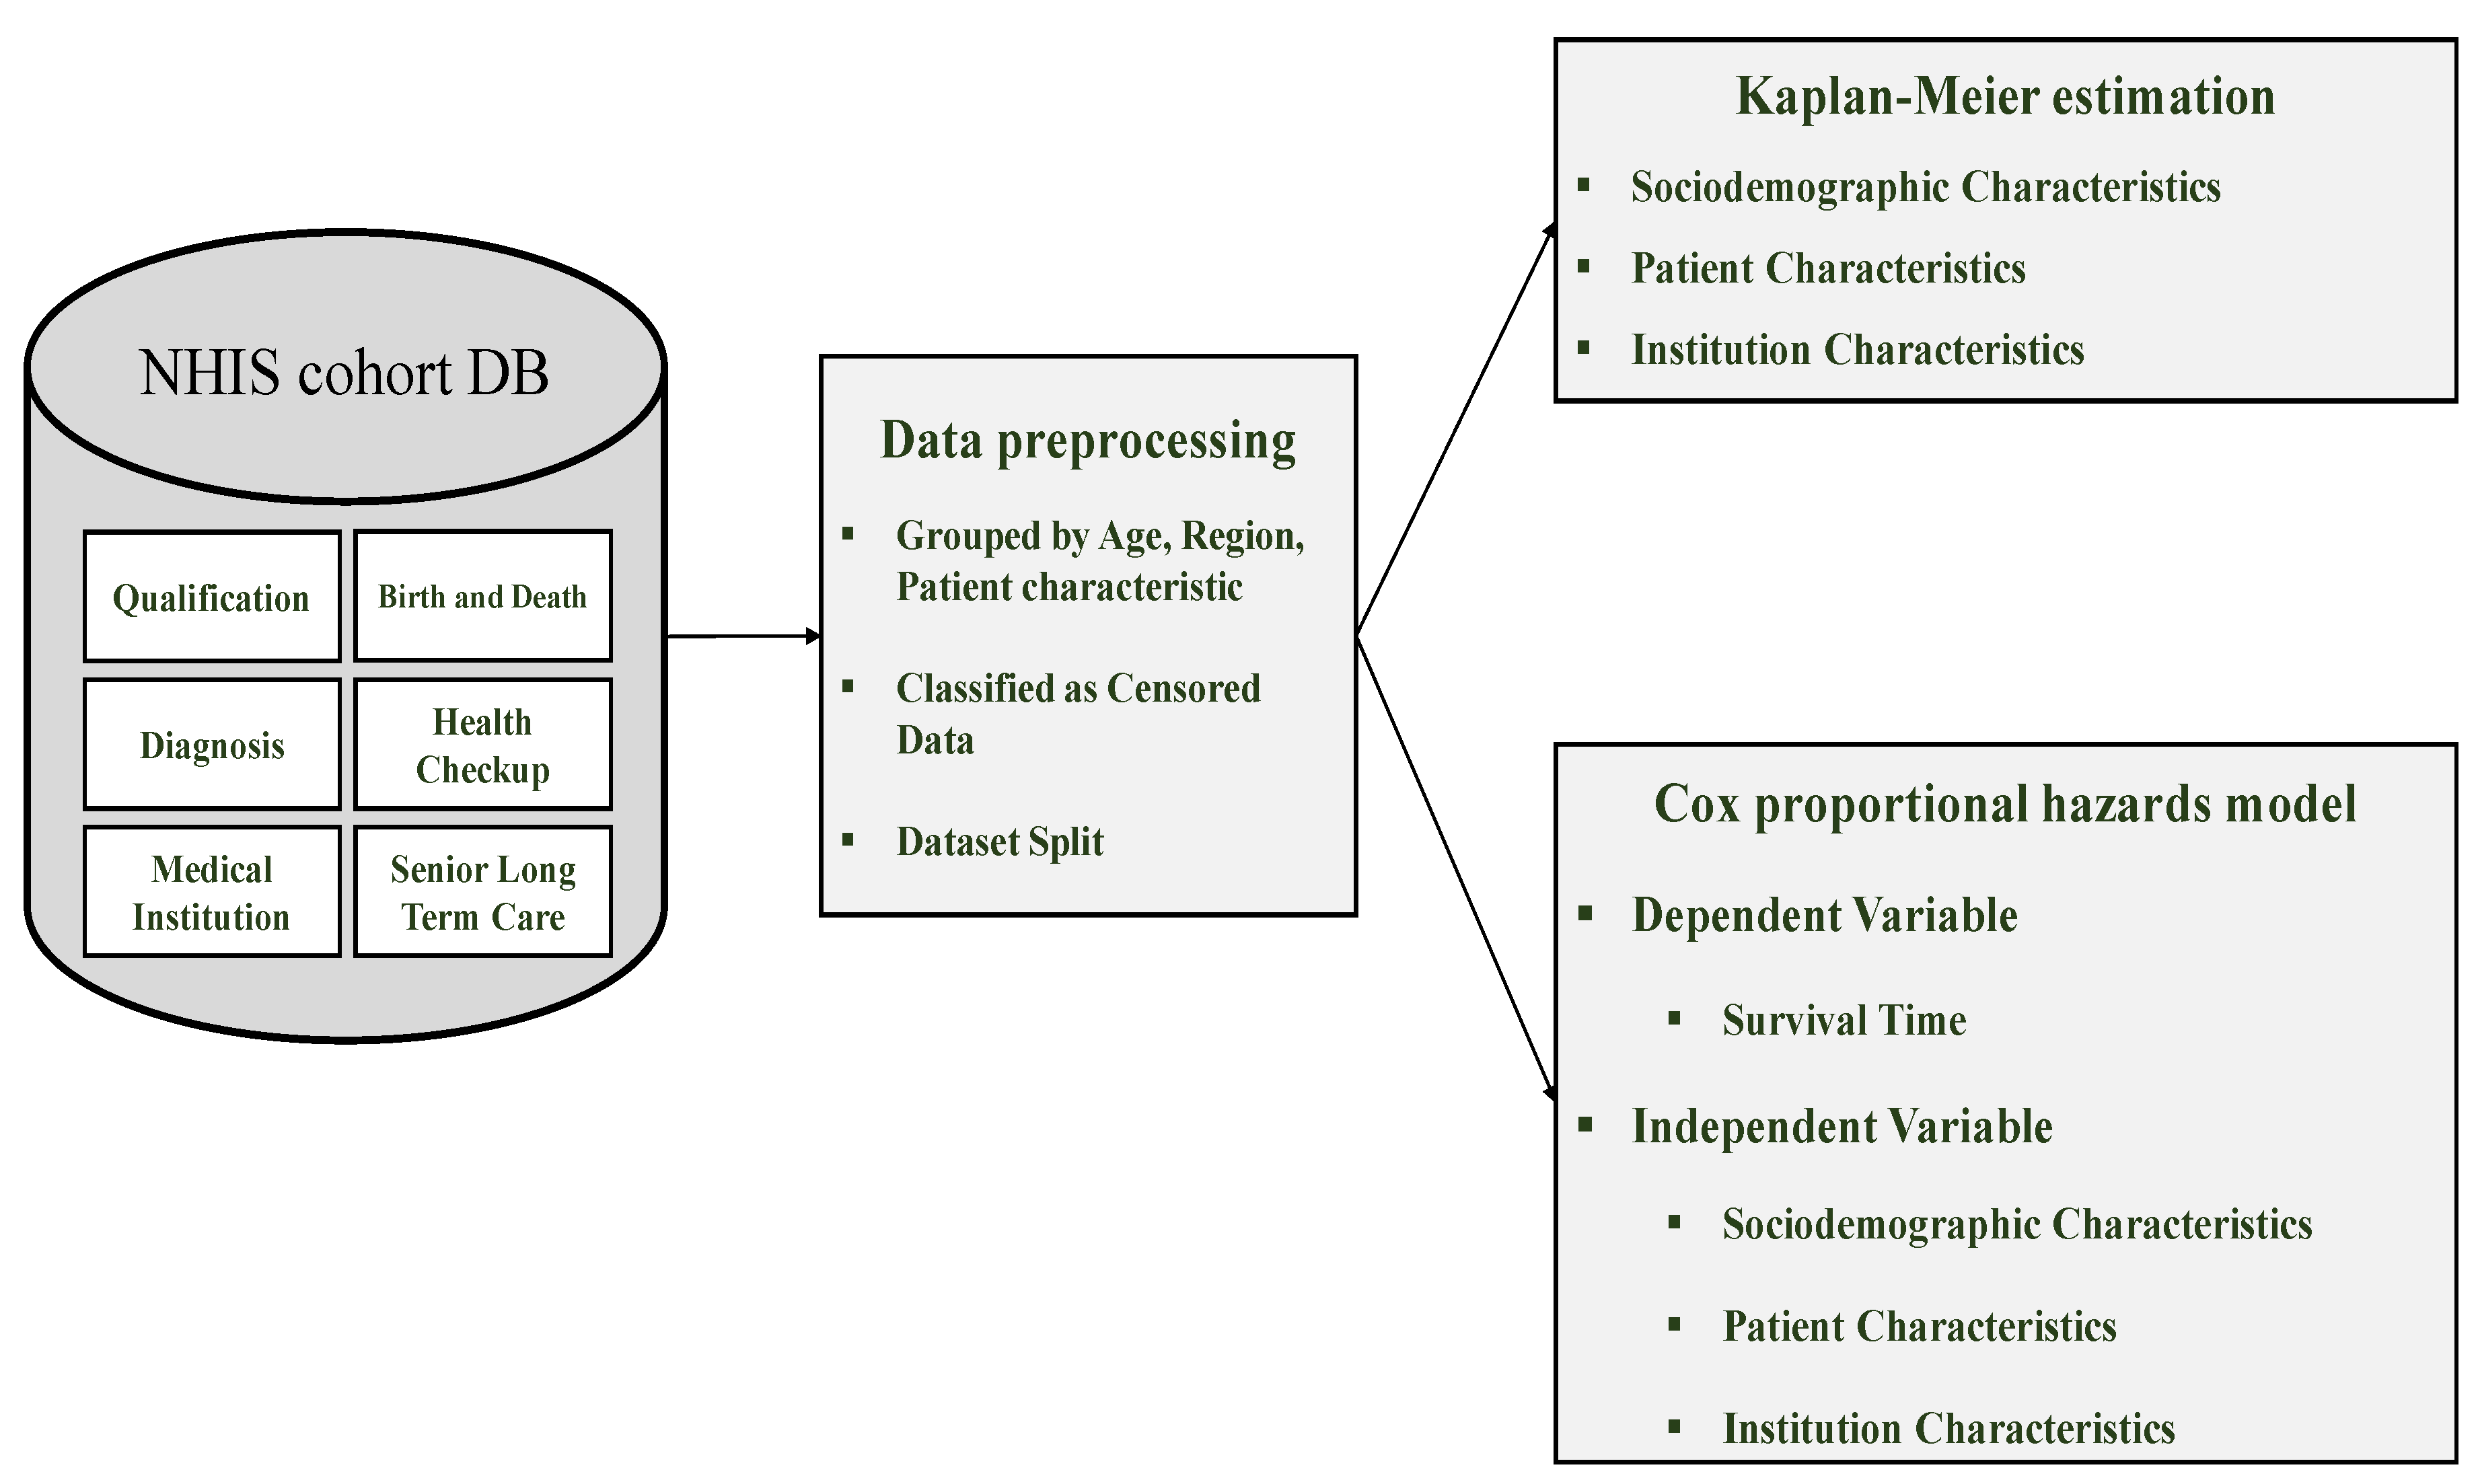
The purpose of this study is to identify factors affecting the survival time of general inpatients and inpatients admitted through the emergency room, separately, and to compare the results. General inpatients, in this study, refer to those who were hospitalized without the emergency room transport. As demonstrated in Figure 3, we conducted our research in three phases: data collection, data preprocessing, and survival analysis.

Figure 3.
Research framework for investigating determinants of survival time.
During the data collection phase, we collected the Korean National Health Insurance Service (NHIS) cohort DB. For data preprocessing, we grouped the features, classified the censored data, and divided the subjects into general inpatients and those admitted through the emergency room. Lastly, for survival analyses, we investigated the main determinants of survival time for each group of subjects using both the Kaplan–Meier estimation and the Cox proportional hazards model.
3.2. Data Collection
To identify determinants affecting the dying risk of general inpatients and that of inpatients admitted through the emergency room, this study utilized the four-year health checkup cohort DB from the year 2016 to 2019 provided by the Korean National Health Insurance Services. This cohort DB is a sample study DB established in January 2013 based on the health examination records DB, encompassing approximately one million (2% of the total population in Korea) records of patients without violating the privacy terms. This cohort DB is the latest data provided by the Korea Health Insurance Service.
Such DB is largely composed of six different tables as follows: qualification, birth and death, diagnosis, health checkup, medical institution, and senior long-term care (see Table 3).
Table 3.
Description of health checkup cohort DB.
Referring to prior studies on investigating determinants of survival time, we selected four tables out of the displayed tables in the cohort DB for the purpose of our study: qualification, birth and death, diagnosis, and medical institution. As presented in Table 4, a total of 18 variables were used in this study, where 12 of them were classified into either of the sociodemographic, patient, and institution tables for analyzing the determinants of survival time.
Table 4.
Features in health checkup cohort DB.
First, from the ‘qualification’ and ‘birth and death’ tables, we utilized the subjects’ sociodemographic and personal information. Among the sociodemographic features, information such as one’s gender, age, and region was included. Among the patient features, information such as one’s type of health insurance, income quantile, and the severity of disability was included. We used the information regarding one’s death from the ‘birth and death’ table as a dependent variable of our analyses. Second, from the ‘Diagnosis’ table, we utilized information pertaining to whether one has been hospitalized and also the admission route of hospitalization in order to compare the survival time between general inpatients and those admitted through the emergency room. We also used information regarding the diagnostic results as the censored data. Third, we used various information on institutions from the ‘Medical Institution’ table. This table includes features, including the types of institutions that one has been admitted, the number of doctors and nurses, and the number of hospital beds.
3.3. Data Preprocessing
This study conducted survival analyses on subjects with hospitalized records between 2016 and 2019 from the sample cohort DB provided by the Korean NHIS. Data preprocessing prior to conducting survival analysis involved eliminating the missing values, merging between tables, and extracting values for each feature followed by identifying the censored data. The details of data preprocessing are presented in Table 5.
Table 5.
Preprocessed results by feature (Survival Time Determinant Analysis).
First, the process of eliminating missing values was completed using the features corresponding to the income quantile, the severity of disability, diagnostic results, and the date of death. In fact, missing values found within the income quantile and diagnostic results category were eliminated prior to analysis, while ones for the severity of disability were replaced with ‘no inclusion (normal)’. Missing values within the date of death feature were instead indicated as ‘survived’, implying that the patients had not passed away. Second, we only extracted the records for top general hospitals and general hospitals using the codes indicating a type of institution. Next, we utilized common features, such as the standard year code and the code for interlinking the tables to merge the four tables of our research interest. The remaining number of records after merging is 25,722,085. Third, we completed feature preprocessing by, for instance, grouping the variables. In terms of age, since the year of birth was provided by the NHIS data, it was converted to age as of the base year, which was then grouped into ten-year units. For region, we referred to the extant literature [25] to classify the variables into Seoul, metropolitan cities (Busan, Daegu, Daejeon, Incheon, Gwangju, Ulsan), and the others as the small and medium-sized cities. Among the patient characteristics, for insurance status, we regrouped the existing six categories of the feature into three categories: medical insurees, regional insurance, and workplace insurance. For income quantiles, we reclassified the existing ten different quantiles of income into 0 quantile, 1–3 quantiles, 4–7 quantiles, and 8–10 quantiles. For institutional characteristics, considering the size of medical institutions used in this study, we set the number of doctors and nurses by 100 hospital beds, which were then grouped into four separate groups. The same procedure was applied for the number of hospital, surgical, and emergency beds. Fourth, censored data, which are not conventionally considered in other analytical methods, can be utilized in survival analysis. Therefore, this study accounted for subjects who had not died by the last date of treatment—that is, subjects whose current survival status is unknown—to be classified as censored data.
4. Results
This study conducted survival analyses on subjects with hospitalized records between 2016 and 2019 from the sample cohort DB provided by the Korean NHIS. Data preprocessing prior to conducting survival analysis involved eliminating the missing values, the merging between tables, and extracting values for each feature followed by identifying the censored data.
4.1. Determinants of Survival Time among General Inpatients
For the purpose of finding determinants of survival time among general inpatients and those admitted through the emergency room, we first conducted survival analysis on general inpatients. A total of 3,228,933 records was used, and 12 variables were investigated to check which of them affect the risk of death.
4.1.1. Characteristics of General Inpatients
Table 6 presents the characteristics of general inpatients. The gender distribution of the study subjects is 50.13% male and 49.87% female. The age distribution is as follows: 11.66% under 29, 5.62% between 30 and 39, 9.42% between 40 and 49, 17% between 50 and 59, 19.18% between 60 and 69, 21.21% between 70 and 79, 13.86% between 80 and 89, and 2.05% above 90. For region, the result shows 21% in Seoul, 31% in metropolitan cities, and 47% in other small and medium-sized cities. For insurance status, 10% are medical insurees, 29% are those with regional insurance, and 61% are those with workplace insurance. For income quantiles, 10%, 20%, 31%, and 38% are 0, 1–3, 4–7, and 8–10 quantiles, respectively. For the severity of disability, individuals with normal, mild, and severe symptoms are 79%, 11%, and 10%, respectively. There are 70% general hospitals and 30% top general hospitals. For other features, such as the number of doctors per 100 hospital beds, they were previously divided into four groups, and, thus, there is 25% for each category.
Table 6.
Characteristics of general inpatients.
4.1.2. Kaplan–Meier Estimation (General Inpatients)
This study utilizes the Kaplan–Meier estimation to analyze how the sociodemographic, patient, health checkup, and institution features affect LOS for inpatients over time.
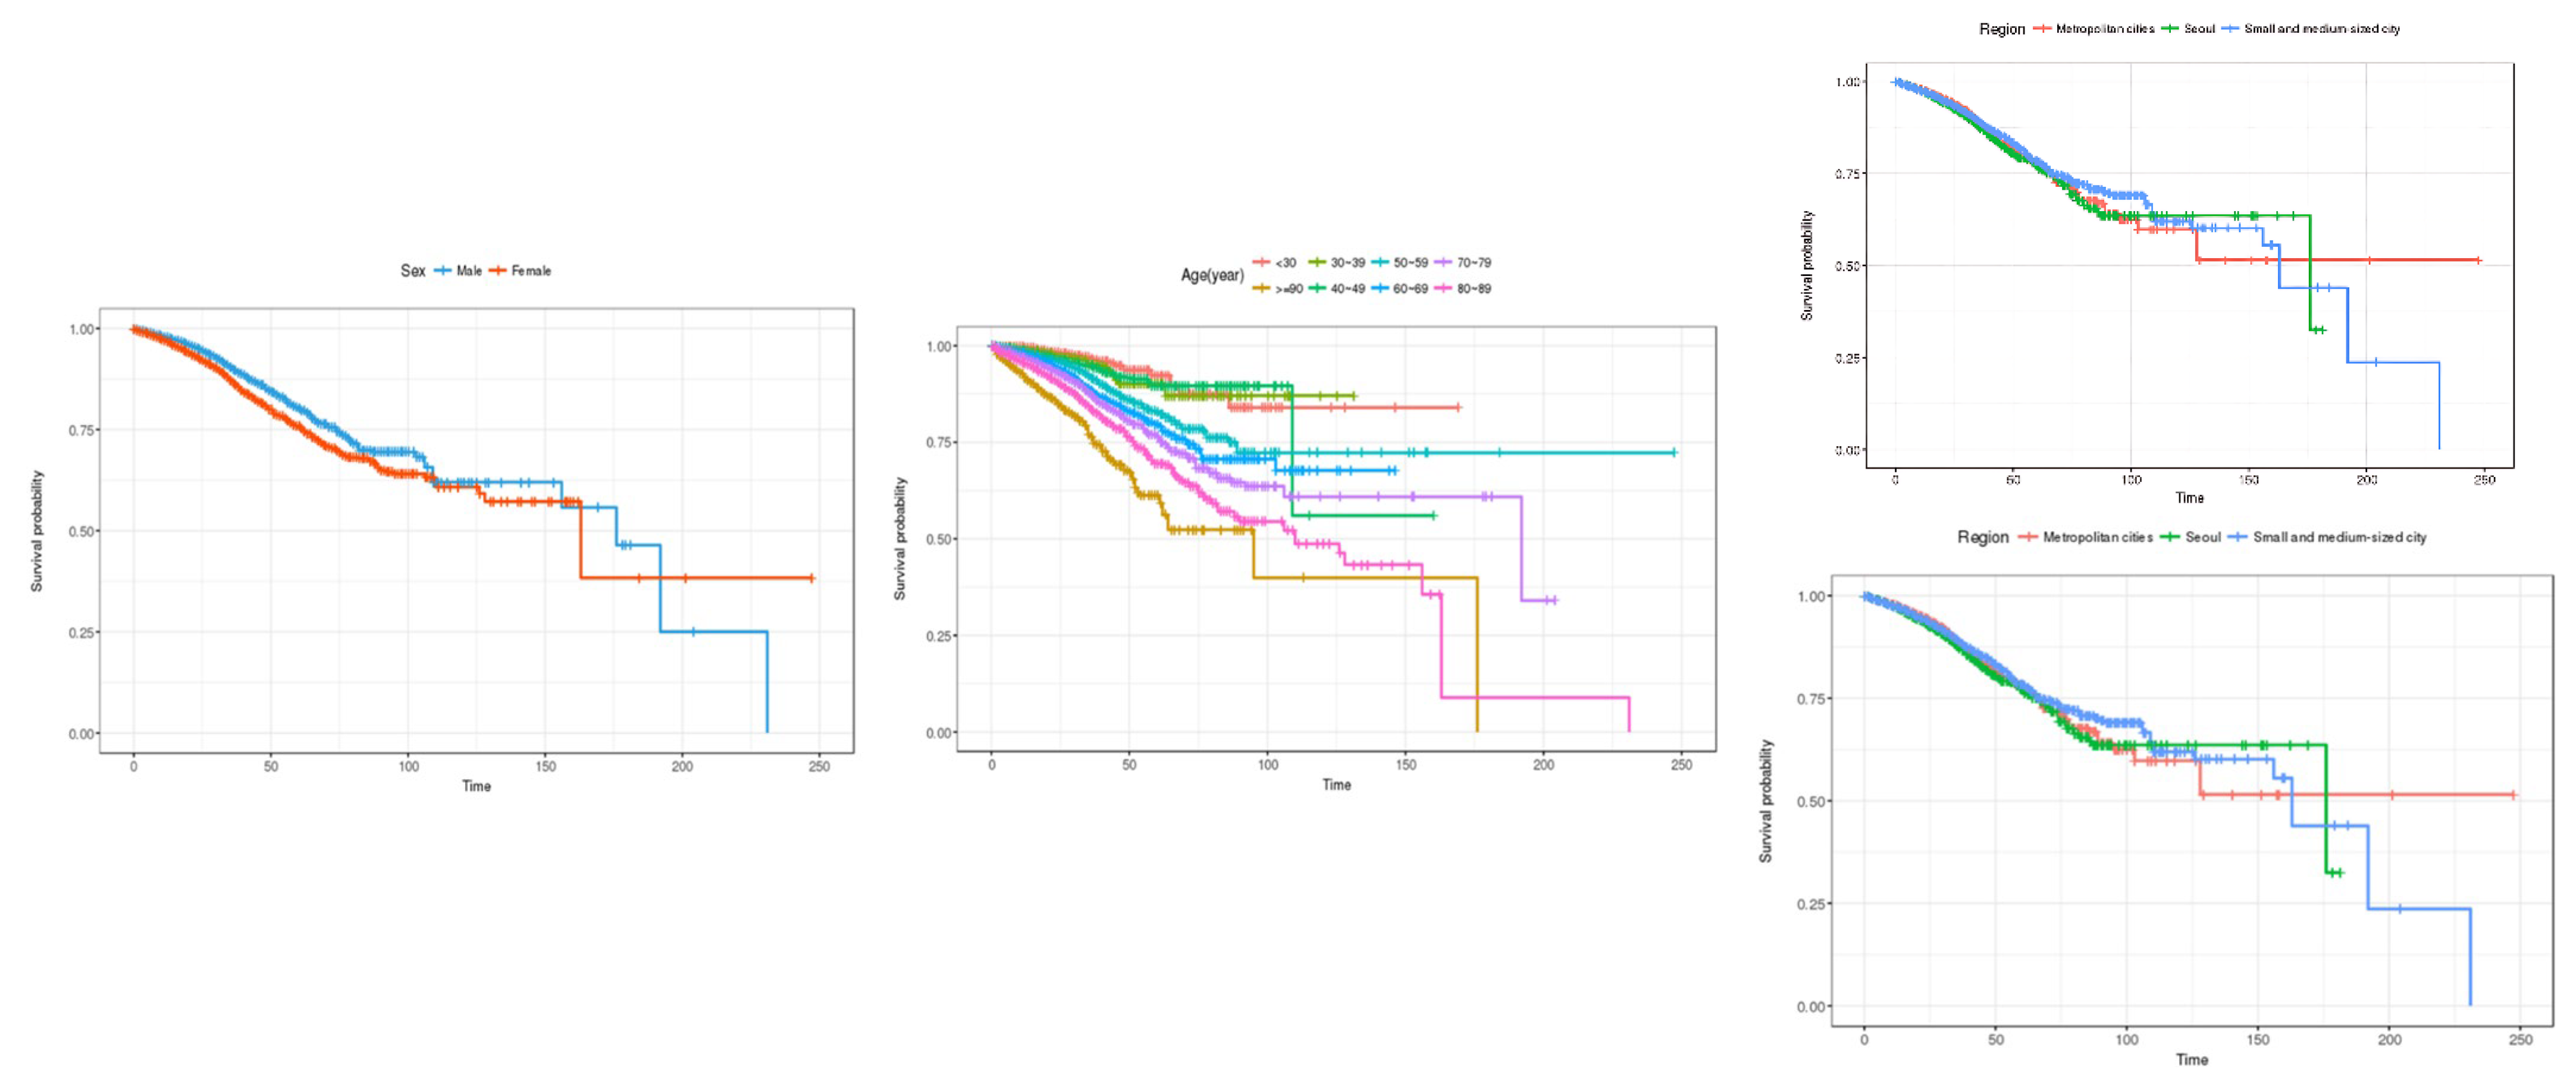
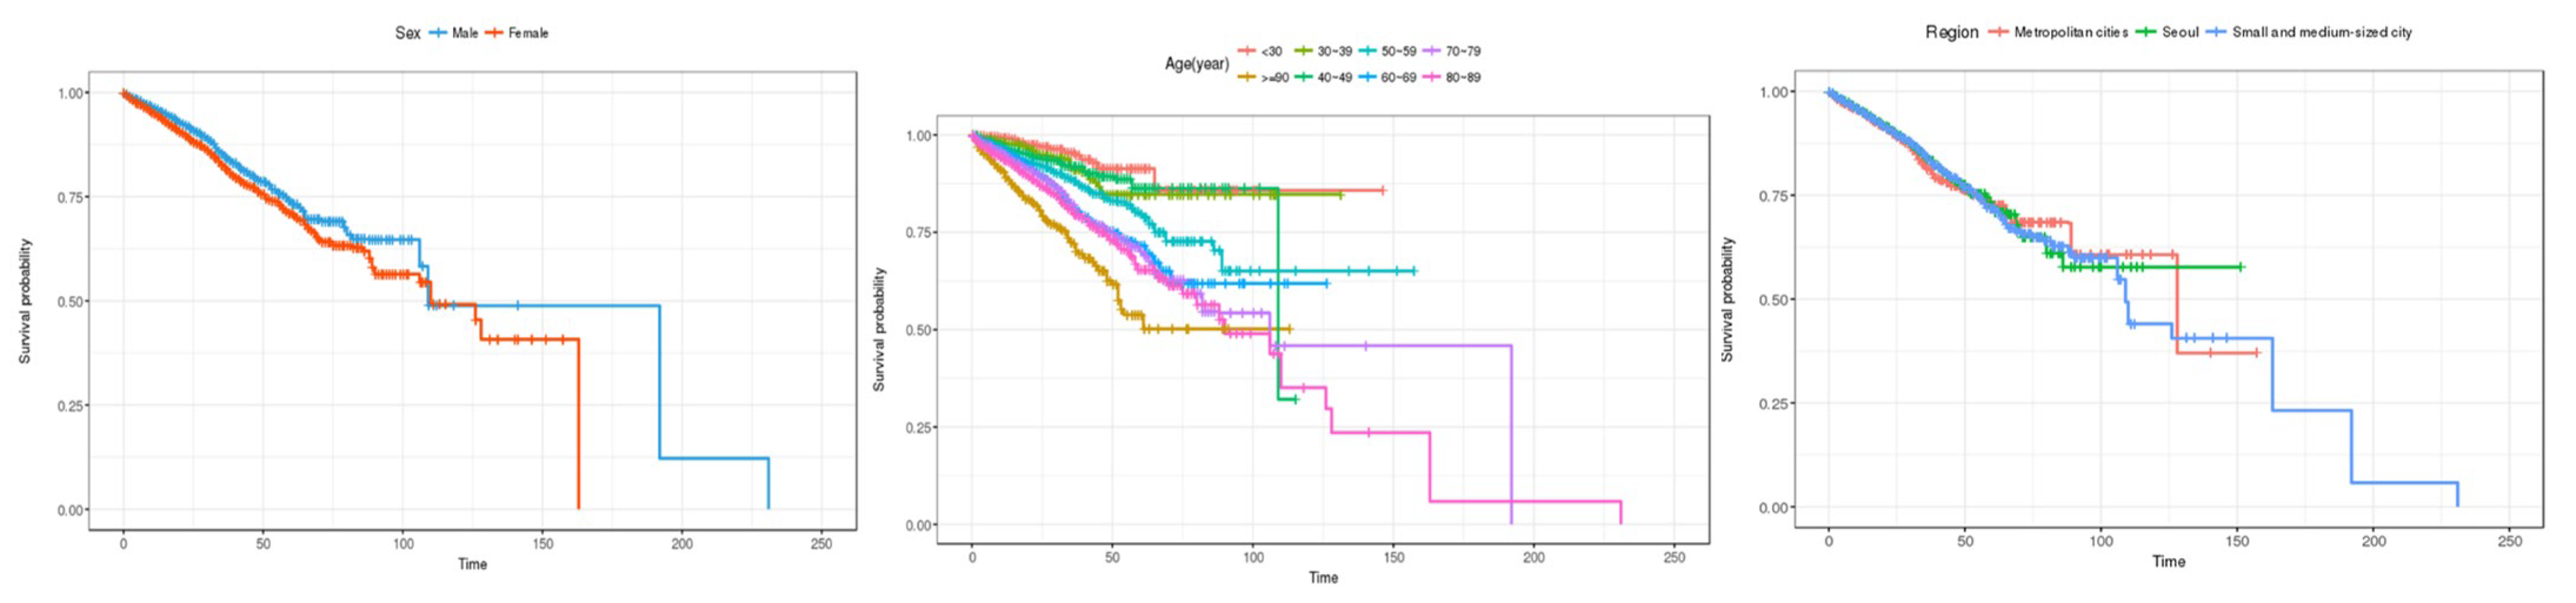
First, the estimates for the features responsible for sociodemographic information, including gender, age, and city/province are shown in Figure 4. In the case of gender, the survival rate for men appears to be better than for women up to about 180 days, but after that, the survival rate for women appears to be higher. In terms of age, the survival rate gradually decreases from those in their 30s to those in their 90s or older. Lastly, in the case of regional areas, the survival rate in small and medium-sized cities appears to be high up to about 100 days, but the survival rate decreases rapidly after that. On the other hand, the survival rate in Seoul was the highest from about 100 to 180 days, and the survival rate in metropolitan cities was high after about 180 days.
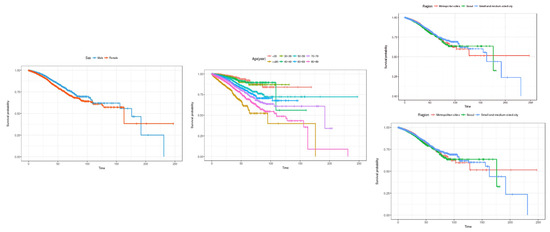
Figure 4.
Kaplan–Meier survival curves by socio-demographic characteristics (general inpatients). The three charts represent (1) sex, (2) age, and (3) region (from left to right).
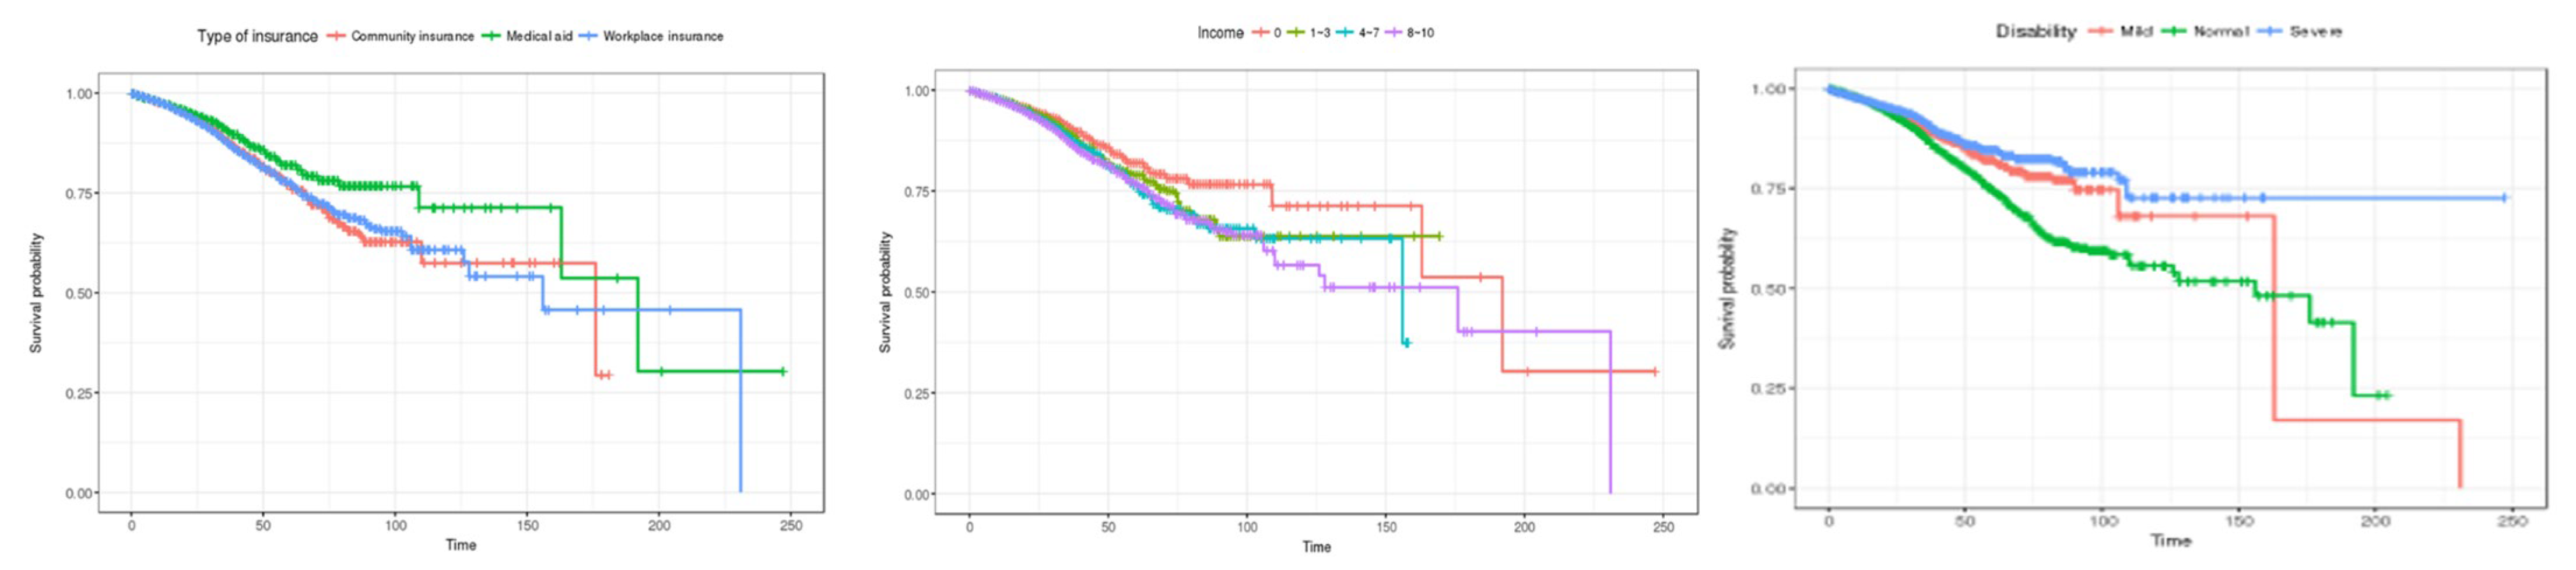
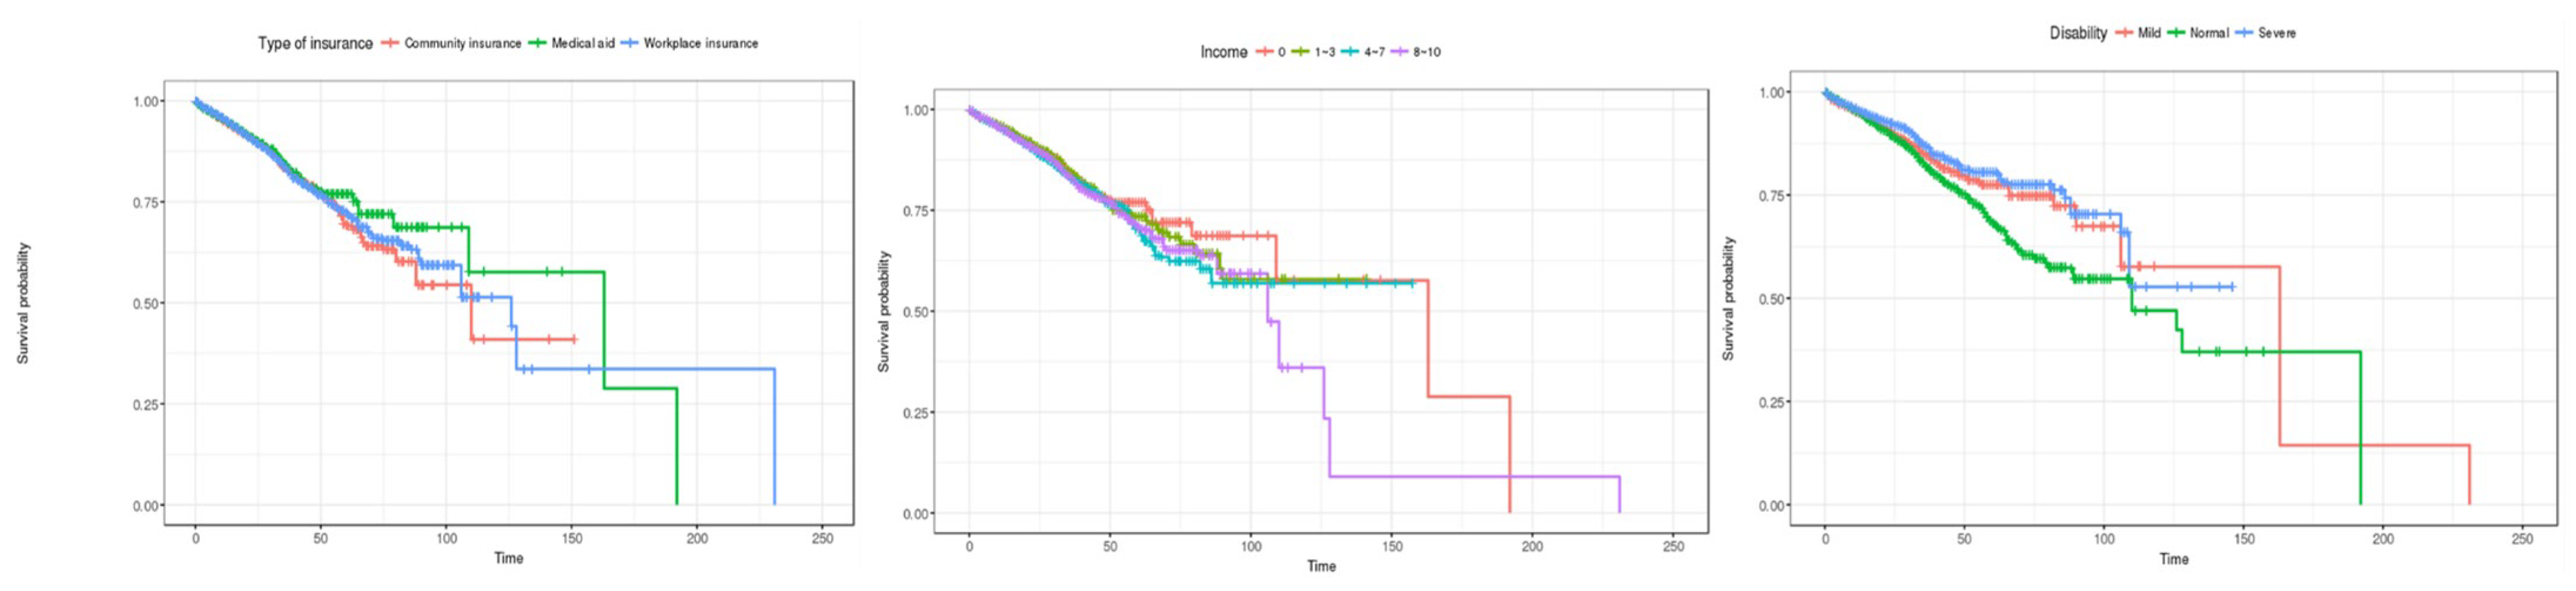
Second, patient characteristics, such as health insurance subscriber classification, income bracket, and disability severity results, are shown in Figure 5. In the case of health insurance subscriber types, the survival rate of medical benefit recipients was the highest, and the survival rate tended to decrease in that order: local subscribers, and employer subscribers. In terms of income quintile, the 0th quintile showed the highest survival rate, and the survival rate decreased in that order: 8th to 10th quintile, 4th to 7th quintile, and 1st to 3rd quintile. In terms of disability severity, the survival rate was found to be high for severely ill patients, followed by the highest survival rate for mild patients. However, after about 160 days, the survival rate of patients with dysentery is rapidly decreasing, and the survival rate of normal patients (not applicable) appears to be higher.
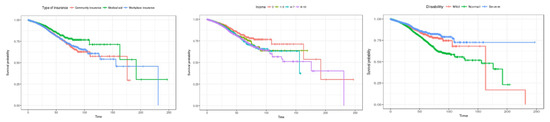
Figure 5.
Kaplan–Meier survival curves by patient characteristic (general inpatients). The three charts represent (1) type of insurance, (2) income, and (3) disability (from left to right).
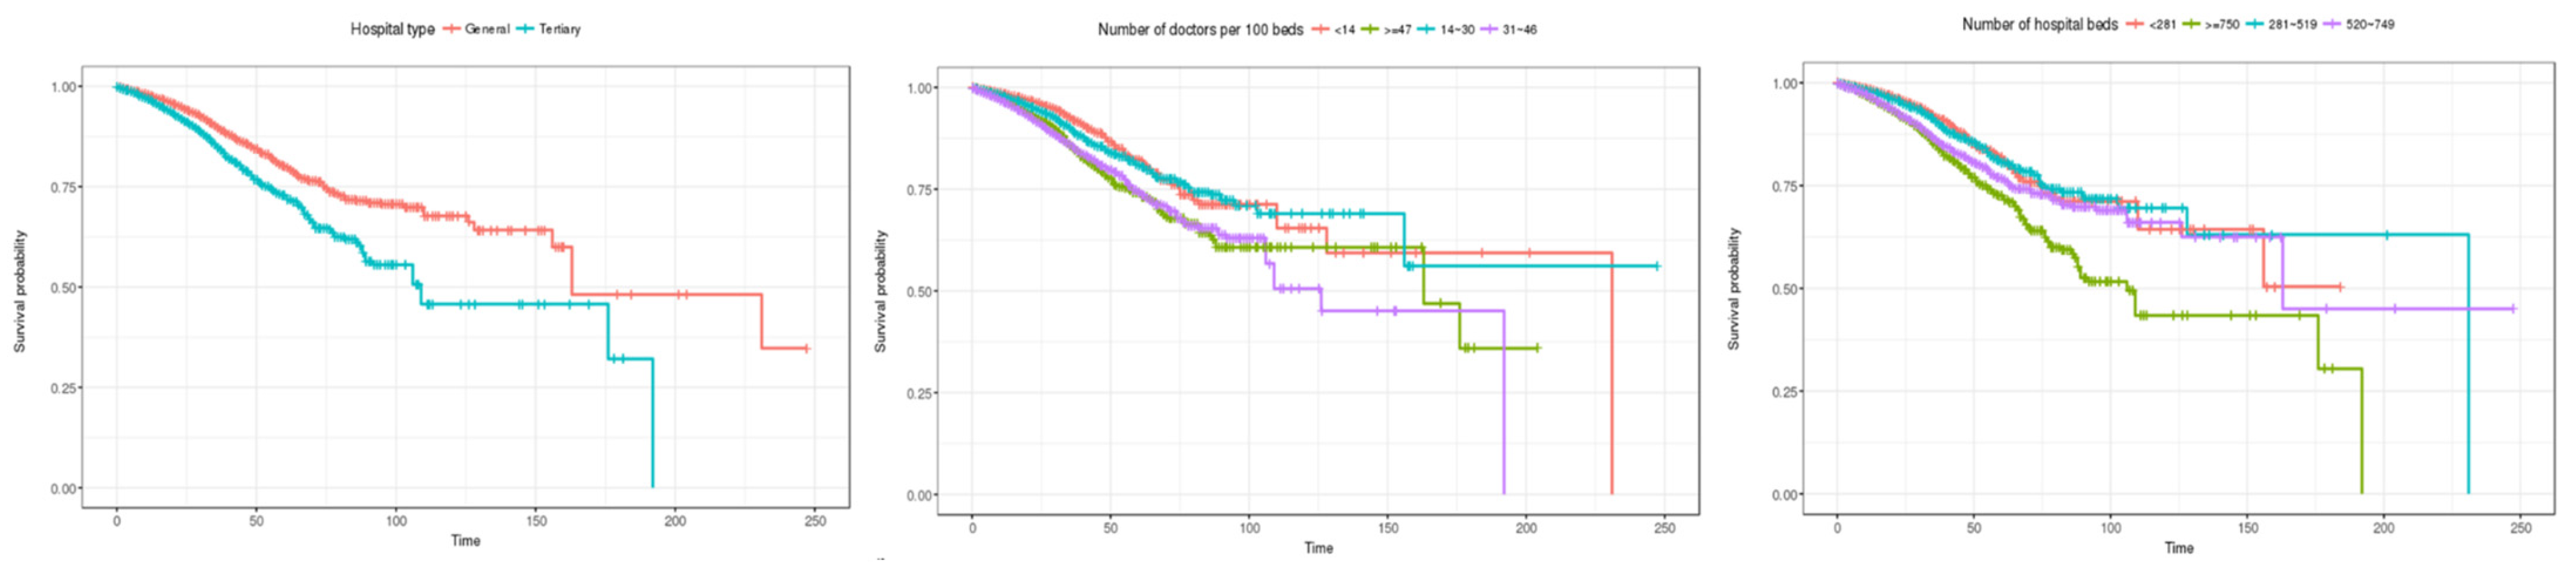
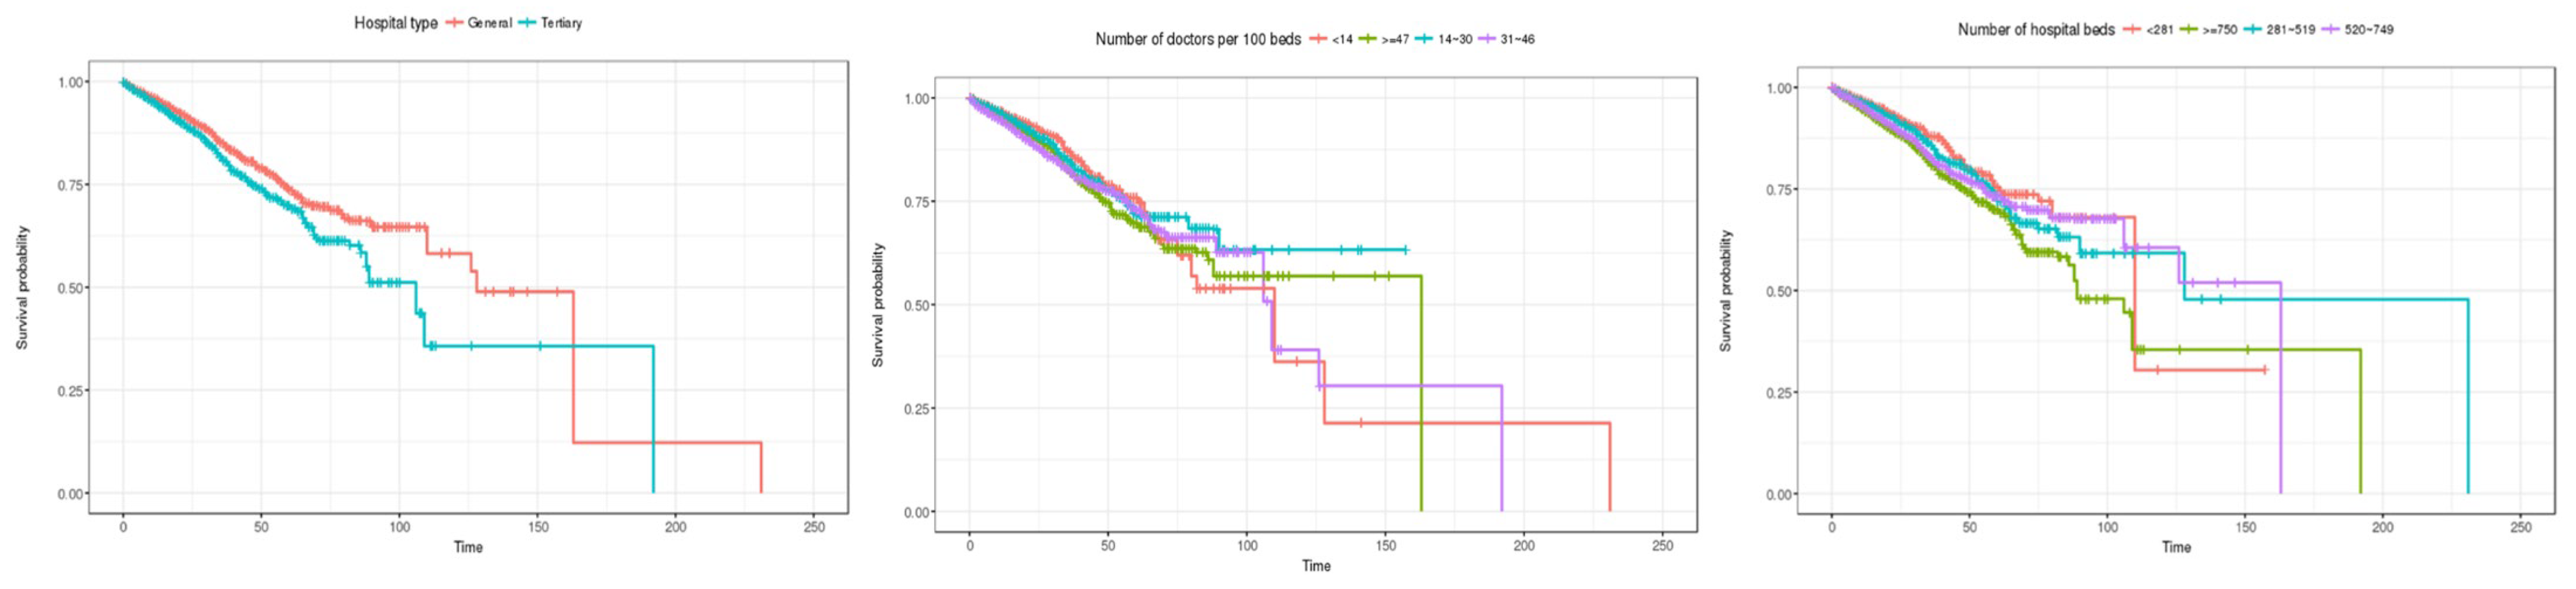
Third, the Kaplan–Meier survival curve by characteristics of medical institutions is shown in Figure 6. Looking at the survival rate by hospital type, it is estimated that the overall survival rate of general hospitals is higher than that of tertiary general hospitals. In terms of the number of doctors per 100 beds, the survival rate is estimated to be lowest in the order of 14 or less in the initial stage of hospitalization, followed by 14 to 30, 47 or more, and 31 to 46. Looking at the number of hospital beds, the survival rate is estimated to be high initially in the order of 281 or less, 281 to 519, 520 to 749, and 750 or more. This shows that, overall, the survival rate is estimated to be lower in larger hospitals. This is believed to be because the period of hospitalization in larger hospitals is limited, meaning there is a lot of censored data.
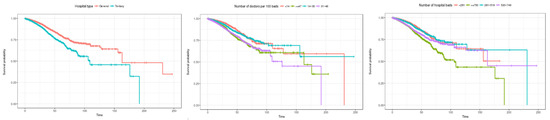
Figure 6.
Kaplan–Meier survival curves by institution characteristic (general inpatients). The three charts represent (1) hospital type, (2) number of doctors per 100 beds, and (3) number of hospital beds (from left to right).
4.1.3. Cox Proportional Hazards Model (General Inpatients)
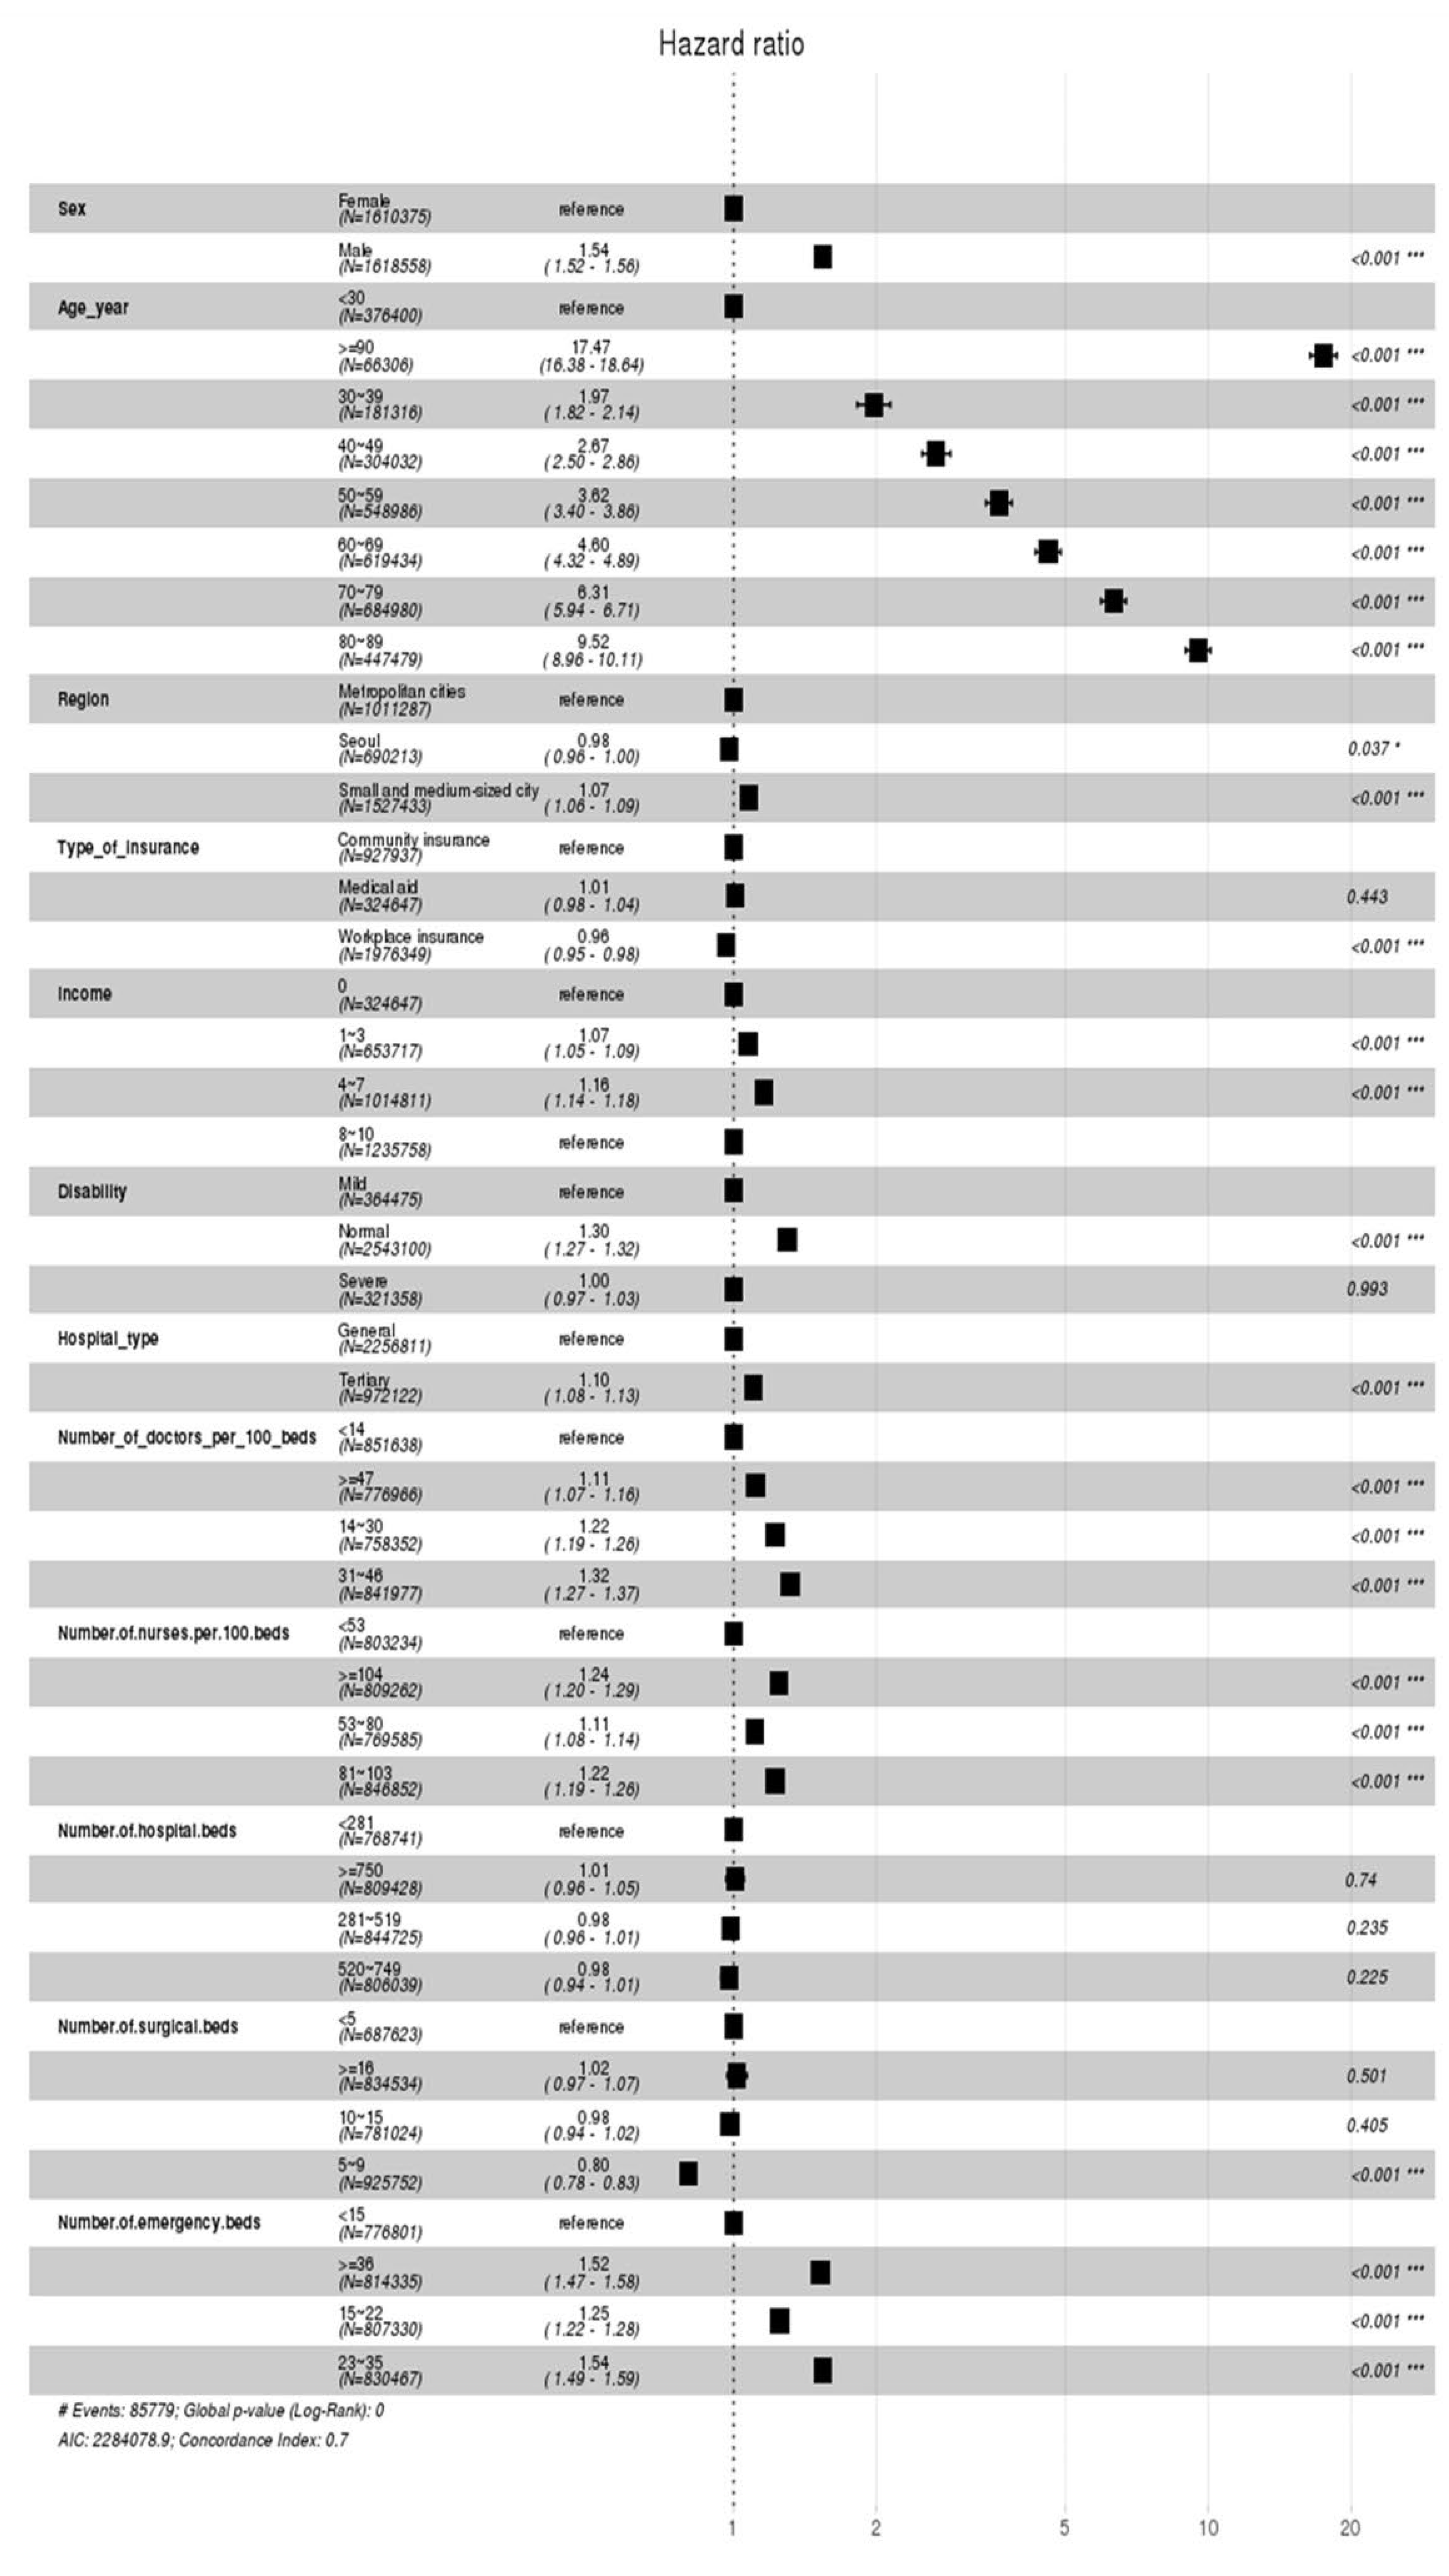
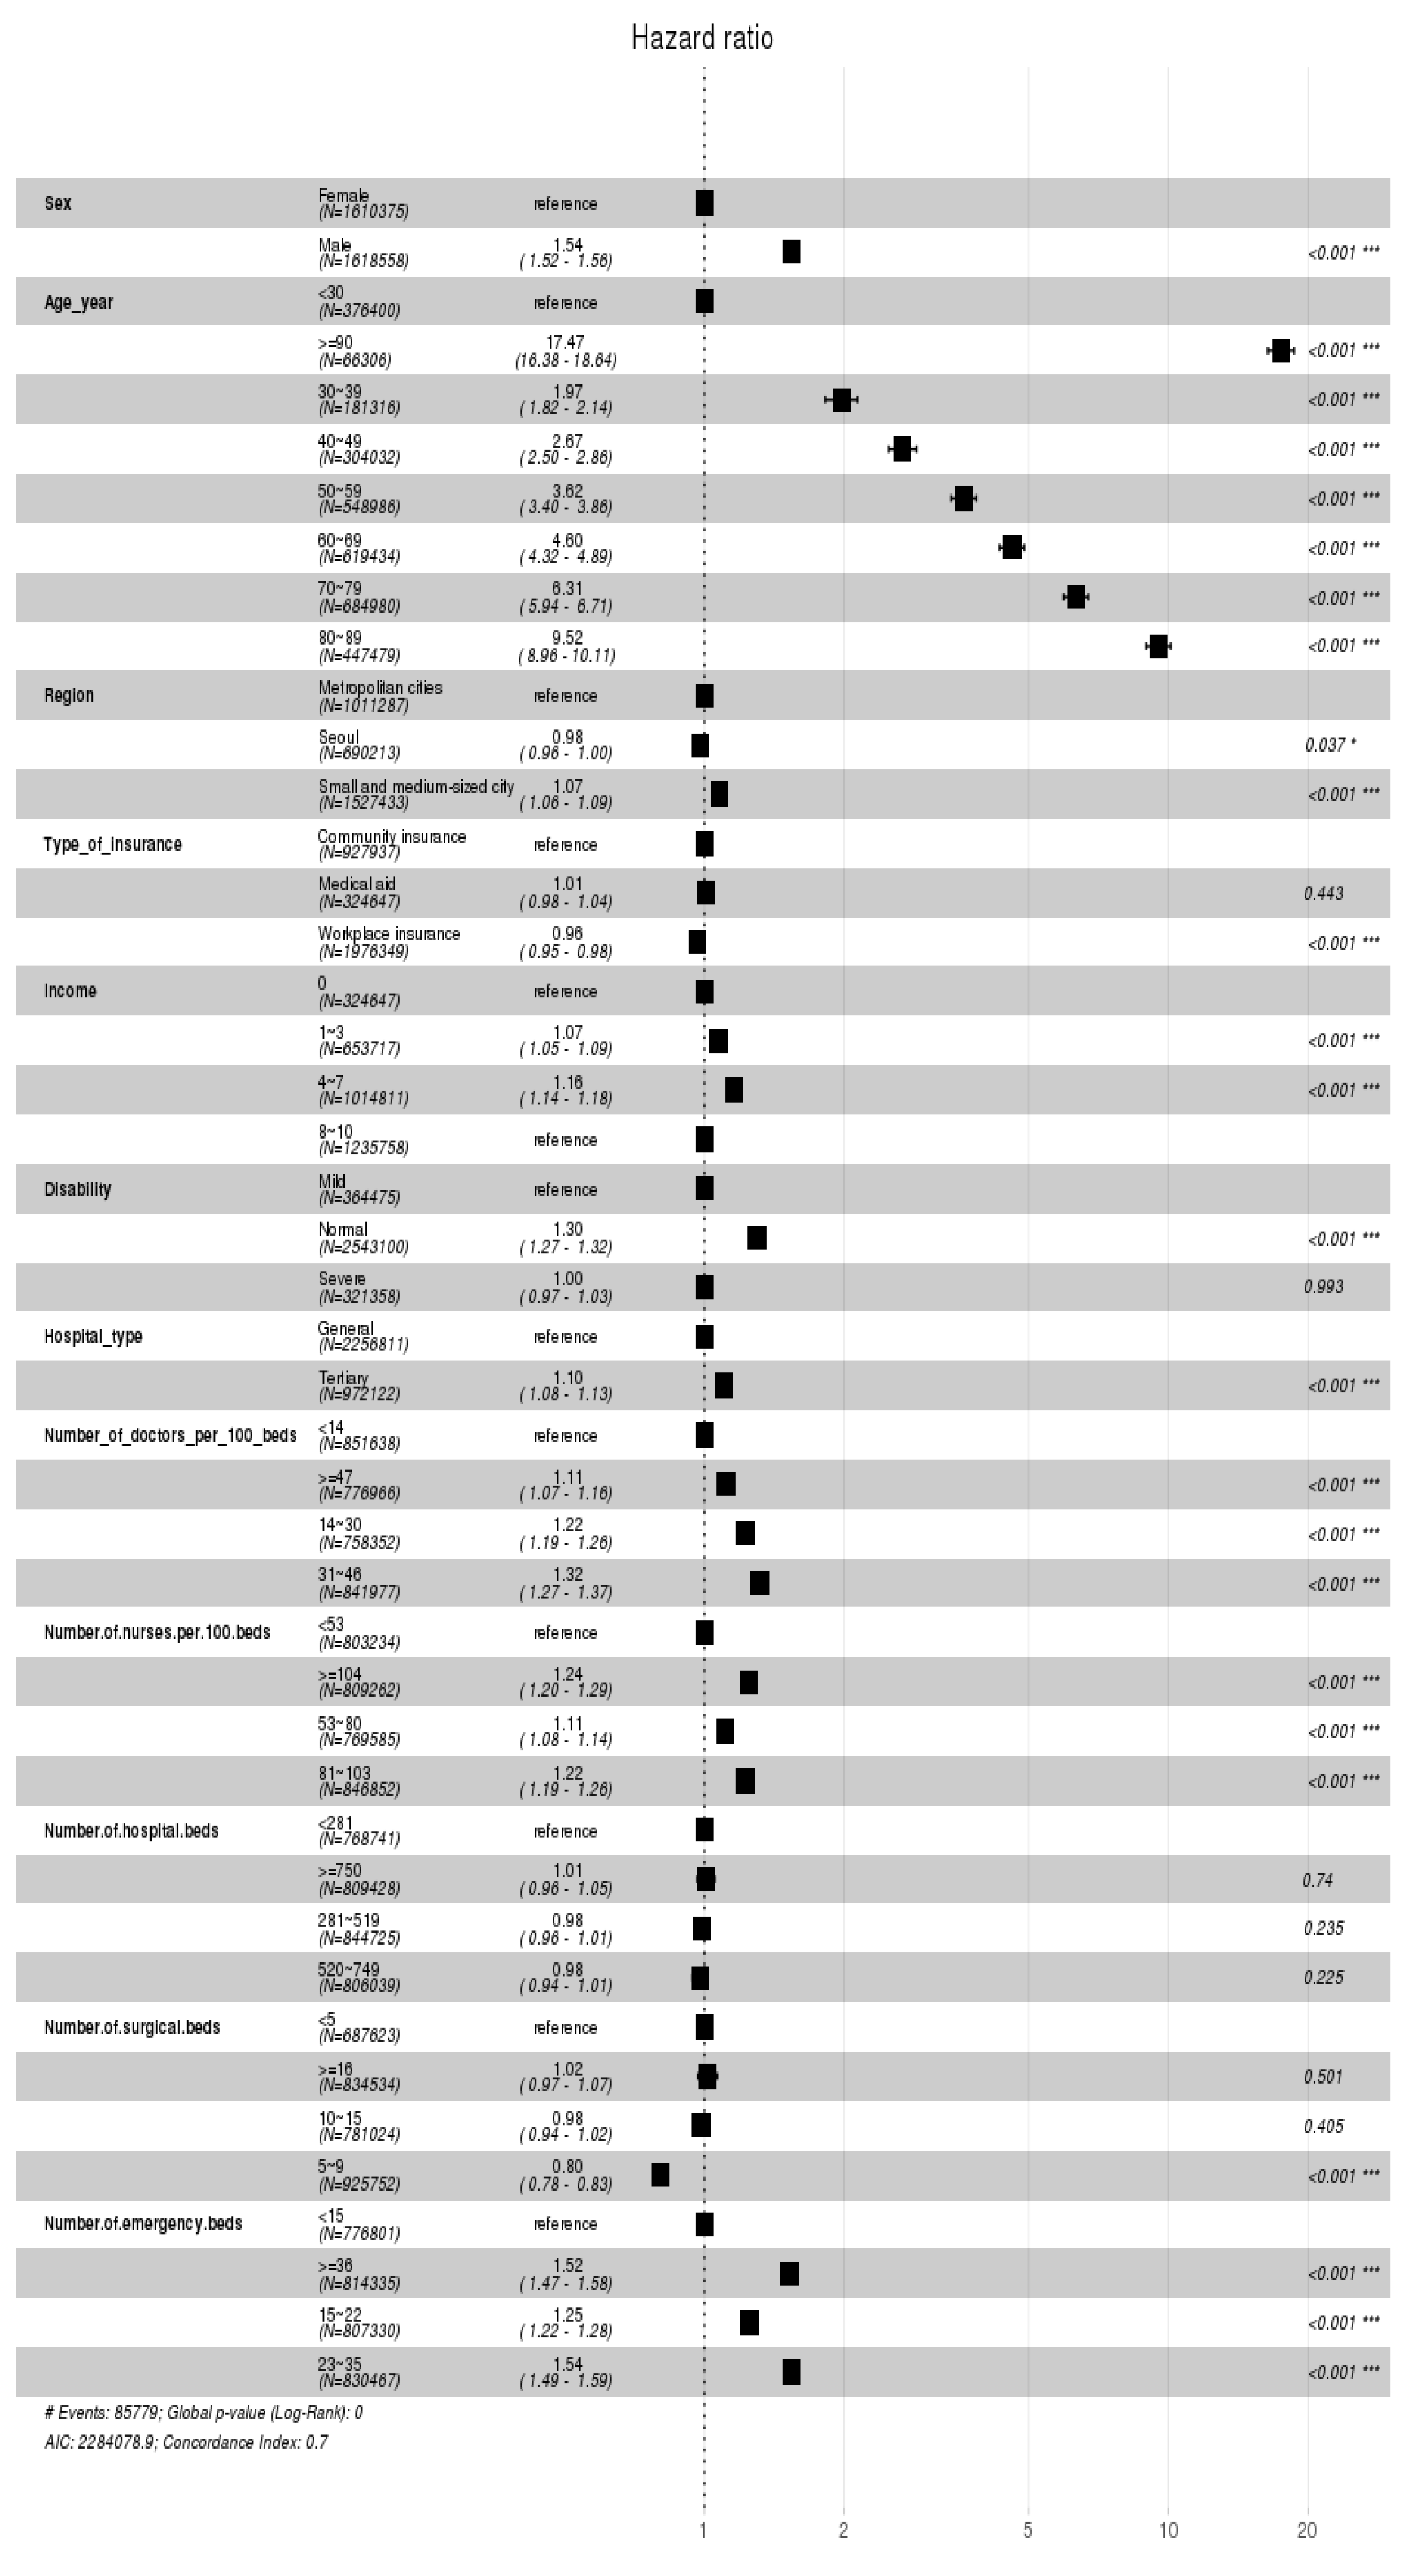
The Cox proportional hazards model results for determinants affecting the dying risk of general inpatients are shown in Figure 7. First, in terms of sociodemographic characteristics, it was found that the death rate for men is 1.54 times higher than for women. The death rate increases from under 30s to the 90s, with those over 90 having a death rate 17.47 times higher than those under 30. For region, compared to the metropolitan cities, the death rate in the small or medium-sized cities increases by 1.07 times, while it decreases by 0.98 times in Seoul. Second, among patient characteristics, the results for the type of insurance showed that the death rate of medical insurees increases by 1.01 times than that of those with regional insurance, while it decreases for those with workplace insurance to 0.96 times, indicating a lesser impact on mortality. In terms of income quantiles, the impact on death rate for patients in the 4–7 quantiles increases by 1.16 times of those in the 0th quantile. For the severity of disability, the impact on the death rate is 1.3 times higher for normal patients compared to those with mild disabilities. Third, the death rate within the top general hospitals is 1.10 times higher than that within the general hospitals. For the number of doctors per 100 hospital beds, the death rates for 31–48, 14–30, and above 47 doctors are 1.32, 1.22, and 1.11 times the death rate below 14 doctors, respectively. For the number of nurses per 100 hospital beds, it was found that compared to a group with fewer than 53 nurses, the death rates are higher in the following order: 1.24 times for the group over 104 nurses, 1.22 times for the group over 81 to 103 nurses, and then for the group between 53 and 80 nurses. In fact, there is no statistically significant difference in the results between different groups of the hospital beds. However, for the number of surgical beds, it was found that hospitals with five to nine beds have a death rate 0.8 times lower than hospitals with fewer than five beds, while there is no statistically significant differences in those with eighteen or more beds and ten to fifteen beds. Lastly, hospitals with the fewest emergency beds, which are less than 15, have the lowest death rate, while those with 23–35, more than 38, and 15–22 beds have the death rates that are 1.54, 1.52, and 1.25 times higher, respectively.

Figure 7.
Cox proportional hazards model indicating the hazard ratio of the general inpatients. (* p < 0.05, *** p < 0.001).
4.2. Determinants of Survival Time among Inpatients Admitted through Emergency Room
4.2.1. Characteristics of Inpatients Admitted through the Emergency Room
Table 7 presents the characteristics of inpatients admitted through emergency room. The gender distribution of the study subjects is 51.26% male and 48.74% female. The age distribution is as follows: 12.88% under 29, 5.72% between 30 and 39, 8.42% between 40 and 49, 14.47% between 50 and 59, 16.76% between 60 and 69, 21.33% between 70 and 79, 17.46% between 80 and 89, and 2.94% above 90. For region, the result shows 23.15% in Seoul, 25.54% in metropolitan cities, and 51.31% in other small and medium-sized cities. For insurance status, 9.88% are medical insurees, 28.78% are those with regional insurance, and 61.34% are those with workplace insurance. For income quantiles, 9.88%, 20.17%, 30.61% and 39.35% are 0, 1–3, 4–7, and 8–10 quantiles, respectively. For the severity of disability, individuals with normal, mild, and severe symptoms are 77.65%, 11.46%, and 10.96%, respectively. There are 61.39% general hospitals and 38.61% top general hospitals. For other features, such as the number of doctors per 100 hospital beds, they were recategorized into four groups during data preprocessing. For the number of doctors per 100 hospital beds, 12.13%, 22.05%, 35.72%, and 30.10% are institutions with below 13, 14–30, 31–46, and above 47 doctors per 100 hospital beds, respectively. For the number of nurses per 100 hospital beds, 12.54%, 20.40%, 35.04%, and 32.02% are institutions with 52, 53–80, 81–103, and above 104 nurses per 100 hospital beds, respectively. For the number of hospital beds, 12.43%, 20.65%, 35.27%, and 31.64% are institutions with below 280, 281–519, 520~749, and above 750 hospital beds, respectively. For the number of surgical beds, 11.71%, 21.86%, 33.41%, and 33.02% are institutions with below 4, 5–9, 10–15, and above 16 surgical beds, respectively. Lastly, for the number of emergency beds, 10.34%, 21.85%, 33.24%, and 34.57% are institutions with below 15, 15–22, 23–35, and above 36 surgical beds, respectively.
Table 7.
Characteristics of inpatients admitted through the Emergency Room.
4.2.2. Kaplan–Meier Estimation (Inpatients Admitted through the Emergency Room)
To estimate the survival rate for patients admitted to the emergency room over time, Kaplan–Meier estimation was performed by sociodemographic characteristics, patient characteristics, and medical institution characteristics. First, the survival probability estimation results for socio-demographic characteristics, such as gender, age, and region, are shown in Figure 8. In the case of gender, it is estimated that men have a higher survival probability than women in the early days of hospital stay, but after 125 days of hospital stay, the survival rate of men is estimated to be better than that of women.
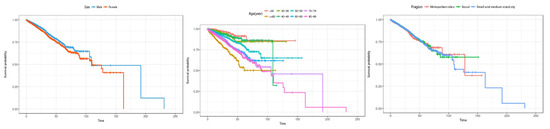
Figure 8.
Kaplan–Meier survival curves by socio-demographic characteristics (inpatients admitted through the emergency room). The three charts represent (1) sex, (2) age, and (3) region (from left to right).
In terms of age, the overall survival rate shows a gradual decreasing trend from those in their 30s to those in their 90s, but after the 100th day of hospitalization, the survival rate for those in their 40s is estimated to be lower than that for those in their 90s or older. In the case of regions, there appears to be no difference in the survival rate in the early days of hospitalization, but after 125 days of hospitalization, the survival rate is estimated to be the best in metropolitan cities, followed by Seoul and small and medium-sized cities.
Second, patient characteristics, such as health insurance subscriber type, income bracket, and disability severity, are shown in Figure 9. In the case of health insurance subscriber types, there was no difference in survival rate at the beginning of the length of stay, but after about 50 days, the survival rate was highest for medical benefit recipients, and the survival probability tended to decrease in the order of employer subscribers and local subscribers. In the case of income brackets, it is estimated that there is no difference in survival rate in the early stages of hospital stay. In the 8th to 10th percentiles, the survival rate showed a sharp decline after 100 days of hospitalization. In the case of disability severity, it is estimated that the survival rate is high in the order of severe, mild, and normal patients at the beginning of the length of stay. However, at 125 days, contrary to general hospitalized patients, the survival rate was highest for mild patients, and the survival rate decreased in that order for severe patients and then normal patients. It is estimated that the survival rate of mildly ill patients will decline sharply after 150 days.
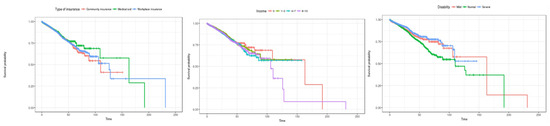
Figure 9.
Kaplan–Meier survival curves by patient characteristics (inpatients admitted through the emergency room). The three charts represent (1) type of insurance, (2) incom, and (3) disability (from left to right).
Third, the Kaplan–Meier survival curve by characteristics of medical institutions is shown in Figure 10. Looking at the hospital type, it is estimated that the survival rate is higher in general hospitals than in tertiary general hospitals. In terms of the number of doctors per 100 beds, it was initially estimated that hospitals with less than 14 doctors (the group with the fewest doctors) had the highest survival rate, but the survival rate was found to decline sharply after about 60 days. In terms of the number of hospitalized beds, the survival rate was estimated to be high in the following order: less than 281 beds, 281 to 519, 520 to 749, and more than 750 beds until the length of stay was about 60 days. However, at about 110 days, the survival rate of hospitals with fewer than 281 beds was found to decline sharply.
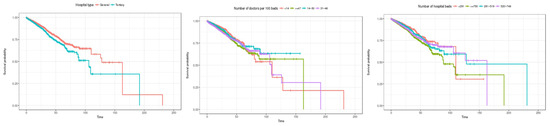
Figure 10.
Kaplan–Meier survival curves by institution characteristic (inpatients admitted through the emergency room). The three charts represent (1) hospital type, (2) number of doctors per 100 beds, and (3) number of hospital beds (from left to right).
4.2.3. Cox Proportional Hazards Model (Inpatients Admitted through the Emergency Room)
The Cox proportional hazards model demonstrates the determinants affecting the dying risk of inpatients admitted through the emergency room, as shown in Figure 11.
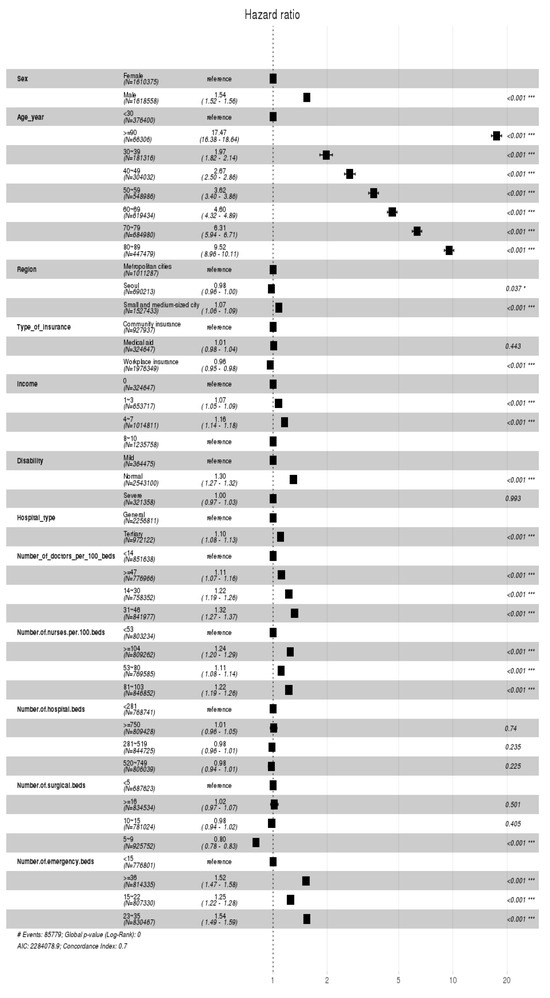
Figure 11.
Cox proportional hazards model indicating the hazard ratio of the inpatients admitted through the emergency room. (* p < 0.05, *** p < 0.001).
First, in terms of sociodemographic characteristics, it was found that the death rate for men is 1.43 times higher than for women. The death rate increases from under 30s to the 90s, with those over 90 having a death rate 12.20 times higher than those under 30. For region, compared to the metropolitan cities, the death rate in the small or medium-sized cities decreases by 0.96 times, while it also decreases by 0.95 times in Seoul. Second, among patient characteristics, the results for the type of insurance showed that the death rate of medical insurees increases by 1.07 times than that of those with regional insurance, while it decreases for those with workplace insurance to 0.93 times, indicating a lesser impact on mortality. In terms of income quantiles, the impact on death rate for patients in the 4–7 quantiles increases by 1.16 times to those in the 0th quantile, while its impact is the same between the 0th quantile and the 8–10 quantiles. Similarly, for the severity of disability, the impact on the death rate is 1.22 times higher for normal patients than for patients with mild disabilities, while the death rate for patients with severe disabilities decreases by 0.94 times than that for patients with mild disabilities. Third, the death rate within the top general hospitals is 1.06 times higher than that within the general hospitals. For the number of doctors per 100 hospital beds, the death rates for 14–30 and 31–46 doctors are 1.21 and 1.19 times the death rate below 14 doctors, respectively. However, there is no statistically significant difference in death rates between the institutions with fewer than 14 doctors and ones with more than 47 doctors. For the number of nurses per 100 hospital beds, the death rates for 281–519 and for more than 750 nurses are 1.10 and 1.07 times the death rate below 53 nurses, respectively. However, there is no statistically significant difference in death rates between the institutions with fewer than 53 nurses and ones with 520–749 nurses.
For the number of hospital beds, institutions with the third highest number of beds (281–519) and those with 750 beds have increased death rates of 1.10 and 1.07 times higher, respectively, than those with the fewest beds (below 281). However, there is no significant difference in the death rates between institutions having lower than 281 beds and those with 520–749 beds. For the number of surgical beds, compared to institutions with the fewest number of surgical beds (below 5), those with the highest number of surgical beds (above 16) and those with 10–15 surgical beds have the death rate of 1.13 and 1.09 times higher, respectively. In contrast, those with 5–9 surgical beds demonstrated the decreased death rate that is 0.80 times than that of those with the fewest number of surgical beds. Lastly, in terms of the number of emergency beds, those with above 36, 23–35, and 15–22 emergency beds have increased death rates of 1.40, 1.34, and 1.16 times higher, respectively, than those with the fewest number of emergency beds (below 15).
4.3. Summarized Results and Implication
Table 8 illustrates the summarized results of this study. In fact, there is no significant difference in determinants of the death rate between the two groups of study. However, in terms of the ‘city’ feature among the sociodemographic characteristics, the small and medium-sized city exerts the most influence on the death rate of general inpatients, whereas the metropolitan city exerts the most influence on the death rate of inpatients admitted through the emergency room. In terms of institution characteristics, it was found that there is a difference in determinants affecting the death rate of the two groups of study, such as the number of doctors per 100 hospital beds, the number of nurses per 100 hospital beds, the number of hospital beds, the number of surgical beds, and the number of emergency beds.
Table 8.
Determinants of the death rate (general inpatients vs. inpatients admitted through the ER).
The theoretical implications of this study are as follows. This study is the pioneering research in analyzing determinants affecting the death rate of general inpatients as well as that of inpatients admitted through the emergency room using survival analyses. Therefore, we first utilized the Kaplan–Meier survival estimation to take a closer look at the change in survival probability of inpatients depending on their sociodemographic, patient, and institutional characteristics. We also incorporated the Cox proportional hazards model to investigate not only the statistically significant features from sociodemographic, patient, and institutional characteristics that influence the death rate of inpatients but also the extent to which each feature affects mortality.
The practical implications of this study are as follows. Although Korea has a multiple regional emergency medical centers across the country (Seoul: 27, Incheon: 10, Busan: 8, Daegu: 5, Daejeon: 4, Ulsan: 1, Gwangju: 5, Gyeonggi: 22, Gyeongbuk: 6, Gyeongnam: 6, Chungbuk: 4, Chungnam: 8, Jeonbuk: 8, Jeonnam: 2, Gangwon: 4, Jeju: 4), the survival probability of emergency room patients within the metropolitan cities is found to be the lowest. This is most likely due to the inadequate initial treatment and procedures for critically ill emergency patients at the regional emergency medical centers.
Furthermore, the emergency medical expense system is structured in a way that the more patients visit the emergency room, the more revenue is generated, regardless of the investment towards the emergency room or its quality of care. Therefore, to solve such issues, it is of importance to expand regional emergency centers that specialize in the professional treatment and care of critically ill emergency patients, and to reinforce the expense system that can induce the enhancement in the quality of emergency care. Lastly, it is necessary to secure an intermediary organization that can handle medical accidents that may occur during emergency treatments.
5. Conclusions
5.1. Research Implications
Considering an increase in the death of patients within the emergency room department, it is of necessity to identify the determinants of survival time among inpatients admitted through the emergency room. Therefore, our goal was to conduct a comparative study between general inpatients and those admitted through the emergency room, using survival analyses to identify the determinants of survival time.
In fact, the results reveal that there is not much difference in the death rate between the two groups of interest. However, for the regional variable among sociodemographic features, it was found that the small and medium-sized cities exert the most influence on the death rate among general inpatients, while the metropolitan cities exert the most influence on the death rate among those admitted through the emergency room. Among institutional features, the number of doctors per 100 hospital beds, the number of nurses per 100 hospital beds, the number of hospital beds, the number of surgical beds, and the number of emergency beds were found to affect the death rate of the two groups of study subjects differently.
Many previous studies utilized multiple or logistic regression analyses as their main research methodology. However, multiple regression analysis requires basic assumptions to be met, including linearity, independence, equal variance, normality, and the absence of multicollinearity. Logistic regression analysis, on the other hand, requires assumptions, such as the linearity of the logit, the independence of the error term, and the absence of multicollinearity. Although medical data often exhibit censored characteristics, these two methods fail to accommodate them, both presenting a significant limitation.
Therefore, this study conducted survival analyses to analyze the factors affecting the dying risk of general inpatients and those admitted through the emergency room. For this purpose, we measured the probability of survival as well as that of hospitalization depending on the sociodemographic, patient, health checkup, and institutional features using the Kaplan–Meier estimation. However, the Kaplan–Meier survival estimation has a limitation in that it cannot control for factors outside of those under analysis. Therefore, we also incorporated the Cox proportional hazards models as an additional econometric method to validate the results by controlling for other factors. Since both the Kaplan–Meier survival analysis and the Cox proportional hazards model do not require assumptions regarding the data distribution, these two methods are suitable for analyzing the determinants of survival time using the medical data.
In this study, we conducted survival analyses to compare and analyze the two subject groups: general inpatients and inpatients admitted through the emergency room. It is expected that a plan for the efficient allocation of limited medical resources can be established based on our research findings.
5.2. Limitations and Future Directions
The limitations of this study are as follows. Although there are various features affecting the dying risk of patients, such as sociodemographic and disease-specific features, this study is limited in that we only incorporated the sociodemographic, patient, and institutional features under analyses. Therefore, future studies are to encompass a broader scale of features from various aspects.
This study separately analyzes the two patient populations (general inpatients and inpatients admitted through the ER). An analysis that incorporates both patient populations using the Cox model would enable an assessment of whether the hazard or risk (death rate) differs between the patient populations after adjusting for all the factors considered in this paper.
Moreover, we conducted survival analyses on individuals who were either general inpatients or inpatients who were admitted through the emergency room. However, it is likely that survival time varies depending on a patient’s main diagnosis. Therefore, it is highly recommended that future research should rigorously scrutinize and compare the survival times of patients across different diagnoses.
Lastly, this study conducted survival analyses based on the four-year cohort DB provided by the Korean NHIS from the years 2016 to 2019 encompassing tables of qualification, birth and death, diagnosis, health checkup, institution, and senior long-term care characteristics. However, the Korean NHIS further provides key information regarding, for instance, medical treatment (code for drugs, treatment code, main diagnosis code, days of hospitalization, etc.) and prescription details (drug ingredient code, dosage per administration, daily dosage, total days of administration, unit price, total cost, etc.). Therefore, future research should utilize the aforementioned information into their analyses.
Author Contributions
Conceptualization, H.C., and J.K.; methodology, I.C.; formal analysis, S.R.; data curation, A.E.K.; visualization, S.R.; writing—original draft, H.C.; writing—review and editing, J.K. All authors have read and agreed to the published version of the manuscript.
Funding
This research was supported by the BK21 FOUR (Fostering Outstanding Universities for Research) funded by the Ministry of Education (MOE, Korea) and National Research Foundation of Korea (NRF).
Institutional Review Board Statement
The study was conducted in accordance with the Helsinki Declaration and approved by the institutional review board, Kyung Hee University, Seoul, Korea (Protocol No. KHSIRB-22-344), for research involving human subjects.
Informed Consent Statement
Informed consent was obtained from all subjects involved in this study.
Data Availability Statement
Data sharing is not applicable to this article.
Conflicts of Interest
The authors declare no conflicts of interest.
References
- Yoon, K.J. Infectious diseases and public healthcare through the response to COVID-19. Health Welf. Issue Focus 2020, 377, 1–11. [Google Scholar]
- Oh, Y.H. Problems and policy directions of the emergency medical system in Korea. Health Welf. Issue Focus 2011, 105, 1–8. [Google Scholar]
- Jeon, B.; Kim, K.; Jin, Y. Ontology Design to Improve User Fitness of Emergency Medical Statistics Quality(EMSQ). J. Korea Acad.-Ind. Coop. Soc. 2024, 25, 208–215. [Google Scholar]
- Hwang, H.E.; Kahng, H.; Lee, E.S.; Kim, J.Y.; Yoon, Y.H.; Kim, S.B. Early Prediction of Patient Disposition for Emergency Department Visits Using Machine Learning. J. Korean Inst. Ind. Eng. 2021, 47, 263–271. [Google Scholar]
- Jung, G.H.; Kweon, J. A study on space use analysis at emergency room in local emergency medical center. J. Digit. Des. 2017, 17, 81–92. [Google Scholar]
- Kim, T.Y.; Kang, G.H.; Jang, Y.S.; Kim, W.; Choi, H.Y.; Kim, J.G.; Lee, Y.; Song, H.W. Effect of admission decision by emergency physicians on length of stay of emergency room and prognosis for patients diagnosed with medical diseases. J. Korean Soc. Emerg. Med. 2021, 32, 189–197. [Google Scholar]
- Lee, E.B.; Paek, S.H.; Kwon, J.H.; Park, S.-H.; Kim, M.-J.; Byun, Y.-H. Characteristics of children hospitalized through the pediatric emergency department and effects of pediatric emergency ward hospitalization. Pediatr. Emerg. Med. J. 2023, 10, 124–131. [Google Scholar] [CrossRef]
- Lee, S.D. Preventable Trauma Death Rate Improves over 3 Years: 19.9% → 15.7%. Medical News. 2022. Available online: http://www.bosa.co.kr/news/articleView.html?idxno=2169044 (accessed on 21 March 2023).
- Kim, Y.; Jung, K.Y.; Cho, K.H.; Kim, H.; Ahn, H.C.; Oh, S.H.; Lee, J.B.; Yu, S.J.; Lee, D.I.; Im, T.H.; et al. Preventable trauma deaths rates and management errors in emergency medical system in Korea. J. Korean Soc. Emerg. Med. 2006, 17, 385–394. [Google Scholar]
- Lee, E.J.; Song, Y.S.; Oh, S.H. Survival analysis approach for student departure of freshmen: Focusing on the case of S university. J. Korean Assoc. Learn.-Centered Curric. Instr. 2020, 20, 235–258. [Google Scholar] [CrossRef]
- Shin, W.M.; Kim, J.M.; Park, C.Y.; Shin, E.; Tchoe, B. Analysis of factors influencing the survival of patients with Out-of-Hospital of Cardiac Arrest (OHCA). Korean Public Health Res. 2020, 46, 93–105. [Google Scholar]
- Yoo, I.S. What to do to improve emergency care. Health Welf. Forum 2010, 169, 45–57. [Google Scholar]
- Kim, J.H.; Han, M.S.; Kim, C.-K.; Sun, S.; Kim, G.J.; Bae, S.H.; Kim, Y.K. A Study on the legal definition and the demands of the times of a medical technician according to changes in the medical market. J. Digit. Converg. 2021, 19, 397–406. [Google Scholar]
- Lee, J.R.; Do, N.Y. Effect of brand on survival and closing of stores. J. Korea Real Estate Anal. Assoc. 2019, 25, 49–62. [Google Scholar]
- Jing, B.; Zhang, T.; Wang, Z.; Jin, Y.; Liu, K.; Qiu, W.; Ke, L.; Sun, Y.; He, C.; Hou, D.; et al. A deep survival analysis method based on ranking. Artif. Intell. Med. 2019, 98, 1–9. [Google Scholar] [CrossRef] [PubMed]
- Schober, P.; Vetter, T.R. Survival analysis and interpretation of time-to-event data: The tortoise and the hare. Anesth. Analg. 2018, 127, 792. [Google Scholar] [CrossRef] [PubMed]
- In, J.; Lee, D.K. Survival analysis: Part I-analysis of time-to-event. Korean J. Anesthesiol. 2018, 71, 182–191. [Google Scholar] [CrossRef] [PubMed]
- Ha, S.H.; Yang, J.W.; Min, J.H. Credit prediction based on Kohonen network and survival analysis. J. Korean Oper. Res. Manag. Sci. Soc. 2009, 34, 35–54. [Google Scholar]
- Gémar, G.; Moniche, L.; Morales, A.J. Survival analysis of the Spanish hotel industry. Tour. Manag. 2016, 54, 428–438. [Google Scholar] [CrossRef]
- Gemar, G.; Soler, I.P.; Guzman-Parra, V.F. Predicting bankruptcy in resort hotels: A survival analysis. Int. J. Contemp. Hosp. Manag. 2019, 31, 1546–1566. [Google Scholar] [CrossRef]
- Kristanti, F.T.; Effendi, N. A survival analysis of indonesian distressed company using cox hazard model. Int. J. Econ. Manag. 2017, 11, 155–167. [Google Scholar]
- Kristanti, F.T.; Herwany, A. Corporate governance, financial ratios, political risk and financial distress: A survival analysis. Account. Financ. Rev. 2017, 2, 26–34. [Google Scholar] [CrossRef] [PubMed]
- Nagy, Á.; Munkácsy, G.; Győrffy, B. Pancancer survival analysis of cancer hallmark genes. Sci. Rep. 2021, 11, 6047. [Google Scholar] [CrossRef] [PubMed]
- Viljanen, M.; Airola, A.; Heikkonen, J.; Pahikkala, T. Playtime measurement with survival analysis. IEEE Trans. Games 2017, 10, 128–138. [Google Scholar] [CrossRef]
- Lee, J.B.; Woo, H. Determinants of length of stay in ischemic heart disease patients. J. Health Inform. Stat. 2020, 45, 52–59. [Google Scholar] [CrossRef]
Disclaimer/Publisher’s Note: The statements, opinions and data contained in all publications are solely those of the individual author(s) and contributor(s) and not of MDPI and/or the editor(s). MDPI and/or the editor(s) disclaim responsibility for any injury to people or property resulting from any ideas, methods, instructions or products referred to in the content. |
© 2024 by the authors. Licensee MDPI, Basel, Switzerland. This article is an open access article distributed under the terms and conditions of the Creative Commons Attribution (CC BY) license (https://creativecommons.org/licenses/by/4.0/).