Abstract
Disability is associated with lower quality of life and premature death in older people. Therefore, prevention and intervention targeting older people living with a disability is important. Frailty can be considered a major predictor of disability. In this study, we aimed to develop nomograms with items of the Tilburg Frailty Indicator (TFI) as predictors by using cross-sectional and longitudinal data (follow-up of five and nine years), focusing on the prediction of total disability, disability in activities of daily living (ADL), and disability in instrumental activities of daily living (IADL). At baseline, 479 Dutch community-dwelling people aged ≥75 years participated. They completed a questionnaire that included the TFI and the Groningen Activity Restriction Scale to assess the three disability variables. We showed that the TFI items scored different points, especially over time. Therefore, not every item was equally important in predicting disability. ‘Difficulty in walking’ and ‘unexplained weight loss’ appeared to be important predictors of disability. Healthcare professionals need to focus on these two items to prevent disability. We also conclude that the points given to frailty items differed between total, ADL, and IADL disability and also differed regarding years of follow-up. Creating one monogram that does justice to this seems impossible.
1. Introduction
Population aging is occurring all over the world and is accompanied by an increasing number of people with disability; after all, the prevalence of disability is associated with aging. In the USA, the prevalence of disability is 10.6% among people aged 18–64 years and 35.2% for those aged 65 years or older [1]. There are different definitions of disability. According to the World Health Organization (WHO), disability has three dimensions referring to impairment in a person’s body structure or function (e.g., loss of a limb), or mental functioning (e.g., loss of memory), activity limitation (e.g., difficulty in walking), and participation restrictions in performing daily activities (e.g., engaging in recreational and social activities) [2]. In research focusing on older people, disability is often defined as having difficulty conducting activities of daily living (ADL) and/or instrumental activities of daily living (IADL) [3,4]; the second dimension was established by the WHO (activity limitation). Examples of ADL include getting on and off the toilet and standing up from sitting in a chair; doing the shopping, washing, and ironing clothes refer to IADL [5,6]. IADL disability reflects a less severe form of disability than ADL disability [7,8]. In a sample of Polish people aged ≥60 years, it was observed that 35.75% and 17.13% reported at least one problem with IADL and ADL, respectively [9]. In a sample of Dutch people aged ≥75 years, these percentages were 54.6% for IADL disability and 67.4% for ADL disability [10].
Disability is associated with adverse outcomes in older people, such as increased use of health care [11,12], lower quality of life [10,13], and premature death [14,15,16]. Early identification, prevention, and intervention targeting older people living with a disability is, therefore, of utmost importance. To achieve this, knowledge of factors influencing disability is essential. In Poland, it was shown that the occurrence of disability is influenced by a lack of social contacts, multimorbidity, pain, and the presence of barriers in the environment for older people [9]. In the Netherlands, risk groups include those living alone, women, people who are widowed or divorced, and those with a low educational level [17]. In addition to these risk factors and at-risk groups, frailty can be considered a major predictor of disability [18,19,20]. A systematic review using 28 studies showed that physical frailty indicators could predict ADL disability; the most powerful predictors were slow gait speed and low physical activity [20]. A more recent systematic review and meta-analysis including 20 studies quantitatively showed that frail older people were more likely to develop or have more severe ADL and IADL disability [19]. Finally, a systematic review and meta-analysis of prospective cohort studies including 32,998 people aged 60 years or older also concluded that those who are frail have the highest relative risk of disability [18].
As with disability, there are also different definitions of frailty [21]. There are definitions that view frailty exclusively as a concept that refers only to physical limitations that older people may have. One measurement tool that goes along with these definitions is the phenotype of frailty frequently used in studies [22]. This tool contains five physical criteria by which a healthcare professional can determine if a person is frail: weakness, unintentional weight loss, poor endurance, slowness, and low physical activity [22]. As a counterpart to physical frailty definitions, there are also definitions that emphasize the multidimensional nature of frailty. The measurement tools that align with these definitions not only pay attention to physical limitations but also to the psychological and social limitations of older people. Examples of such tools are the Frailty Index [23], based on the Canadian Study of Health and Aging (CSHA) Cumulative Deficit Model, and the Tilburg Frailty Indicator (TFI) [24].
As mentioned, many studies have been performed that aimed at examining the association between frailty and disability and, in particular, predicting disability by frailty [18,19,20]. In general, in these studies, frailty was assessed using a tool containing physical items (e.g., the phenotype of frailty). Studies using a multidimensional tool are rarer. In the present study, we used the TFI items belonging to physical, psychological, and social frailty as predictors of disability. We have assigned one point per item if there was a deficit. Linear and logistic regressions are frequently used as techniques to develop a prediction model; however, the relationship between TFI items and disability may differ. In this study, we aimed to develop nomograms with the TFI items as predictors by using cross-sectional data and longitudinal data, focusing on the prediction of disability, where we distinguish between total disability, ADL disability, and IADL disability. We will show that the nomograms differ per outcome and per time point. The different time points refer to the longitudinal aspect of the study. The knowledge we gather and present in the nomograms can support healthcare professionals in determining the risk of disability in community-dwelling older people.
2. Methods
2.1. Study Population and Data Collection
For the present study, we followed the guidelines for reporting observational studies (STROBE) [25]. We used a sample of 479 community-dwelling people aged ≥75 years, referring to a 42% response rate, which has also been used in previous studies [24,26]. All participants were residents of Roosendaal, a municipality with 78,000 inhabitants in the south of the Netherlands. In June 2008 (T0), they received a self-report questionnaire including measures for assessing frailty and disability. A subset of all participants completed the same questionnaire five years later, in June 2013 (T5) (n = 160), and once more, four years later, in June 2017 (T9) (n = 77).
2.2. Measures
2.2.1. Groningen Activity Restriction Scale (GARS)
We used a continuous disability scale, the Groningen Activity Restriction Scale (GARS), for assessing disability (total) [27]. This self-report questionnaire contains 18 items; each item has 4 response categories (1 = yes, I can do that easily and without help; 2 = yes, I can do that without help, but it takes some effort; 3 = yes, I can do that without help but it takes a lot of effort; 4 = no, I cannot do that without help). The disability total score ranges from 18 (no disability) to 72 (maximum disability). A cut-off point of 29 has been established [28]; therefore, people with scores of 29 or higher can be considered people with disability. The two continuous subscales of the GARS were used for assessing ADL disability and IADL disability. The ADL subscale consists of 11 items, and the IADL consists of 7 items, with scores ranging from 11 to 44 and 7 to 28, respectively; higher scores indicate greater disability. Previous studies have shown that the GARS has good psychometric properties (reliability, validity) for assessing disability in older people [5,6].
2.2.2. Frailty
We used the items from part B of the TFI as predictor variables. This part contains 15 items; 11 items have two response categories (yes, no), and 4 items have three response categories (yes, sometimes, no), dichotomized to yes, no. Eight items belong to physical frailty: physically unhealthy, unexplained weight loss, difficulty in walking, difficulty in maintaining balance, poor hearing, poor vision, lack of strength in the hands, and physical tiredness. Four items refer to psychological frailty: problems with memory, feeling down, feeling nervous or anxious, and unable to cope with problems. Finally, three items indicate social frailty: living alone, lack of social relations, and lack of social support [24]. The TFI total score ranges from 0 to 15; the higher the score, the more frailty is present in an individual. Many studies have shown that the TFI has good psychometric properties, evidenced by good reliability (internal consistency, test–retest reliability) and validity (criterion, construct) [29].
2.3. Statistical Analysis
We used counts and percentages to describe the baseline characteristics of the participants. For the multivariate analysis, we used linear regression with all 15 predictor variables (15 items of the TFI) at each time point. The predictive performance of the models was measured using the R-square statistic (Rsq). Values of Rsq toward 1 indicate good model performance. Nomograms were constructed based on the transformed coefficients (coefficients divided by the maximum of the coefficients and multiplied by 100) of the linear regression model. For all analyses, we used R version 3.4.4. [30].
2.4. Ethical Considerations
For this study, medical ethics approval was not necessary as particular treatments or interventions were not offered or withheld from respondents. The integrity of the respondents was not encroached upon as a consequence of participating in this study, which is the main criterion in medical–ethical procedures in the Netherlands [31]. This study was conducted according to the guidelines for good clinical practice. The researchers did not make the questionnaire long, so the burden on participants was limited; the average time for completing the questionnaire was 20 min. In addition, the questionnaire contained measures (GARS, TFI) that have already been used in many previous studies among older people.
3. Results
3.1. Characteristics of the Participants
Table 1 presents the characteristics of the participants at T0, T5, and T9. At baseline, the sample consisted of 272 women (56.8%), 49.8% of the participants were married or cohabiting, and most participants had secondary education (46.5%). The group of participants decreased over time as expected (n = 479, n = 160, and n = 77, respectively). The mean values of the frailty scores and the disability scores increased over time.
Table 1.
Characteristics of the participants (T0, n = 479; T5, n = 160; T9, n = 77).
The change in distribution of the categorial variables over time was tested using the chi-square test. The p-values are shown in Table 2. The change in monthly income from T0 to T5 stands out in Table 2 (p-value < 0.001).
Table 2.
p-values for changes in distribution categorical variables.
The change in distribution of the continuous variables over time was tested using the paired Wilcoxon test. For all comparisons, the p-values were <0.001 (not surprisingly for the variable age). Table 3 shows the characteristics of the variables in the B-part of the TFI (i.e., our predictor variables) at T0. For all predictors, except ‘lack of social relations’, the ‘yes’ category had the lowest frequency.
Table 3.
Characteristics of the 15 TFI items.
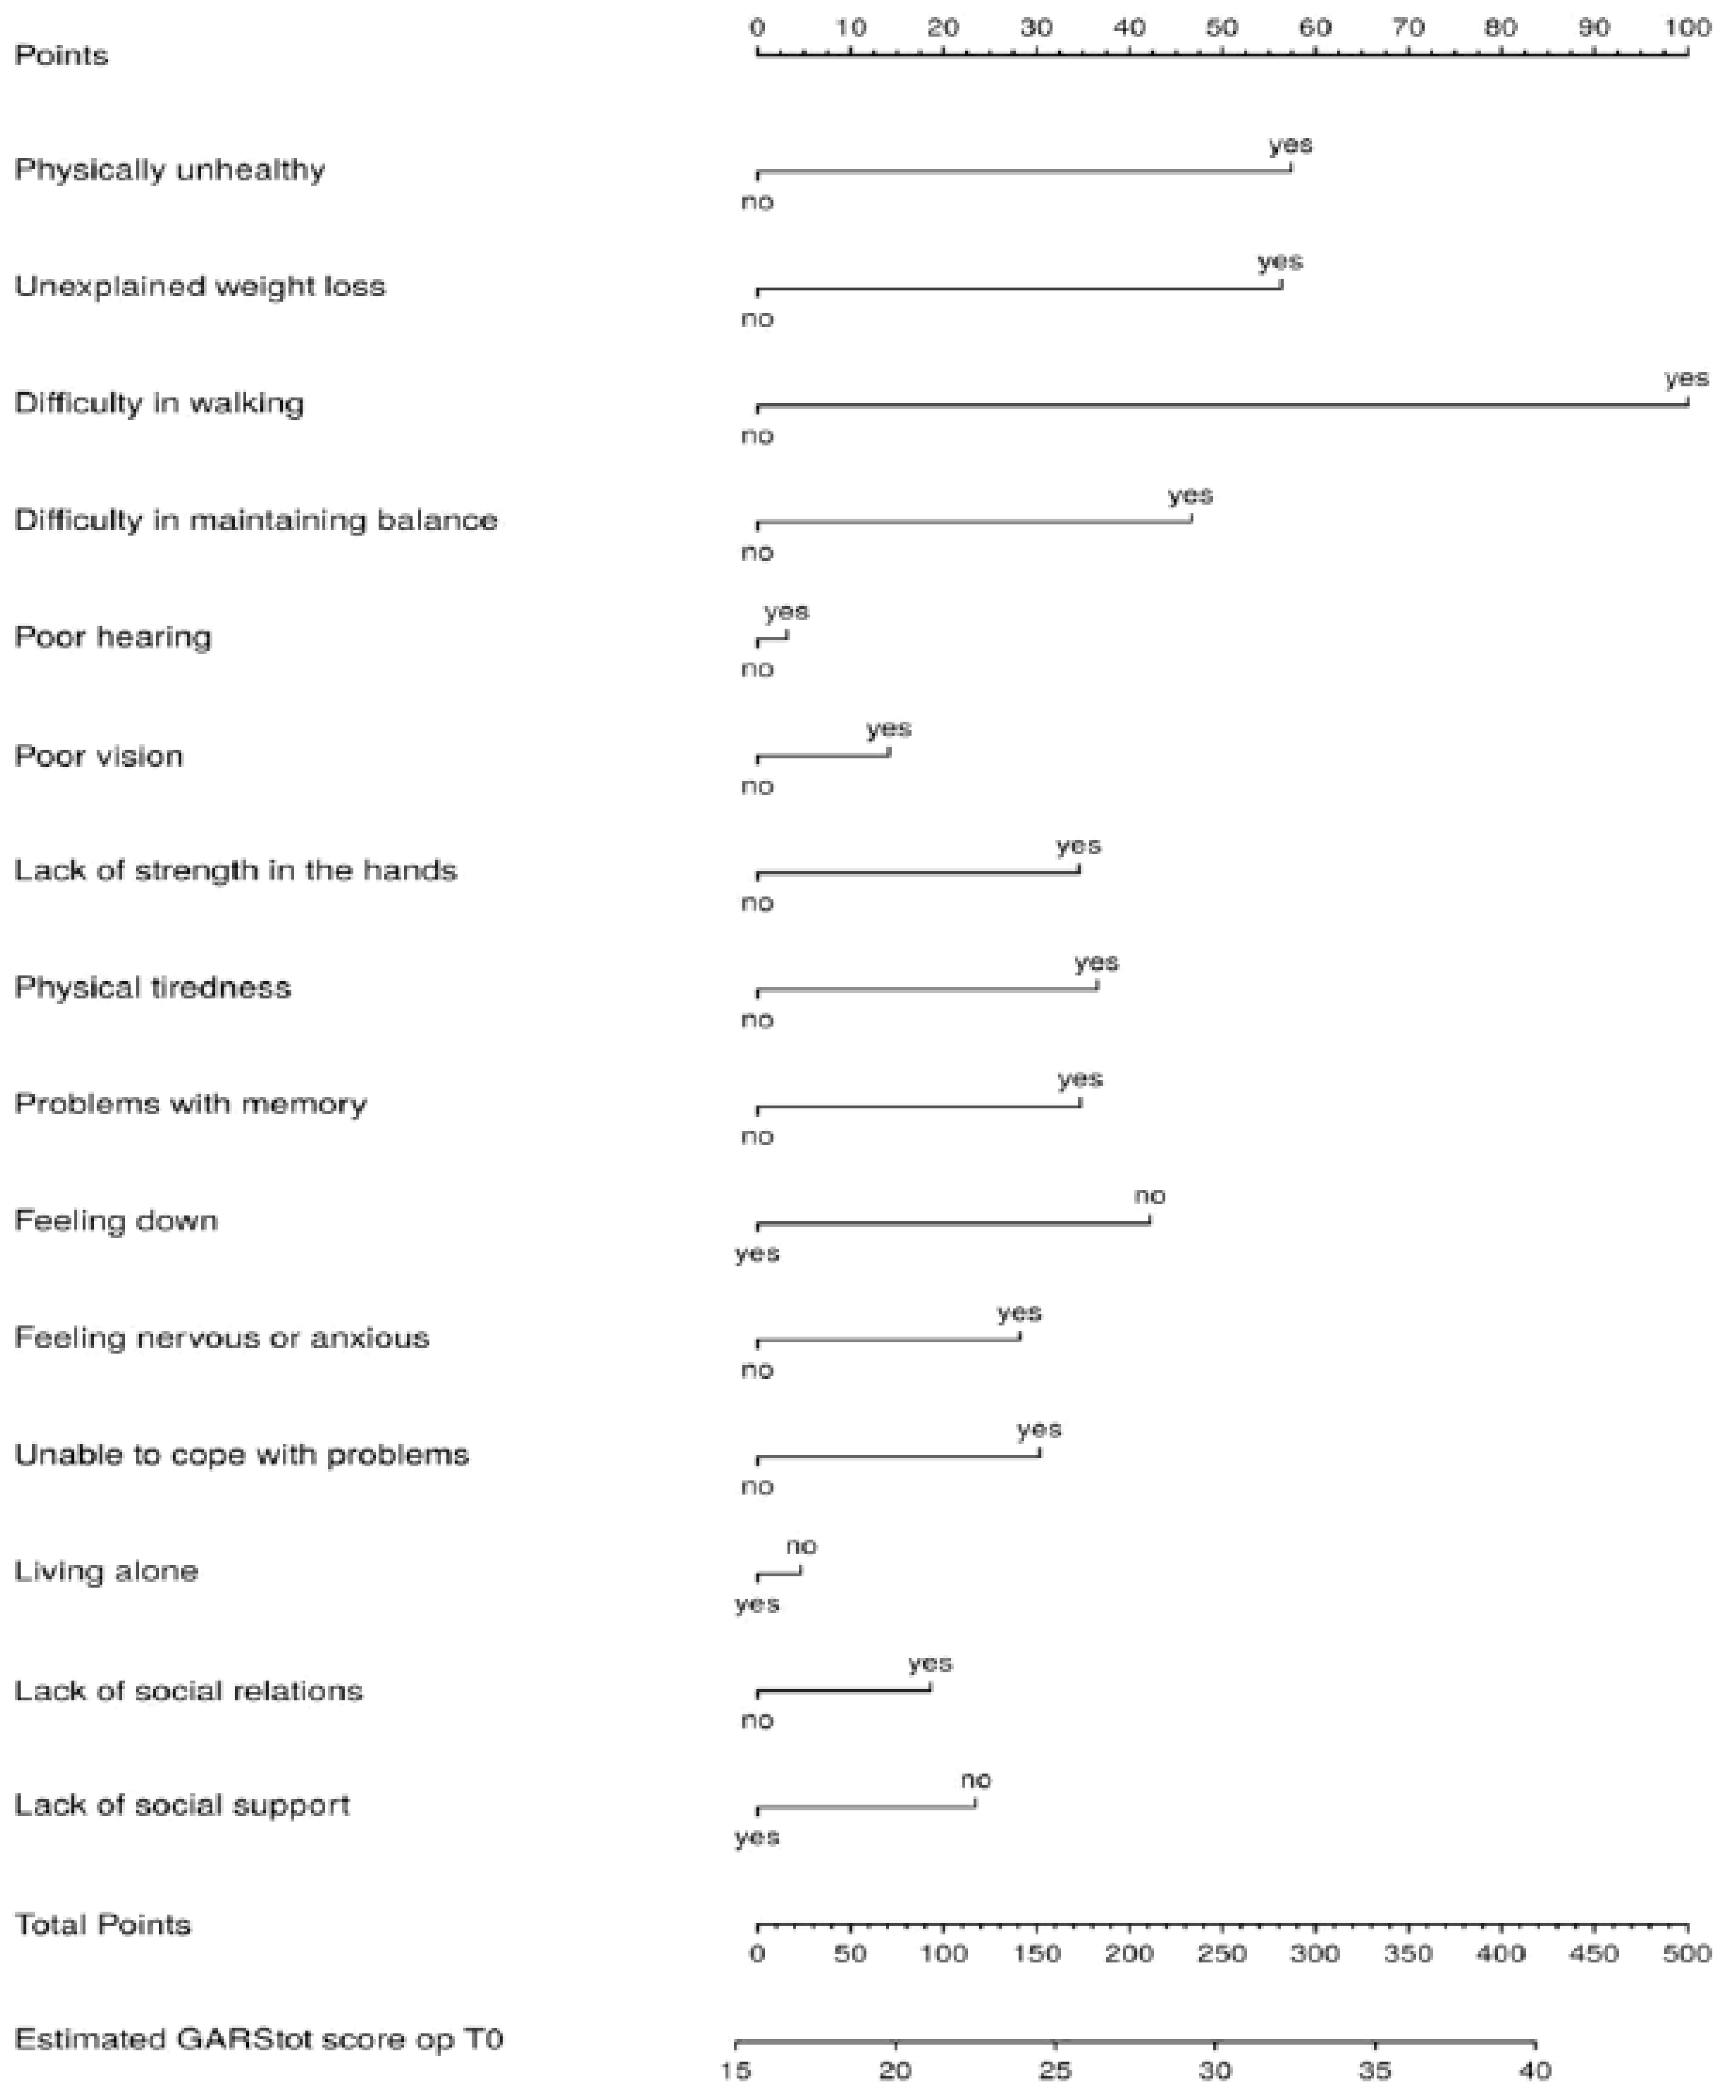
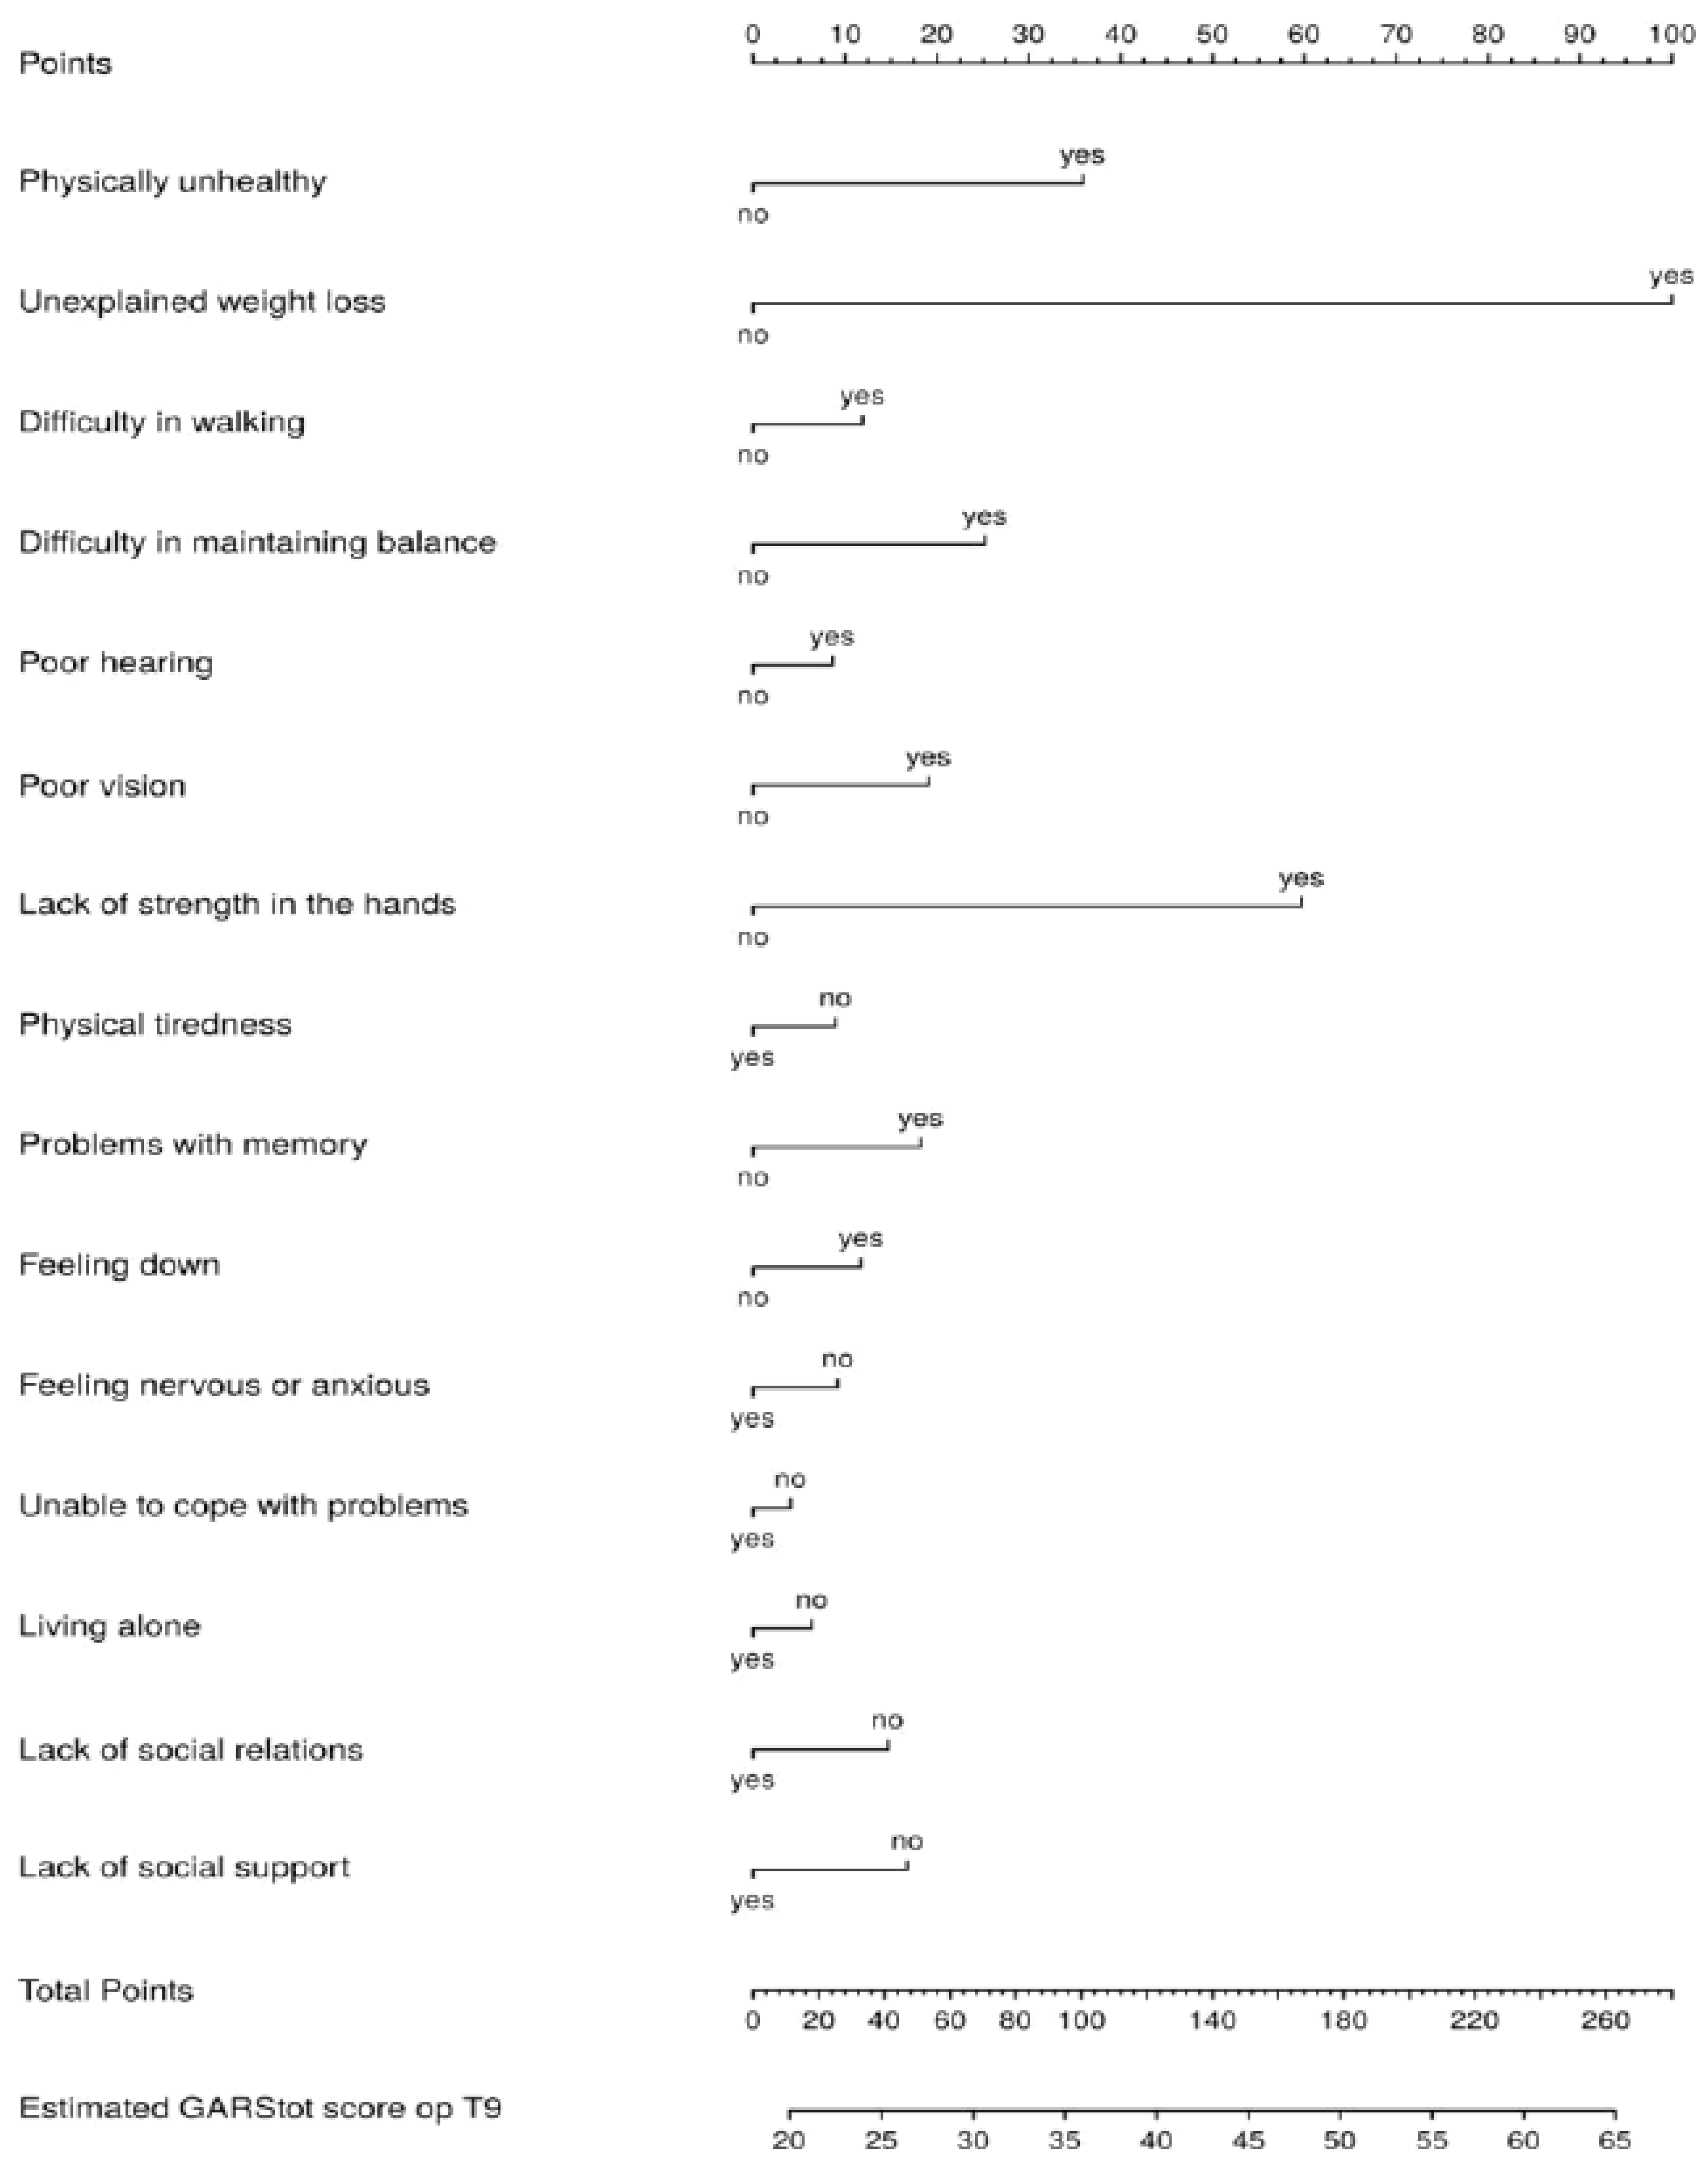
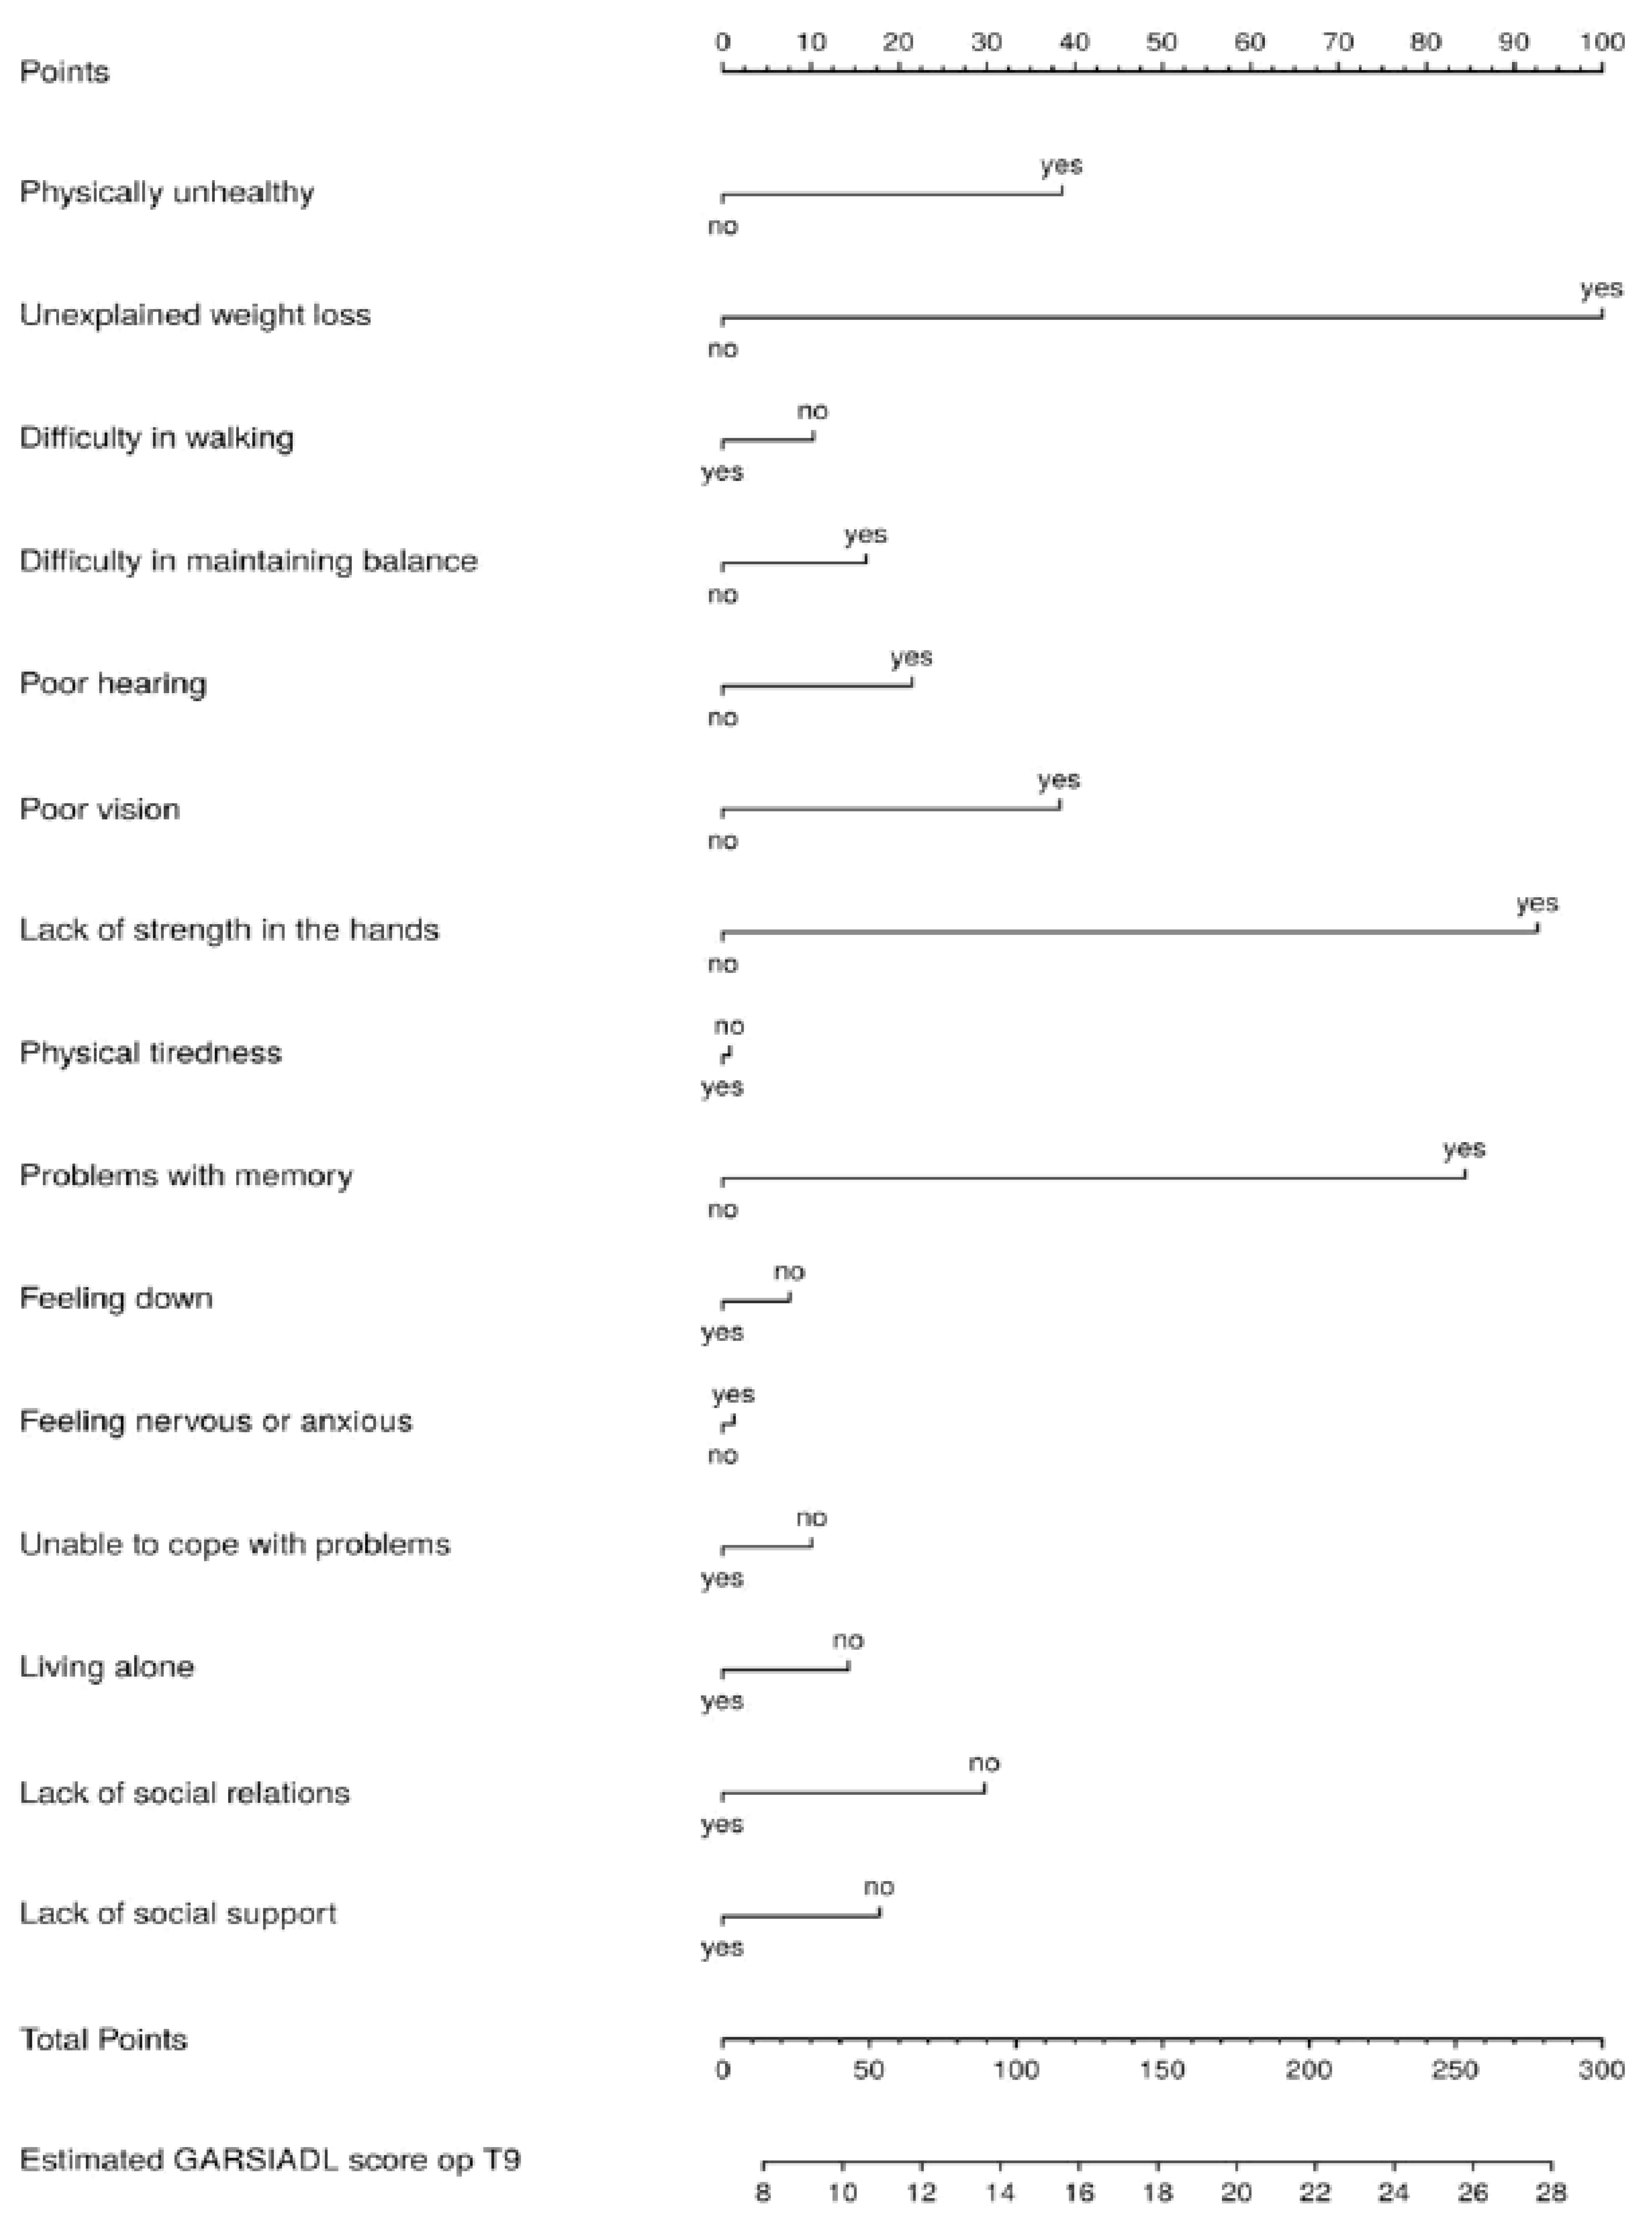
3.2. Prediction of Total Disability
Table 4 shows the points for the items in the nomograms and the performance of the underlying models (Rsq-values) over time in predicting the total disability scores. Table 4 shows stable Rsq-values (0.45, 0.53, and 0.45, respectively). At T0, ‘difficulty in walking’ scored 100 points, whereas ‘difficulty in maintaining balance’ and ‘unexplained weight loss’ scored 100 points at T5 and T9, respectively. In addition, the points belonging to ‘difficulty in walking’ decreased at T5 (84) and T9 (12). The items of social frailty had no points at T9.
Table 4.
Rsq-values and relative importance TFI items for the total disability scores.
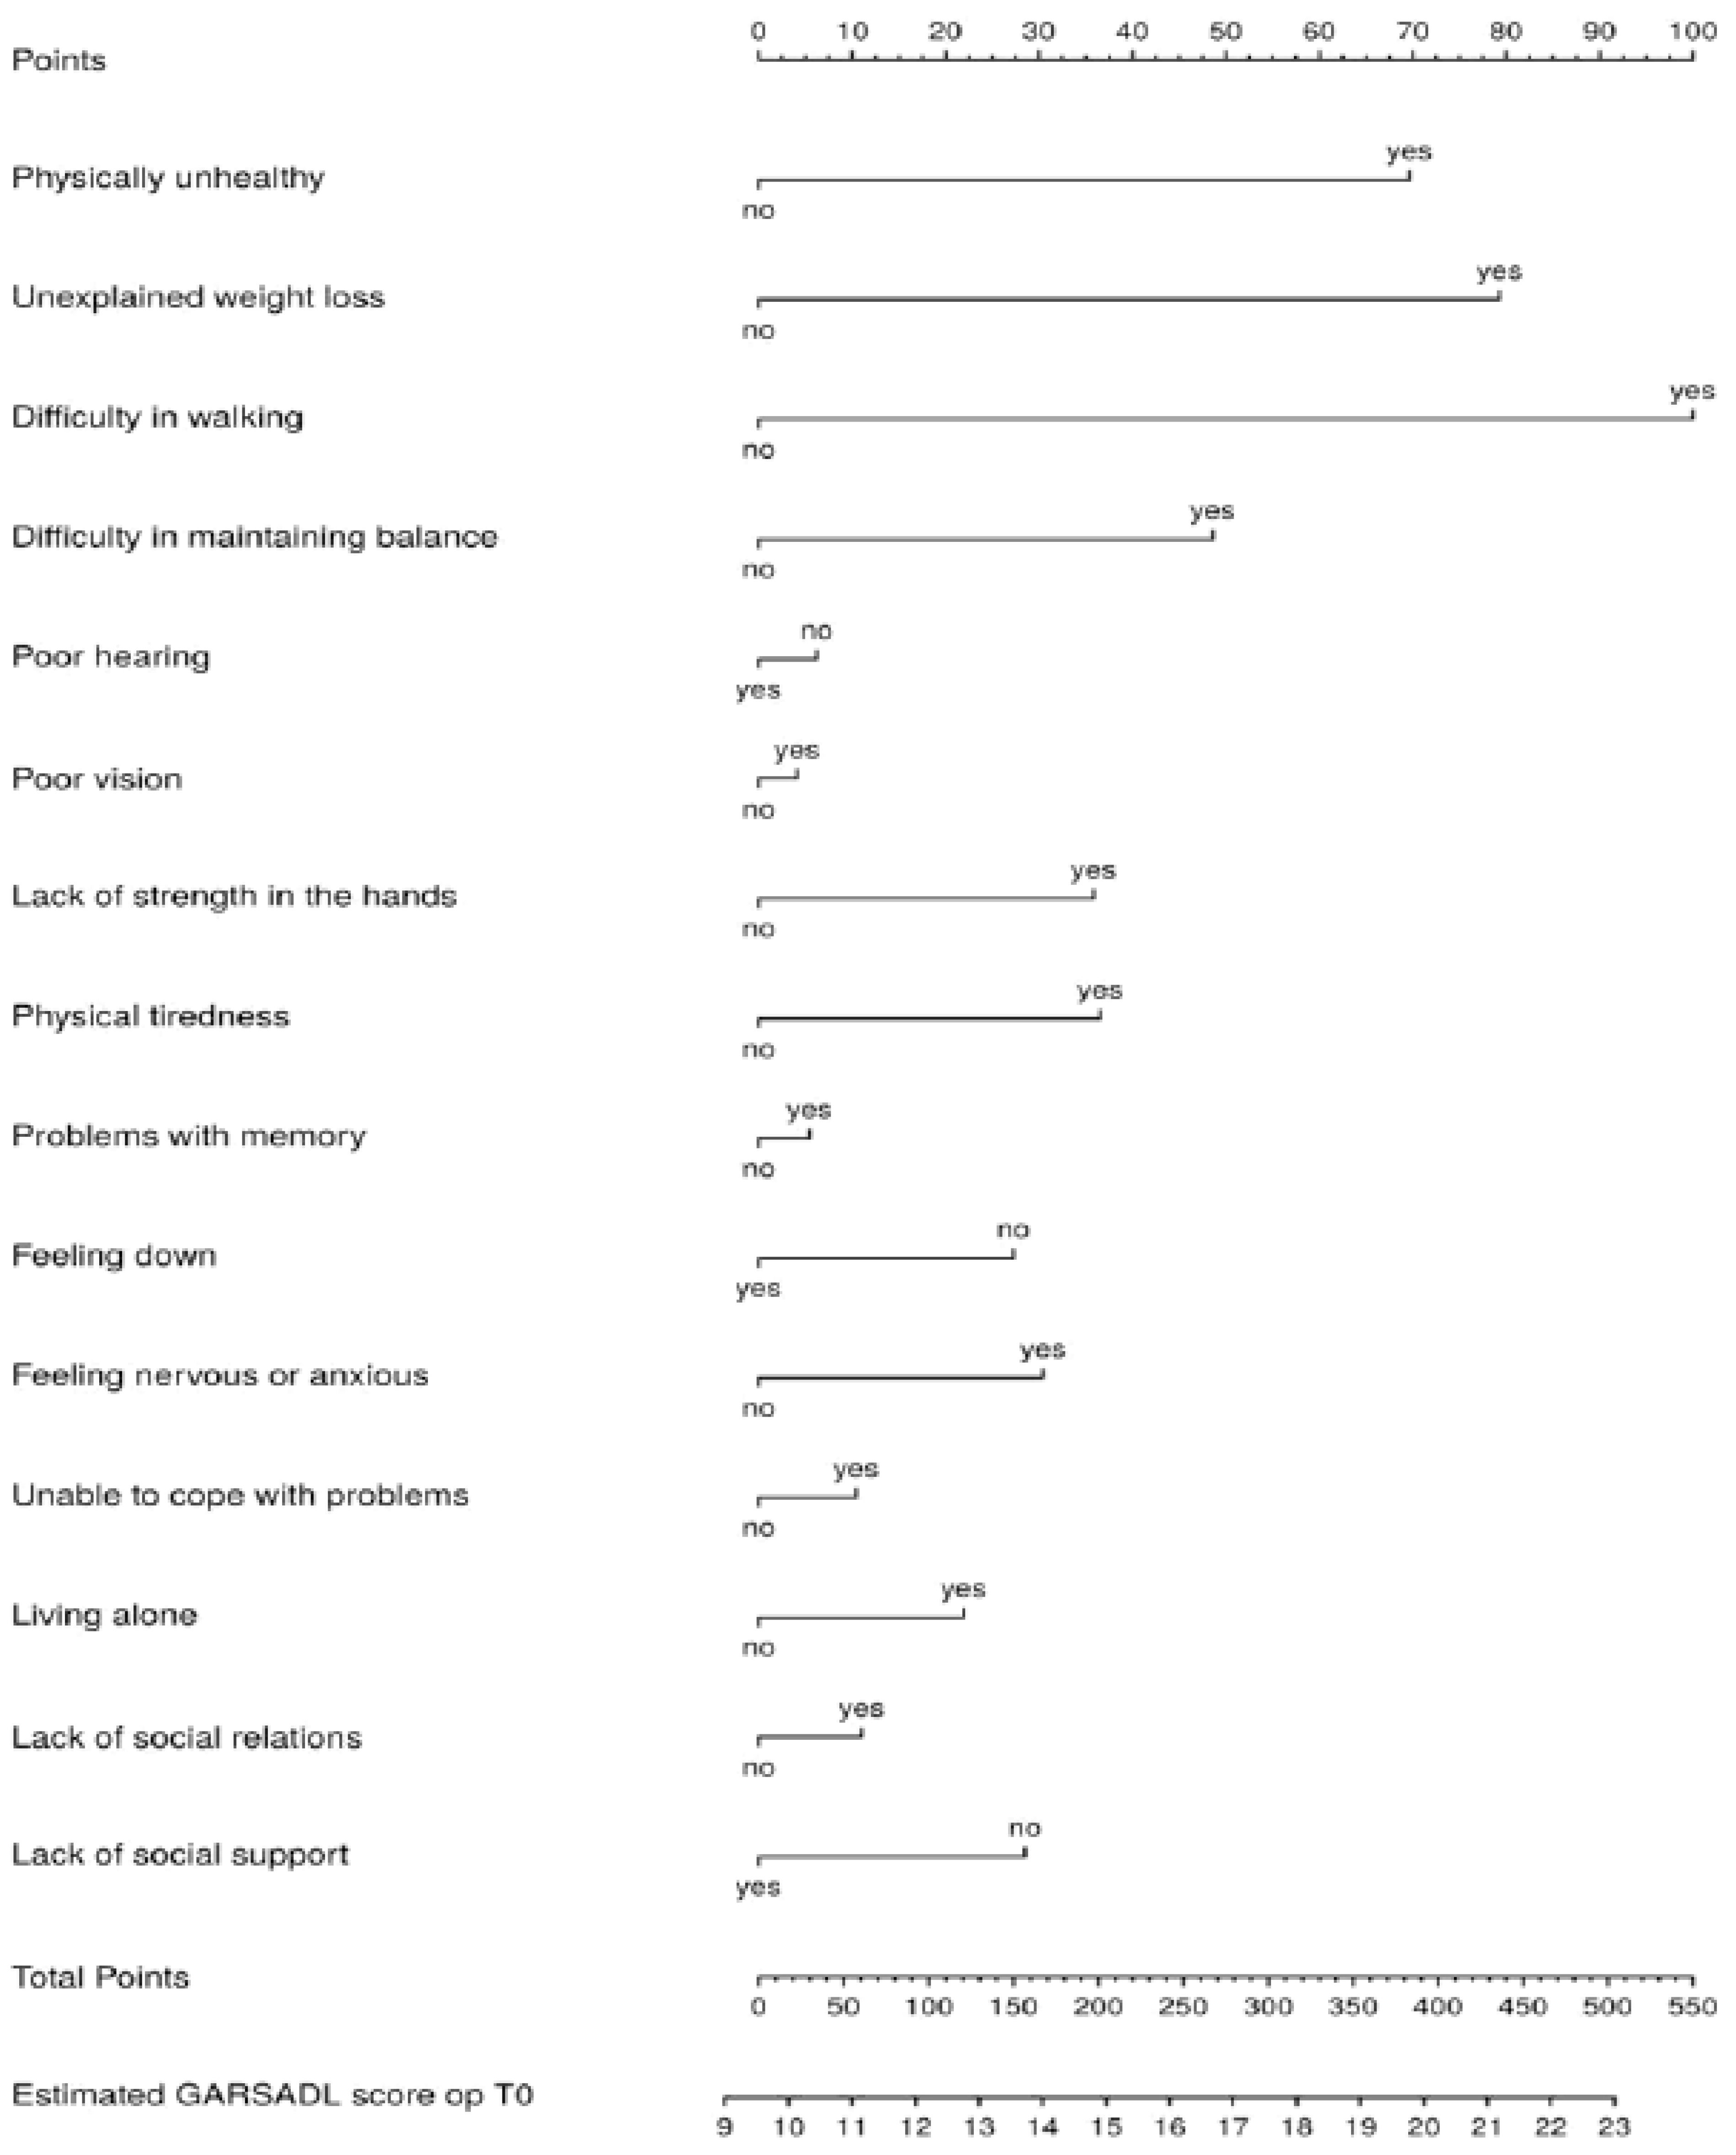
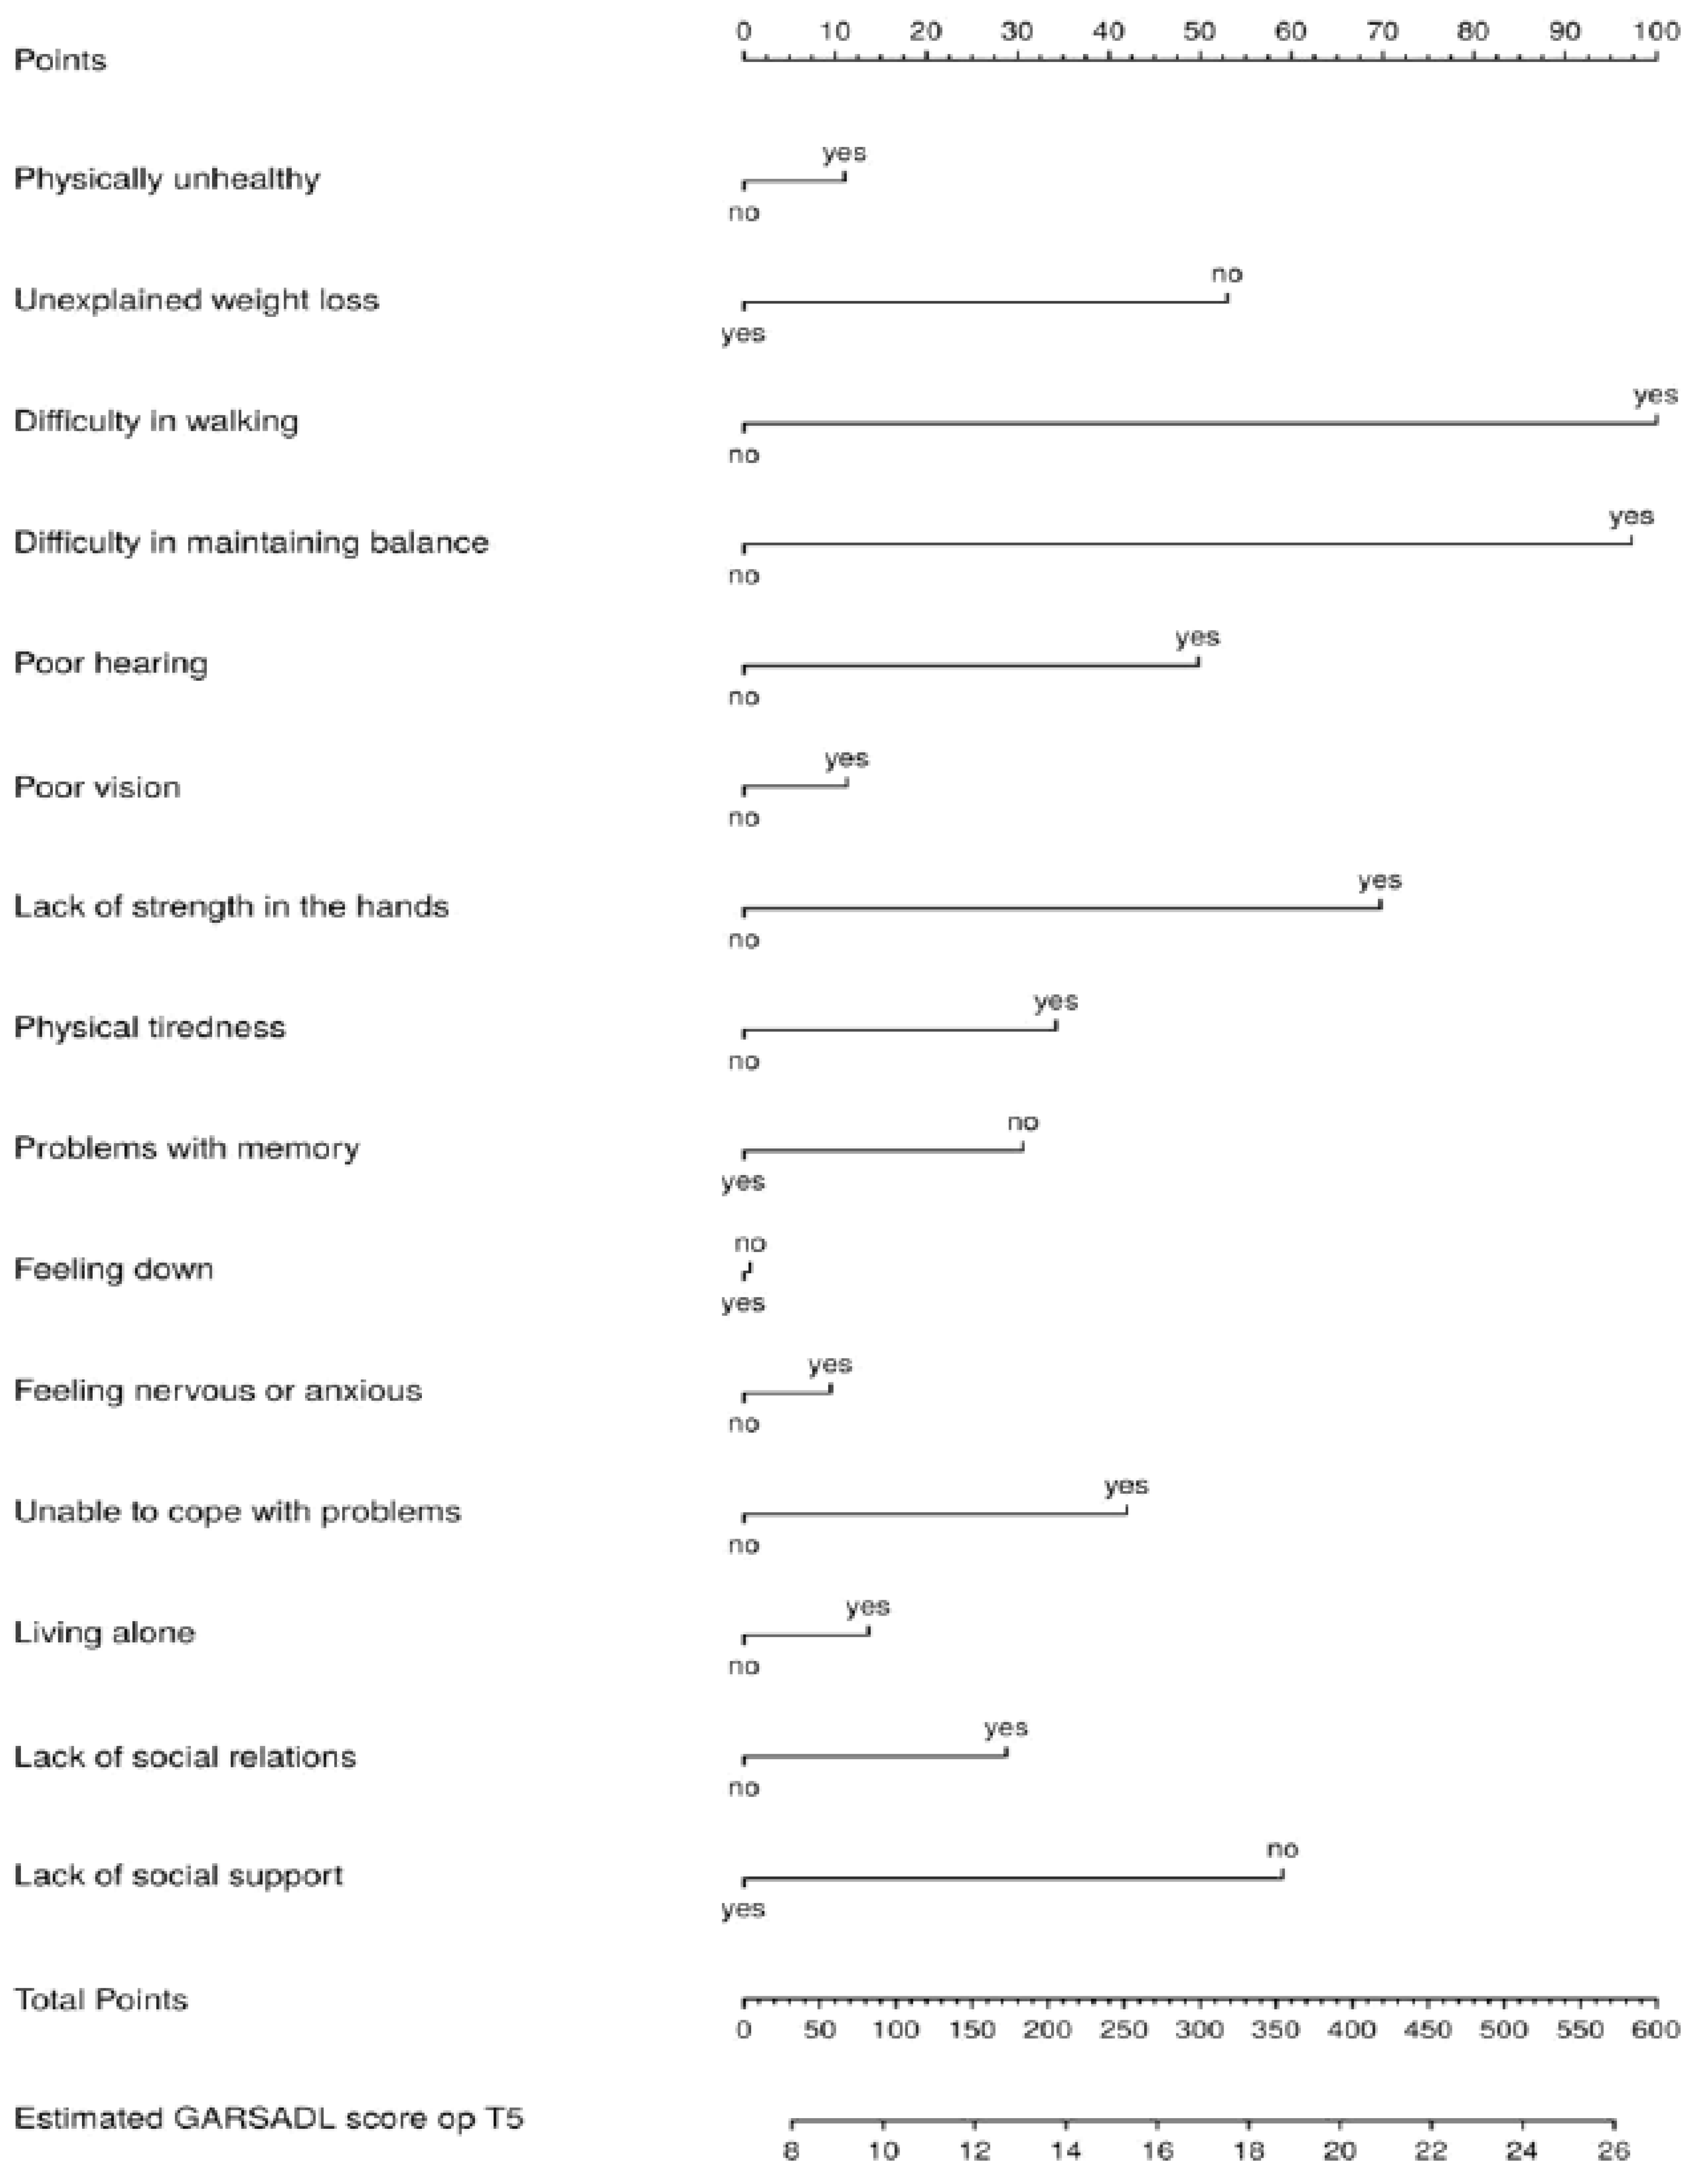
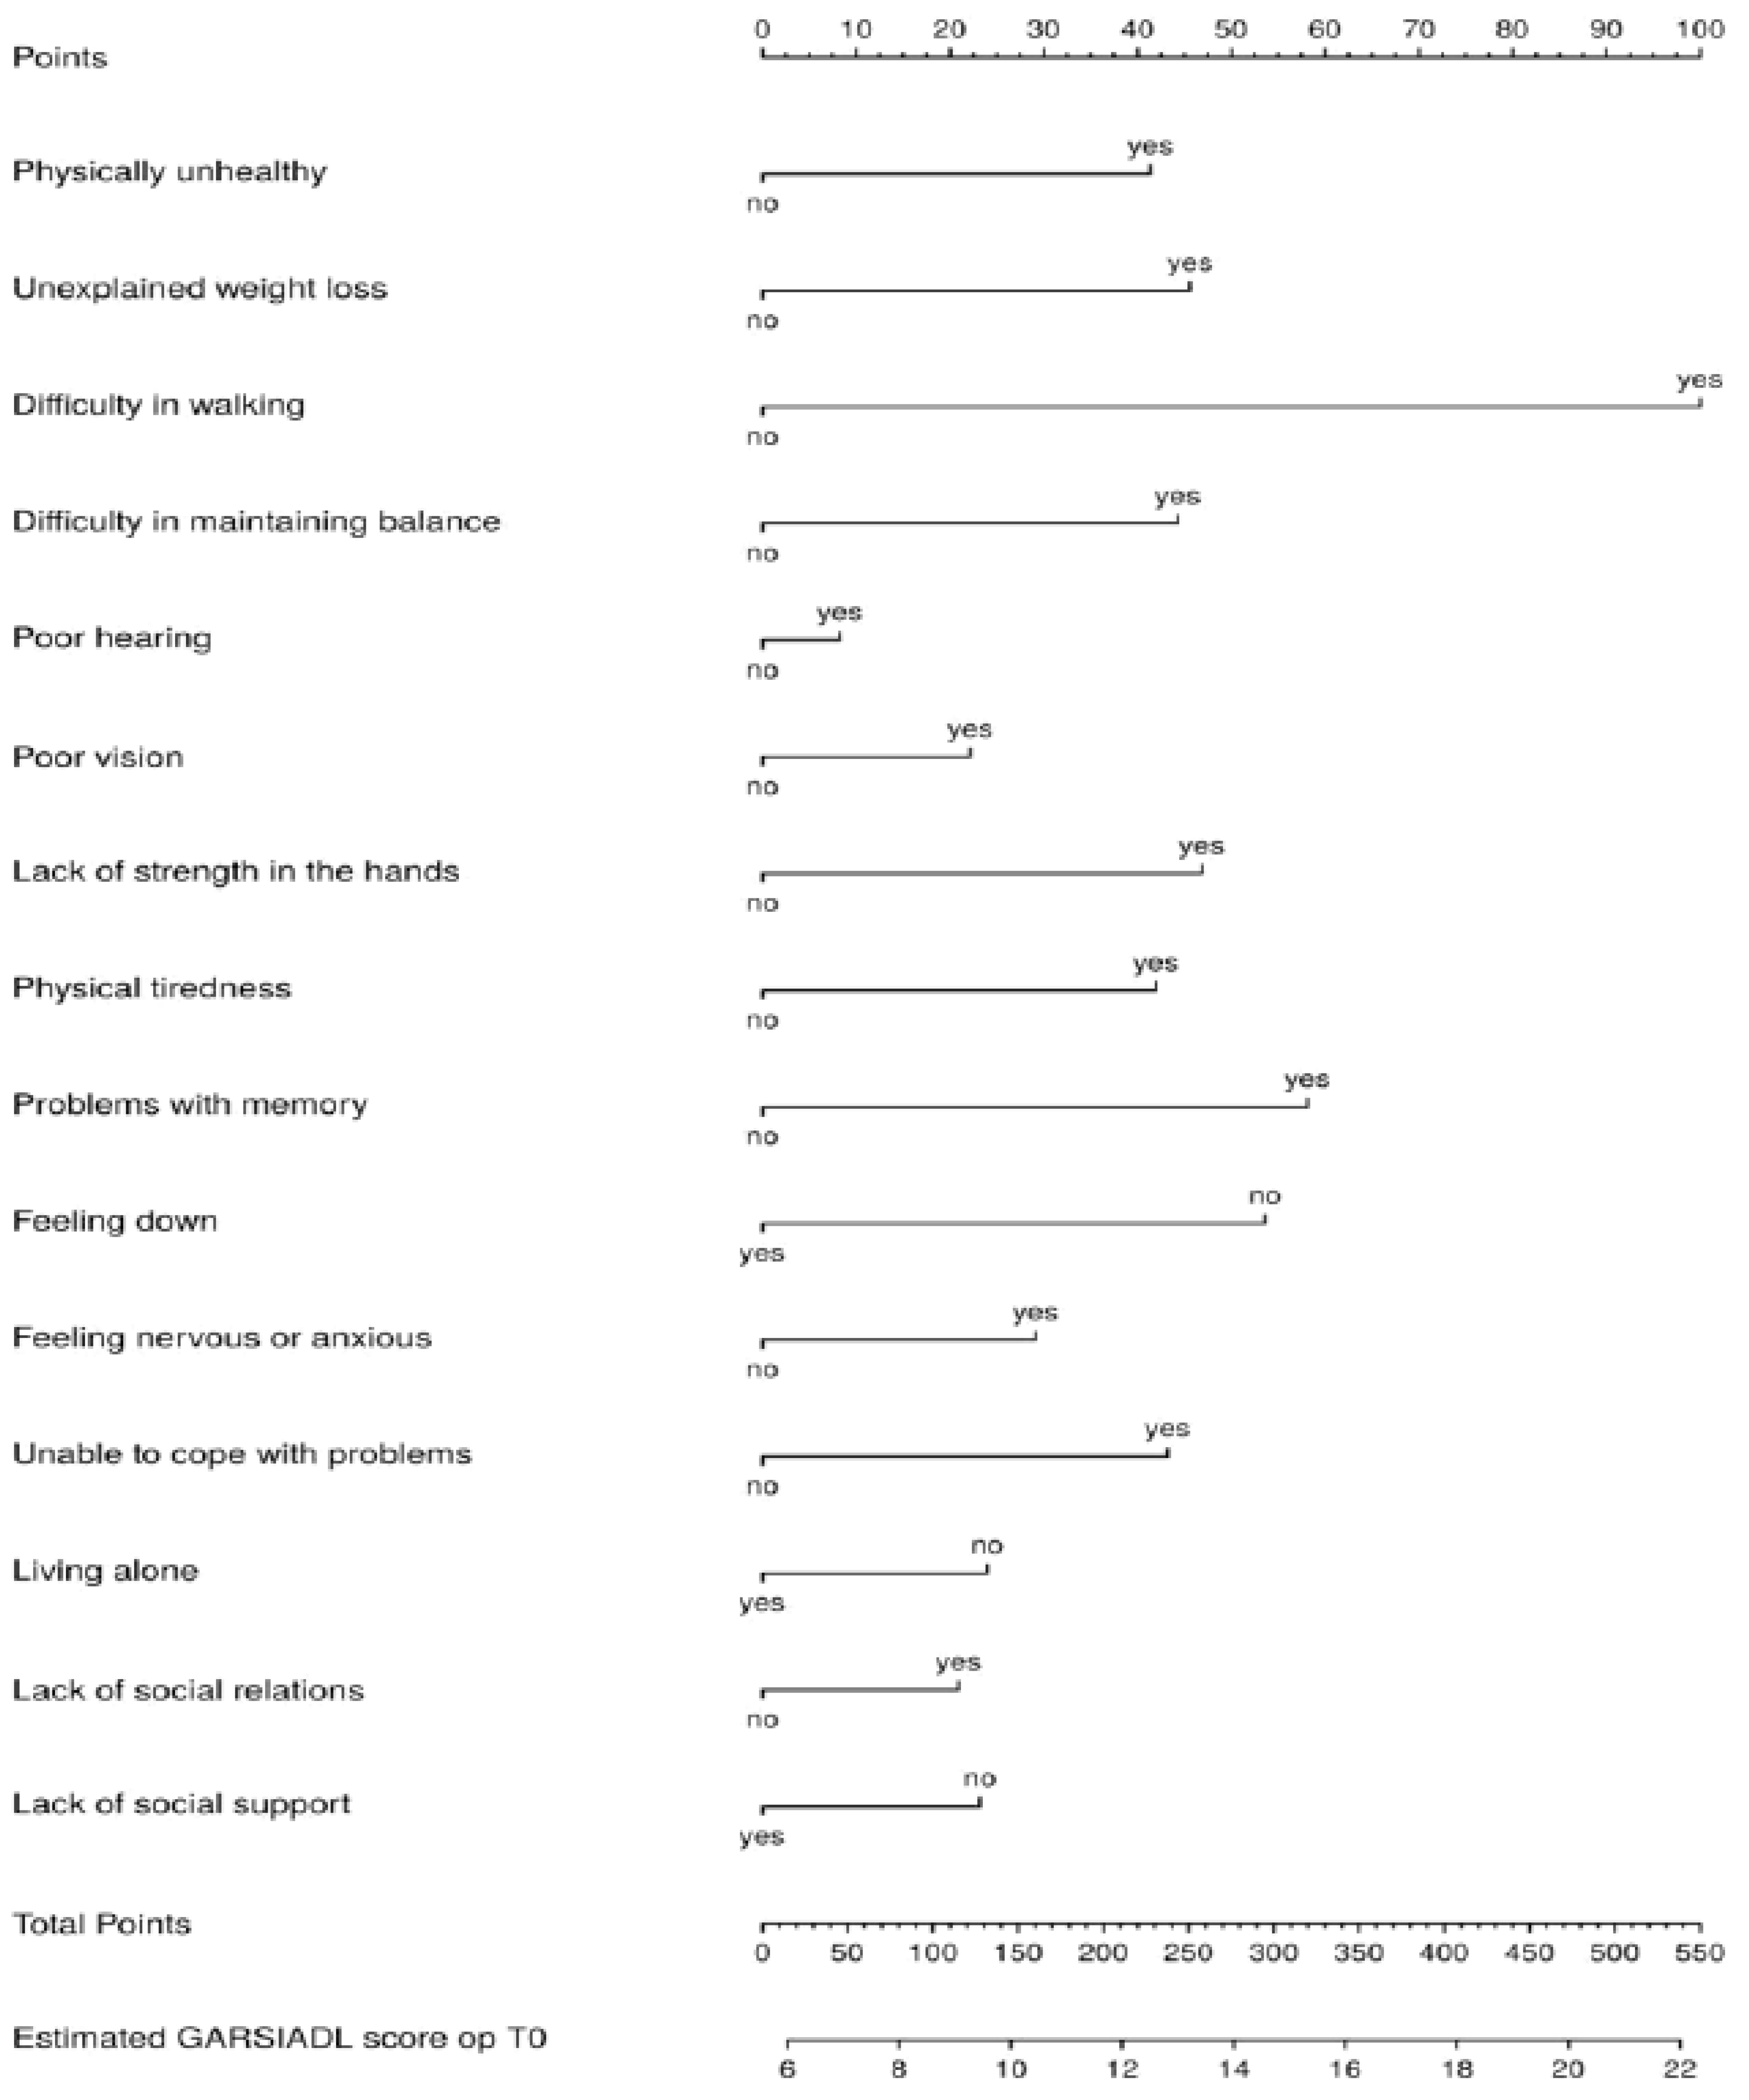
3.3. Prediction of ADL Disability
Table 5 shows the points for the items in the nomograms and the performance of the underlying models (Rsq-values) over time in predicting the ADL disability scores (0.43, 0.52, and 0.41, respectively). At T0 and T5, the score for ‘difficulty in walking’ was 100 points, reducing to 28 points at T9. At T9, ‘unexplained weight loss’ scored 100 points. At T0 and T5, six items referring to psychological and social frailty scored points. However, at T9, only one item (feeling down) belonging to psychological frailty had points (25). We refer to Figure A4, Figure A5 and Figure A6 for the graphical presentation of the nomograms.
Table 5.
Rsq-values and relative importance TFI items for the ADL disability scores.
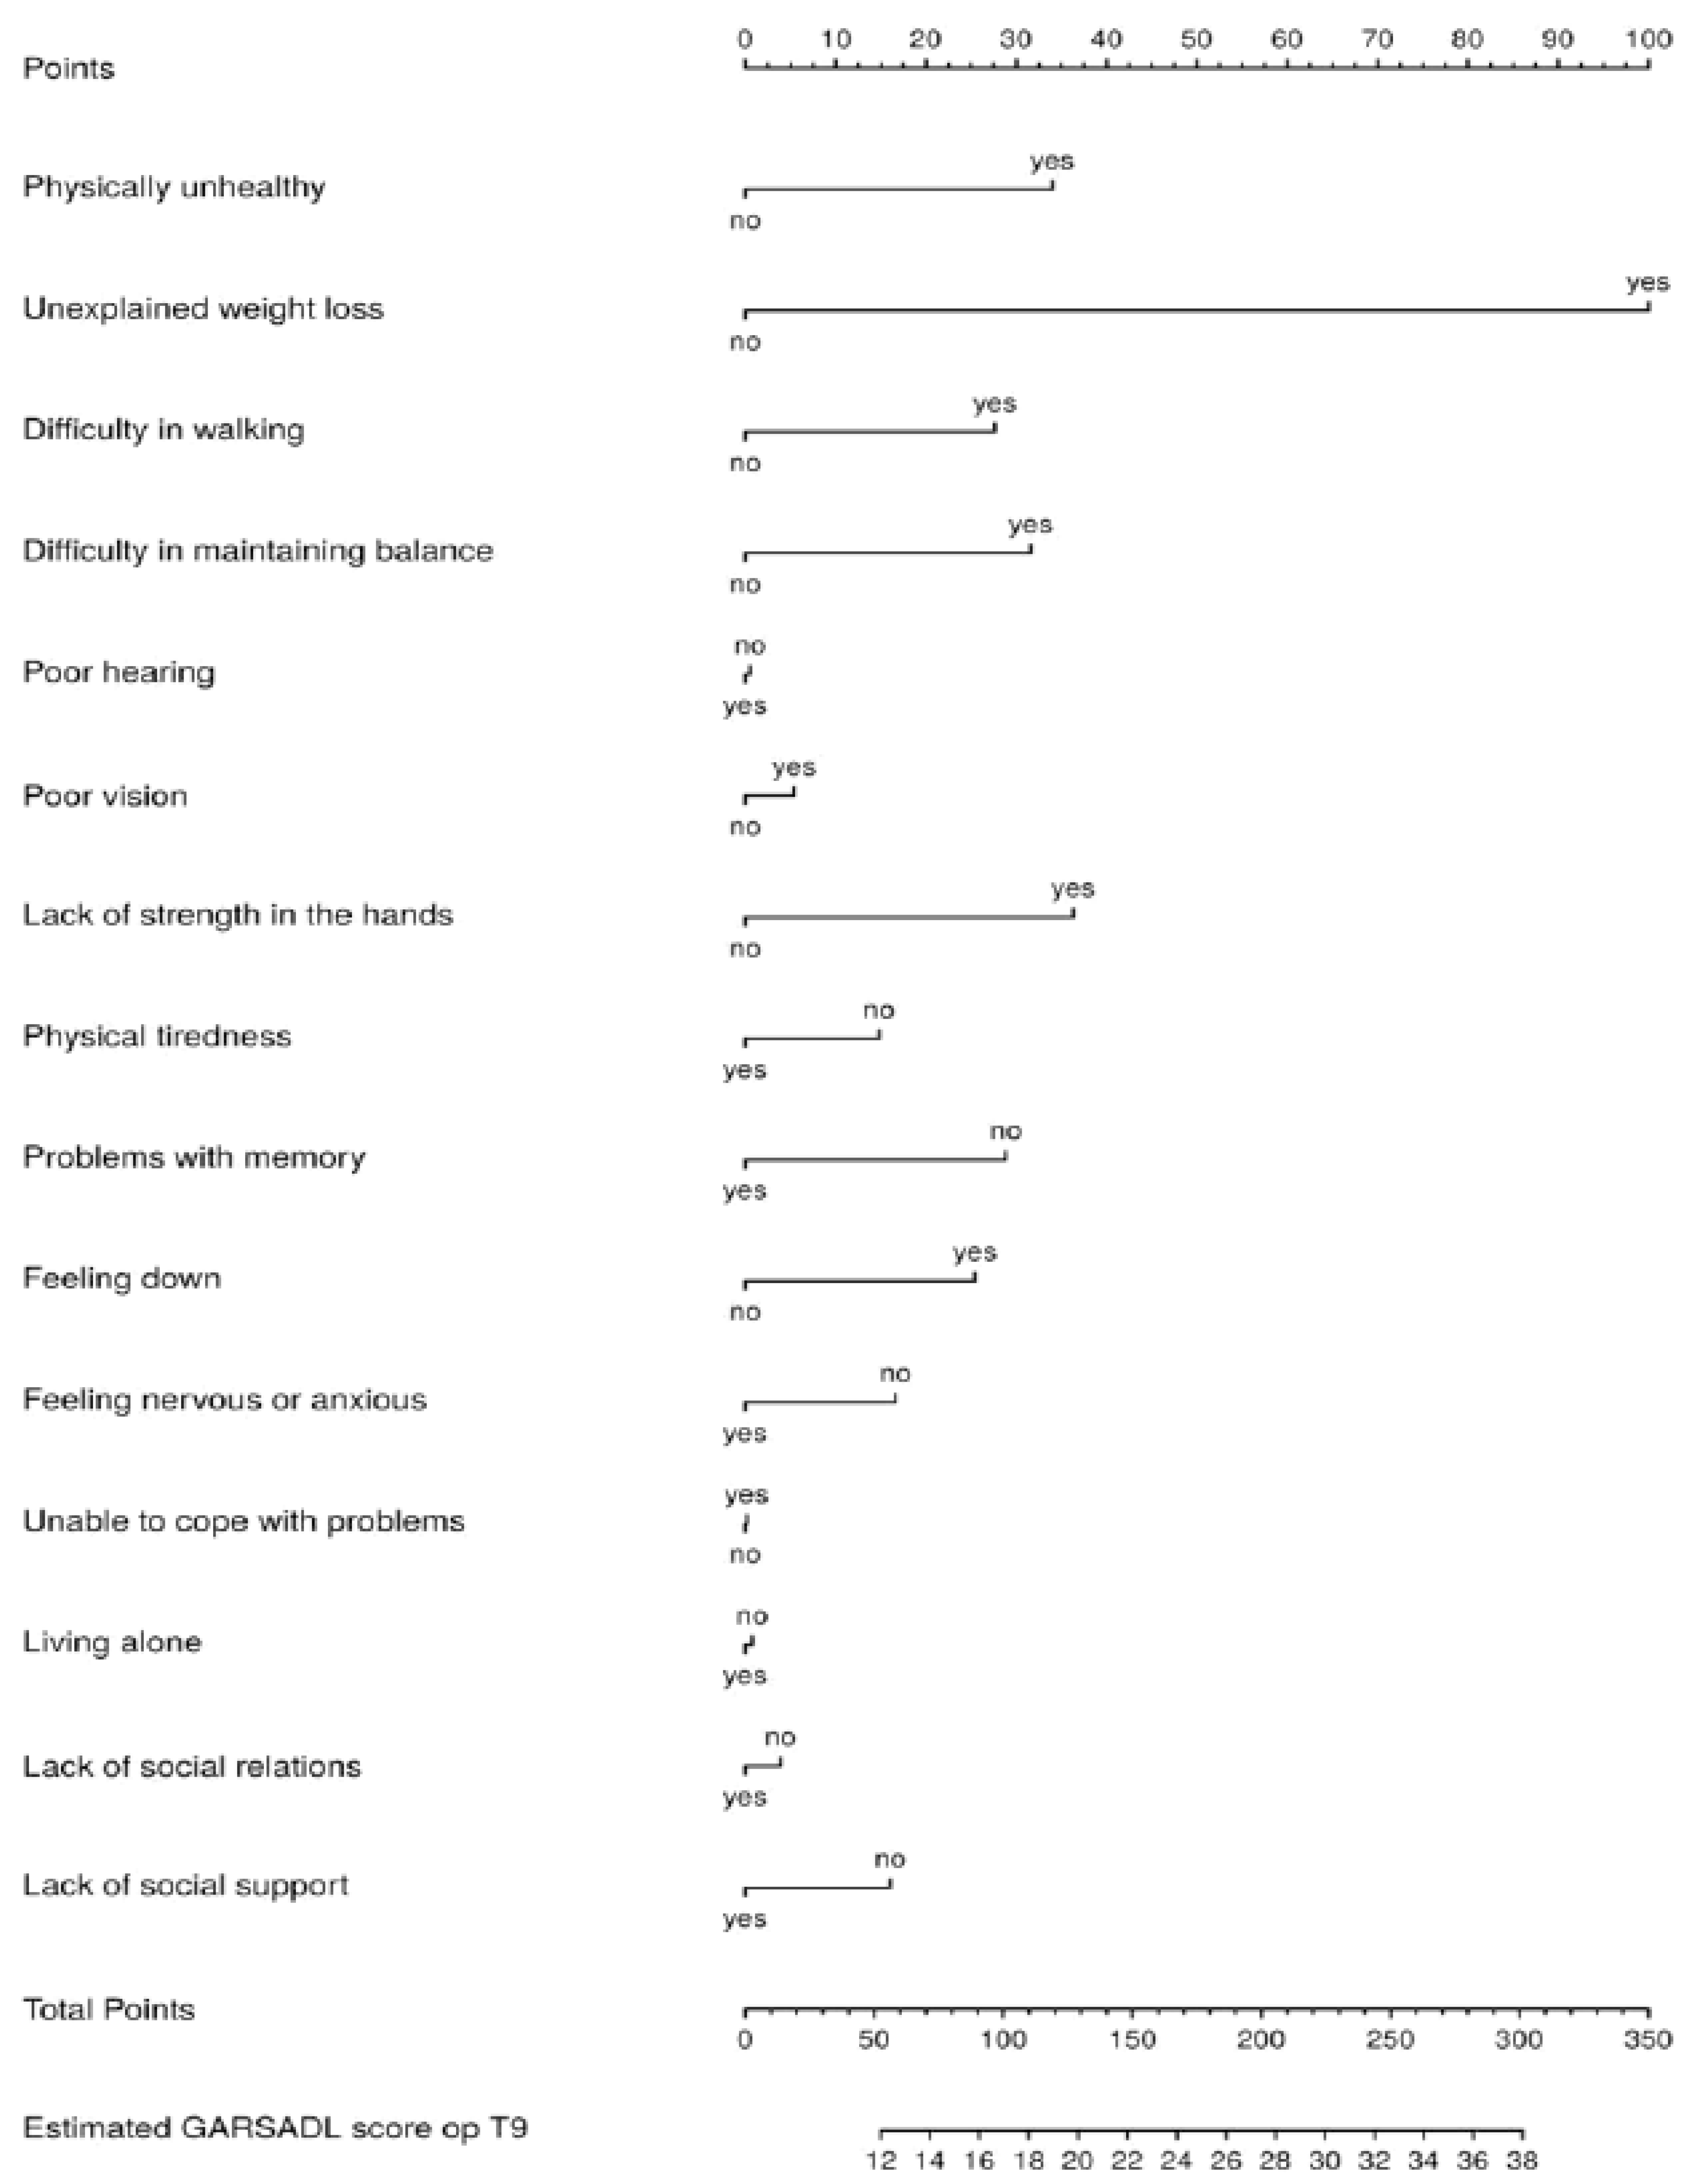
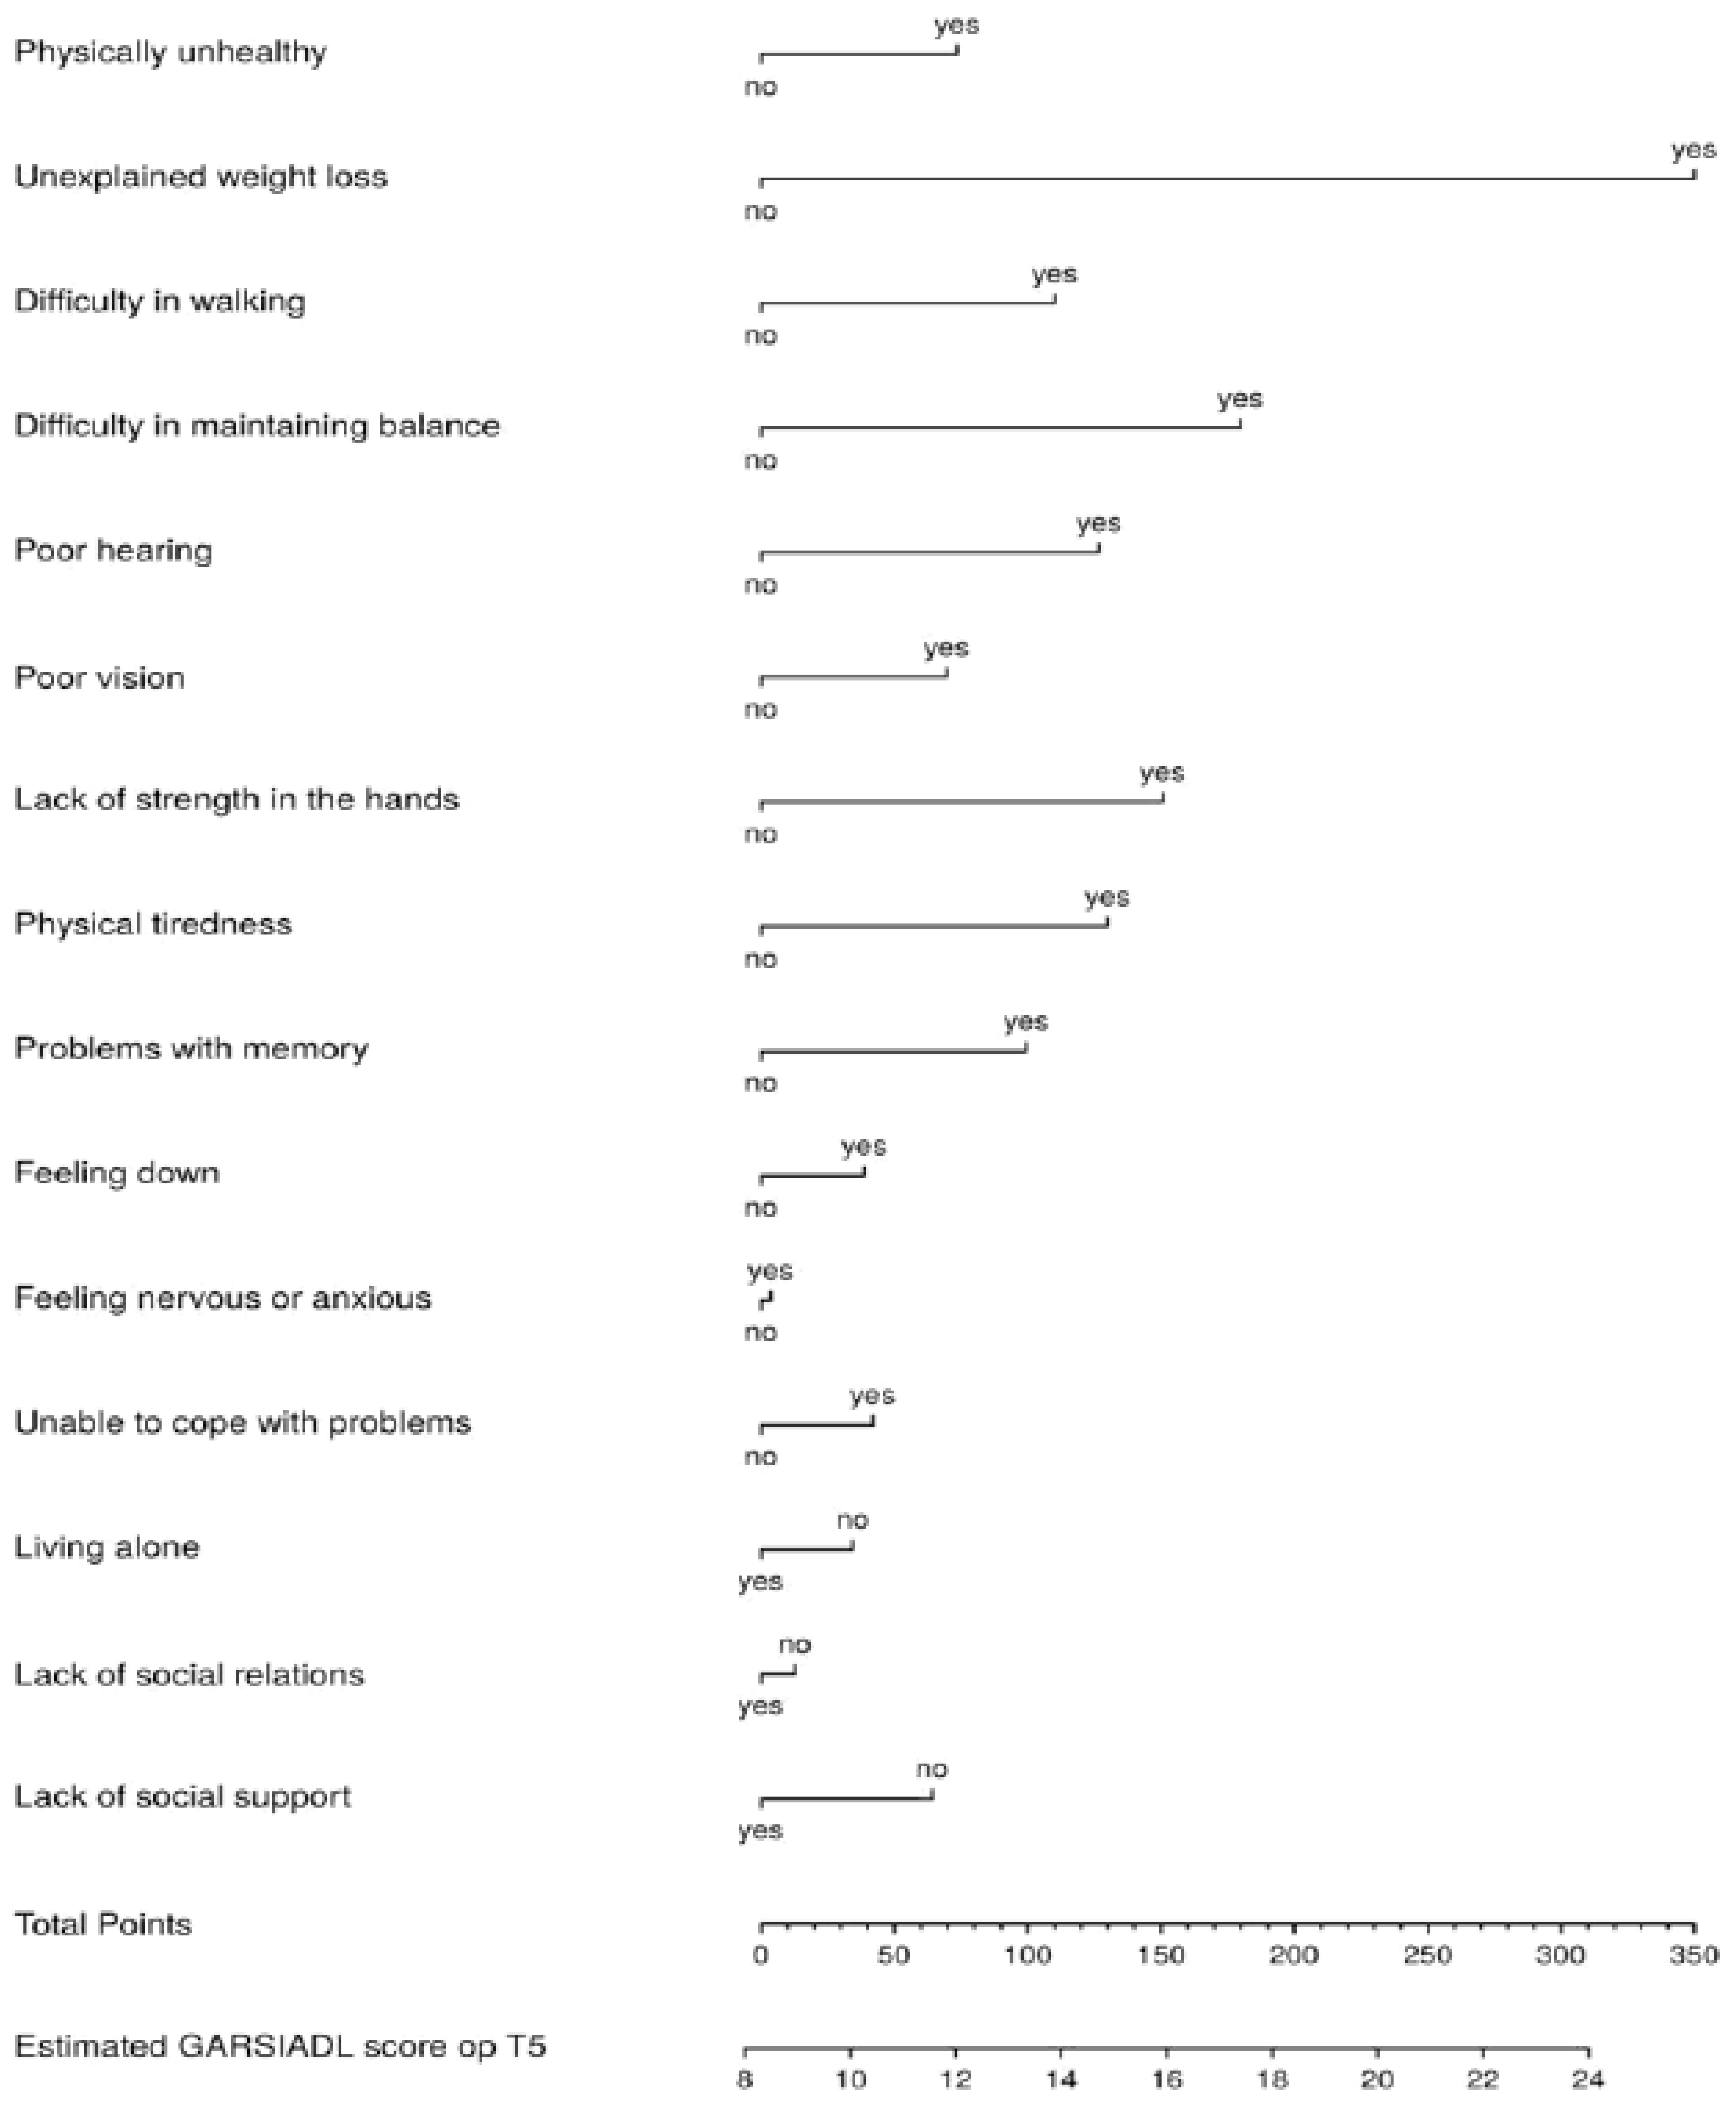
3.4. Prediction of IADL Disability
Table 6 shows the points for the items in the nomograms and the performance of the underlying models (Rsq-values) over time in predicting the IADL disability scores. The Rsq-values were 0.39, 0.44, and 0.44, respectively. At T0, ‘difficulty in walking’ scored 100 points; however, this item received no points at T9. ‘Unexplained weight loss’ scored 100 points at T5 and T9. It is remarkable that ‘lack of strength in the hands’ and ‘problems with memory’ scored much higher at T9 compared with both T0 and T5. Regarding the social frailty items, only ‘lack of social relations’ received points at T0. See Figure A7, Figure A8 and Figure A9 for the graphical presentation of the nomograms.
Table 6.
Rsq-values and relative importance TFI items for the IADL disability scores.
4. Discussion
Disability is associated with increased healthcare utilization [11,12], lower quality of life [10,13], and premature death [14,15,16] among older people. Frailty, which is also common in older people, can be considered a determinant of disability [18,19,20]. Thus, to prevent disability, it is useful to understand the contribution of individual frailty components in predicting disability. This insight is important for healthcare professionals to be able to intervene early so that disability is prevented or at least delayed. In this study, we aimed to develop nomograms with items of the Tilburg Frailty Indicator (TFI) [24] for predicting disability, assessed with the Groningen Activity Restriction Scale (GARS) [27], where we distinguish between total disability, ADL disability, and IADL disability. We used both cross-sectional data and longitudinal data, with a follow-up of five and nine years of a sample of Dutch community-dwelling people aged ≥75 years. Our premise was that the nomograms for predicting disability would differ by outcome variable and by time point. In this section, we will discuss only the main findings.
The nomograms derived from linear regression analyses showed the points that must be given to the 15 frailty components assessed with the TFI. The three monograms belonging to total, ADL, and IADL disability showed that the frailty item ‘difficulty in walking’ is the most important predictor at baseline (T0); ‘difficulty in walking’ scored 100 points for all three disability outcomes. The relative importance of this TFI item was less at T5 (total, IADL) and T9; regarding IADL disability, ‘difficulty in walking’ scored 0 points at T9. A systematic review including 28 studies showed that slow walking speed was one of the most powerful predictors of ADL disability in community-dwelling older people aged 65 years or older [20]. Another systematic review also found an association between walking speed and the probability of disability [32]. A recently developed prediction model demonstrated that age, walking speed, and cognitive function were the strongest predictors of disability-free survival in healthy older people [33]. We only found two studies, both longitudinal, carried out in the Netherlands aimed at predicting disability assessed with the GARS by frailty items [34,35]. The first used the physical subscale of the TFI [35]; this study was conducted in a sample of 429 Dutch people aged ≥ 65 years and showed, based on linear regression analyses, that slowness predicted both total and IADL using a follow-up of two and a half years. The second study aimed to predict ADL and IADL disability using an objective measure of walking speed, the Timed Up and Go (TUG) test, with a follow-up period of one year [34]. After controlling for previous disability and other predictors (background characteristics, body mass index, physical activity, handgrip strength, fatigue, balance), walking speed was predictive for total, ADL, and IADL disability.
Another physical frailty component, ‘unexplained weight loss,’ was the most important predictor for total, ADL, and IADL disability at T9; this item achieved the highest number of points for all three outcome variables (100 points). Unexplained weight loss is common in frail older people, with prevalence figures rising to 27% [36]. Based on this finding, prevention of unexplained weight loss in older people seems to be very important, especially since unexplained weight loss in this target group is associated with increased morbidity as well as increased mortality [37]. Additionally, after controlling for health, functional status, and social network, this frailty item is an important predictor of early institutionalization [36]. According to Alibhai et al. [38], for managing unexplained weight loss, identifying and treating the underlying causes (e.g., malignant disease, psychiatric disorder, gastrointestinal disease) should be the first priority.
Lack of strength in the hands and problems with memory were important predictors for IADL disability, in particular at T9, with 93 and 84 points, respectively. This was not the case with ADL disability; at T9, ‘lack of strength in the hands’ scored 36 points and ‘problems with memory’ scored 0 points. In addition to the two items mentioned earlier (difficulty in walking, unintentional weight loss), ‘lack of strength in the hands’ belongs to the five criteria of the phenotype of frailty by Fried et al. [22]. Our finding is confirmed by an umbrella review of systematic reviews using meta-analyses of observational studies [39]. In this review, handgrip strength was not only considered a useful indicator for disability but also for general health status and mortality. It should be noted, however, that the operational definition of disability was different from our definition, IADL disability assessed with the GARS. With regard to the frailty item ‘problems with memory’, referring to cognitive impairment, many previous studies showed that cognition predicts disability, e.g., Shimada et al. [40] and St John et al. [41]. In a community-dwelling baseline sample of 1715 people aged ≥65 years, cognition determined with the mini-mental state examination (MMSE) predicted disability 5 years later [41]. In addition, in a Japanese sample consisting of 4290 community-dwelling older people aged 65 years or older, cognitive impairment showed a significant association with disability [40].
The TFI assesses physical, psychological, and social frailty. The findings of the present study showed that the eight items belonging to physical frailty predicted total, ADL and IADL disability to a greater extent, in particular, difficulty in walking and unintentional weight loss, or, to a lesser extent, especially poor hearing, poor vision, and physical tiredness. The items referring to psychological and social frailty received far fewer points. The social frailty item ‘lack of social support’ was the only frailty item that scored zero points. For predicting disability, psychological and social frailty are obviously less important than physical frailty. It is assumed that in other adverse outcomes of frailty (e.g., increased healthcare utilization, lower quality of life), the nomograms will strongly differ, and more points will be given to psychological and social frailty items. If we consider the prediction of ADL and IADL disability using the TFI, then we can observe that the Rsq-values were nearly the same; the main difference in Rsq-values existed between ADL and IADL at T5 (0.52 versus 0.44). In addition, for both T0 and T5, there were more predictors of disability than for T9. At T9, there were only nine, seven, and eight predictors for total, ADL, and IADL disability, respectively. This finding is not so surprising; after all, making a long-term prediction is trickier than making a short-term prediction.
Our study has several limitations. Firstly, the generalisability of the findings may be questioned because the response rate at baseline was only 42%. Secondly, for the prediction of total, ADL, and IADL disability, we only used frailty items and did not control for background characteristics of the participants, e.g., individual diseases or multimorbidity and age. However, in a previous Dutch study using the TFI and GARS, it was observed after sequential linear regression analyses that only previous disability and age significantly contributed to the prediction of disability; multimorbidity and other background characteristics (e.g., sex, education, income) did not [35]. Third, the sample size can be considered small at T9. Because of the high age at baseline (mean 80.3 years; SD 3.8), many older people were unable to participate in the follow-up of this study, especially for the measurement of disability at T9. In a previous study using the same sample, it was observed that 162 died between 2008 and 2015 [42]. Finally, we would like to indicate that discussion of our findings in light of findings from previous studies has its limitations because both frailty and disability were usually measured with instruments other than the TFI and the GARS, such as the phenotype of frailty [22], the FI [23] for assessing frailty, and the Katz Scale [43] and the Lawton and Brody Scale [44] for assessing ADL and IADL disability, respectively.
5. Conclusions
In the present study, we developed nomograms for the prediction of total, ADL, and IADL disability based on physical, psychological, and social items of the Tilburg Frailty Indicator (TFI). We showed that the frailty items scored different points, especially over time. In other words, not every item was equally important in predicting disability. In particular, the frailty items ‘difficulty in walking’ and ‘unexplained weight loss’ were important predictors of disability. Healthcare professionals need to focus on these two items in order to prevent disability and to prevent the worsening of disability. Additionally, we can conclude that the points given to frailty items differed between total, ADL, and IADL disability and also differed with regard to years of follow-up. Creating one monogram that does justice to this seems impossible.
Author Contributions
Conceptualisation, R.J.G.; methodology, R.J.G. and T.v.d.P.; formal analysis, T.v.d.P.; data curation, T.v.d.P.; writing original draft, R.J.G. and T.v.d.P.; writing, review and editing, R.J.G., L.M.S., I.U., and T.v.d.P.; visualization, T.v.d.P. All authors have read and agreed to the published version of the manuscript.
Funding
This research received no external funding.
Institutional Review Board Statement
Ethical review and approval were waived for this study in line with medical–ethical procedures in the Netherlands.
Informed Consent Statement
Informed consent related to detailing the study and maintaining confidentiality was observed.
Data Availability Statement
The data presented in this study are available on request from the corresponding author.
Acknowledgments
We would like to thank all the study participants for their contribution to this study.
Conflicts of Interest
All authors declare no financial conflict of interest.
Appendix A
Figure A1.
Nomogram total disability score at T0.
Figure A2.
Nomogram total disability score at T5.
Figure A3.
Nomogram total disability score at T9.
Figure A4.
Nomogram ADL disability score at T0.
Figure A5.
Nomogram ADL disability score at T5.
Figure A6.
Nomogram ADL disability score at T9.
Figure A7.
Nomogram IADL disability score at T0.
Figure A8.
Nomogram IADL disability score at T5.
Figure A9.
Nomogram IADL disability score at T9.
References
- Kraus, L.; Lauer, E.; Coleman, R.; Houtenville, A. 2017 Disability Statistics Annual Report; University of New Hampshire: Durham, NH, USA, 2018. [Google Scholar]
- World Health Organization. International Classification of Functioning, Disability and Health (ICF); World Health Organization: Geneva, Switzerland, 2001. [Google Scholar]
- Tas, U.; Verhagen, A.P.; Bierma-Zeinstra, S.M.; Hofman, A.; Odding, E.; Pols, H.A.; Koes, B.W. Incidence and risk factors of disability in the elderly: The Rotterdam Study. Prev. Med. 2007, 44, 272–278. [Google Scholar] [CrossRef]
- Tas, U.; Verhagen, A.P.; Bierma-Zeinstra, S.M.; Odding, E.; Koes, B.W. Prognostic factors of disability in older people: A systematic review. Br. J. Gen. Pract. 2007, 57, 319–323. [Google Scholar] [PubMed]
- Kempen, G.I.; Miedema, I.; Ormel, J.; Molenaar, W. The assessment of disability with the Groningen Activity Restriction Scale. Conceptual framework and psychometric properties. Soc. Sci. Med. 1996, 43, 1601–1610. [Google Scholar] [CrossRef] [PubMed]
- Suurmeijer, T.P.; Doeglas, D.M.; Moum, T.; Briançon, S.; Krol, B.; Sanderman, R.; Guillemin, F.; Bjelle, A.; van den Heuvel, W.J. The Groningen Activity Restriction Scale for measuring disability: Its utility in international comparisons. Am. J. Public Health 1994, 84, 1270–1273. [Google Scholar] [CrossRef]
- Hardy, S.E.; Dubin, J.A.; Holford, T.R.; Gill, T.M. Transitions between states of disability and independence among older persons. Am. J. Epidemiol. 2005, 161, 575–584. [Google Scholar] [CrossRef] [PubMed]
- Wong, C.H.; Weiss, D.; Sourial, N.; Karunananthan, S.; Quail, J.M.; Wolfson, C.; Bergman, H. Frailty and its association with disability and comorbidity in a community-dwelling sample of seniors in Montreal: A cross-sectional study. Aging Clin. Exp. Res. 2010, 22, 54–62. [Google Scholar] [CrossRef]
- Ćwirlej-Sozańska, A.; Wiśniowska-Szurlej, A.; Wilmowska-Pietruszyńska, A.; Sozański, B. Determinants of ADL and IADL disability in older adults in southeastern Poland. BMC Geriatr. 2019, 19, 297. [Google Scholar] [CrossRef]
- Gobbens, R.J. Associations of ADL and IADL disability with physical and mental dimensions of quality of life in people aged 75 years and older. PeerJ 2018, 6, e5425. [Google Scholar] [CrossRef] [PubMed]
- Cheung, J.T.K.; Yu, R.; Wu, Z.; Wong, S.Y.S.; Woo, J. Geriatric syndromes, multimorbidity, and disability overlap and increase healthcare use among older Chinese. BMC Geriatr. 2018, 18, 147. [Google Scholar] [CrossRef]
- Fried, L.P.; Ferrucci, L.; Darer, J.; Williamson, J.D.; Anderson, G. Untangling the concepts of disability, frailty, and comorbidity: Implications for improved targeting and care. J. Gerontol. A Biol. Sci. Med. Sci. 2004, 59, 255–263. [Google Scholar] [CrossRef]
- Akosile, C.O.; Mgbeojedo, U.G.; Maruf, F.A.; Okoye, E.C.; Umeonwuka, I.C.; Ogunniyi, A. Depression, functional disability and quality of life among Nigerian older adults: Prevalences and relationships. Arch. Gerontol. Geriatr. 2018, 74, 39–43. [Google Scholar] [CrossRef] [PubMed]
- Gobbens, R.J.J.; van der Ploeg, T. The Prediction of Mortality by Disability Among Dutch Community-Dwelling Older People. Clin. Interv. Aging 2020, 15, 1897–1906. [Google Scholar] [CrossRef] [PubMed]
- Hennessy, S.; Kurichi, J.E.; Pan, Q.; Streim, J.E.; Bogner, H.R.; Xie, D.; Stineman, M.G. Disability Stage is an Independent Risk Factor for Mortality in Medicare Beneficiaries Aged 65 Years and Older. PM&R J. Inj. Funct. Rehabil. 2015, 7, 1215–1225. [Google Scholar] [CrossRef]
- Nascimento, C.M.; Oliveira, C.; Firmo, J.O.A.; Lima-Costa, M.F.; Peixoto, S.V. Prognostic value of disability on mortality: 15-year follow-up of the Bambui cohort study of aging. Arch. Gerontol. Geriatr. 2018, 74, 112–117. [Google Scholar] [CrossRef]
- Picavet, H.S.; Hoeymans, N. Physical disability in The Netherlands: Prevalence, risk groups and time trends. Public Health 2002, 116, 231–237. [Google Scholar] [CrossRef]
- Chang, S.F.; Cheng, C.L.; Lin, H.C. Frail Phenotype and Disability Prediction in Community-Dwelling Older People: A Systematic Review and Meta-Analysis of Prospective Cohort Studies. J. Nurs. Res. 2019, 27, e28. [Google Scholar] [CrossRef]
- Kojima, G. Frailty as a predictor of disabilities among community-dwelling older people: A systematic review and meta-analysis. Disabil. Rehabil. 2017, 39, 1897–1908. [Google Scholar] [CrossRef]
- Vermeulen, J.; Neyens, J.C.; van Rossum, E.; Spreeuwenberg, M.D.; de Witte, L.P. Predicting ADL disability in community-dwelling elderly people using physical frailty indicators: A systematic review. BMC Geriatr. 2011, 11, 33. [Google Scholar] [CrossRef]
- Gobbens, R.J.; Luijkx, K.G.; Wijnen-Sponselee, M.T.; Schols, J.M. Toward a conceptual definition of frail community dwelling older people. Nurs. Outlook 2010, 58, 76–86. [Google Scholar] [CrossRef]
- Fried, L.P.; Tangen, C.M.; Walston, J.; Newman, A.B.; Hirsch, C.; Gottdiener, J.; Seeman, T.; Tracy, R.; Kop, W.J.; Burke, G.; et al. Frailty in older adults: Evidence for a phenotype. J Gerontol. A Biol. Sci. Med. Sci. 2001, 56, M146–M156. [Google Scholar] [CrossRef]
- Mitnitski, A.B.; Mogilner, A.J.; Rockwood, K. Accumulation of deficits as a proxy measure of aging. Sci. World J. 2001, 1, 323–336. [Google Scholar] [CrossRef]
- Gobbens, R.J.; van Assen, M.A.; Luijkx, K.G.; Wijnen-Sponselee, M.T.; Schols, J.M. The Tilburg Frailty Indicator: Psychometric properties. J. Am. Med. Dir. Assoc. 2010, 11, 344–355. [Google Scholar] [CrossRef]
- von Elm, E.; Altman, D.G.; Egger, M.; Pocock, S.J.; Gøtzsche, P.C.; Vandenbroucke, J.P. The Strengthening the Reporting of Observational Studies in Epidemiology (STROBE) statement: Guidelines for reporting observational studies. Lancet 2007, 370, 1453–1457. [Google Scholar] [CrossRef]
- Gobbens, R.J.; van Assen, M.A.; Luijkx, K.G.; Schols, J.M. The predictive validity of the Tilburg Frailty Indicator: Disability, health care utilization, and quality of life in a population at risk. Gerontologist 2012, 52, 619–631. [Google Scholar] [CrossRef] [PubMed]
- Kempen, G.I.; Suurmeijer, T.P. The development of a hierarchical polychotomous ADL-IADL scale for noninstitutionalized elders. Gerontologist 1990, 30, 497–502. [Google Scholar] [CrossRef] [PubMed]
- Ormel, J.; Rijsdijk, F.V.; Sullivan, M.; van Sonderen, E.; Kempen, G.I. Temporal and reciprocal relationship between IADL/ADL disability and depressive symptoms in late life. J. Gerontol. B Psychol. Sci. Soc. Sci. 2002, 57, P338–P347. [Google Scholar] [CrossRef] [PubMed]
- Gobbens, R.J.; Uchmanowicz, I. Assessing Frailty with the Tilburg Frailty Indicator (TFI): A Review of Reliability and Validity. Clin. Interv. Aging 2021, 16, 863–875. [Google Scholar] [CrossRef]
- R Core Team. R: A Language and Environment for Statistical Computing. Available online: https://www.R-project.org/ (accessed on 14 October 2022).
- Central Committee on Research Involving Human Subjects. Available online: https://english.ccmo.nl/investigators/legal-framework-for-medical-scientic-research/your-research-is-it-subject-to-the-wmo-or-not (accessed on 15 January 2008).
- den Ouden, M.E.; Schuurmans, M.J.; Arts, I.E.; van der Schouw, Y.T. Physical performance characteristics related to disability in older persons: A systematic review. Maturitas 2011, 69, 208–219. [Google Scholar] [CrossRef]
- Neumann, J.T.; Thao, L.T.P.; Murray, A.M.; Callander, E.; Carr, P.R.; Nelson, M.R.; Wolfe, R.; Woods, R.L.; Reid, C.M.; Shah, R.C.; et al. Prediction of disability-free survival in healthy older people. Geroscience 2022, 44, 1641–1655. [Google Scholar] [CrossRef]
- Gobbens, R.J.; van Assen, M.A. The Prediction of ADL and IADL Disability Using Six Physical Indicators of Frailty: A Longitudinal Study in the Netherlands. Curr. Gerontol. Geriatr. Res. 2014, 2014, 358137. [Google Scholar] [CrossRef]
- Gobbens, R.J.; van Assen, M.A.; Schalk, M.J. The prediction of disability by self-reported physical frailty components of the Tilburg Frailty Indicator (TFI). Arch. Gerontol. Geriatr. 2014, 59, 280–287. [Google Scholar] [CrossRef] [PubMed]
- Payette, H.; Coulombe, C.; Boutier, V.; Gray-Donald, K. Nutrition risk factors for institutionalization in a free-living functionally dependent elderly population. J. Clin. Epidemiol. 2000, 53, 579–587. [Google Scholar] [CrossRef] [PubMed]
- Gaddey, H.L.; Holder, K.K. Unintentional Weight Loss in Older Adults. Am. Fam. Physician 2021, 104, 34–40. [Google Scholar]
- Alibhai, S.M.; Greenwood, C.; Payette, H. An approach to the management of unintentional weight loss in elderly people. CMAJ 2005, 172, 773–780. [Google Scholar] [CrossRef] [PubMed]
- Soysal, P.; Hurst, C.; Demurtas, J.; Firth, J.; Howden, R.; Yang, L.; Tully, M.A.; Koyanagi, A.; Ilie, P.C.; López-Sánchez, G.F.; et al. Handgrip strength and health outcomes: Umbrella review of systematic reviews with meta-analyses of observational studies. J. Sport Health Sci. 2021, 10, 290–295. [Google Scholar] [CrossRef]
- Shimada, H.; Makizako, H.; Doi, T.; Tsutsumimoto, K.; Lee, S.; Suzuki, T. Cognitive Impairment and Disability in Older Japanese Adults. PLoS ONE 2016, 11, e0158720. [Google Scholar] [CrossRef] [PubMed]
- St John, P.D.; Tyas, S.L.; Montgomery, P.R. Cognition, even in the normal range, predicts disability: Cross-sectional and prospective analyses of a population-based sample. Int. J. Geriatr. Psychiatry 2015, 30, 1008–1016. [Google Scholar] [CrossRef]
- Gobbens, R.J.J.; van Assen, M.; Augustijn, H.; Goumans, M.; van der Ploeg, T. Prediction of Mortality by the Tilburg Frailty Indicator (TFI). J. Am. Med. Dir. Assoc. 2021, 22, e601–e607. [Google Scholar] [CrossRef] [PubMed]
- Katz, S.; Downs, T.D.; Cash, H.R.; Grotz, R.C. Progress in development of the index of ADL. Gerontologist 1970, 10, 20–30. [Google Scholar] [CrossRef]
- Lawton, M.P.; Brody, E.M. Assessment of older people: Self-maintaining and instrumental activities of daily living. Gerontologist 1969, 9, 179–186. [Google Scholar] [CrossRef]
Disclaimer/Publisher’s Note: The statements, opinions and data contained in all publications are solely those of the individual author(s) and contributor(s) and not of MDPI and/or the editor(s). MDPI and/or the editor(s) disclaim responsibility for any injury to people or property resulting from any ideas, methods, instructions or products referred to in the content. |
© 2023 by the authors. Licensee MDPI, Basel, Switzerland. This article is an open access article distributed under the terms and conditions of the Creative Commons Attribution (CC BY) license (https://creativecommons.org/licenses/by/4.0/).