
AI-Assisted Diagnosis and Decision-Making Method in Developing Countries for Osteosarcoma


Abstract
1. Introduction
- (1)
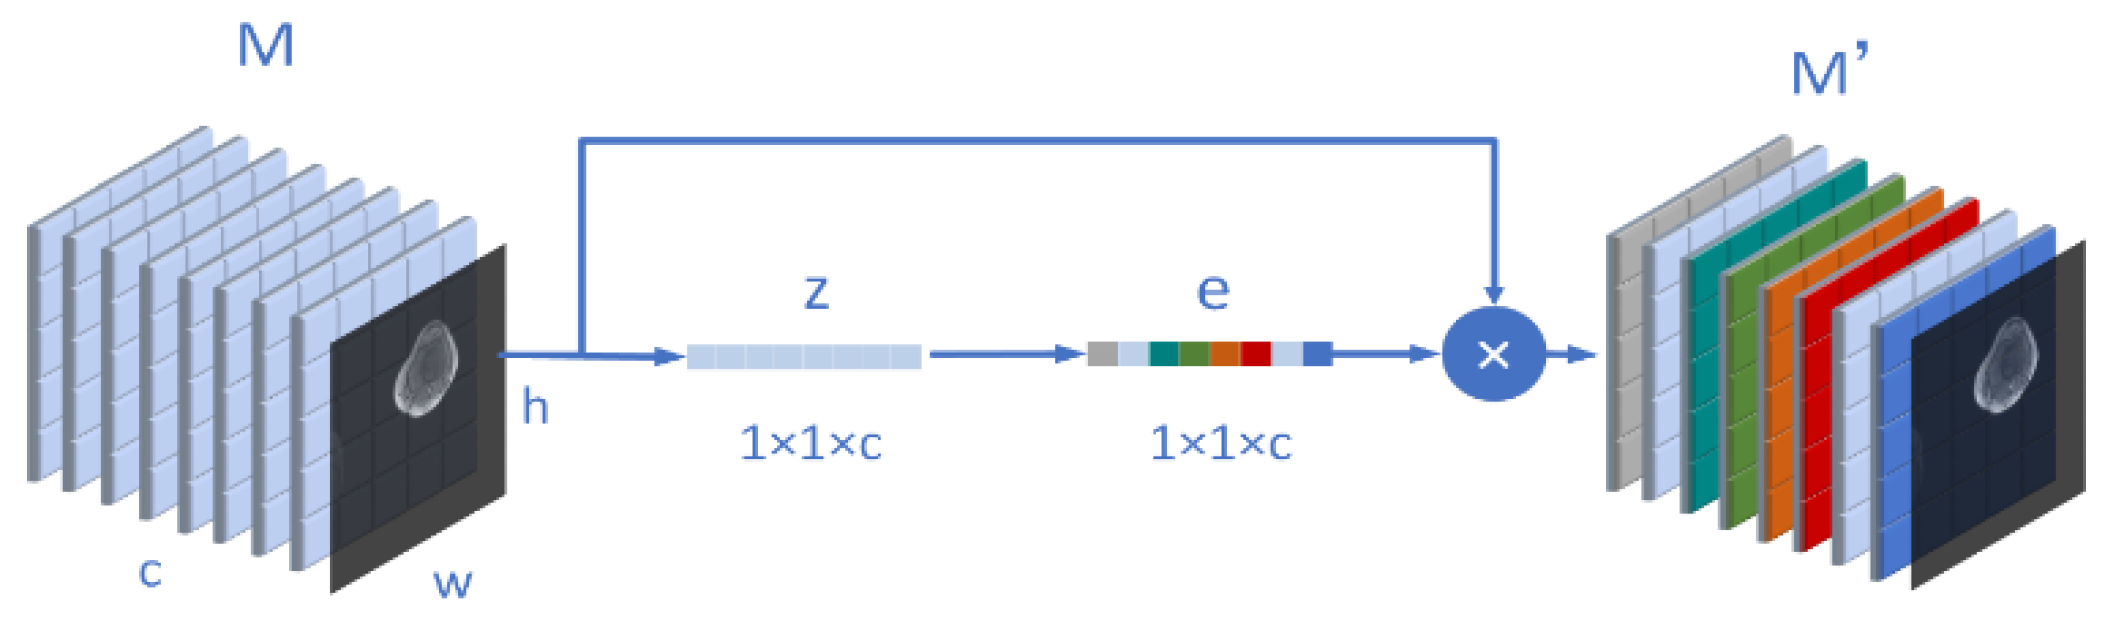
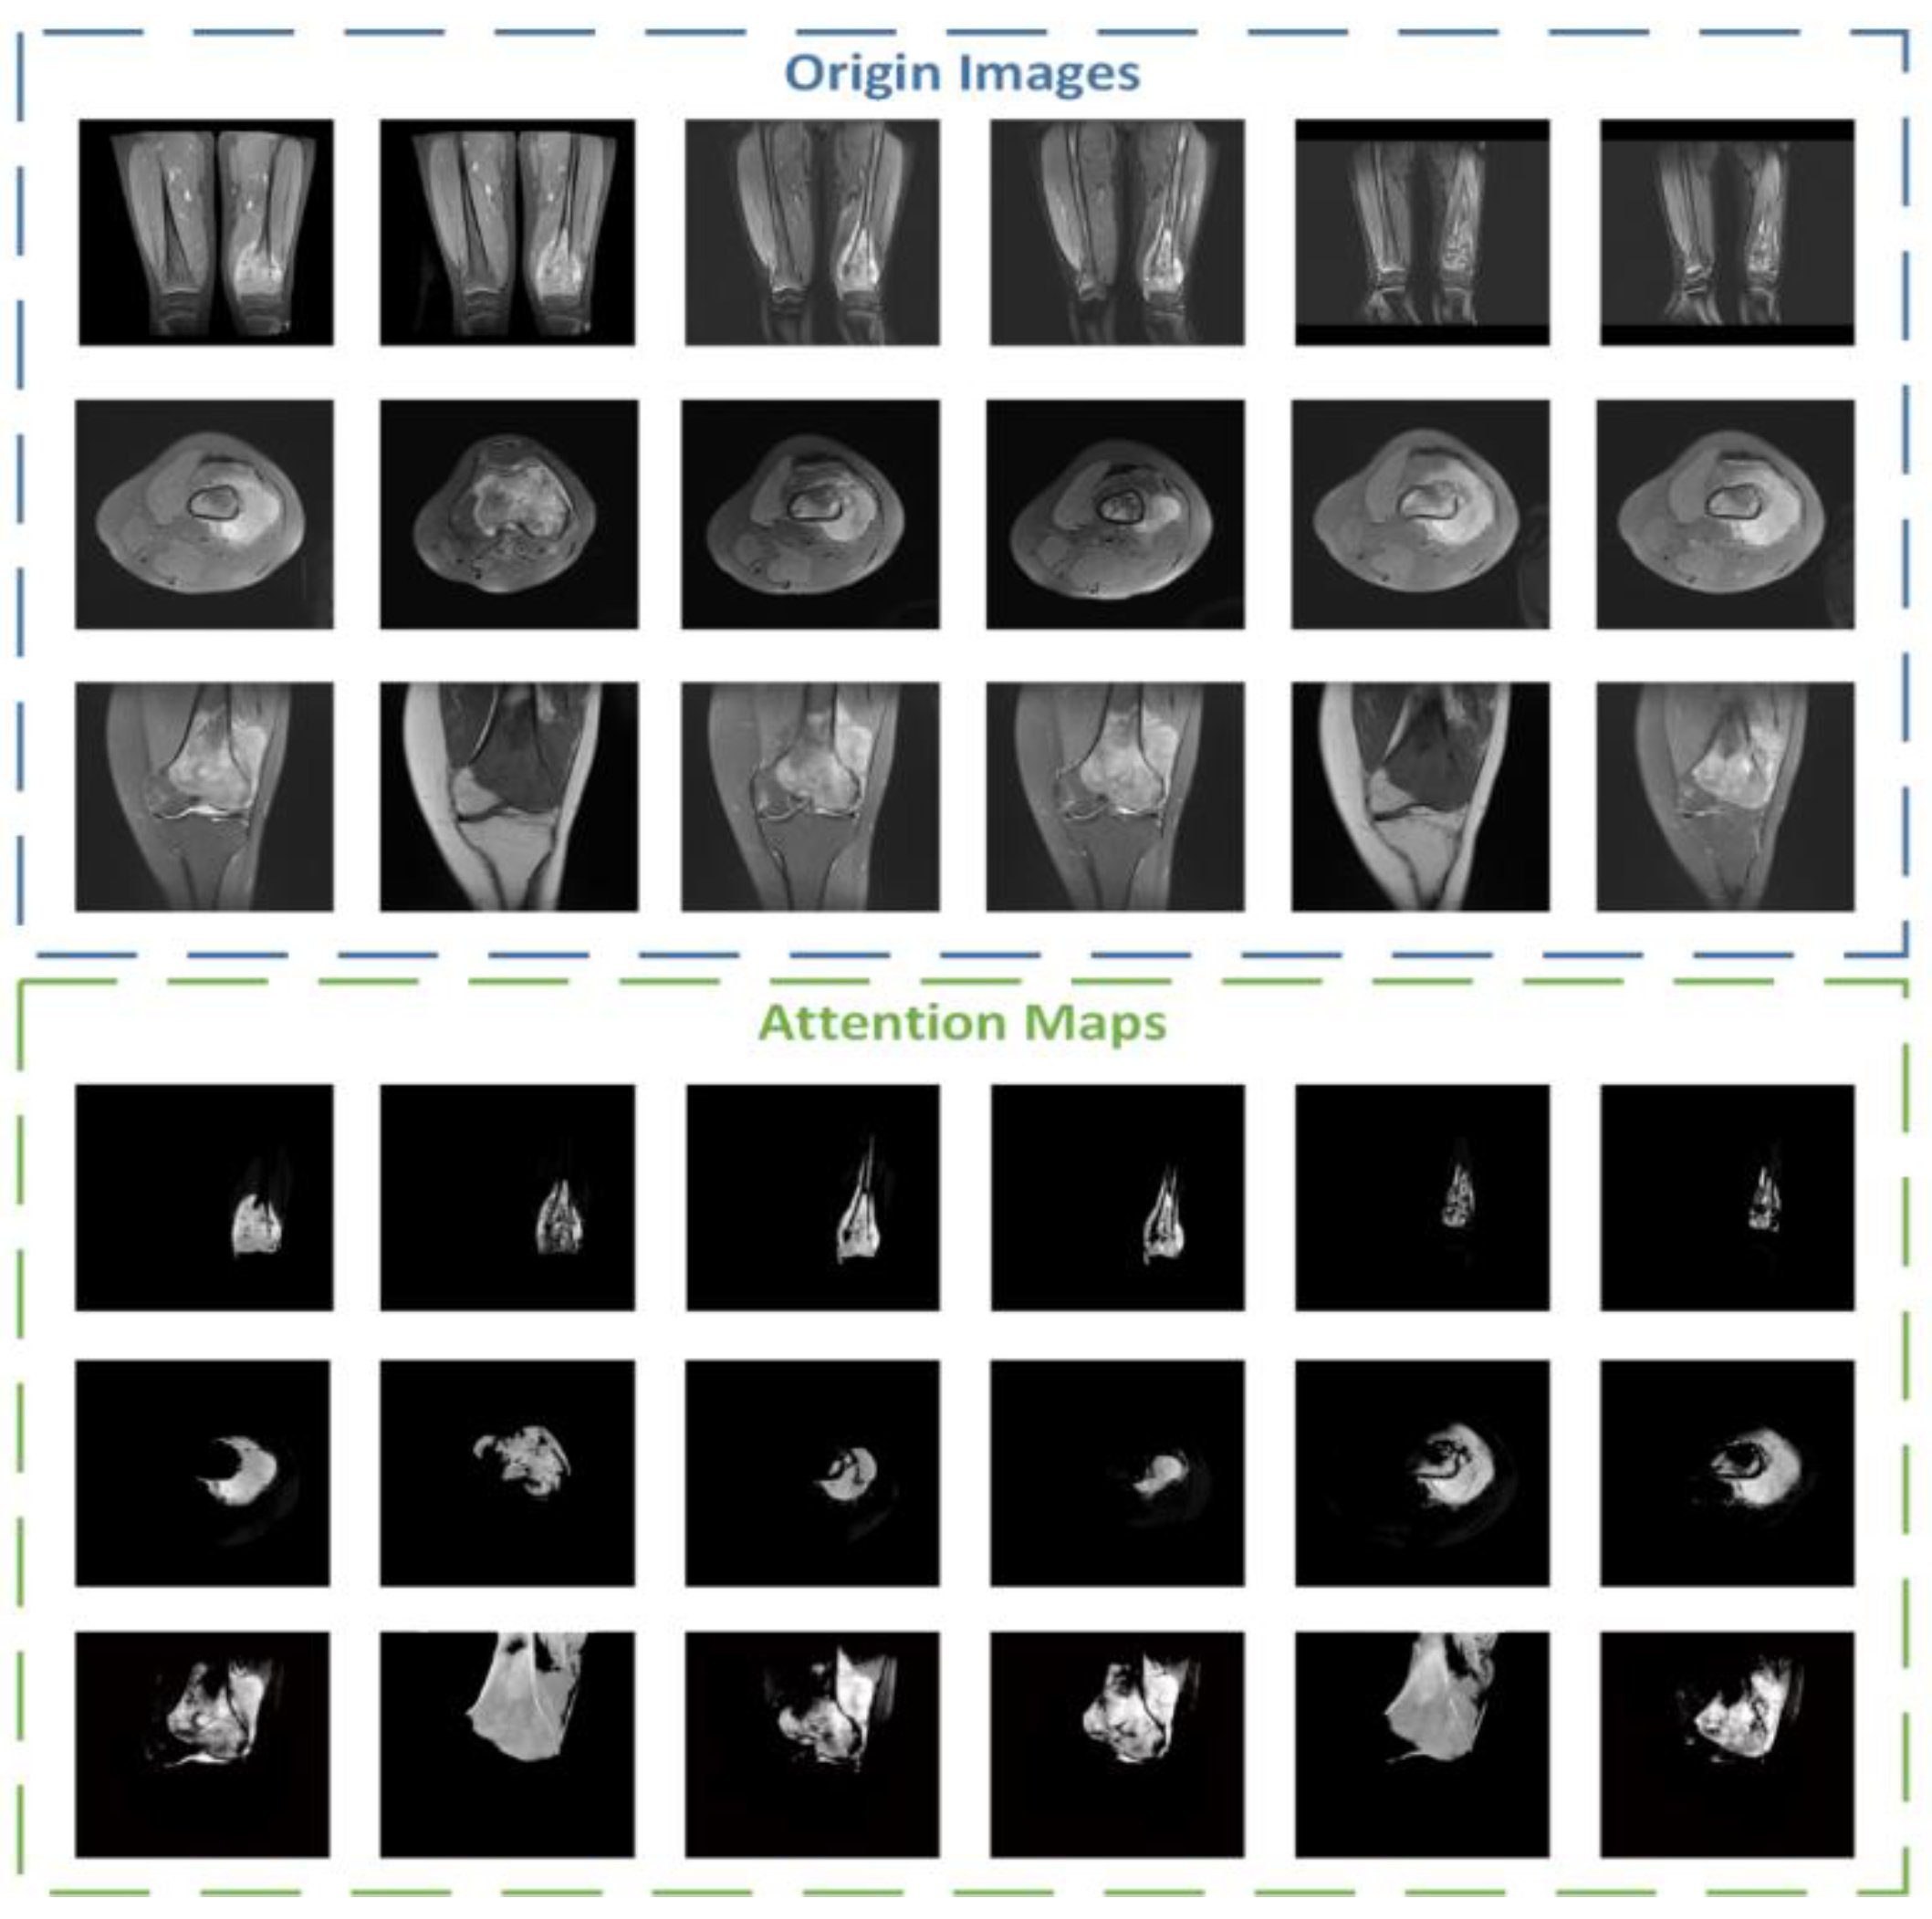
- In this article, the region in the image can be focused more accurately through the Attention Condenser. The multilayer condenser structure can further locate the boundary of the tumor, and reduce a large number of unnecessary calculations in the later stage, to improve the efficiency and accuracy of training.
- (2)
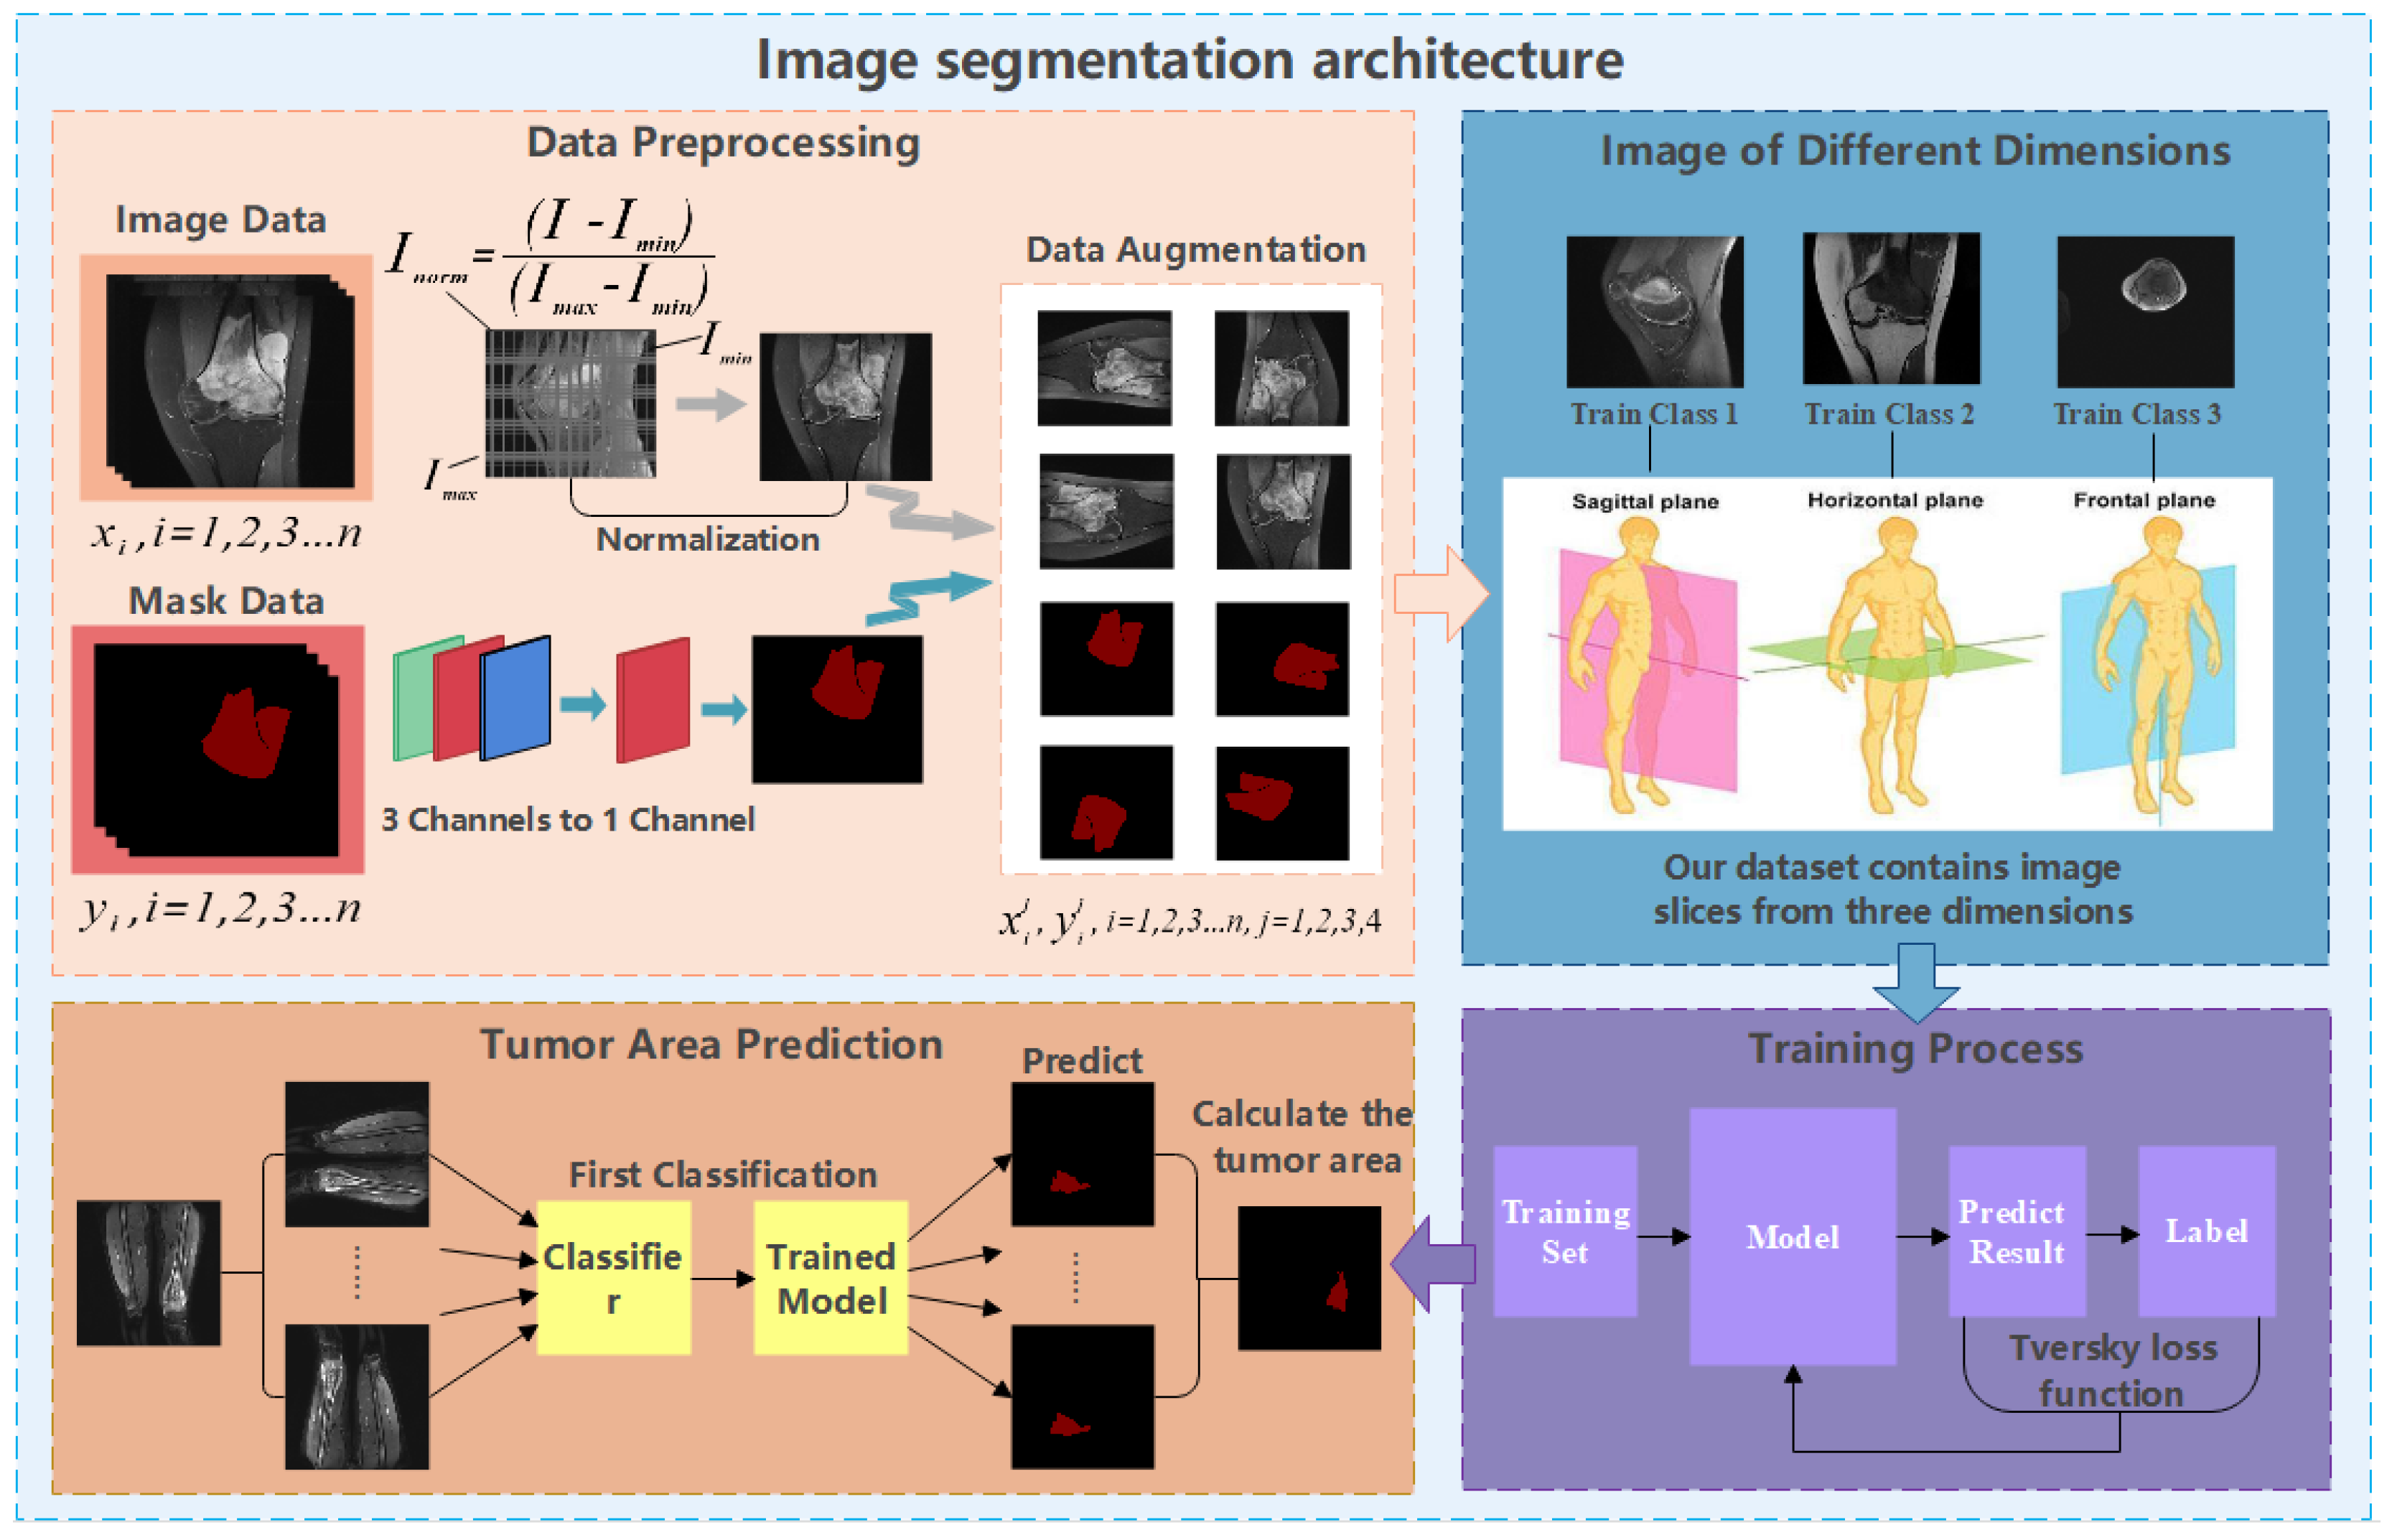
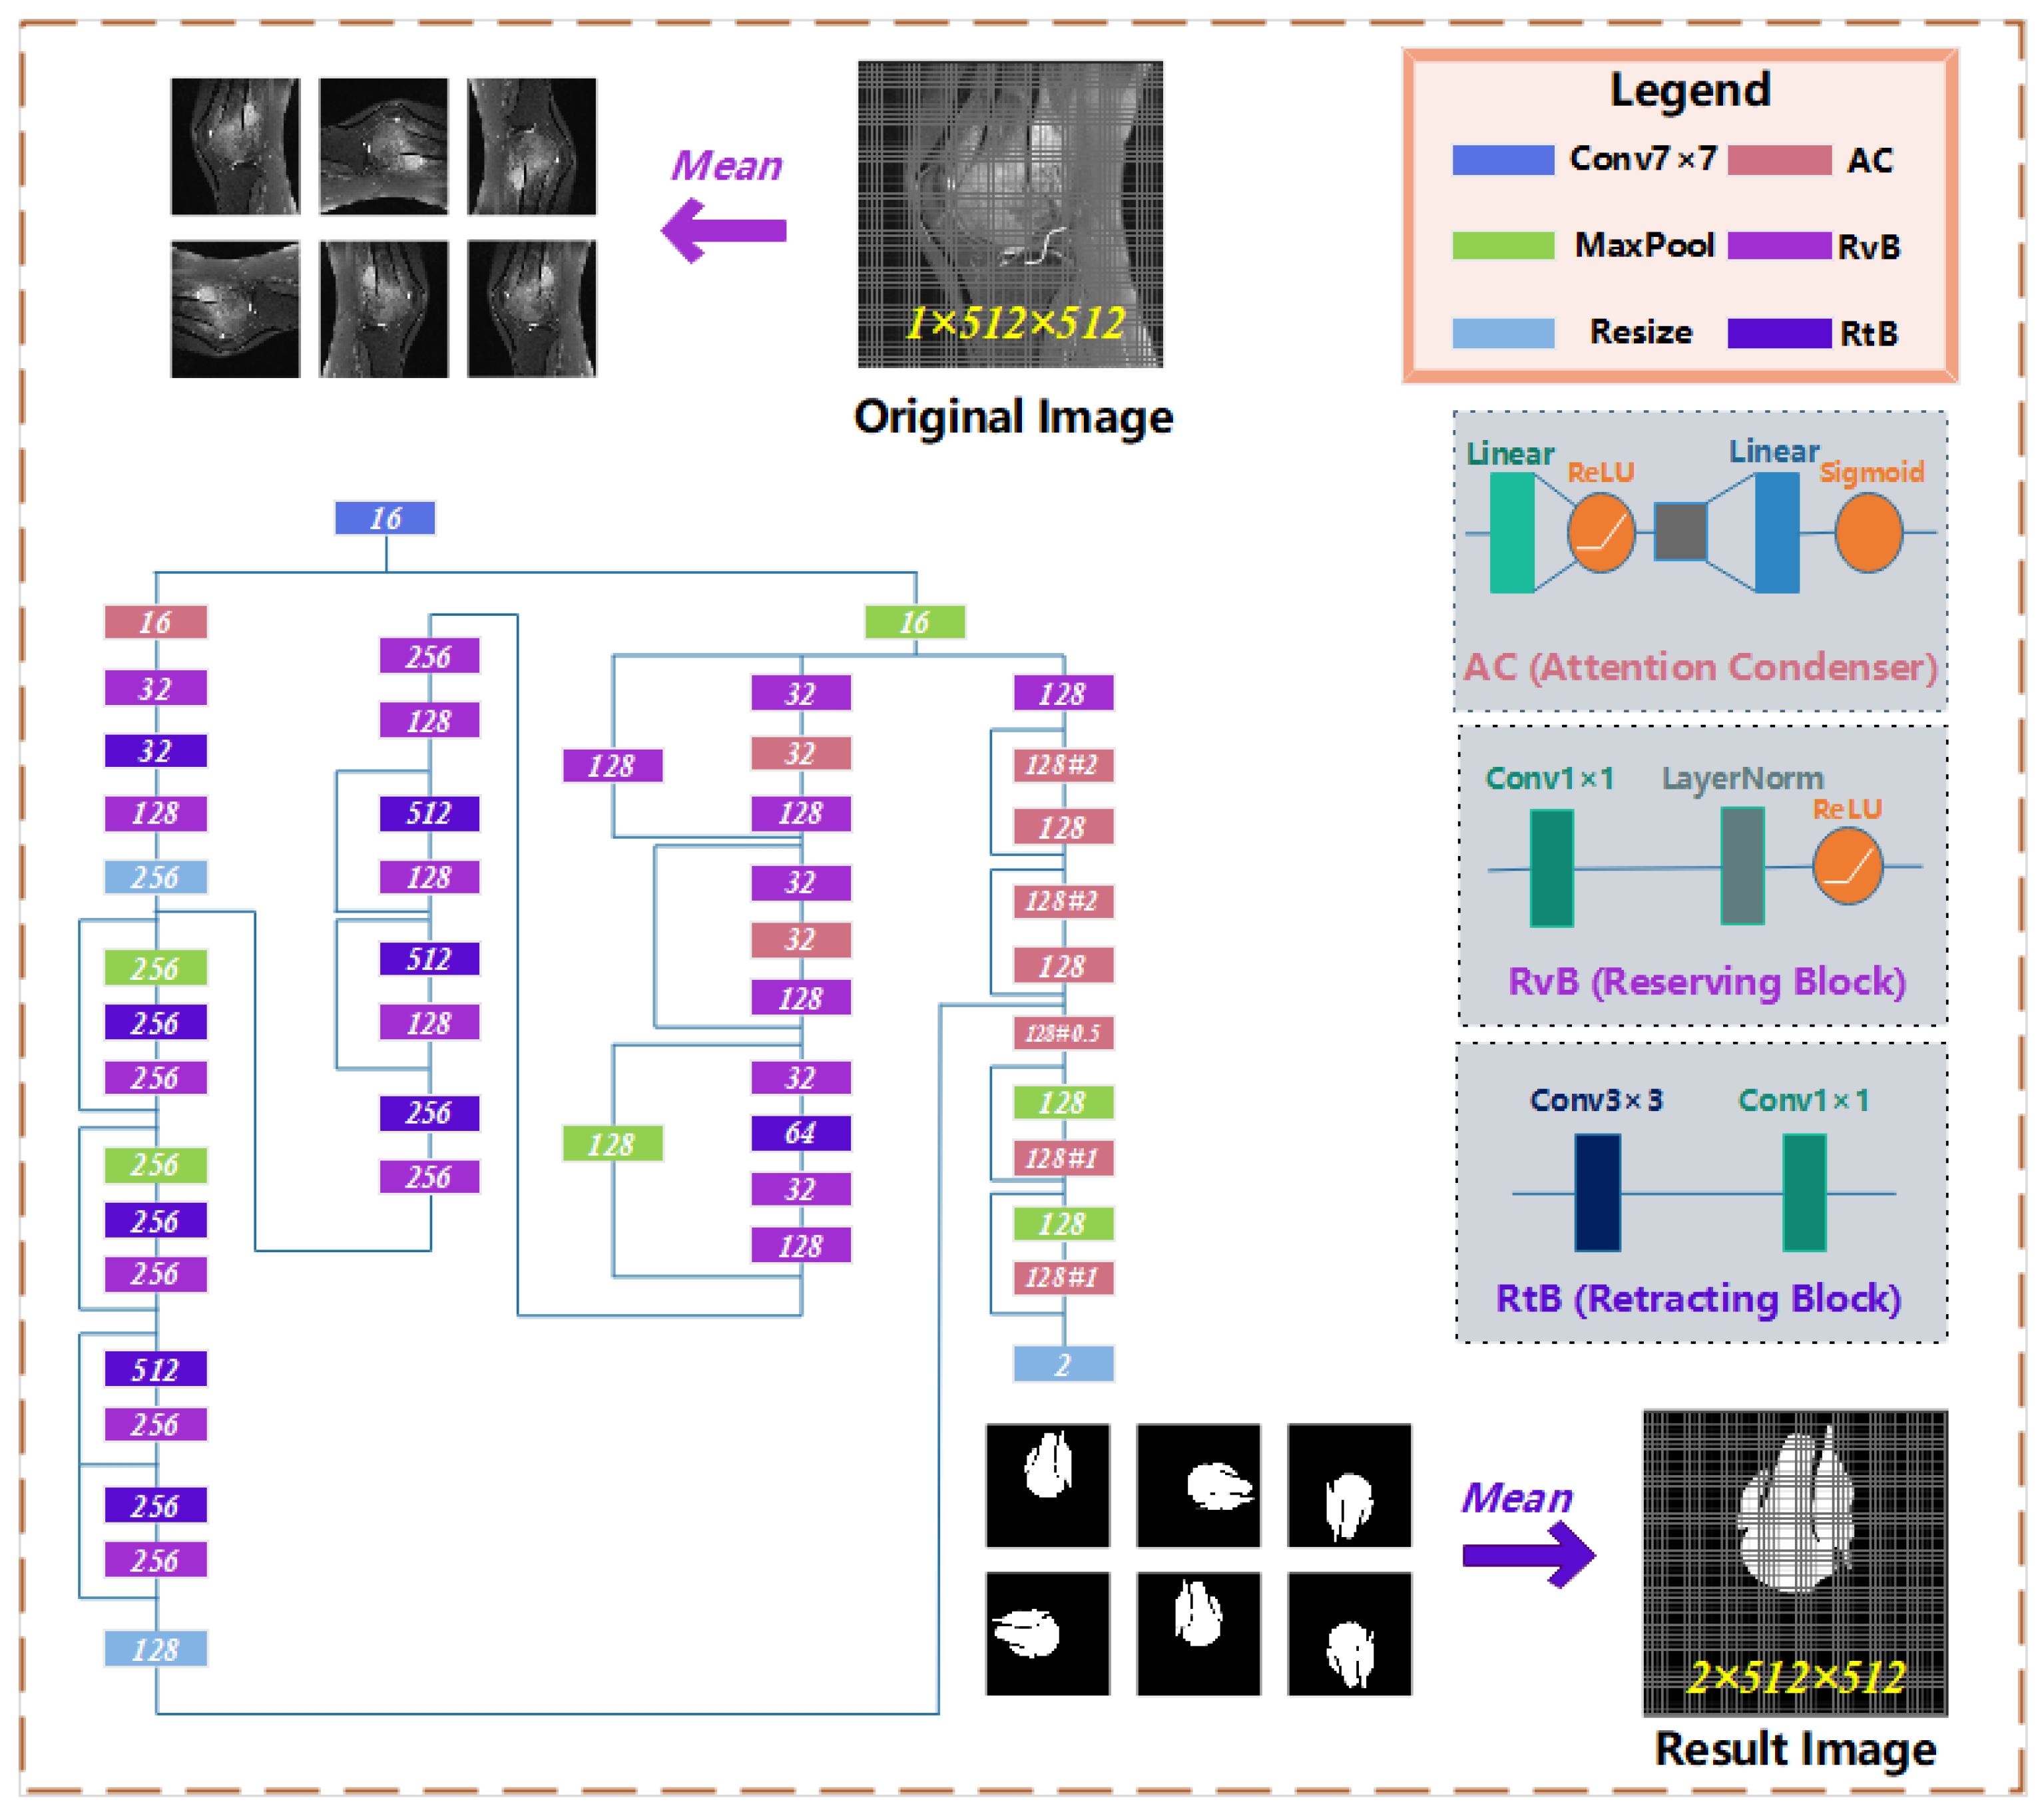
- When using the model to predict, OMSAS uses a compound decision module that turns a single input into multiple copies of the input. Then, the model makes predictions by multiple copies simultaneously, and then combines the multiple outputs to get the final result. Multiple decisions can reduce the wrong prediction caused by some unknown situations and make the output more accurate. Meanwhile, it can improve the stability of the model.
- (3)
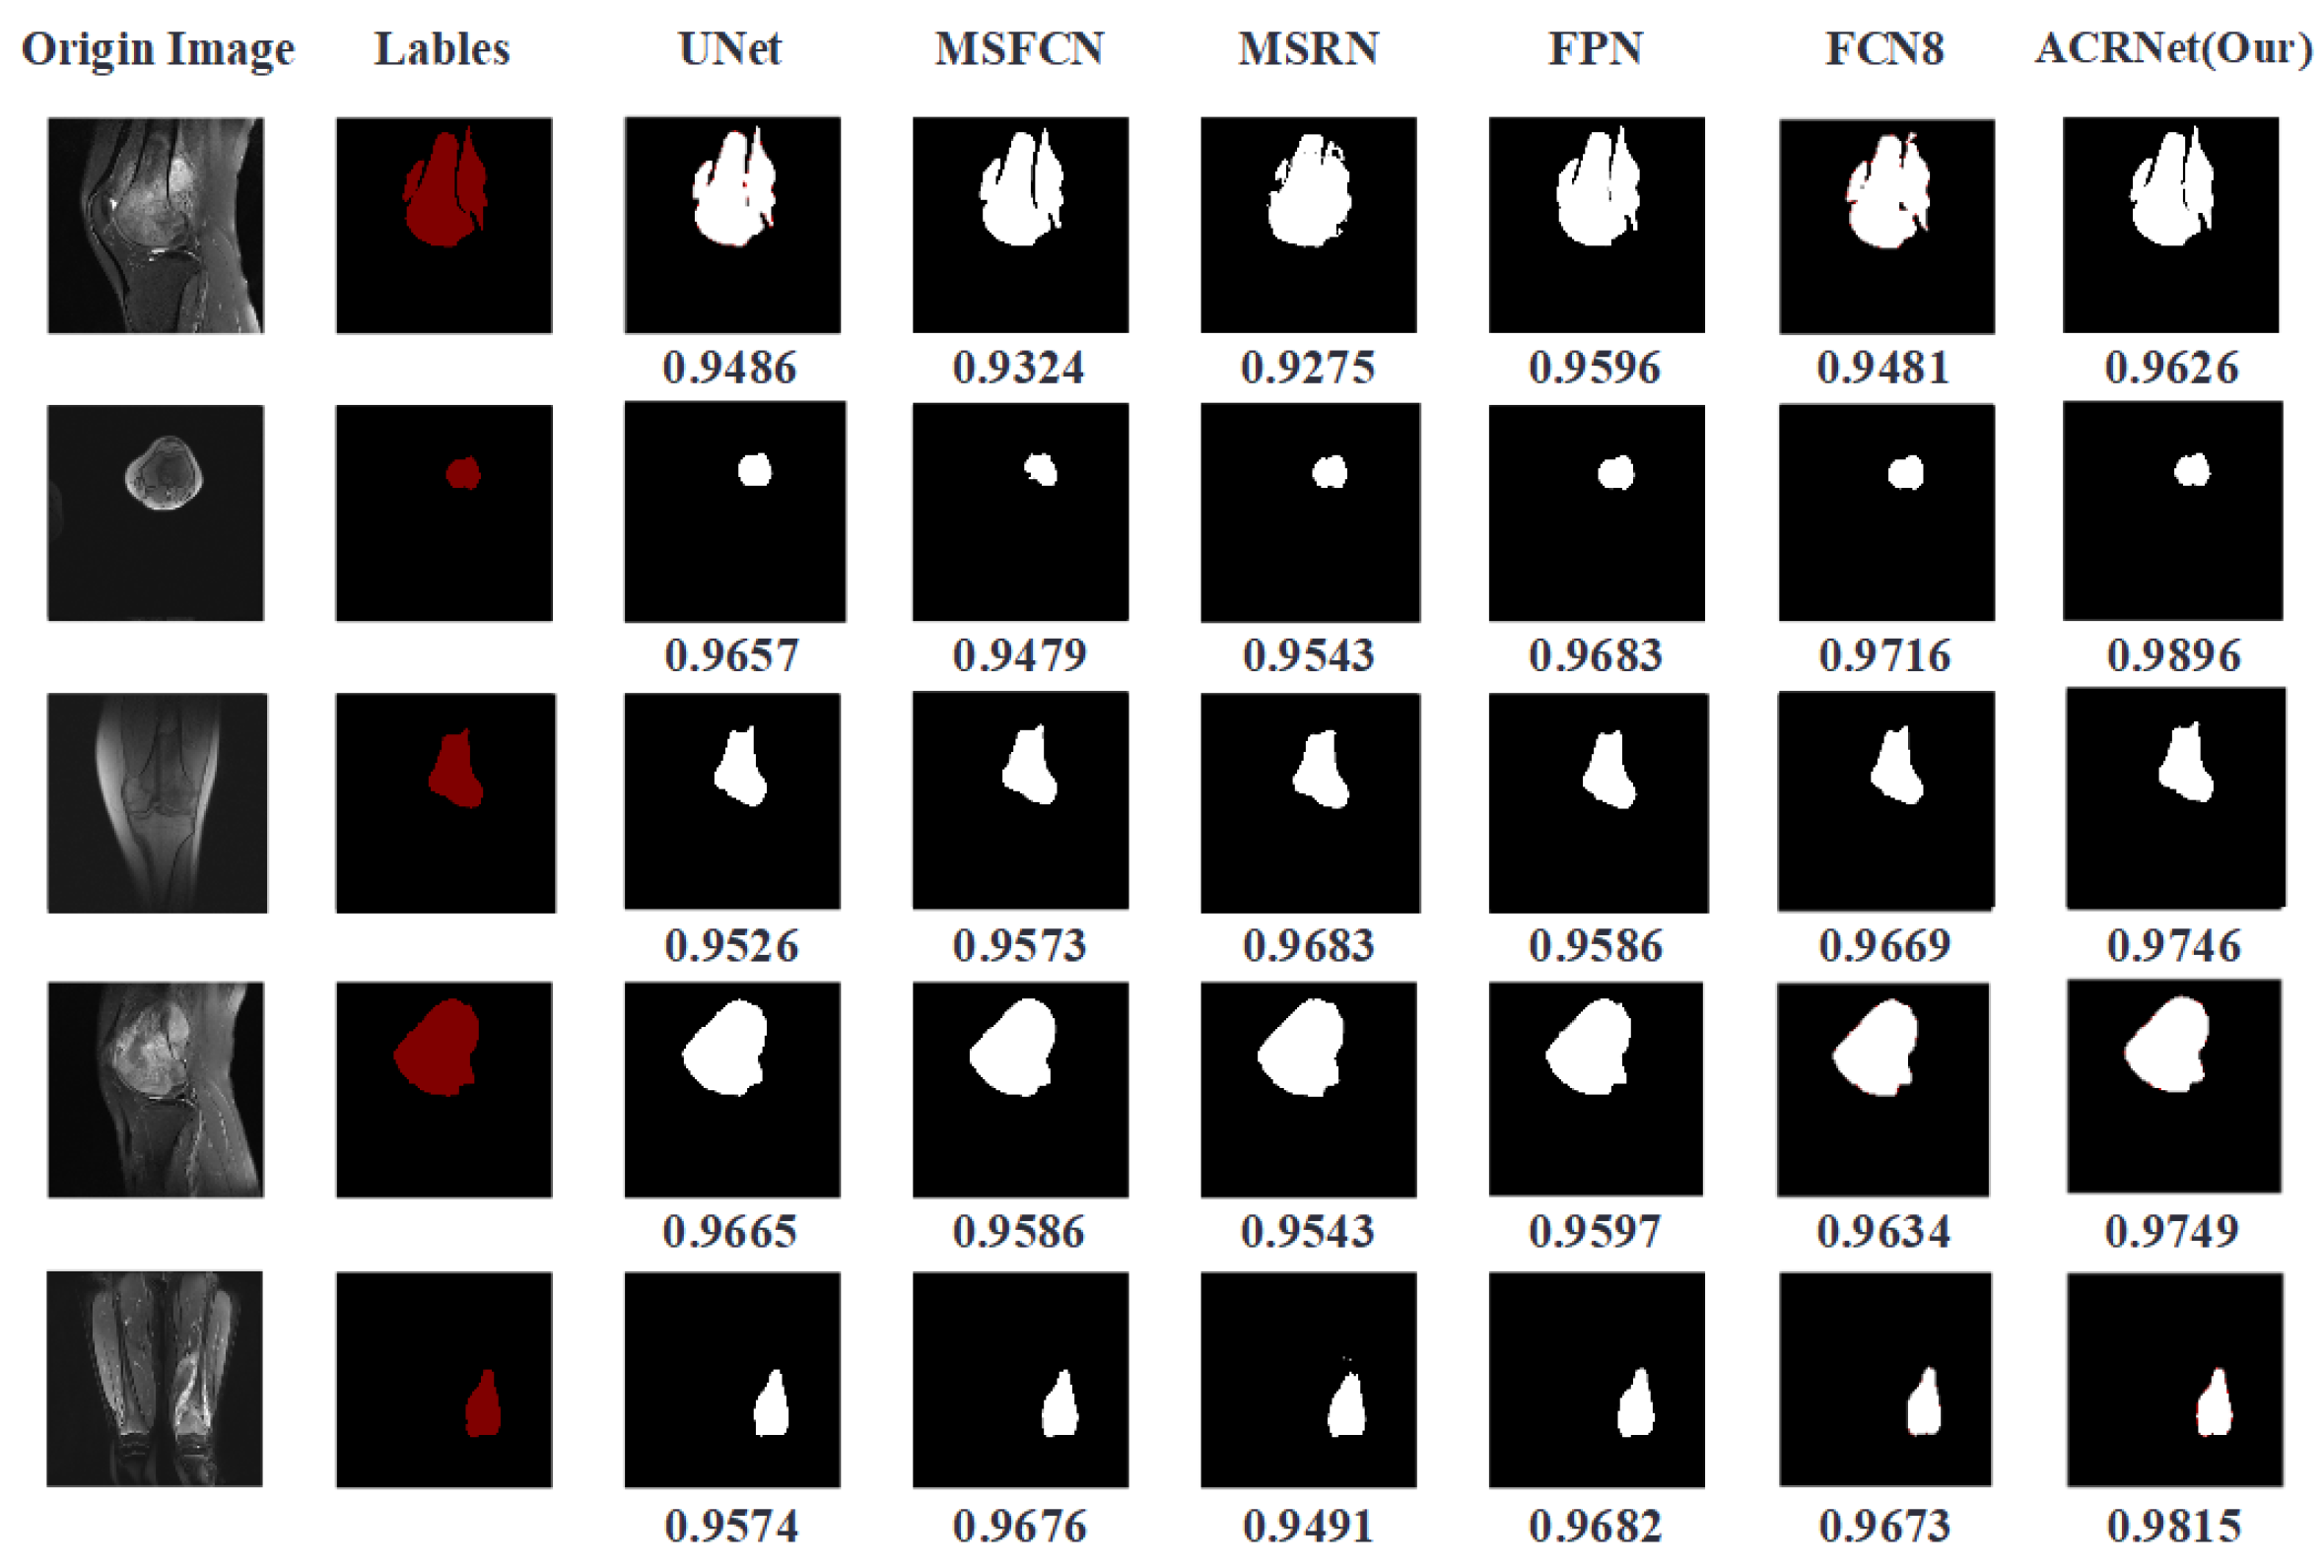
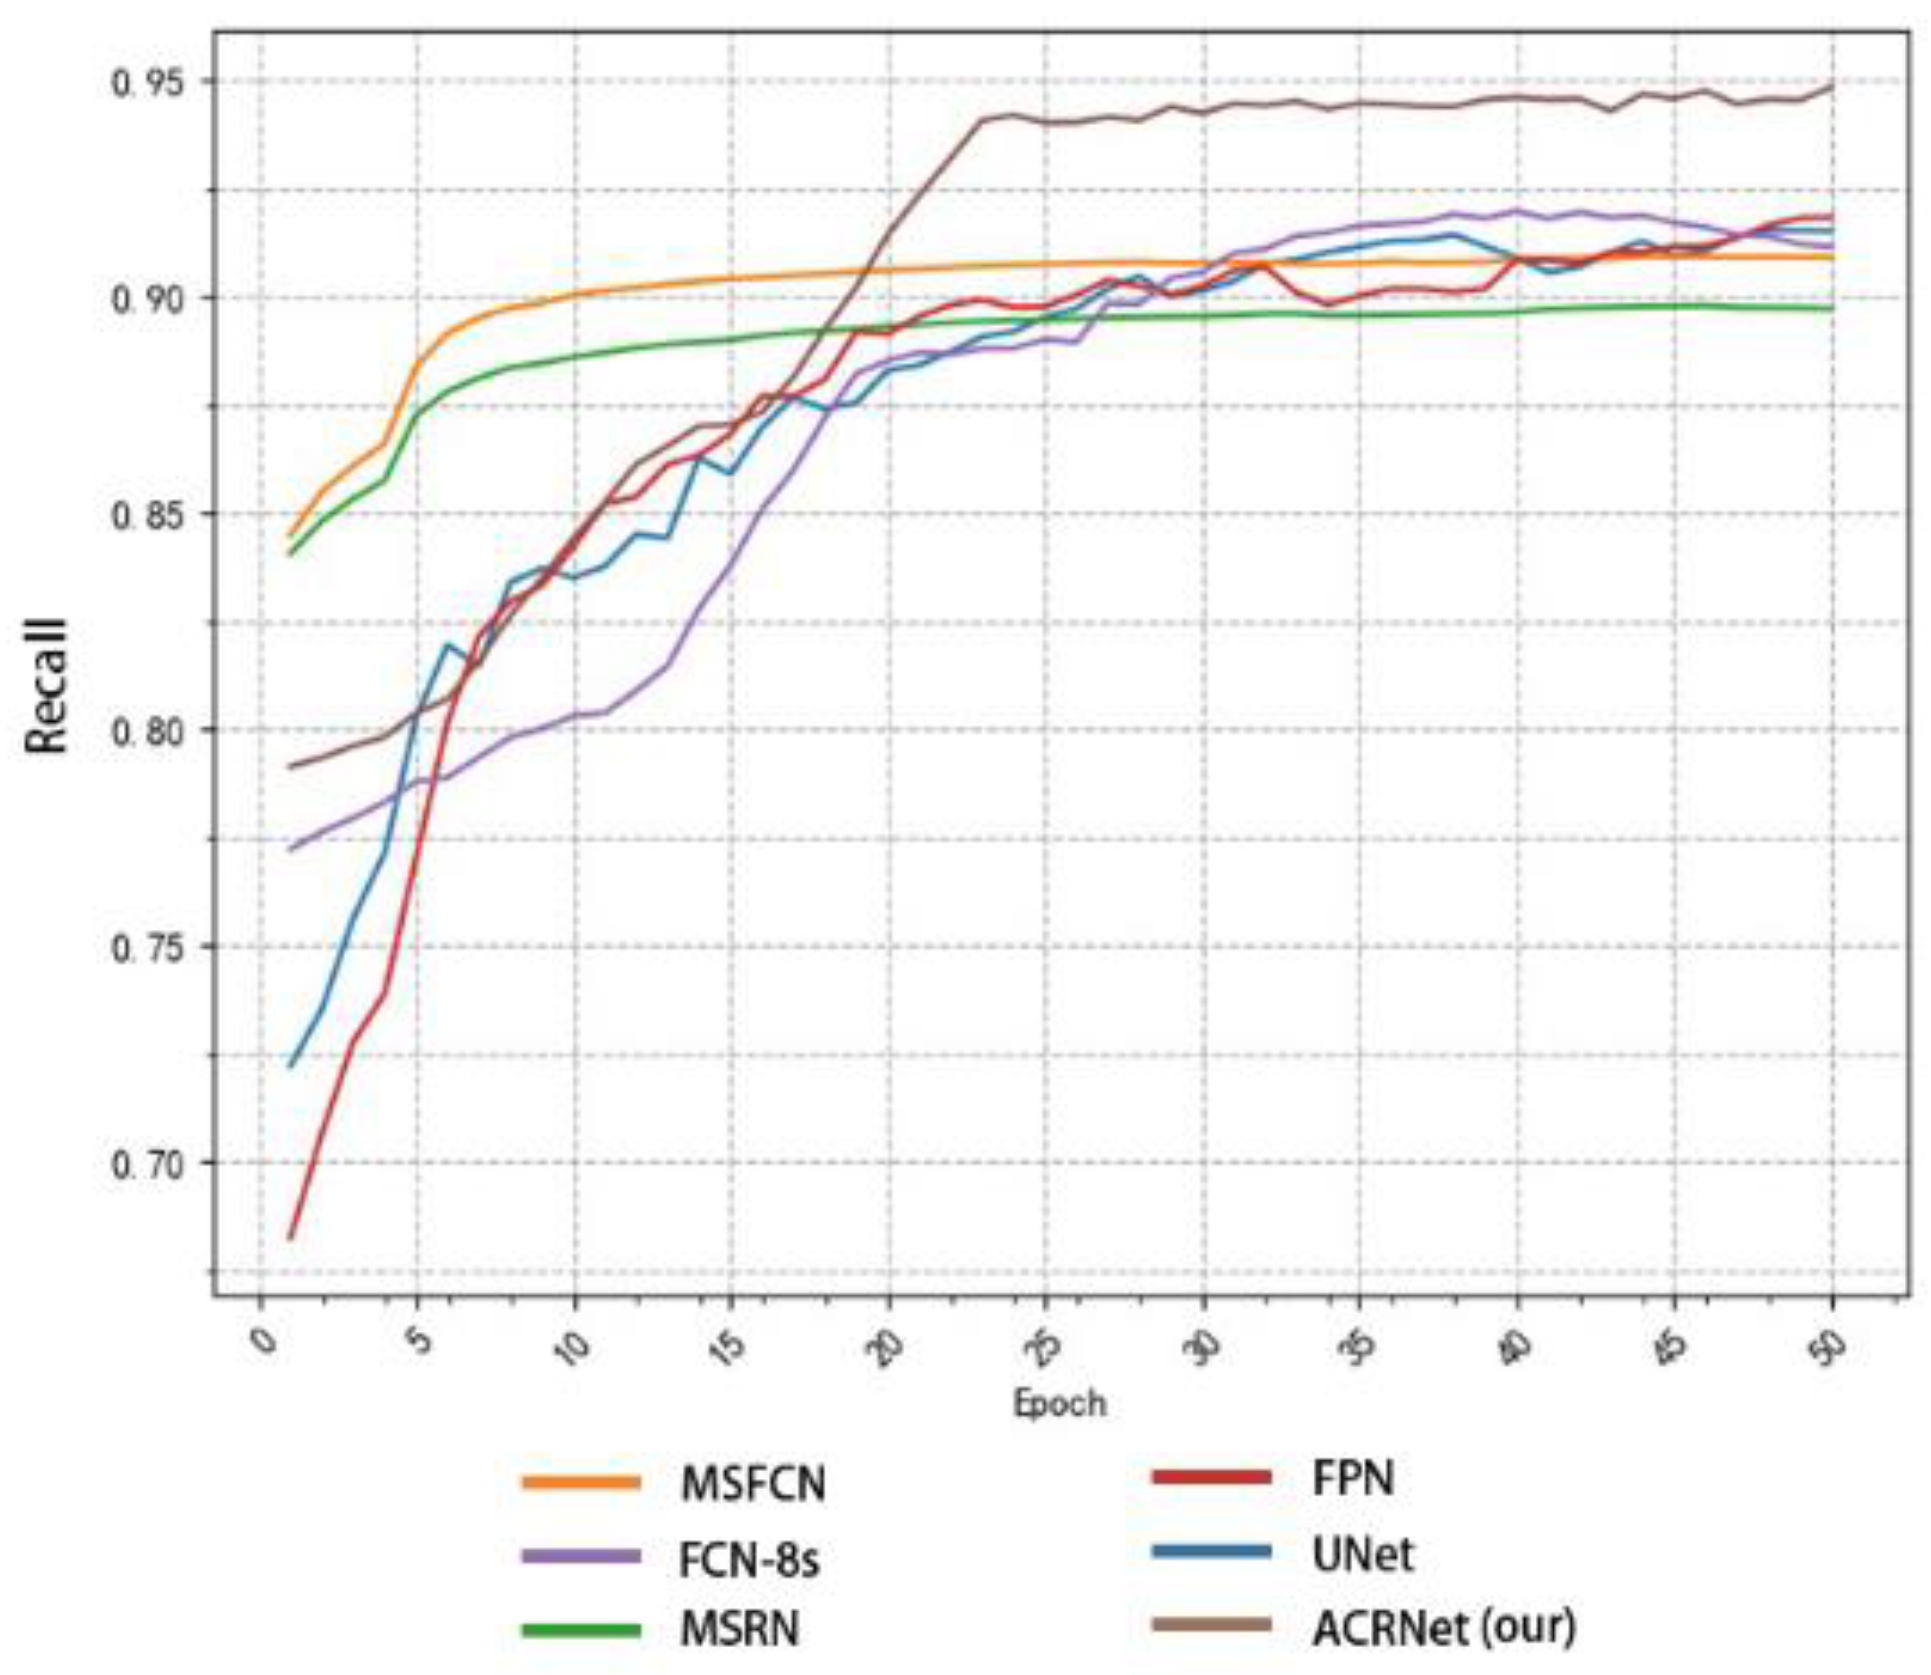
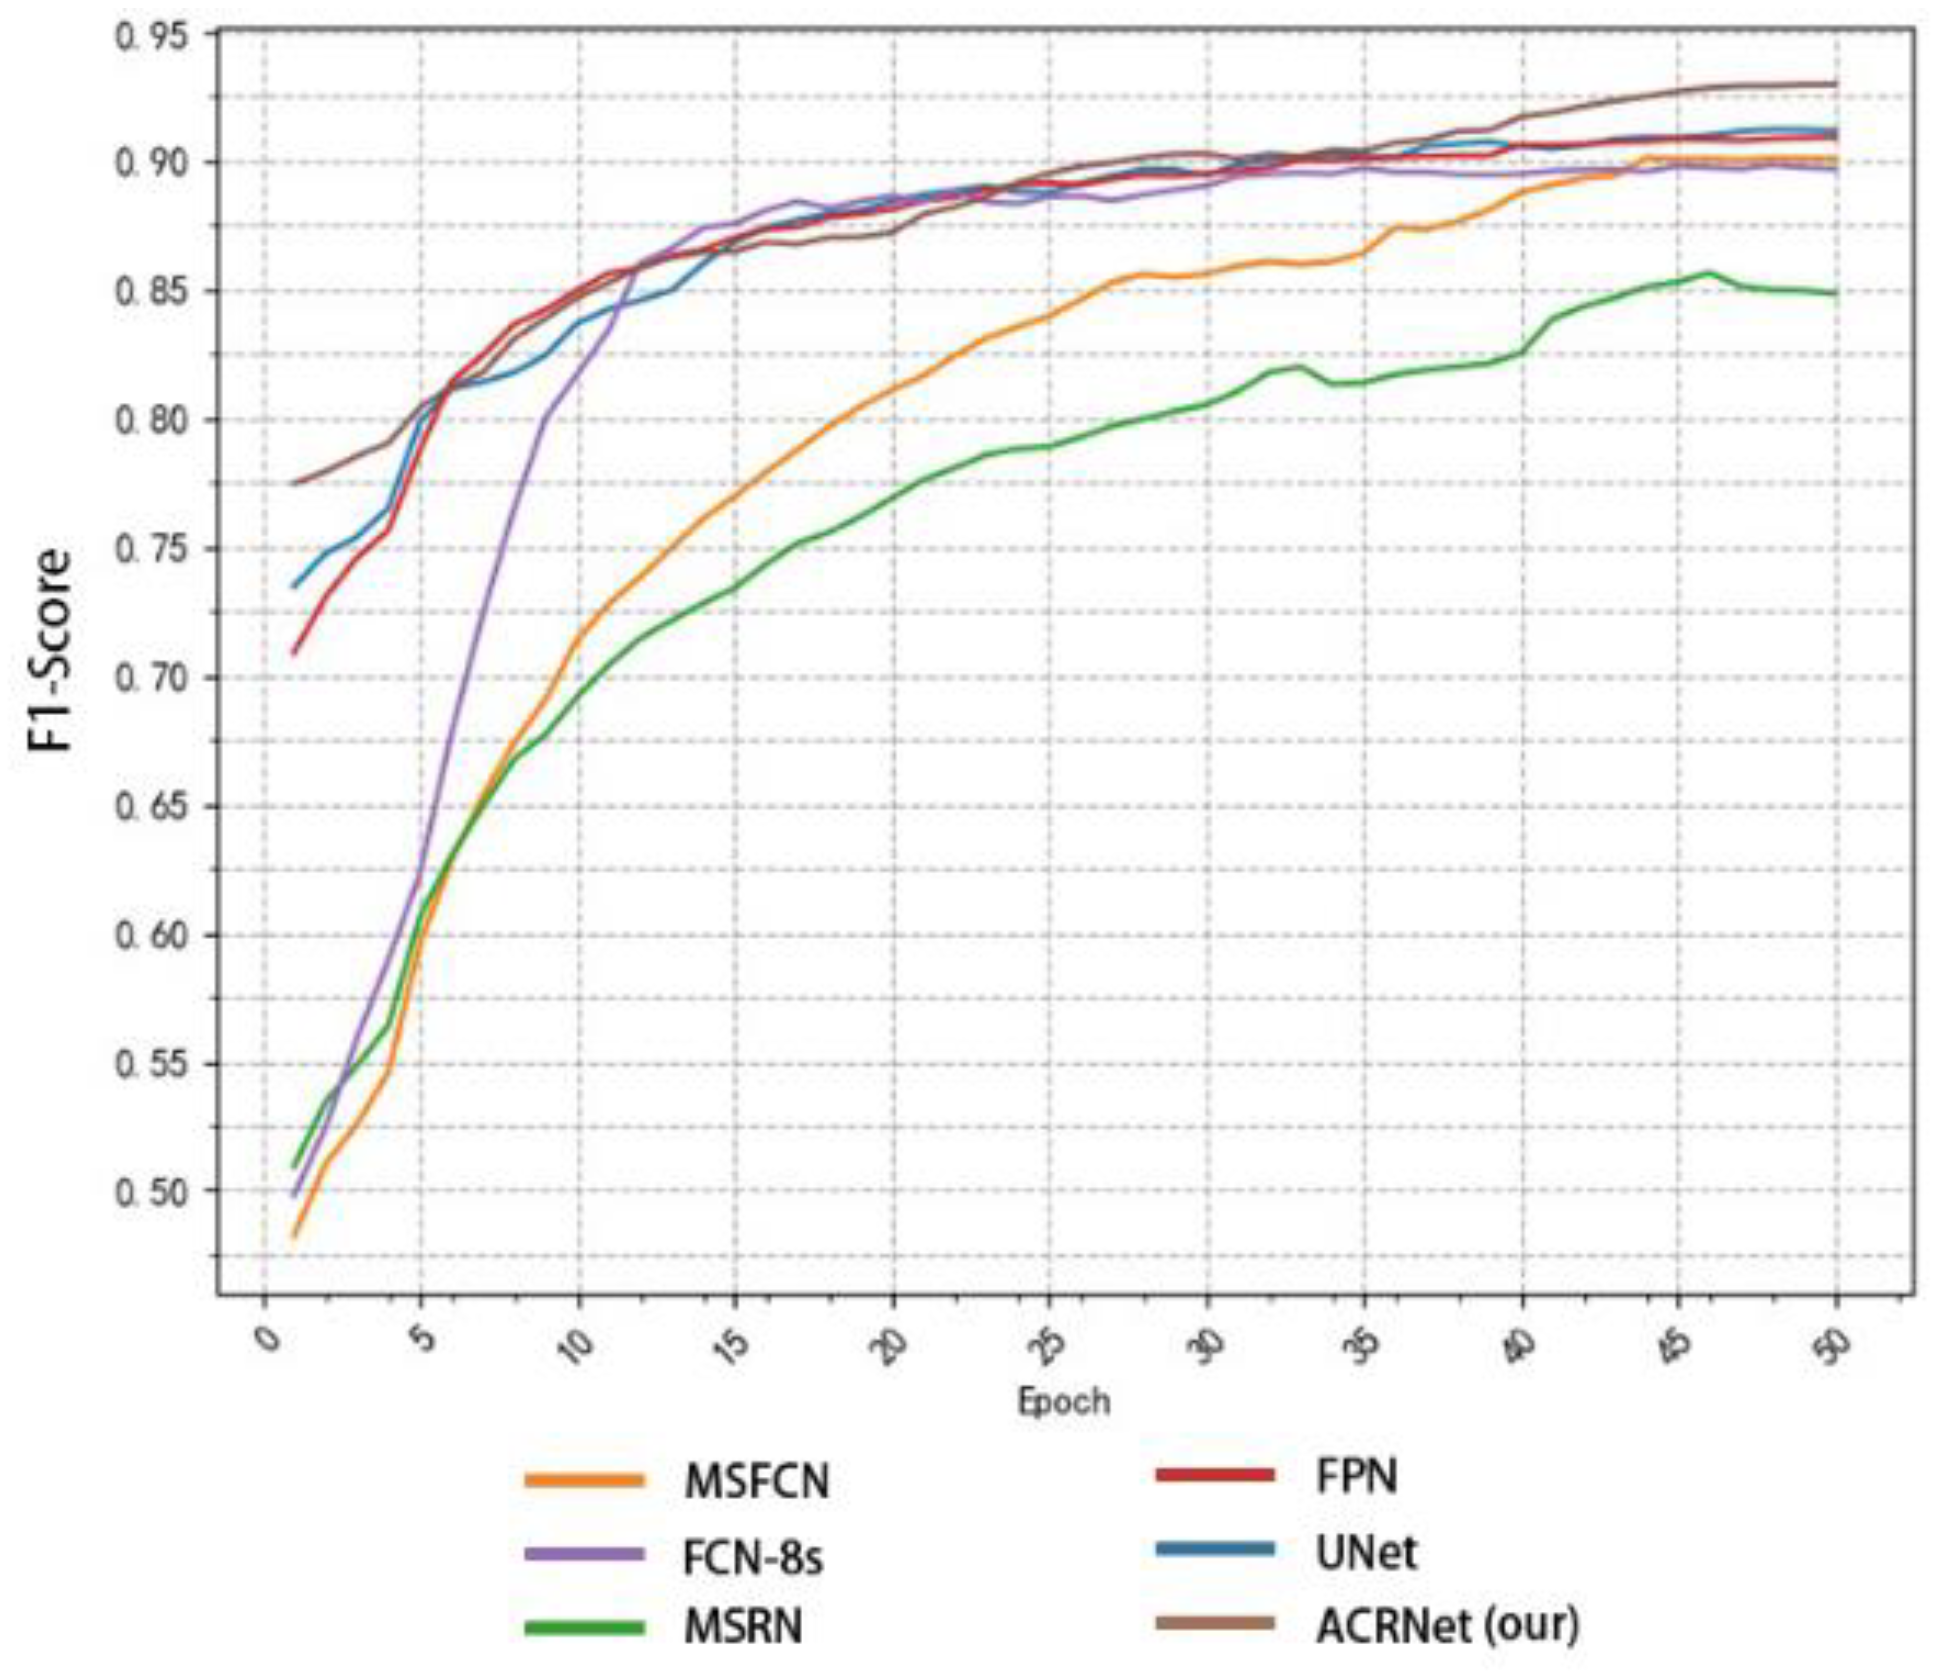
- More than 4000 images provided by the First People’s Hospital of Huaihua and the Second People’s Hospital of Huaihua were used for testing. The result indicates that our ACRNet in OMSAS is better than other existing segmentation models. The model has high training efficiency and prediction accuracy as well as small resource consumption, which is important in assisting doctors to diagnose osteosarcoma in patients.
2. Related Works
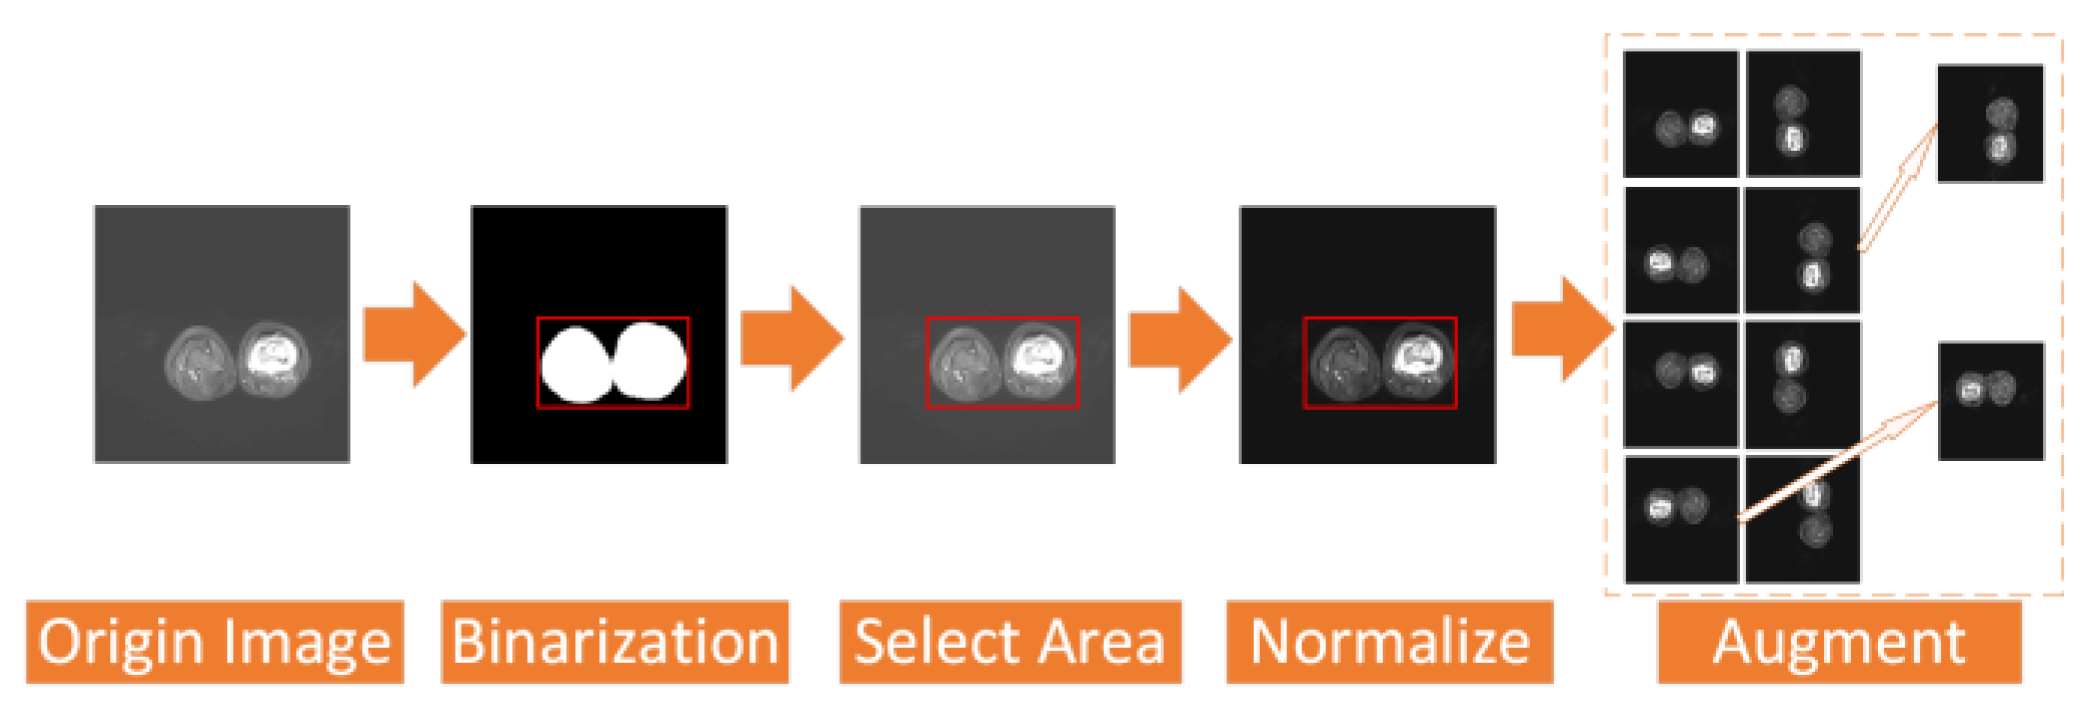
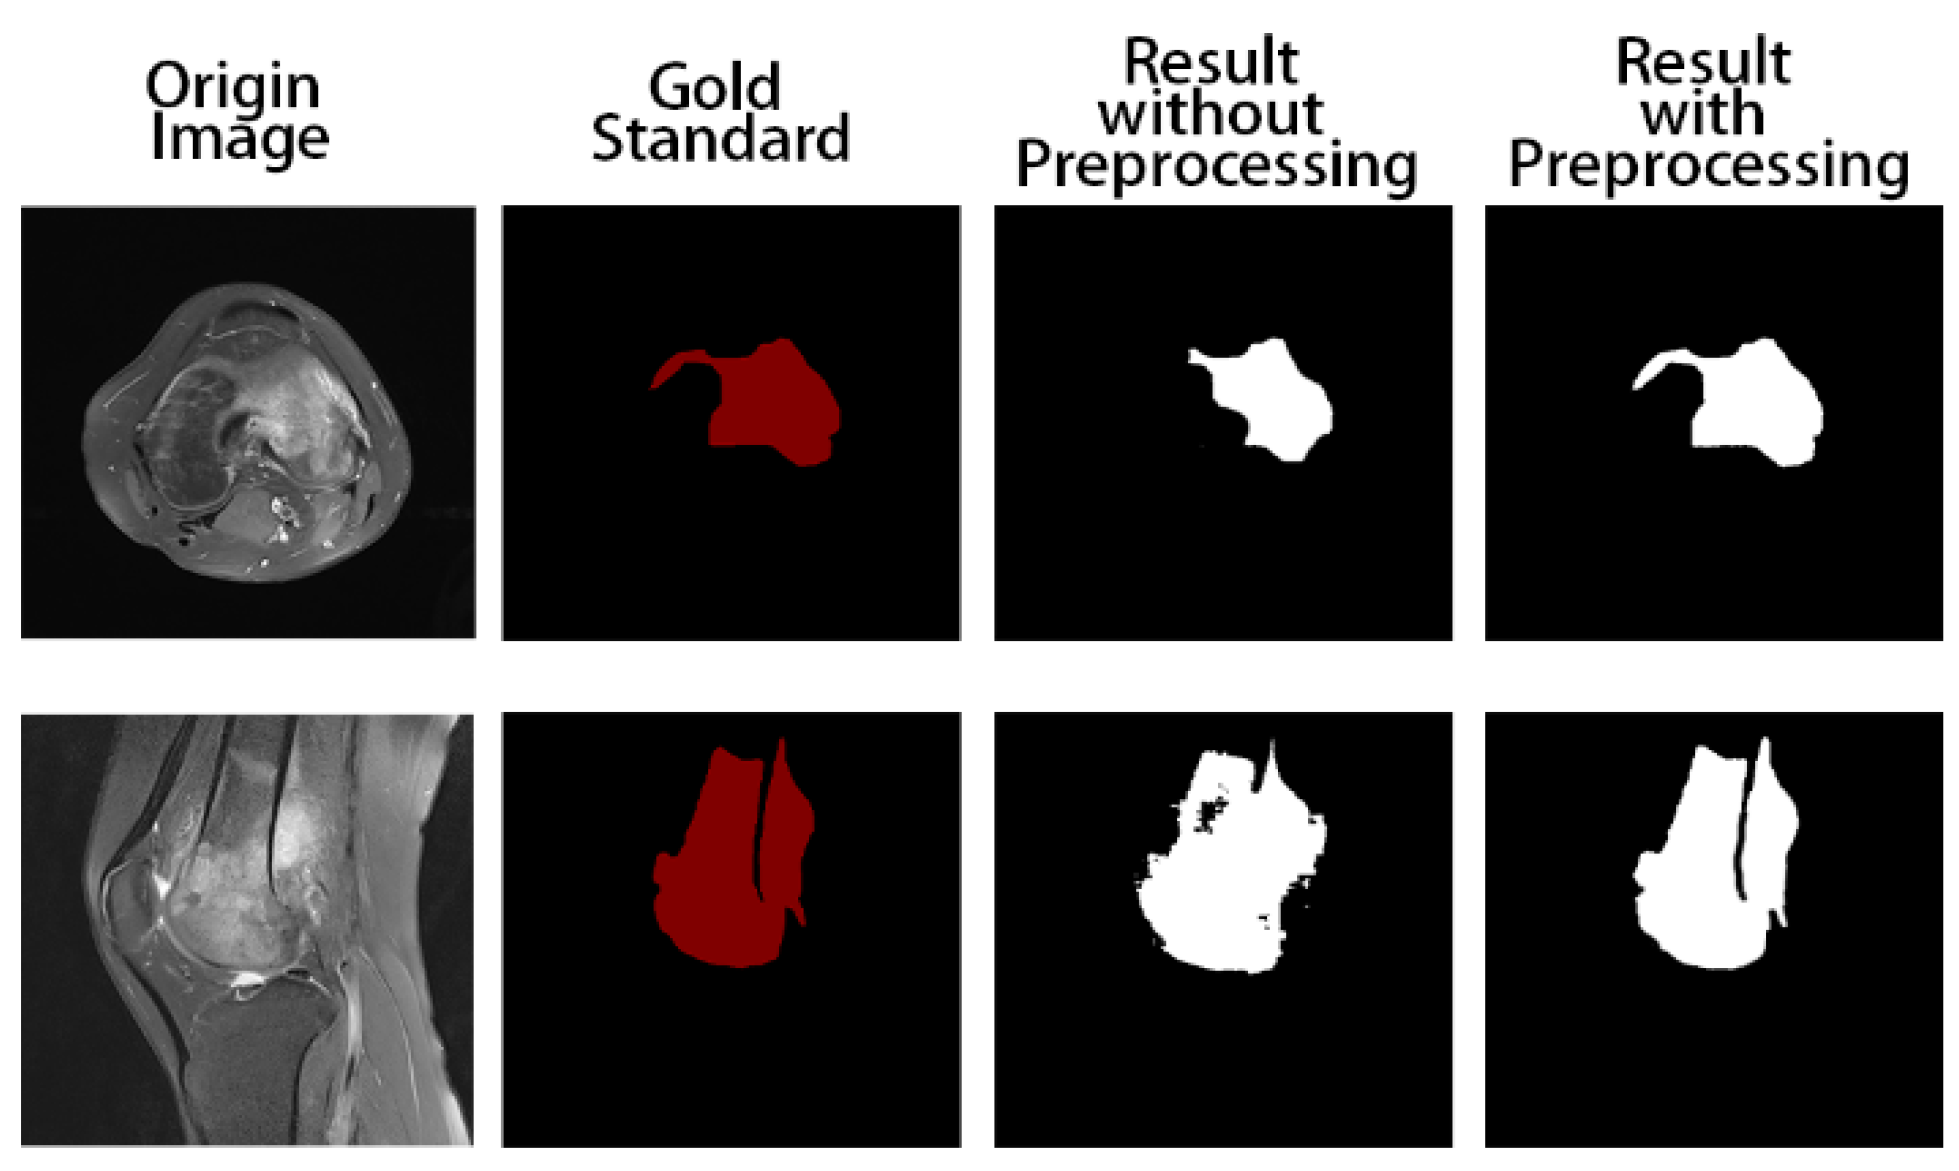
- In terms of data preprocessing, we use a simpler and more efficient processing method that maintains a good segmentation performance. We binarize and regularize the images to filter out the valid regions in the images and eliminate the effect of different brightness levels between images on the training. Additionally, we enhance the dataset to improve the generalization of the model.
- In terms of model design, we refactored the main component of AttendSeg, “Attention Condenser”. We use the attention mechanism and combine it with the residual structure to further enhance the attention of the model to the osteosarcoma region, so that the model can shift more attention to refine the details between regions in the osteosarcoma MRI image, and understand the global view of the image, correct the results in the reconstruction, and effectively improve the segmentation effect. In addition, we transformed the original general convolutional layer combination into a reserved block and a shrinkage block, which greatly reduces the number of parameters of the general convolutional operation and allows the model to better extract various features of the image and run more efficiently.
- In the output part of the model, we use the composite decision to integrate the output of multiple different angles of the same image and unify the results of the same source, which effectively enhances the accuracy and robustness of the output results. We plot the output results as a black-and-white image to assist the doctor’s diagnosis, thus greatly reducing the burden of the doctor’s film reading.
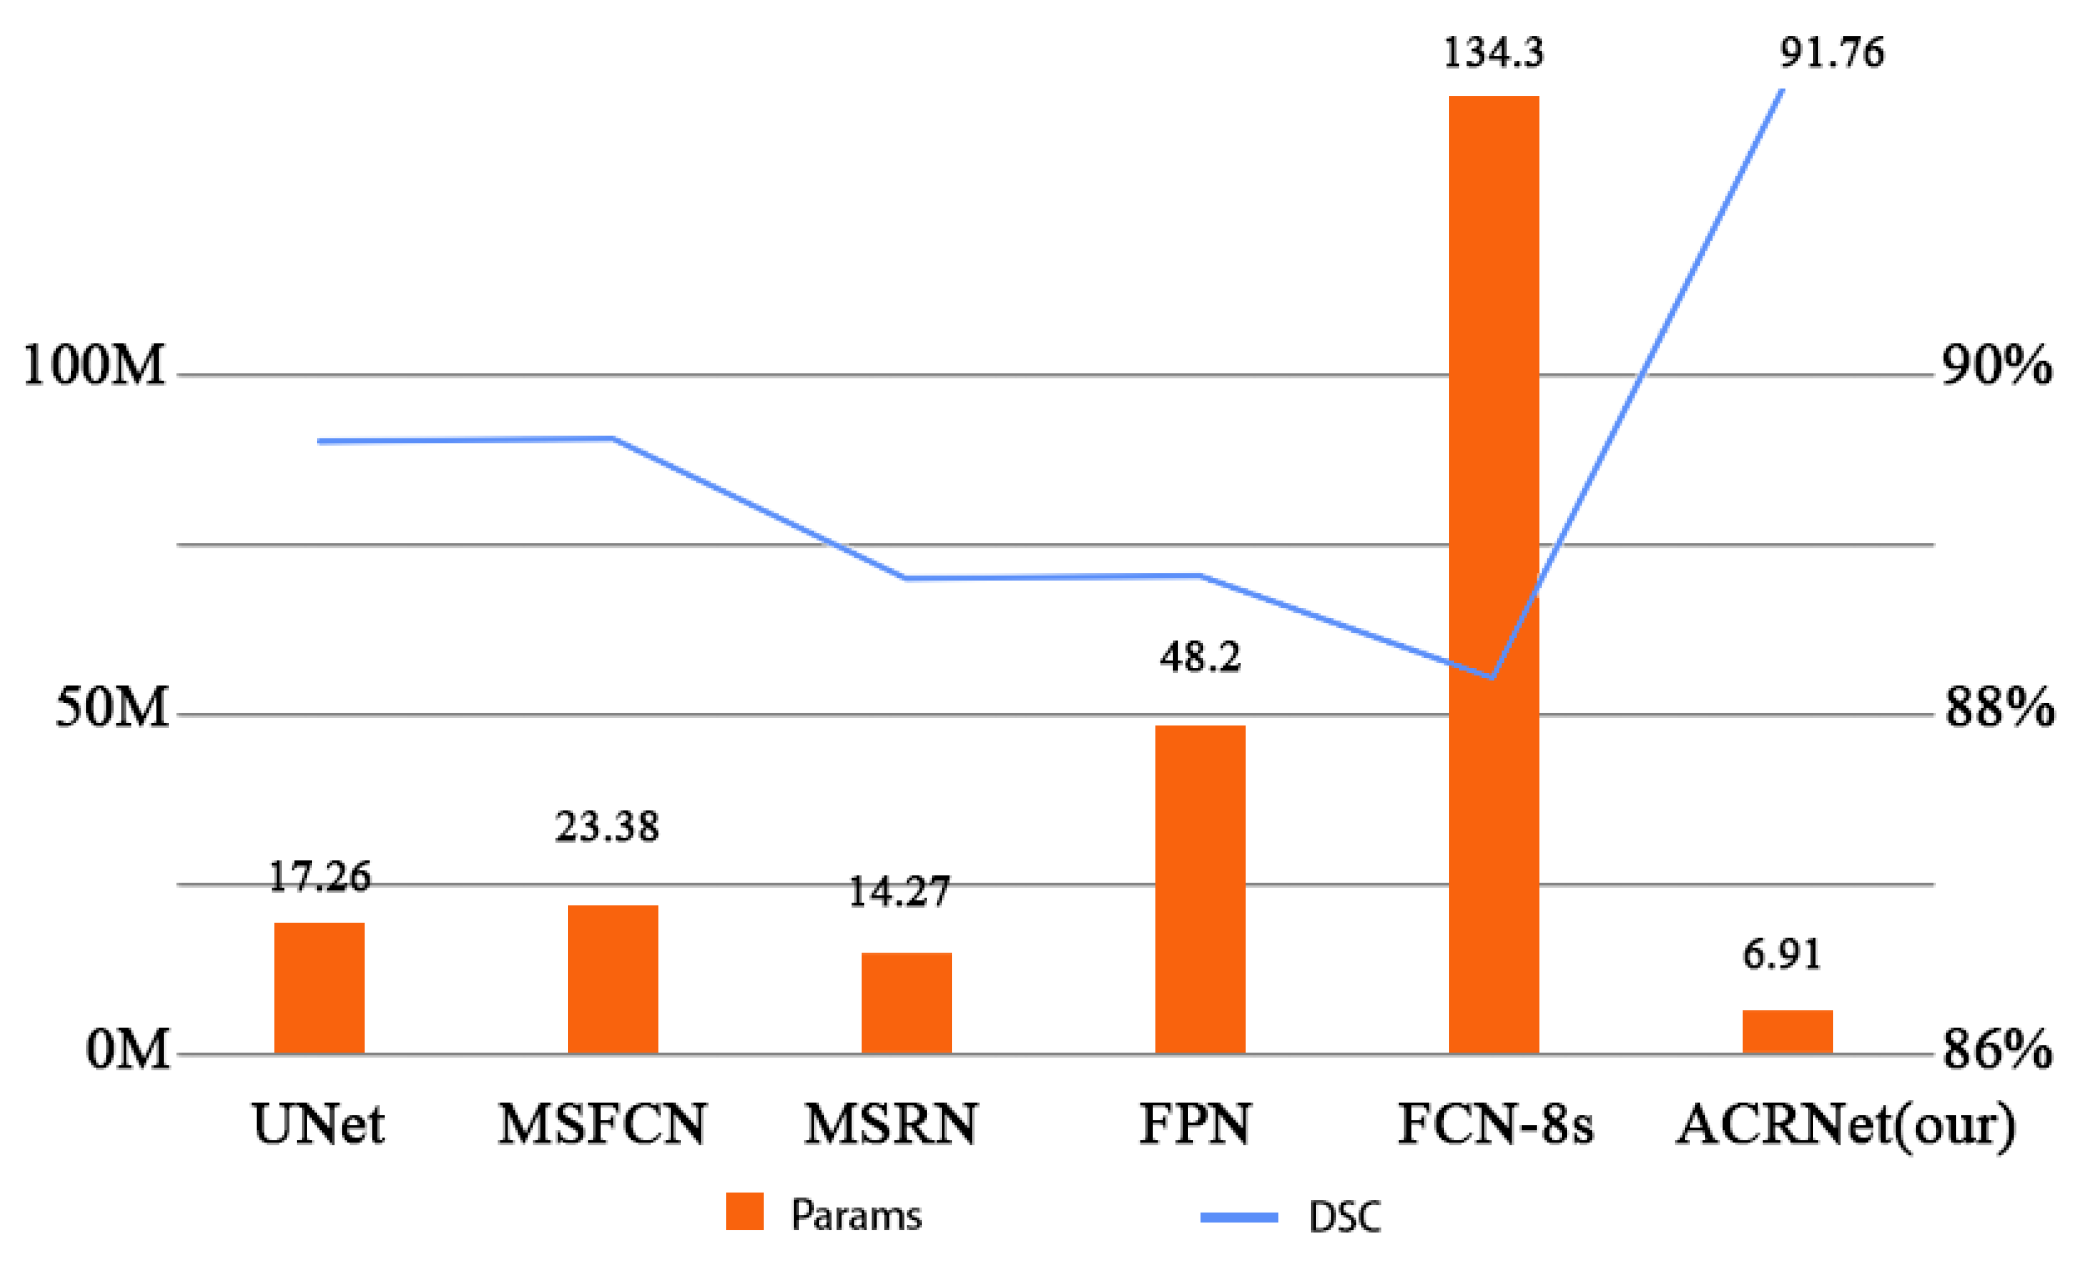
- In terms of the practicality of the segmentation system, the network has a lightweight structure with only 6.91 M parameters and a SETT value of 174, which makes the model simpler and more efficient in training and more adaptable to low-configuration medical equipment, which helps the implementation of the medical-assisted segmentation system on the ground. As a result, ACRNet ensures high accuracy in segmenting osteosarcoma MRI images while improving efficiency, which will save more human and financial resources for developing countries and improve the efficiency of osteosarcoma diagnosis in hospitals.
3. System Model Design
3.1. Data Preprocessing
- (1)
- The osteosarcoma MRI images in the dataset have different brightness and darkness due to different instruments, contrast agent dose, and other external environmental reasons;
- (2)
- The amount of data is still insufficient for training a model with high accuracy, and the training is prone to instability.
3.2. Brief Introduction of Attention
3.3. Osteosarcoma MRI Image Segmentation Model
- (1)
- The osteosarcoma MRI images will be rotated and flipped to obtain a group of pictures before each prediction of it.
- (2)
- The set of pictures from the previous step will be used as input for the residual network with multiple attention condensers, and a set of results will be output.
- (3)
- This group of results is inversely changed according to the original change direction to obtain a group of results consistent with the original image direction. This group of results is calculated and processed to obtain the final prediction tumor region.

3.4. Loss Function
4. Performance Evaluation
4.1. Dataset Introduction
4.2. Detection Index
4.3. Comparison Model
4.4. Operation Results and Analysis
5. Conclusions
Author Contributions
Funding
Institutional Review Board Statement
Informed Consent Statement
Data Availability Statement
Conflicts of Interest
References
- Rathore, R.; Van Tine, B. Pathogenesis and Current Treatment of Osteosarcoma: Perspectives for Future Therapies. J. Clin. Med. 2021, 10, 1182. [Google Scholar] [CrossRef] [PubMed]
- Harper, K.; Sathiadoss, P.; Saifuddin, A.; Sheikh, A. A review of imaging of surface sarcomas of bone. Skelet. Radiol. 2020, 50, 9–28. [Google Scholar] [CrossRef] [PubMed]
- Yang, C.; Tian, Y.; Zhao, F.; Chen, Z.; Su, P.; Li, Y.; Qian, A. Bone Microenvironment and Osteosarcoma Metastasis. Int. J. Mol. Sci. 2020, 21, 6985. [Google Scholar] [CrossRef] [PubMed]
- Zhao, Z.; Shi, J.; Zhao, G.; Gao, Y.; Jiang, Z.; Yuan, F. Large Scale Identification of Osteosarcoma Pathogenic Genes by Multiple Extreme Learning Machine. Front. Cell Dev. Biol. 2021, 9, 2654. [Google Scholar] [CrossRef] [PubMed]
- Jafari, F.; Javdansirat, S.; Sanaie, S.; Naseri, A.; Shamekh, A.; Rostamzadeh, D.; Dolati, S. Osteosarcoma: A comprehensive review of management and treatment strategies. Ann. Diagn. Pathol. 2020, 49, 151654. [Google Scholar] [CrossRef]
- Li, X.; Qi, H.; Wu, J. Efficient path-sense transmission based on IoT system in opportunistic social networks. Peer-to-Peer Netw. Appl. 2022, 15, 811–826. [Google Scholar] [CrossRef]
- Wu, J.; Gou, F.; Tan, Y. A Staging Auxiliary Diagnosis Model for Nonsmall Cell Lung Cancer Based on the Intelligent Medical System. Comput. Math. Methods Med. 2021, 2021, 6654946. [Google Scholar] [CrossRef]
- Wu, J.; Gou, F.; Tian, X. Disease Control and Prevention in Rare Plants Based on the Dominant Population Selection Method in Opportunistic Social Networks. Comput. Intell. Neurosci. 2022, 2022, 1489988. [Google Scholar] [CrossRef]
- Gou, F.; Wu, J. Message Transmission Strategy Based on Recurrent Neural Network and Attention Mechanism in Iot System. J. Circuits Syst. Comput. 2022, 31, 2250126. [Google Scholar] [CrossRef]
- Li, X.; Qi, H.; Wu, J. Node Social Nature Detection OSN Routing Scheme Based on IoT System. IEEE Internet Things J. 2022, 9, 14048–14059. [Google Scholar] [CrossRef]
- Gou, F.; Wu, J. Triad link prediction method based on the evolutionary analysis with IoT in opportunistic social networks. Comput. Commun. 2021, 181, 143–155. [Google Scholar] [CrossRef]
- Wu, J.; Xia, J.; Gou, F. Information transmission mode and IoT community reconstruction based on user influence in opportunistic social networks. Peer-to-Peer Netw. Appl. 2022, 15, 1398–1416. [Google Scholar] [CrossRef]
- Shen, Y.; Gou, F.; Dai, Z. Osteosarcoma MRI Image-Assisted Segmentation System Base on Guided Aggregated Bilateral Network. Mathematics 2022, 10, 1090. [Google Scholar] [CrossRef]
- Jiao, Y.; Qi, H.; Wu, J. Capsule network assisted electrocardiogram classification model for smart healthcare. Biocybern. Biomed. Eng. 2022, 42, 543–555. [Google Scholar] [CrossRef]
- Zhuang, Q.; Dai, Z.; Wu, J. Deep Active Learning Framework for Lymph Node Metastasis Prediction in Medical Support System. Comput. Intell. Neurosci. 2022, 2022, 4601696. [Google Scholar] [CrossRef] [PubMed]
- Li, L.; Gou, F.; Wu, J. Modified Data Delivery Strategy Based on Stochastic Block Model and Community Detection in Opportunistic Social Networks. Wirel. Commun. Mob. Comput. 2022, 2022, 5067849. [Google Scholar] [CrossRef]
- Lv, B.; Liu, F.; Gou, F.; Wu, J. Multi-Scale Tumor Localization Based on Priori Guidance-Based Segmentation Method for Osteosarcoma MRI Images. Mathematics 2022, 10, 2099. [Google Scholar] [CrossRef]
- Liu, F.; Gou, F.; Wu, J. An Attention-Preserving Network-Based Method for Assisted Segmentation of Osteosarcoma MRI Images. Mathematics 2022, 10, 1665. [Google Scholar] [CrossRef]
- Shen, Y.; Gou, F.; Wu, J. Node Screening Method Based on Federated Learning with IoT in Opportunistic Social Networks. Mathematics 2022, 10, 1669. [Google Scholar] [CrossRef]
- Wang, Z.; Jiao, Y.; Wu, J. User-optimized data transmission scheduling based on edge community service in opportunistic social network. IET Commun. 2022, 16, 1838–1852. [Google Scholar] [CrossRef]
- Kamel, Z.S.A.S.A.; El-Shafey, M.H.R.; Hassanien, O.A.; Nagy, H.A. Can dynamic magnetic resonance imaging replace static magnetic resonance sequences in evaluation of temporomandibular joint dysfunction? Egypt. J. Radiol. Nucl. Med. 2021, 52, 19. [Google Scholar] [CrossRef]
- Ponti, M.; Kittler, J.; Riva, M.; de Campos, T.; Zor, C. A decision cognizant Kullback–Leibler divergence. Pattern Recognit. 2017, 61, 470–478. [Google Scholar] [CrossRef]
- Binsar, F.; Eryanto, E.; Wahyudi, I.; Sugandi, Y.; Suroso, J.S. Risk of Invalidation of Data in Hospital Information Systems in In-donesia. In Proceedings of the 2020 International Conference on Information Management and Technology (ICIMTech), Bandung, Indonesia, 13–14 August 2020. [Google Scholar]
- Cui, R.; Chen, Z.; Wu, J.; Tan, Y.; Yu, G. A Multiprocessing Scheme for PET Image Pre-Screening, Noise Reduction, Segmentation and Lesion Partitioning. IEEE J. Biomed. Health Inform. 2020, 25, 1699–1711. [Google Scholar] [CrossRef]
- Yu, G.; Chen, Z.; Wu, J.; Tan, Y. A diagnostic prediction framework on auxiliary medical system for breast cancer in developing countries. Knowl.-Based Syst. 2021, 232, 107459. [Google Scholar] [CrossRef]
- Tian, X.; Yan, L.; Jiang, L.; Xiang, G.; Li, G.; Zhu, L.; Wu, J. Comparative transcriptome analysis of leaf, stem, and root tissues of Semiliquidambar cathayensis reveals candidate genes involved in terpenoid biosynthesis. Mol. Biol. Rep. 2022, 49, 5585–5593. [Google Scholar] [CrossRef] [PubMed]
- Gou, F.; Wu, J. Data Transmission Strategy Based on Node Motion Prediction IoT System in Opportunistic Social Networks. Wirel. Pers. Commun. 2022, 126, 1751–1768. [Google Scholar] [CrossRef]
- Li, L.; Gou, F.; Long, H.; He, K.; Wu, J. Effective Data Optimization and Evaluation Based on Social Communication with AI-Assisted in Opportunistic Social Networks. Wirel. Commun. Mob. Comput. 2022, 2022, 4879557. [Google Scholar] [CrossRef]
- Wu, J.; Xiao, P.; Huang, H.; Gou, F.; Zhou, Z.; Dai, Z. An artificial intelligence multiprocessing scheme for the diagnosis of osteosarcoma MRI images. IEEE J. Biomed. Health Inform. 2022, 26, 4656–4667. [Google Scholar] [CrossRef]
- Qin, Y.; Li, X.; Wu, J.; Yu, K. A management method of chronic diseases in the elderly based on IoT security environment. Comput. Electr. Eng. 2022, 102, 108188. [Google Scholar] [CrossRef]
- Wu, J.; Guo, Y.; Gou, F.; Dai, Z. A medical assistant segmentation method for MRI images of osteosarcoma based on DecoupleSegNet. Int. J. Intell. Syst. 2022, 37, 8436–8461. [Google Scholar] [CrossRef]
- Wu, J.; Liu, Z.; Gou, F.; Zhu, J.; Tang, H.; Zhou, X.; Xiong, W. BA-GCA Net: Boundary-Aware Grid Contextual Attention Net in Osteosarcoma MRI Image Segmentation. Comput. Intell. Neurosci. 2022, 2022, 3881833. [Google Scholar] [CrossRef] [PubMed]
- Wu, J.; Zhou, L.; Gou, F.; Tan, Y. A Residual Fusion Network for Osteosarcoma MRI Image Segmentation in Developing Countries. Comput. Intell. Neurosci. 2022, 2022, 7285600. [Google Scholar] [CrossRef] [PubMed]
- Xiong, W.; Chen, H.; Jiao, Y.; Yang, M.; Zhou, X. A User Cache Management and Cooperative Transmission Mechanism Based on Edge Community Computing in Opportunistic Social Networks. IET Commun. 2022, 16, 2045–2058. [Google Scholar] [CrossRef]
- Yu, G.; Chen, Z.; Wu, J.; Tan, Y. Medical decision support system for cancer treatment in precision medicine in developing countries. Expert Syst. Appl. 2021, 186, 115725. [Google Scholar] [CrossRef]
- Liu, F.; Zhu, J.; Lv, B.; Yang, L.; Sun, W.; Dai, Z.; Gou, F.; Wu, J. Auxiliary Segmentation Method of Osteosarcoma MRI Image Based on Transformer and U-Net. Comput. Intell. Neurosci. 2022, 2022, 9990092. [Google Scholar] [CrossRef]
- Wu, J.; Yu, L.; Gou, F. Data transmission scheme based on node model training and time division multiple access with IoT in opportunistic social networks. Peer-to-Peer Netw. Appl. 2022, 15, 2719–2743. [Google Scholar] [CrossRef]
- Wu, J.; Yang, S.; Gou, F.; Zhou, Z.; Xie, P.; Xu, N.; Dai, Z. Intelligent Segmentation Medical Assistance System for MRI Images of Osteosarcoma in Developing Countries. Comput. Math. Methods Med. 2022, 2022, 7703583. [Google Scholar] [CrossRef]
- Chen, H.; Liu, J.; Cheng, Z.; Lu, X.; Wang, X.; Lu, M.; Li, S.; Xiang, Z.; Zhou, Q.; Liu, Z.; et al. Development and external validation of an MRI-based radiomics nomogram for pretreatment prediction for early relapse in osteosarcoma: A retrospective multicenter study. Eur. J. Radiol. 2020, 129, 109066. [Google Scholar] [CrossRef]
- Georgeanu, V.; Mamuleanu, M.L.; Selişteanu, D. Convolutional neural networks for automated detection and classification of bone tumors in magnetic resonance imaging. In Proceedings of the 2021 IEEE International Conference on Artificial Intelligence, Robotics, and Communication (ICAIRC), Fuzhou, China, 25–27 June 2021; pp. 5–7. [Google Scholar]
- Wen, X.; Famouri, M.; Hryniowski, A.; Wong, A. AttendSeg: A Tiny Attention Condenser Neural Network for Semantic Segmentation on the Edge. arXiv 2021, arXiv:2104.14623. [Google Scholar]
- Wong, A.; Famouri, M.; Pavlova, M.; Surana, S. Tinyspeech: Attention condensers for deep speech recognition neural networks on edge devices. arXiv 2020, arXiv:2008.04245. [Google Scholar]
- Nasor, M.; Obaid, W. Segmentation of osteosarcoma in mri images by k-means clustering, chan-vese segmentation, and iterative gaussian filtering. IET Image Process. 2021, 15, 1310–1318. [Google Scholar] [CrossRef]
- Kayal, E.B.; Kandasamy, D.; Sharma, R.; Bakhshi, S.; Mehndiratta, A. Segmentation of osteosarcoma tumor using diffusion weighted MRI: A comparative study using nine segmentation algorithms. Signal Image Video Process. 2019, 14, 727–735. [Google Scholar] [CrossRef]
- Nabid, R.A.; Rahman, M.L.; Hossain, M.F. Classification of Osteo-sarcoma Tumor from Histological Image Using Sequential RCNN. In Proceedings of the 2020 11th International Conference on Electrical and Computer Engineering (ICECE), Dhaka, Bangladesh, 17–19 December 2020; pp. 363–366. [Google Scholar] [CrossRef]
- Arunachalam, H.B.; Mishra, R.; Daescu, O.; Cederberg, K.; Rakheja, D.; Sengupta, A.; Leonard, D.; Hallac, R.; Leavey, P. Viable and necrotic tumor assessment from whole slide images of osteosarcoma using machine-learning and deep-learning models. PLoS ONE 2019, 14, e0210706. [Google Scholar] [CrossRef] [PubMed]
- Dionísio, F.; Oliveira, L.; Hernandes, M.; Engel, E.; Rangayyan, R.; Azevedo-Marques, P.; Nogueira-Barbosa, M. Manual and semiautomatic segmentation of bone sarcomas on MRI have high similarity. Braz. J. Med. Biol. Res. 2020, 53, e8962. [Google Scholar] [CrossRef]
- Badashah, S.J.; Basha, S.S.; Ahamed, S.R.; Rao, S.P.V.S. Fractional-Harris hawks optimization-based generative adversarial network for osteosarcoma detection using Renyi entropy-hybrid fusion. Int. J. Intell. Syst. 2021, 36, 6007–6031. [Google Scholar] [CrossRef]
- Anisuzzaman, D.; Barzekar, H.; Tong, L.; Luo, J.; Yu, Z. A deep learning study on osteosarcoma detection from histological images. Biomed. Signal Process. Control 2021, 69, 102931. [Google Scholar] [CrossRef]
- Shirly, S.; Ramesh, K. Review on 2D and 3D MRI Image Segmentation Techniques. Curr. Med. Imaging Former. Curr. Med. Imaging Rev. 2019, 15, 150–160. [Google Scholar] [CrossRef]
- Ronneberger, O.; Fischer, P.; Brox, T. U-net: Convolutional networks for biomedical image segmentation. In Proceedings of the International Conference on Medical Image Computing and Computer-Assisted Intervention, Munich, Germany, 5–9 October 2015; Springer: Berlin/Heidelberg, Germany, 2015; pp. 234–241. [Google Scholar]
- Song, S.; Gao, T. Research on image segmentation algorithm based on threshold. In Proceedings of the 2021 13th International Conference on Measuring Technology and Mechatronics Automation (ICMTMA), Beihai, China, 16–17 January 2021; pp. 306–308. [Google Scholar] [CrossRef]
- Gao, J.; Wang, B.; Wang, Z.; Wang, Y.; Kong, F. A wavelet transform-based image segmentation method. Opt.-Int. J. Light Electron. Opt. 2019, 208, 164123. [Google Scholar] [CrossRef]
- Liu, F. Susan: Segment unannotated image structure using adversarial network. Magn. Reson. Med. 2018, 81, 3330–3345. [Google Scholar] [CrossRef]
- Huang, L.; Xia, W.; Zhang, B.; Qiu, B.; Gao, X. MSFCN-multiple supervised fully convolutional networks for the osteosarcoma segmentation of CT images. Comput. Methods Programs Biomed. 2017, 143, 67–74. [Google Scholar] [CrossRef]
- Rui, Z.; Lin, H.; Wei, X.; Bo, Z.; Qiub, B. Multiple supervised residual network for osteosarcoma segmentation in ct images. Comput. Med. Imaging Graph. 2018, 63, 1–8. [Google Scholar]
- Lin, T.Y.; Dollár, P.; Girshick, R.; He, K.; Hariharan, B.; Belongie, S. Feature pyramid networks for object detection. In Proceedings of the 30th IEEE Conference on Computer Vision and Pattern Recognition, CVPR 2017, Honolulu, HI, USA, 21–26 July 2017; pp. 936–944. [Google Scholar] [CrossRef]
- Shelhamer, E.; Long, J.; Darrell, T. Fully convolutional networks for semantic segmentation. IEEE Trans. Pattern Anal. Mach. Intell. 2017, 39, 640–651. [Google Scholar] [CrossRef]
- Gou, F.; Liu, J.; Zhu, J.; Wu, J. A Multimodal Auxiliary Classification System for Osteosarcoma Histopathological Images Based on Deep Active Learning. Healthcare 2022, 10, 2189. [Google Scholar] [CrossRef] [PubMed]
- Wang, L.; Yu, L.; Zhu, J.; Tang, H.; Gou, F.; Wu, J. Auxiliary Segmentation Method of Osteosarcoma in MRI Images Based on Denoising and Local Enhancement. Healthcare 2022, 10, 1468. [Google Scholar] [CrossRef] [PubMed]


| Symbol | Represent Meaning |
|---|---|
| The value of pixel P’s color in the picture after binarization | |
| The average value of all pixels’ color values in the picture | |
| The regularized value of pixel P’s color value in the picture | |
| The highest color value and the lowest color value in a picture | |
| The final output result of the (j, k)th pixel on the picture | |
| The value of the (j, k)th pixel of ith output picture | |
| Tversky Loss Function with α and β as variable | |
| The ith pixel value of the prediction result and the true result, with a value of 0 or 1 | |
| The value added to avoid the division of 0 by 0, with a value of 1 × 10⁻⁸ |
| Aspect | Concrete Content | |
|---|---|---|
| Environment | Operating System | Ubuntu18.04.5 LTS |
| CPU | Intel(R) Xeon(R) E5-2630L | |
| Memory | 30G | |
| GPU | GTX 3060 12 GB | |
| Parameter | Learning Rate | 0.0001 |
| Epoch | 460 | |
| Experimenting Time | 7 h~8 h | |
| Model | Accuracy | Recall | F1-Score | IOU | DSC | Params | SETT |
|---|---|---|---|---|---|---|---|
| UNet | 0.9901 | 0.9294 | 0.9241 | 0.8672 | 0.8927 | 17.26 M | 295 |
| MSFCN | 0.9917 | 0.9355 | 0.9059 | 0.8439 | 0.8929 | 23.38 M | 306 |
| MSRN | 0.9880 | 0.9022 | 0.8662 | 0.8203 | 0.8832 | 14.27 M | 288 |
| FPN | 0.9896 | 0.9238 | 0.9215 | 0.8518 | 0.8834 | 48.20 M | 481 |
| FCN | 0.9891 | 0.9014 | 0.9213 | 0.8245 | 0.8763 | 134.3 M | 783 |
| Ours | 0.9943 | 0.9408 | 0.9377 | 0.8848 | 0.9176 | 6.91 M | 174 |
Publisher’s Note: MDPI stays neutral with regard to jurisdictional claims in published maps and institutional affiliations. |
© 2022 by the authors. Licensee MDPI, Basel, Switzerland. This article is an open access article distributed under the terms and conditions of the Creative Commons Attribution (CC BY) license (https://creativecommons.org/licenses/by/4.0/).
Share and Cite
Tang, H.; Huang, H.; Liu, J.; Zhu, J.; Gou, F.; Wu, J. AI-Assisted Diagnosis and Decision-Making Method in Developing Countries for Osteosarcoma. Healthcare 2022, 10, 2313. https://doi.org/10.3390/healthcare10112313
Tang H, Huang H, Liu J, Zhu J, Gou F, Wu J. AI-Assisted Diagnosis and Decision-Making Method in Developing Countries for Osteosarcoma. Healthcare. 2022; 10(11):2313. https://doi.org/10.3390/healthcare10112313
Chicago/Turabian StyleTang, Haojun, Hui Huang, Jun Liu, Jun Zhu, Fangfang Gou, and Jia Wu. 2022. "AI-Assisted Diagnosis and Decision-Making Method in Developing Countries for Osteosarcoma" Healthcare 10, no. 11: 2313. https://doi.org/10.3390/healthcare10112313
APA StyleTang, H., Huang, H., Liu, J., Zhu, J., Gou, F., & Wu, J. (2022). AI-Assisted Diagnosis and Decision-Making Method in Developing Countries for Osteosarcoma. Healthcare, 10(11), 2313. https://doi.org/10.3390/healthcare10112313