Abstract
In this paper, a dynamic model of cytosolic calcium concentration () oscillations is established for mast cells (MCs). This model includes the cytoplasm (Cyt), endoplasmic reticulum (ER), mitochondria (Mt), and functional region (μd), formed by the ER and Mt, also with channels in these cellular compartments. By this model, we calculate oscillations that are driven by distinct mechanisms at varying (degradation coefficient of inositol 1,4,5-trisphosphate, and production coefficient of ), as well as at different distances between the ER and Mt (ER–Mt distance). The model predicts that (i) Mt and μd compartments can reduce the amplitude of oscillations, and cause the ER to release less during oscillations; (ii) with increasing cytosolic concentration (), the amplitude of oscillations increases (from 0.1 μM to several μM), but the frequency decreases; (iii) the frequency of oscillations decreases as the ER–Mt distance increases. What is more, when the ER–Mt distance is greater than 65 nm, the μd compartment has less effect on oscillations. These results suggest that Mt, μd, and can all affect the amplitude and frequency of oscillations, but the mechanism is different. The model provides a comprehensive mechanism for predicting cytosolic concentration oscillations in mast cells, and a theoretical basis for calcium oscillations observed in mast cells, so as to better understand the regulation mechanism of calcium signaling in mast cells.
1. Introduction
In recent years, more and more studies have found that mast cells (MCs) play a major role in the mechanism of acupuncture effect, and substances such as histamine and leukotriene, secreted by mast cells in the process of acupuncture, may be the key factors affecting acupuncture [1]. As an important second messenger, calcium signaling widely exists in various cell physiological processes, participating in the regulation of neurotransmitters released by neurons and astrocytes, metabolic processes, cell maturation, differentiation, and death [2,3,4,5]. The increase in cytosolic concentration () can be divided into the following two pathways: (i) the release of from the intracellular stores, mainly the endoplasmic reticulum (ER, the largest store), or (ii) extracellular influx to cytosol (Cyt), through the opening of plasma membrane channels. It has been widely accepted that release-activated (CARC) channels are the main mode of influx in electrically non-excitable cells, including MCs [6]. Meanwhile, it is also known that ER calcium depletion activates CRAC channels on the plasma membrane, leading to extracellular influx and endoplasmic reticulum supplementation. interacts with Ca2+ channels in the ER, causing the release of stored , and the depletion of in the ER triggers entry through CRAC channels. CRAC channels in MCs are non-voltage-gated and show a characteristic inward rectification [7]. Therefore, the flow of CRAC channels is related to the concentration of the ER and Cyt. In contrast to the CRAC channels, the plasma membrane -ATPase (PMCA) channels extrude to the extracellular space, to maintain calcium concentration balance. They can transfer against the concentration gradient in the presence of ATP [8]. Previously, we believed that the mitochondria (Mt, the second largest calcium store) only play a role in regulating cytosolic calcium concentration under the pathological condition of very high intracellular calcium ion concentration [9]. Until the 1990s, there were studies demonstrating that the non-pathological increase of cytosolic calcium concentration was accompanied by concentration increasing in the mitochondrial matrix () [10]. Moreover, recent studies have shown that the Mt regulate oscillations by firstly uptaking , and subsequently releasing it [11,12,13,14]. The evidence was supported by the discovery of the functional region formed by the ER and Mt (μd) [15,16,17]. The functional region is composed of the Mt membrane, ER membrane, and Cyt between them. However, the assumption distances of μd vary hugely, from less than 10 nm to more than 200 nm [18]. When mast cells are mechanically stimulated, the intracellular concentration will increase, then leukotriene () will be produced, which can activate phospholipase C (), to promote decomposition to [19]. Subsequently, binds to the inositol 1,4,5-trisphosphate receptor () on the ER membrane, which induces release from the ER. is regulated by in a biphasic manner (stimulatory at low levels/inhibitory at high levels) [19,20,21,22]. The mitochondrial uniporter (MCU) in mitochondria uptakes quickly when exposed to high concentration environments around the opened channel pore. MCs are activated by mechanical stimulation, and the concentration in μd can reach more than 10 times that in the cytoplasm, which was enough to activate the mitochondrial MCU channel and allow uptake [23,24,25]. This explains why high is observed when global is low.
In order to better explore the physiological mechanism of calcium oscillations, researchers have carried out a large number of experiments. For example, Joseph Di Capite et al. [26] recorded calcium waves in mast cells, and studied the effects of CARC channels on them. Osipchuk et al. [27] studied the effect of ATP on calcium signaling spread between mast cells, and recorded the calcium signaling. At the same time, mathematical modeling can establish the internal relationship between experimental data and parameters, and predict the possible phenomena, so as to save time and cost. In the early years, Goldbeter et al. [28], Hofer [29], and Li and Rinzel [30] described calcium oscillations that only consider the function of the endoplasmic reticulum, while little consider the influences of the mitochondria. Based on the dynamic model proposed by Othmer-Tang et al., Falcke et al. [31] added the mitochondrial cycle equation into the model. Shi [32] and Qi et al. [33] established a theoretical model, considering the influences of the mitochondria. They explored the effect of the interaction between the mitochondria and the endoplasmic reticulum on calcium oscillations. Arash Moshkforoush et al. [34] developed a compartmental closed-cell mathematical model of dynamics that includes a functional region between the ER and Mt. However, they do not consider the effect of plasma membrane calcium channels and the extracellular concentration on intracellular calcium oscillations. Although there are many mathematical models that describe calcium oscillations, most of them only consider the effects of the endoplasmic reticulum. Therefore, in order to explain the calcium signaling observed in mast cells, and explore the influence of each compartment on oscillations more accurately, a comprehensive dynamic model of oscillations is established in this paper. This model takes the following cellular compartments into account: plasma membrane (Mem), cytoplasm (Cyt), endoplasmic reticulum (ER), and mitochondria (Mt). The major channels and buffering in these compartments are considered. The functional region formed by the ER and Mt (μd) is explicitly assumed as a pool. The degradation and production of is added to this model, to investigate the effect of dynamics on oscillations.
2. Mathematical Model
The full model includes plasma membrane channels, and degradation and production of , Cyt, ER, Mt, and μd. MCs will release after they are activated by mechanical stimuli. Then, bines to to trigger the intracellular signal. The whole progress is shown in Figure 1. Calcium dynamics in each compartment are governed by a balance of fluxes, leaks, and buffering processes.
Figure 1.
Schematic diagram of the regulation mechanism of cellular calcium concentration. After stimulation, enters the mast cell through the release-activated (CARC) channels on Mem and increases . Then is catalyzed by PLC to produce . binds to to activate releases from ER. Endoplasmic reticulum -ATPase (SERCA) pump uptakes to ER. leaks from ER by leak channel. Mt uptakes through the MCU channel and extrudes via the mitochondrial / exchanger (mNCX). These channels in ER and Mt can face either Cyt or μd. and can diffuse between Cyt and μd. is extruded from Cyt to extracellular matrix through the plasma membrane -ATPase (PMCA) channels. means calcium fluxes, such as means the outflux of channels.
2.1. Cross-Membrane Current
According to previous researches, we accept that CRAC channels and plasma membrane -ATPase (PMCA) channels are the main channels in MCs [33]. CRAC channels are influx channels, and PMCA channels are outflux channels. The CRAC current is given by the Hodgkin–Huxley (HH) model [35], as follows:
where is the conductance, is the membrane potential, and is the Nernst potential for , , where is the universal gas constant, is the absolute temperature, = 2 is the valence of , and is the Faraday constant. is the proportion of CRAC channels in open state, and it is assumed as follows [35]:
The PMCA current is given by the following [36]:
where is the maximum PMCA current, and is the concentration for the half activation of PMCA channels.
2.2. Outflows from ER
The calcium outflow from the ER to Cyt or , through channels, is defined as follows:
where is the maximum total flux through channels [33], and and are the open probabilities of channels facing the Cyt and μd, respectively, and they are defined as follows [33]:
where and express the probability of the activated subunit, respectively, and are defined by sigmoidal functions of and , and is the slow inactivation gating variable, defined as follows:
for , it is the following:
where , , , , and are parameters.
For dynamics, the production speed of is related to PLC, and the production of phospholipase C isoforms depends on , so the production speed of is defined as follows:
for , it is as follows:
where is the maximal production rate of PLC isoforms, and is the sensitivity of PLC to .
is degraded through phosphorylation by kinases. The kinetic equation can be written as follows:
for , it as follows:
where represents the phosphorylation rate constants, and is the half-saturation constant of kinases.
leaks from μd to Cyt can be defined as follows:
Therefore, the change in and can be written as follows:
SERCA pumps transport into the ER, and the flux from Cyt to the ER is defined as follows:
the flux from μd to the ER is defined as follows:
where is the maximal flux through SERCA, and is the activation constant for SERCA.
leaks from the the ER are driven by the concentration gradients between the ER and either the Cyt or μd. The leak from the ER into the Cyt is defined as follows:
and the leak from the ER into the μd is defined as follows:
Although the μd is not a membrane-bound compartment, we similarly define the leak from the μd into the Cyt as follows:
2.3. Outflows from Mt
In the Mt, the mNCX channels exchange one for three . Flux through mNCX channels facing the Cyt is defined as follows:
and for mNCX channels facing the μd, it is as follows:
where and are the concentration of in Cyt and μd, respectively. is the maximal flux through the mNCX, and and are and activation constants for mNCX, respectively. The connectivity coefficient is the proportion of mNCX channels facing the μd.
The MCU channel transports into the Mt. Flux through the MCU to the Cyt is defined as follows:
and to the μd, it is as follows:
where , and . represents the maximal flux through the MCU, and is the voltage driving force. is the inner mitochondrial membrane voltage (150~180 mV, negative inside). and are the fitting parameters obtained from Qi [33]. During the simulations, we assume a constant of 170 mV, as experimental evidence suggests that does not change significantly in response to transient cytosolic increase, produced by -generating agonists [37,38,39]. is the activation constant for MCU, and the connectivity coefficient is the proportion of MCU channels facing the μd.
2.4. Effective Cytosol
Since the μd is a part of the cytosol, we defined the of the effective cytosolic compartment as the volume-weighted average of within the combined Cyt and μd compartments.
2.5. μd Volume
We assumed that each mitochondrion is a sphere, and 20% of its surface area closes to the ER [18,40]. Some experimental data suggest that the diameters of mitochondria are 0.5~1.5 μm [41]; here, we choose 0.58 μm. There are about two hundred (N) mitochondria in each cell. Thus, we calculate the volume of the μd compartment as follows:
where is the surface area, is the mitochondria total number, and is the ER–Mt distance.
2.6. Temporal Changes in in Each Compartment
Temporal changes in in each compartment are represented as the following ordinary differential equations:
in cytosol, it is the following:
in the ER, it is the following:
in the Mt, it is the following:
in μd, it is the following:
where (i = Cyt, ER, Mt, μd) is the buffer factor of each compartment, which is defined as follows [36]:
The parameter values related to our model are given in Table 1.
Table 1.
Parameters of the model.
3. Results
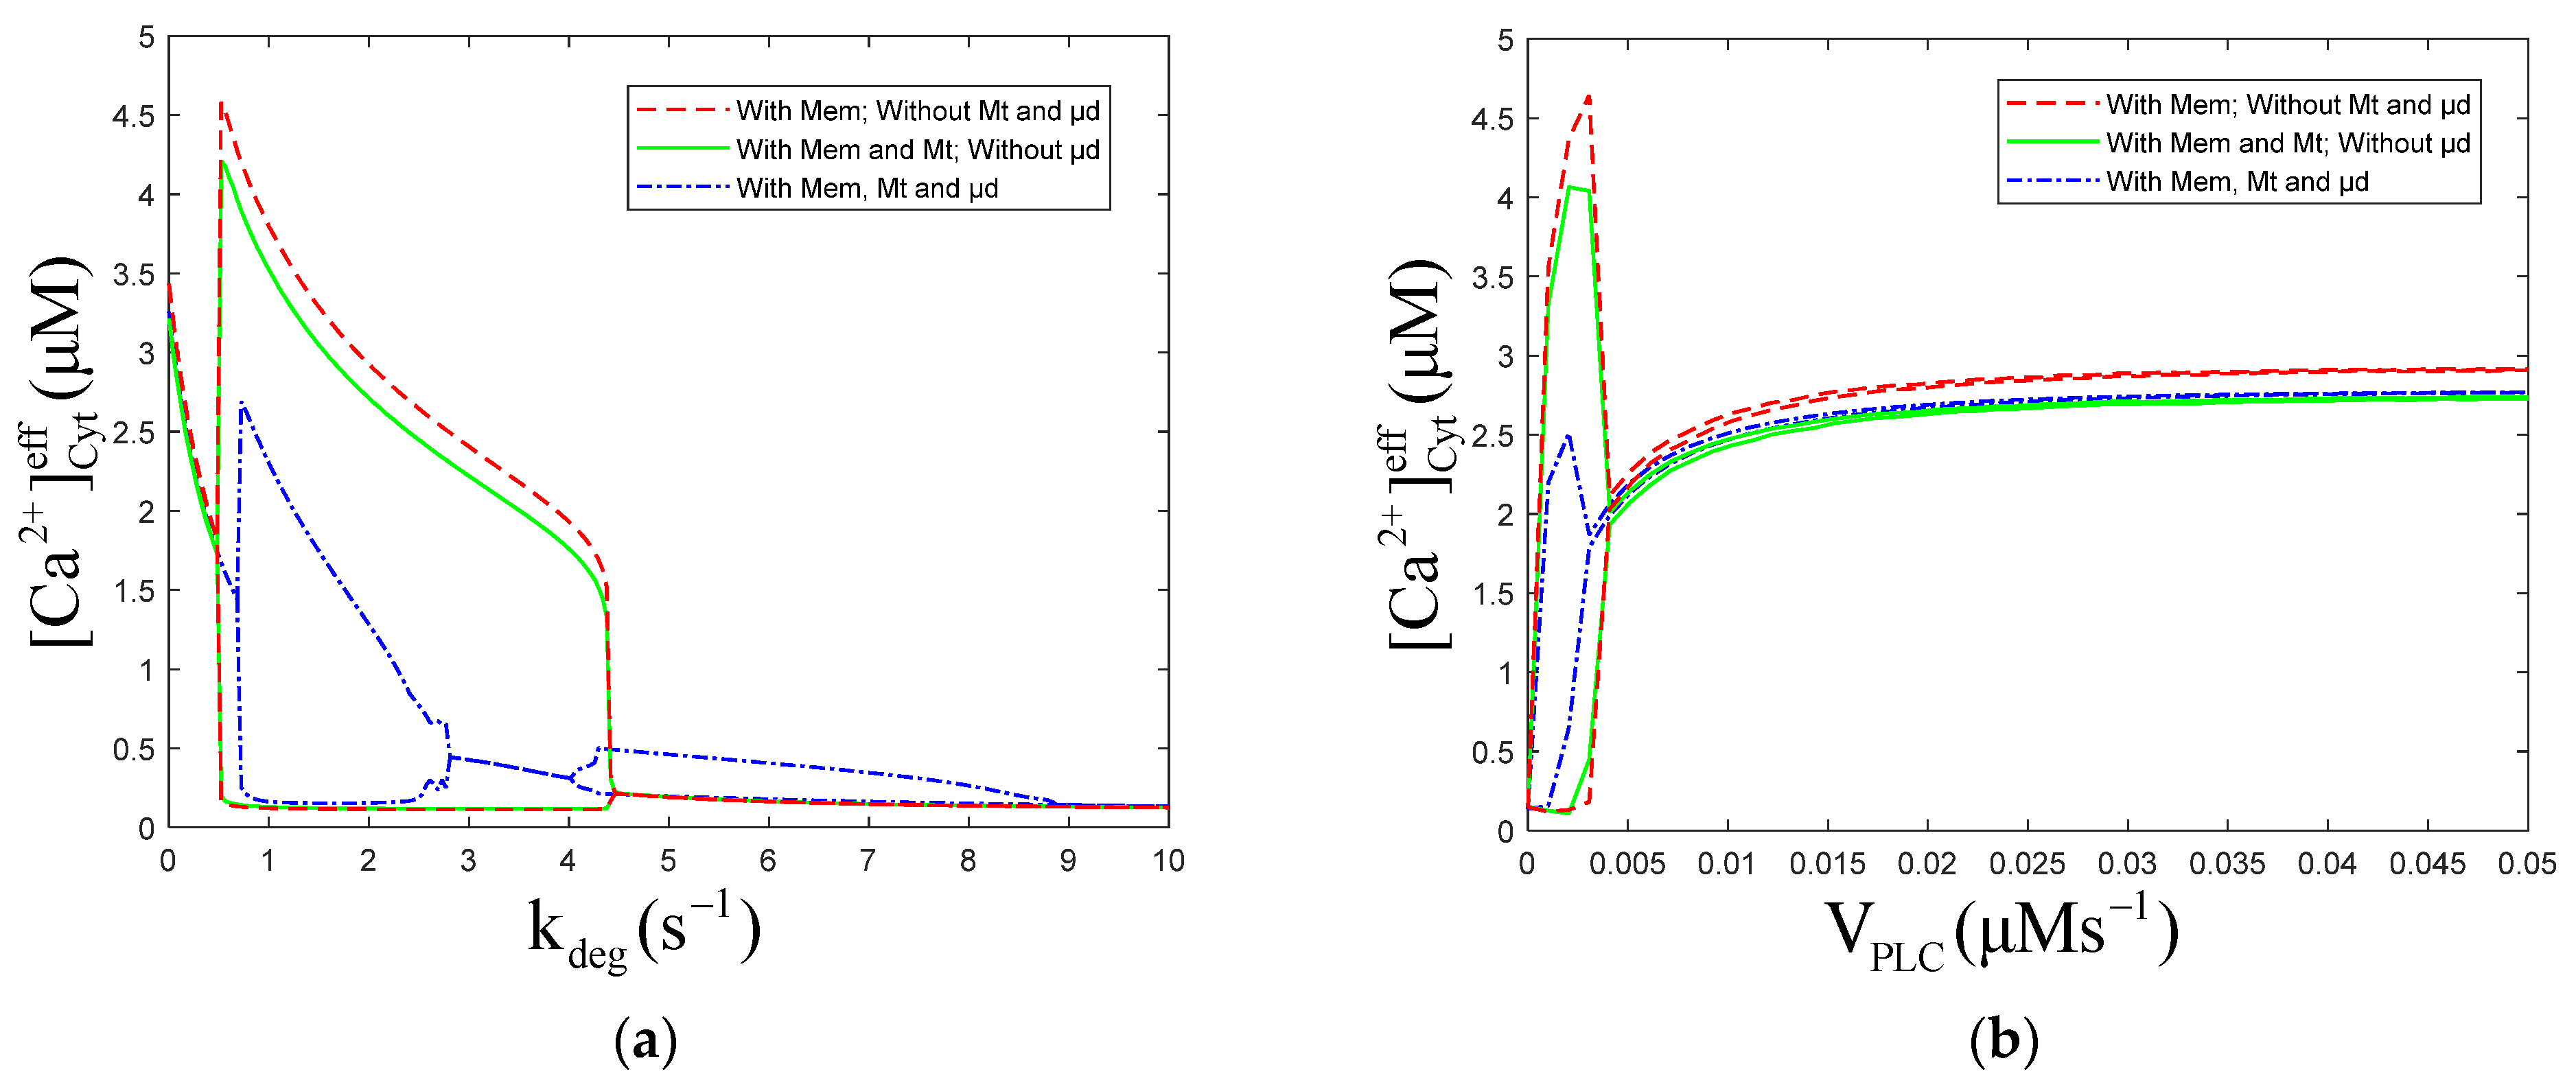
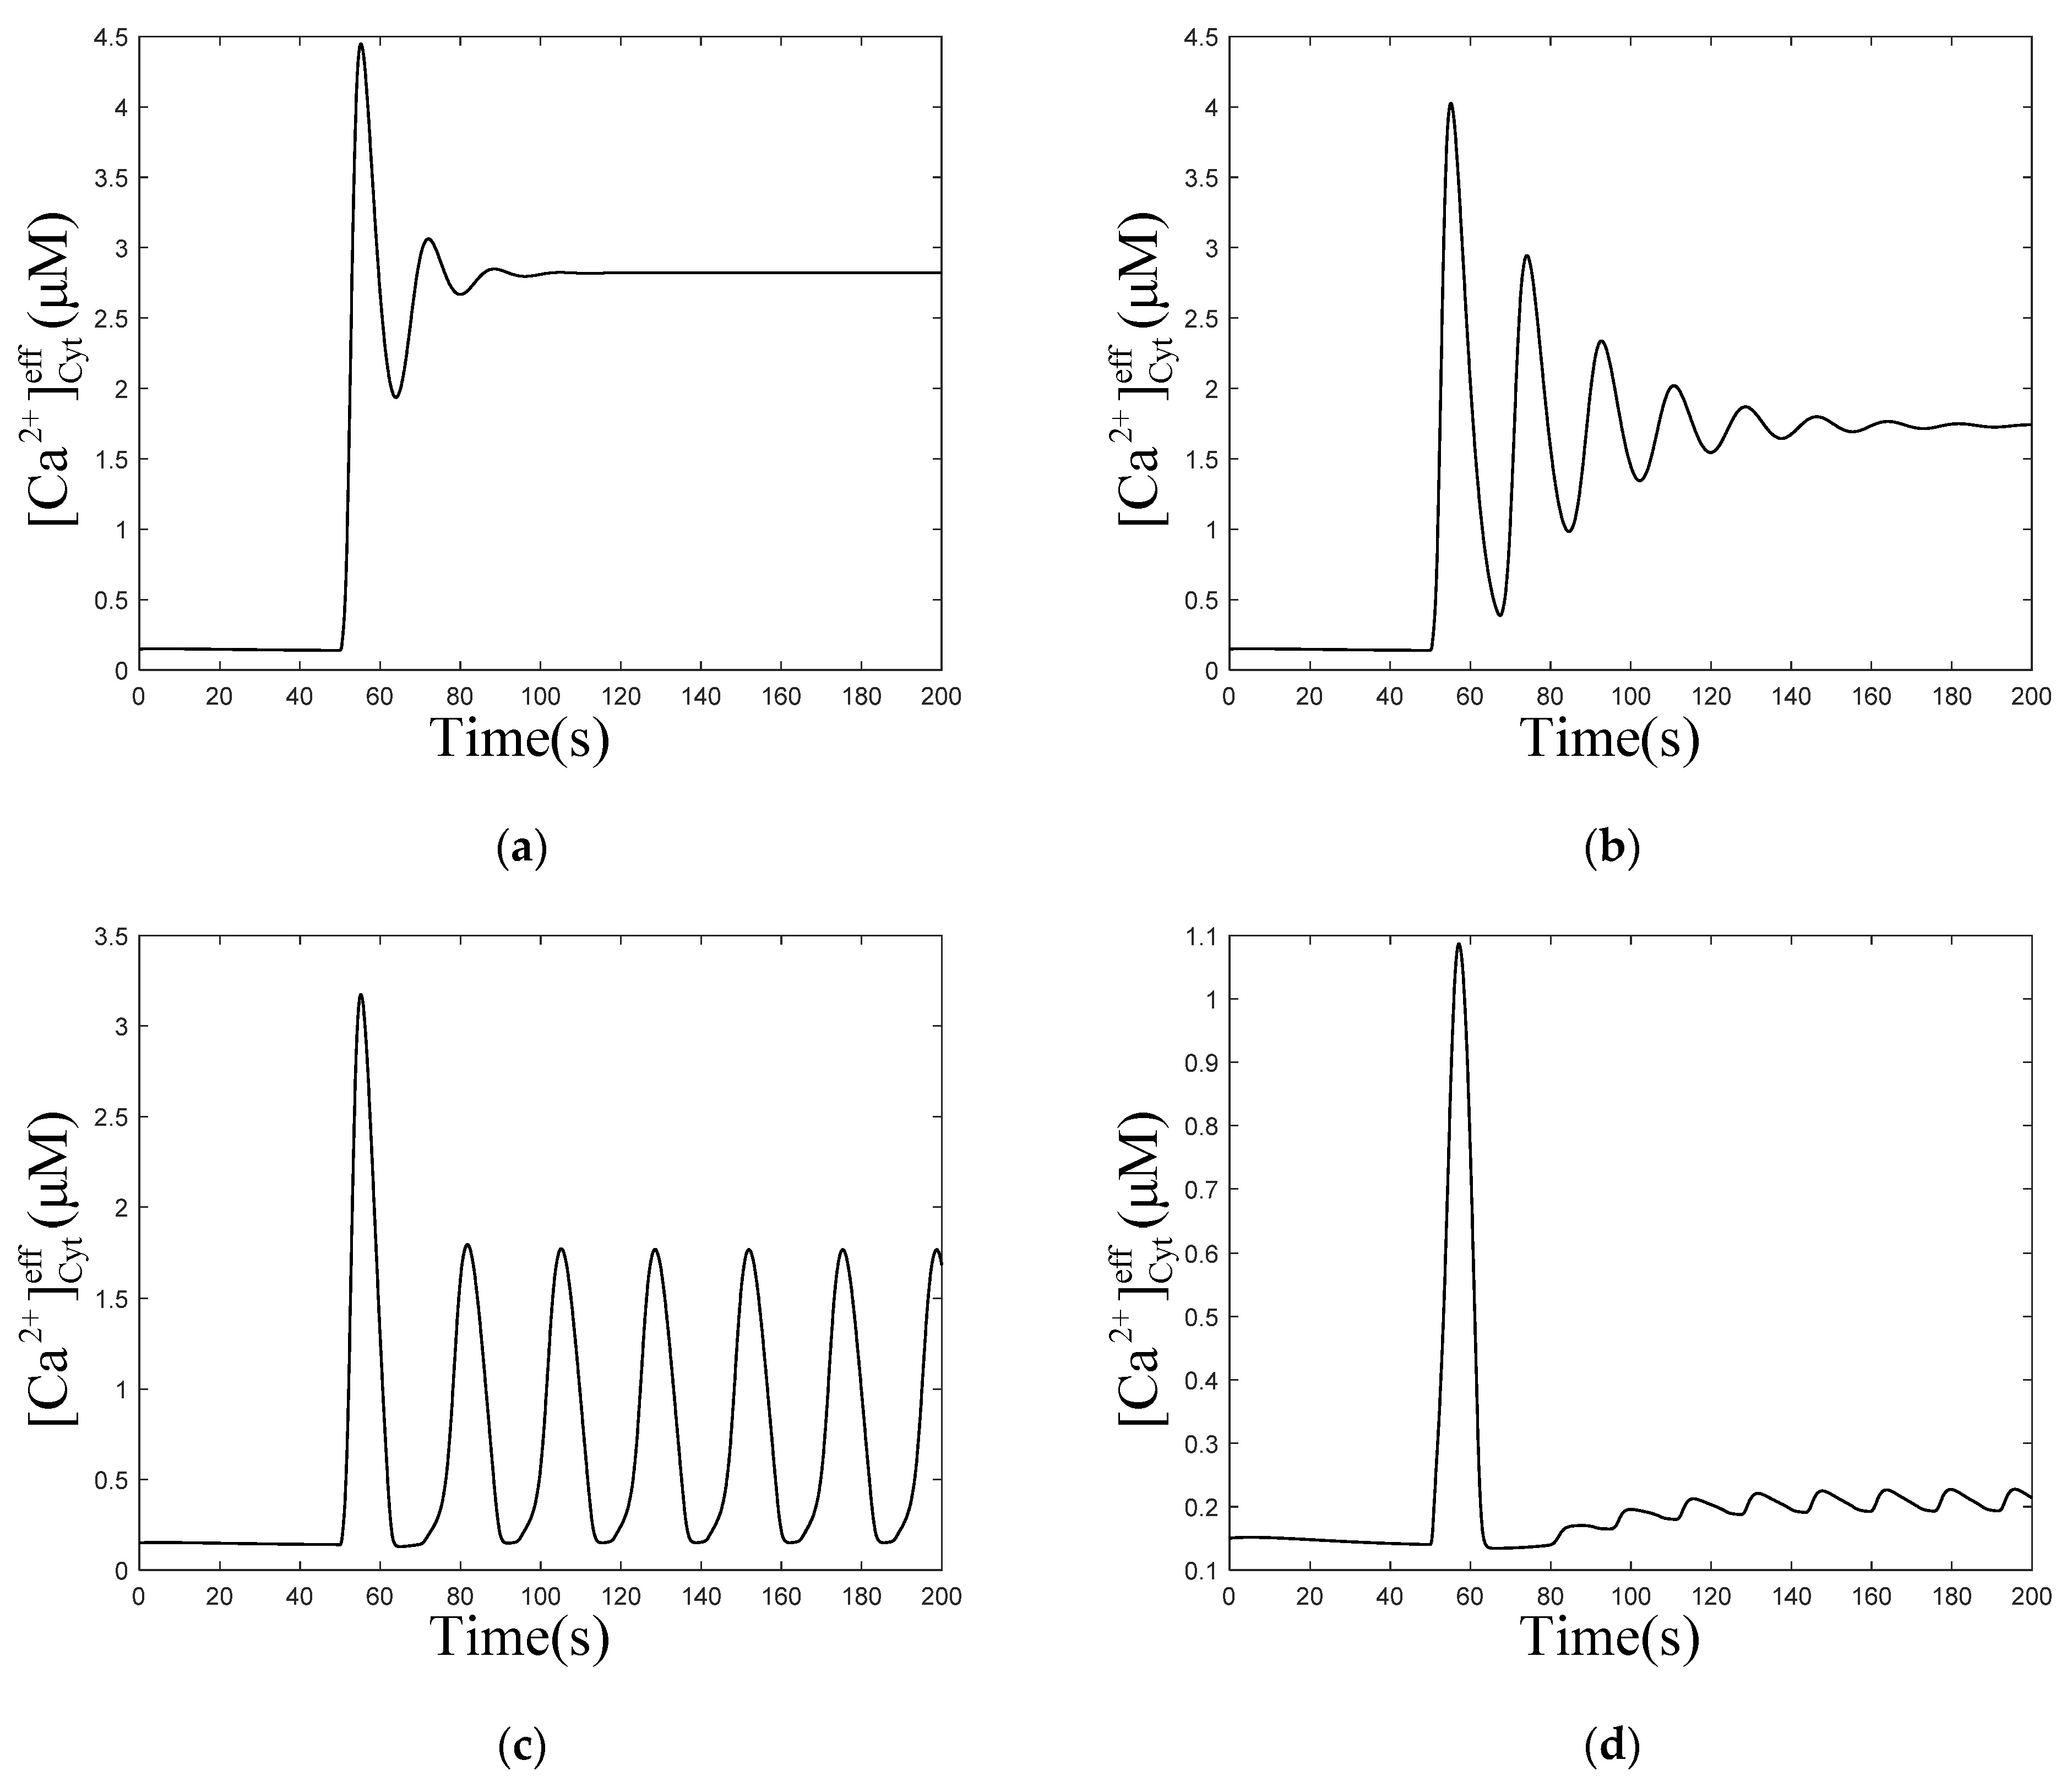
3.1. Effect of the Degradation and Production of on Oscillations
Based on the ODE45 solver of MATLAB, we regard all formulas as a system to program and solve. Therefore, the results shown below involve all the formulas. Except for the parameter values listed in the caption of each figure, all the other parameter values and meanings are in Table 1.
What we study is biological signals. Due to the compensatory effect of biological systems, there are a few signals with stable periodic oscillations. After a period of time, the oscillation signals often return to the original equilibrium value, or reach a new equilibrium value. Numerical oscillation analysis diagrams imitate the bifurcation diagram of the dynamic system, to analyze the conditions that can produce periodic oscillation solutions for a certain length of time (1000 s in our calculation). We make numerical oscillation analysis diagrams by finding the maximum and minimum values of concentration at different , , and values in the last 100 s (900–1000 s). If the maximum value and minimum value are not the same, it indicates that the concentration is in the state of oscillation, and numerical oscillation analysis diagrams show that one or value corresponds to two concentrations. If the maximum value and minimum value are the same, it indicates that the concentration is in equilibrium state, and numerical oscillation analysis diagrams show that one or value corresponds to one concentration.
The numerical oscillation analysis diagrams show the effect of Mt and μd compartments on the oscillatory dynamics, as functions of and , respectively (Figure 2). They also show that the Mt compartment results in a slight decrease in the predicted oscillatory amplitude, and the μd compartment leads to an obvious decrease and the emergence of an oscillatory region at high levels of (range 4 to 9 s−1) (Figure 2a). These results are consistent with those found by Arash Moshkforoush [34], which showed that the addition of the μd compartment resulted in the appearance of the low-energy oscillations region in numerical oscillation analysis diagrams. is positively correlated with degradation rate, and high levels of mean that degrades fast; therefore, should be kept at low levels. The Mt compartment and μd compartment can cause a decrease in the oscillatory amplitude (Figure 2b). Without μd, oscillations appear when is in the range of 0~0.004 μMs−1. While with μd, oscillations appear when is in the range of 0 to 0.003 μMs−1. Figure 2a or Figure 2b shows there are little differences between the three curves at the equilibrium of . This indicated that the Mt and μd have little effect on the intracellular equilibrium of concentration.
Figure 2.
Numerical oscillation analysis diagrams of the of effective cytosolic compartment () according to (a) and (b) . , , , and (a) , (b) . Stimulation applied at 50 s. The other parameters and constants are taken from Table 1. is the maximal production rate of PLC isoforms, is the sensitivity of PLC to , represents the phosphorylation rate constants, is the half-saturation constant of kinases. (a) With Mem, without Mt and μd, the oscillation range of is 0.48 to 4.45 . With Mem and Mt, without μd, the oscillation range of is 0.48 to 4.45 . With Mem, Mt and μd, the oscillation range of is 0.64 to 2.85 and 4.01 to 8.93 . (b) With Mem, without Mt and μd, the oscillation range of is 0 to 0.004 . With Mem and Mt, without μd, the oscillation range of is 0 to 0.004 .With Mem, Mt and μd, the oscillation range of is 0 to 0.003 . From (a,b), Mem, Mt and μd all can inhibit the amplitude of calcium oscillations, but only μd can reduce oscillation range.
Consider the numerical oscillation analysis diagrams in Figure 2a, which show that with Mem, Mt, and μd, the oscillation range of is 0.64 to 2.85 and 4.01 to 8.93 . Therefore, four values of (0.1, 0.5, 1.5, and 5.0 ) are chosen to simulate the temporal traces of . According to Figure 3a,b, rises first, due to the stimulation, then fluctuates for a period of time and returns to the equilibrium resting state, when is 0.1 and 0.5 ,which are both out of the oscillation range. While, when is 1.5 or 5.0 , which both are in the oscillation range, will maintain steady oscillations after stimulation, as shown in Figure 3c,d. The amplitude of oscillations is higher (~2 μM) and the frequency is lower (~2 oscillations/min) at lower levels of (Figure 3c, 1.5 ), compared to those at higher levels of (amplitudes: ~0.2 μM, frequencies: ~4 oscillations/min, Figure 3d, 5.0 ).
Figure 3.
Numerical simulation of the of effective cytosolic compartment () oscillations with Mt and μd at the following different values of : (a) 0.1 , (b) 0.5 , (c) 1.5 , (d) 5.0 , and , , , . Stimulation applied at 50 s. The other parameters and constants are taken from Table 1. (a,b) show that after being stimulated, the oscillations restore equilibrium in a very short time. (c,d) show that after being stimulated, the oscillations can be maintained for a long time.
When is 0.001 and 0.003 , does not rise immediately, but fluctuates to a value and forms oscillations subsequently. However, the calcium oscillations in Figure 4b are not stable, they return to an equilibrium state over time. In Figure 4c,d, concentrations only oscillate for a short period of time, to return to equilibrium. Comparing the four graphs (Figure 4a–d) shows that, with the increase in , the time required for forming oscillations becomes shorter and shorter until it disappears, the frequency of oscillations decreases, but the amplitude and final equilibrium value increase. When increases to a certain value, the oscillations disappear. This means that affects the process of calcium oscillations from one equilibrium state to another equilibrium state. These results are consistent with most of the biological signals. Similar to the neural electrical signal, after a period of time, the oscillation signals often return to the original equilibrium value or reach a new equilibrium value.
Figure 4.
Numerical simulation of the of effective cytosolic compartment () oscillations with Mt and μd at the following different values of : (a) 0.001 , (b) 0.003 , (c) 0.01 , (d) 0.1 , and , , , . Stimulation applied at 50 s. The other parameters and constants are taken from Table 1. (b–d) show that concentration oscillates from one equilibrium state to another equilibrium state after stimulation.
The temporal profiles of in the following cellular compartments: Cyt, ER, Mt, μd, after stimulation, are shown in Figure 5a. When is at the valley value (163 μM), in other cellular compartments are at peak value, as shown in Figure 5a. This indicates that the main filling of the Mt and μd come from the ER. The numerical simulation results also prove that high is observed when global is lower, and is 20 times that of , when outflows from the ER. The peak value of (37.3 μM) appears slightly earlier than those of (1.6 μM) and (3.5 μM), shown in Figure 5a. This indicates that oscillations in μd are not completely synchronized with those in Cyt and Mt. The temporal profiles of and are shown in Figure 5b. After stimulation, decrease appears about 10 s earlier than that of , which is in accordance with the fact that the increase happens earlier than the increase, shown in Figure 5a. The valley value of (0.56 μM) is lower than that of (0.61 μM) in Figure 5b.
Figure 5.
(a) oscillations profiles in each cellular compartment. , , and mean concentration of ER, Cyt, Mt and μd. (b) oscillations in Cyt and μd. means concentration of μd. , , , , . Stimulation applied at 50 s. The other parameters and constants are taken from Table 1. (a) The amplitude of oscillations is 47.86 , the frequency is 22.4 s. The amplitude of oscillations is 1.76 , the frequency is 23.4 s. The amplitude of oscillations is 2.94 , the frequency is 23.3 s. The amplitude of oscillations is 37.32 , the frequency is 23.7 s. (b) The amplitude of oscillations is 0.07 , the frequency is 23.2 s. The amplitude of oscillations is 0.04 , the frequency is 23.8 s. (a,b) show that the oscillations are out of sync, but the frequencies are pretty much the same.
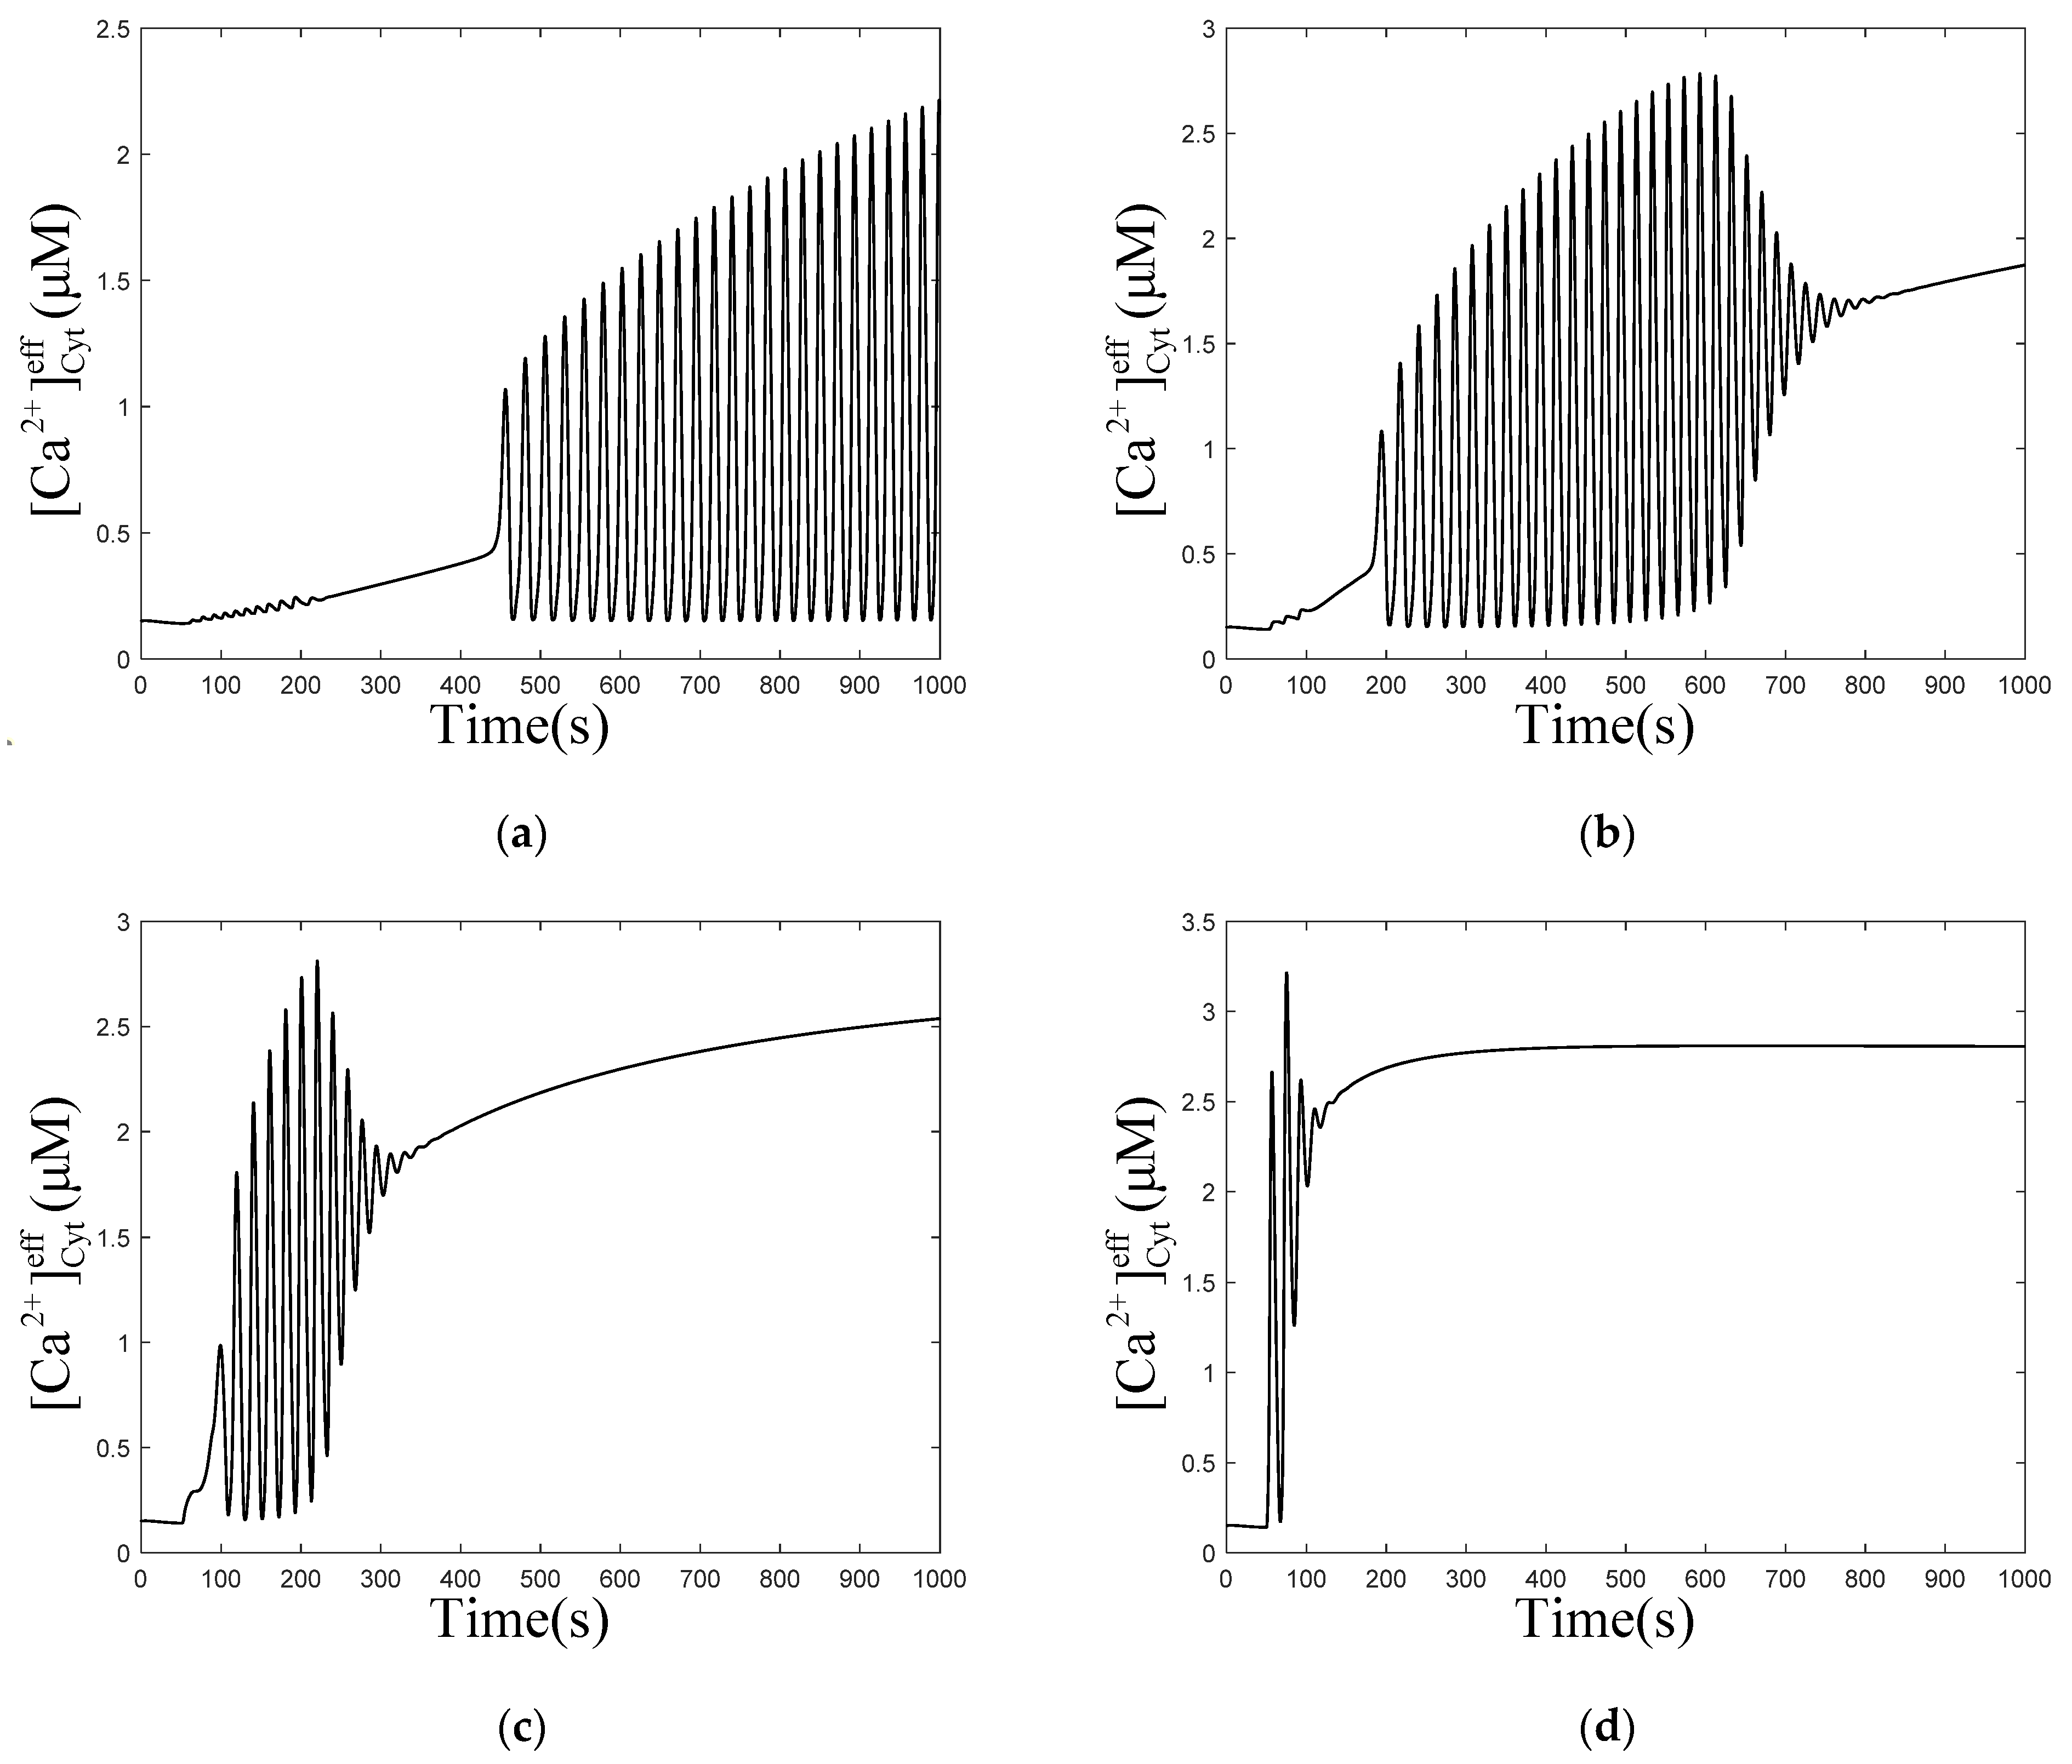
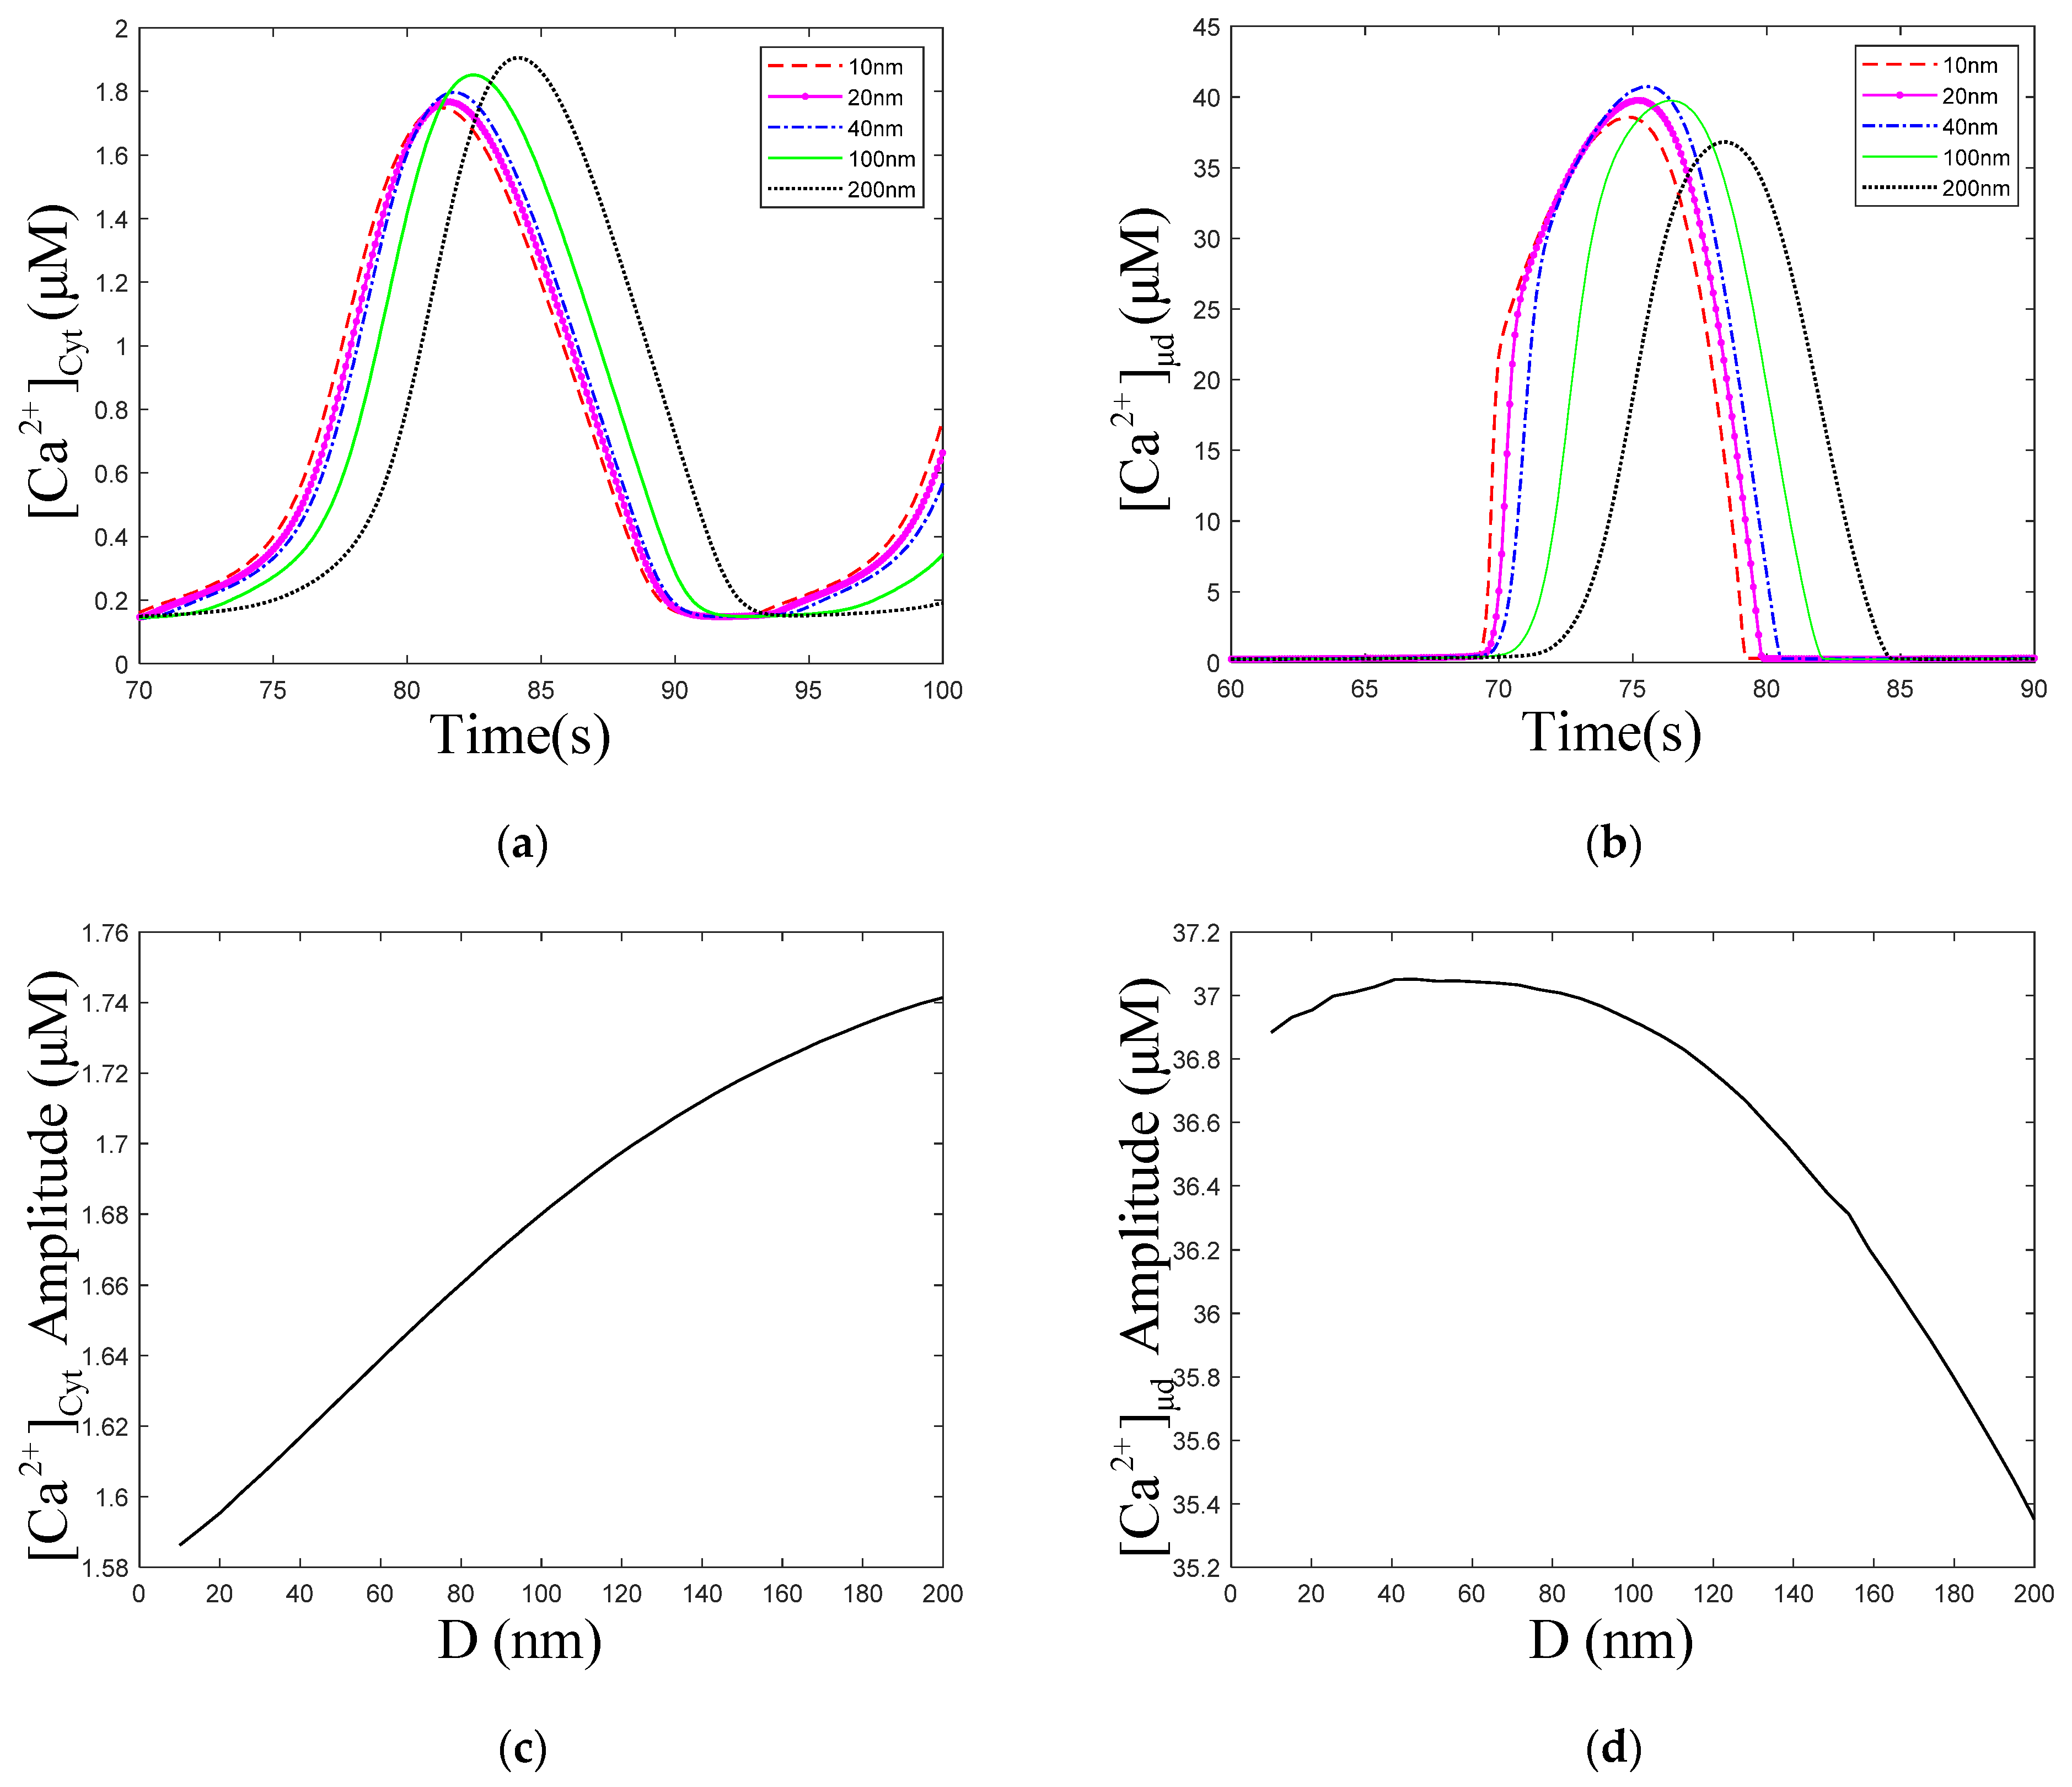
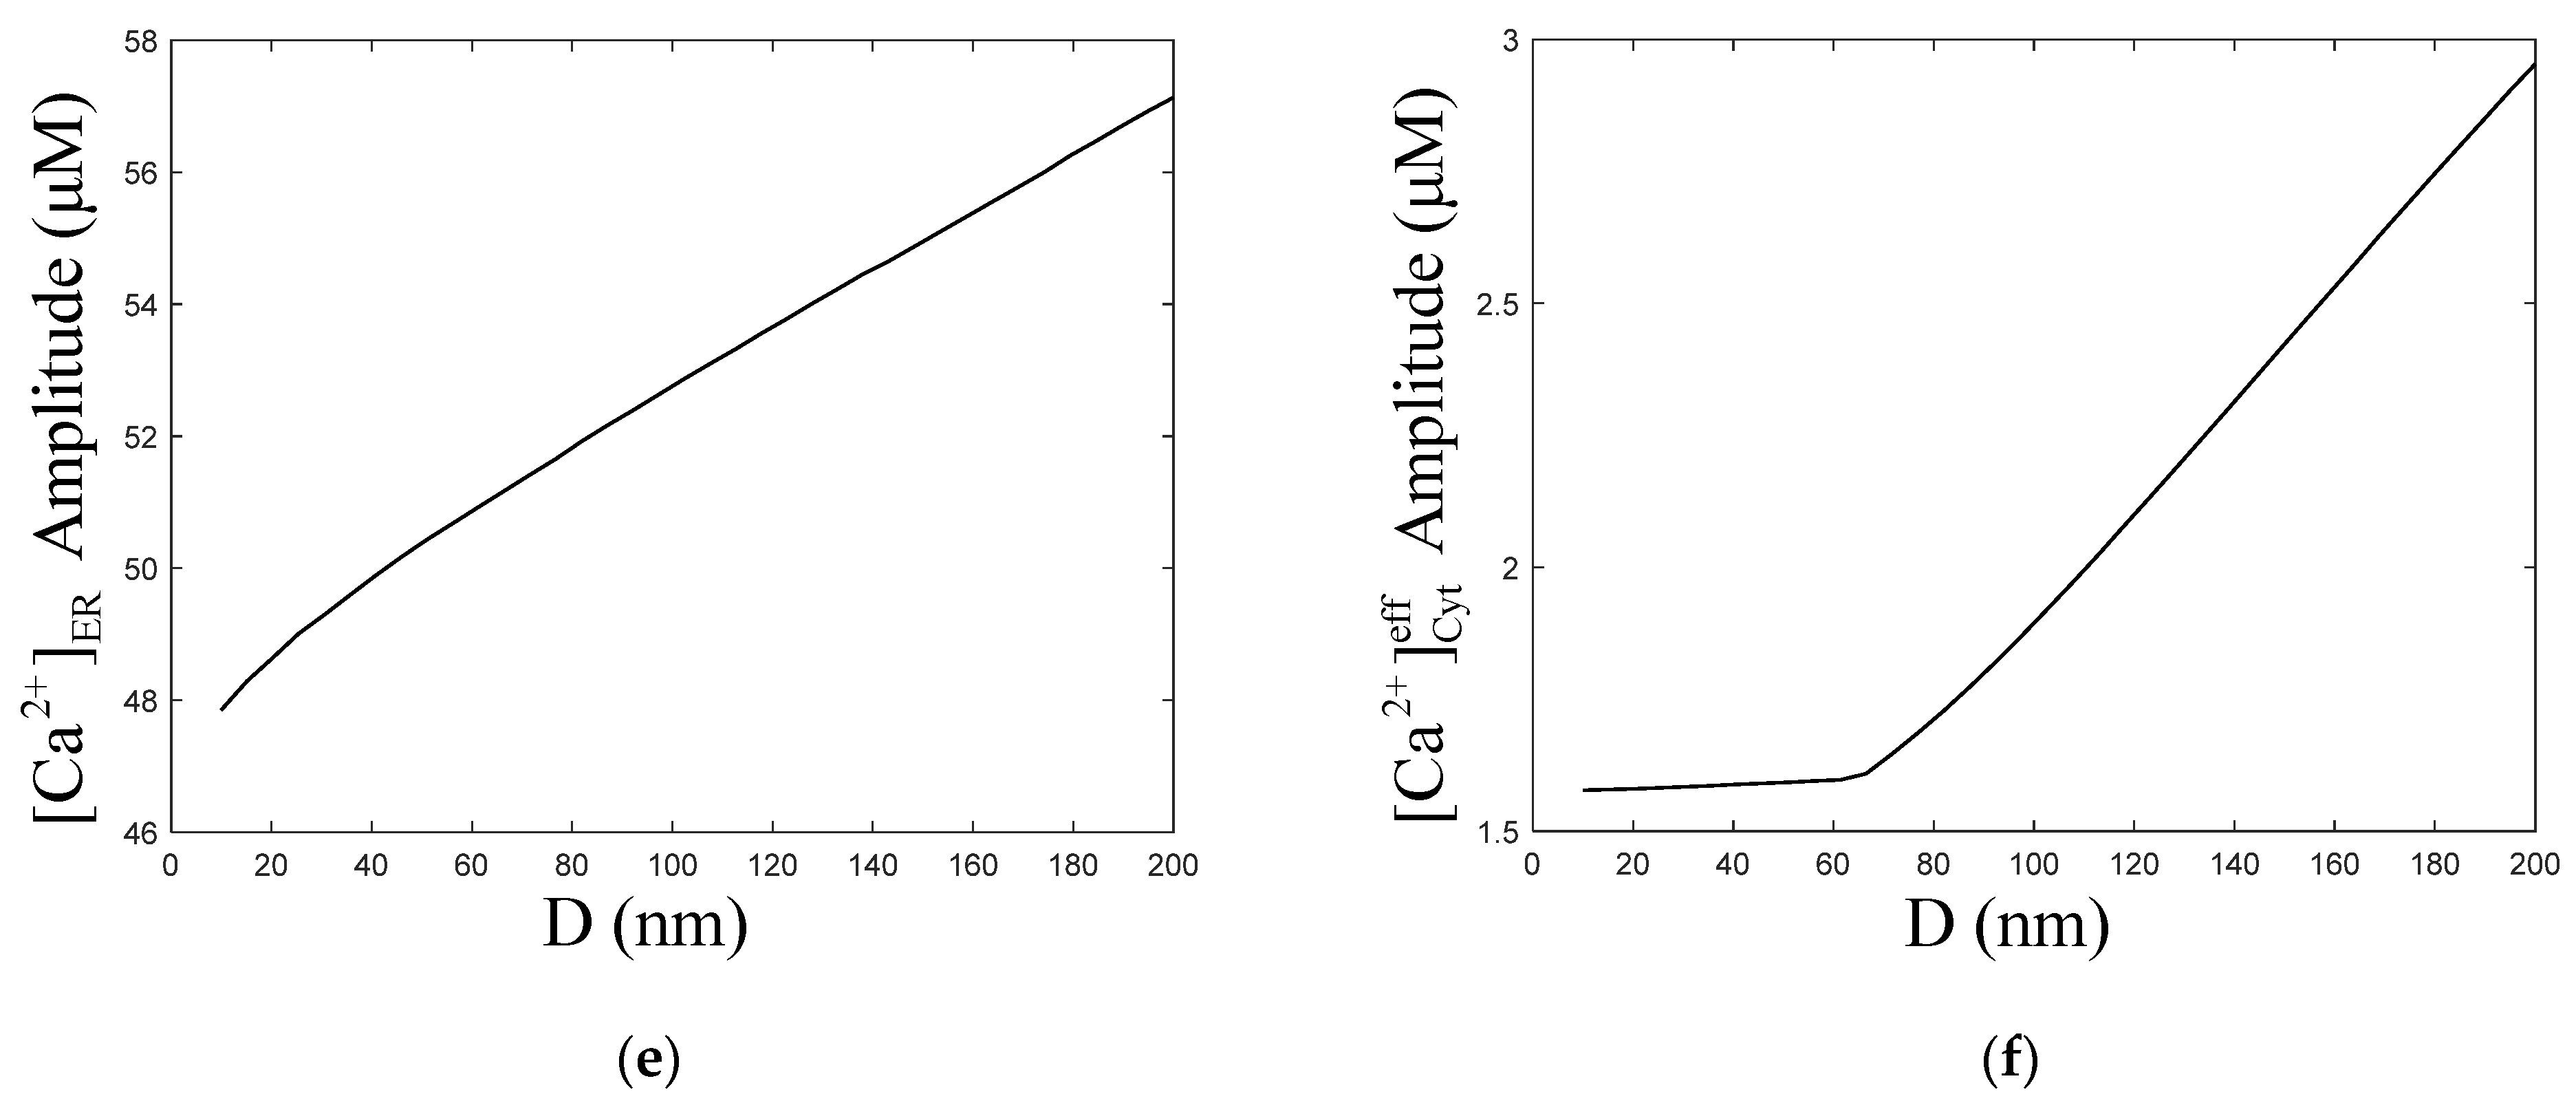
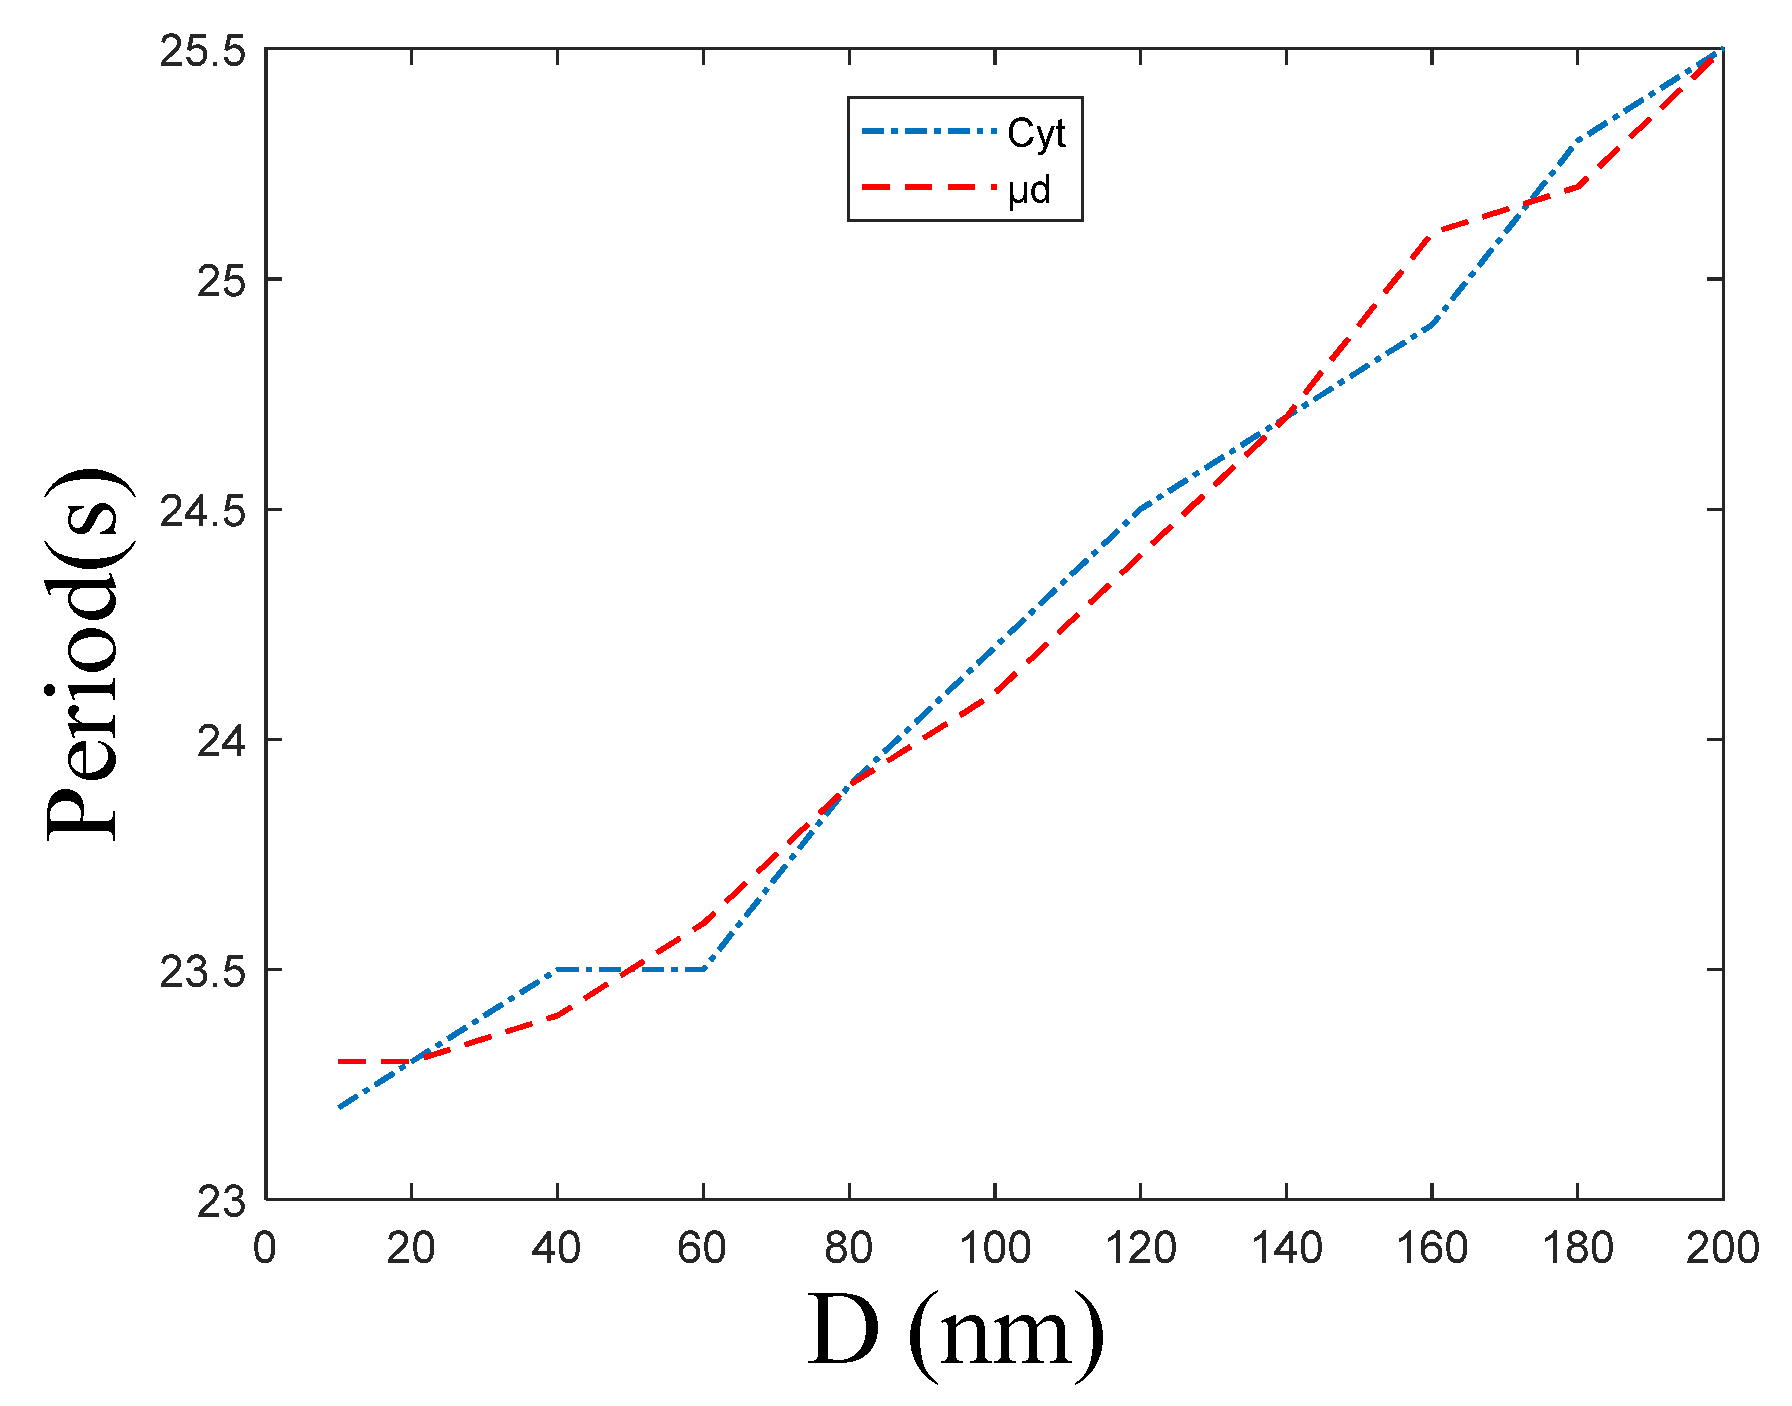
3.2. Effect of the ER–Mt Distance (D) on Oscillations
Figure 6a,c show that with the increase in the ER–Mt distance, the amplitude of oscillations increased slightly. The numerical simulation results of Qi [33] show that with increasing ER–Mt distance at D < 20 nm, the amplitudes decrease, while at D > 20 nm, the amplitudes increase. A result similar to Qi appears in our model, at D = 40 nm, the amplitude is the highest in Figure 6b. Moreover, Figure 6d shows that with ER–Mt distance increases at D < 65 nm, the amplitudes increase, while at D > 65 nm, the amplitudes decrease with ER–Mt distance increases. In Figure 6f, there is also an obvious inflection point of amplitudes at D = 65 nm. When D > 65 nm, the amplitudes increase faster than D < 65 nm, of which the amplitudes maintain around 1.6 μM. Combining Figure 6d,f, we find that in this model, when D is larger than 65 nm, the influence of μd on oscillations is weak. This is a mathematical explanation of why the μd functional region should have a small distance. Figure 6e shows that amplitudes increase with ER–Mt distance increases, meaning the ER releases more under larger ER–Mt distances. This explains why the amplitude of and oscillations increase with ER–Mt distance increases.

Figure 6.
Dynamics modulated by the ER–Mt distance (D). , , , . Stimulation applied at 50 s. The other parameters and constants are taken from Table 1. (a) concentration of Cyt () oscillations as a function of time at the following different Ds: D = 10, 20, 40, 100 and 200 nm. (b) concentration of μd () oscillations as a function of time at the following different Ds: D = 10, 20, 40, 100 and 200 nm. (c) The amplitudes of concentration of Cyt () oscillations as a function of D. (d) The amplitudes of concentration of μd () as a function of D. (e) The amplitudes of concentration of ER as a function of D. (f) The amplitudes of concentration of effective cytosolic compartment ( ) as a function of D. With the increase in the ER–Mt distance, (a) the amplitude of oscillations increases, (b) the amplitude of oscillations decreases. (d,f) show that the effect of D in calcium oscillations is weak when D is great than 65 nm.
Figure 7 shows that the period of and oscillations increases with ER–Mt distance increases. In combination with Figure 5a, we find that is higher than and their oscillations are not synchronous, but the periods as well as the frequency of oscillations are the same. When D = 10, 200 nm, the period of and is 23.2 and 23.3 s, and 25.5 and 25.5 s, respectively. Figure 7 shows that the period and distance have an approximate linear relationship; therefore, we can obtain the slopes of (0.01244) and (0.01232) by fitting. From a mathematical point, this result is beyond our expectation, because in this model, Cyt and μd are calculated as two rooms, and there is only a diffusion relationship between the two rooms. While from a cellular physiological point, this result is reasonable. In the model, the μd is a region that we hypothesize from the cytoplasm. However, in the actual cell, it is a part of the Cyt, hence both the frequencies should be the same. Meanwhile, the frequency of calcium oscillations is one of the ways that cellular calcium signaling transmits information. When the whole intracellular calcium signaling is formed, the same frequency can transmit the same information. Therefore, the calcium signaling must be consistent to prevent cells from receiving different information at the same time, causing functional disorders.
Figure 7.
The period of concentration of Cyt and μd oscillations at the following different ER–Mt distances (D): 10, 20, 40 60, 80, 100, 120, 140, 160, 180, 200 nm. , , , . The other parameters and constants are taken from Table 1. These two curves fit well, meaning that calcium oscillations of Cyt and μd have same frequency under different ER–Mt distances.
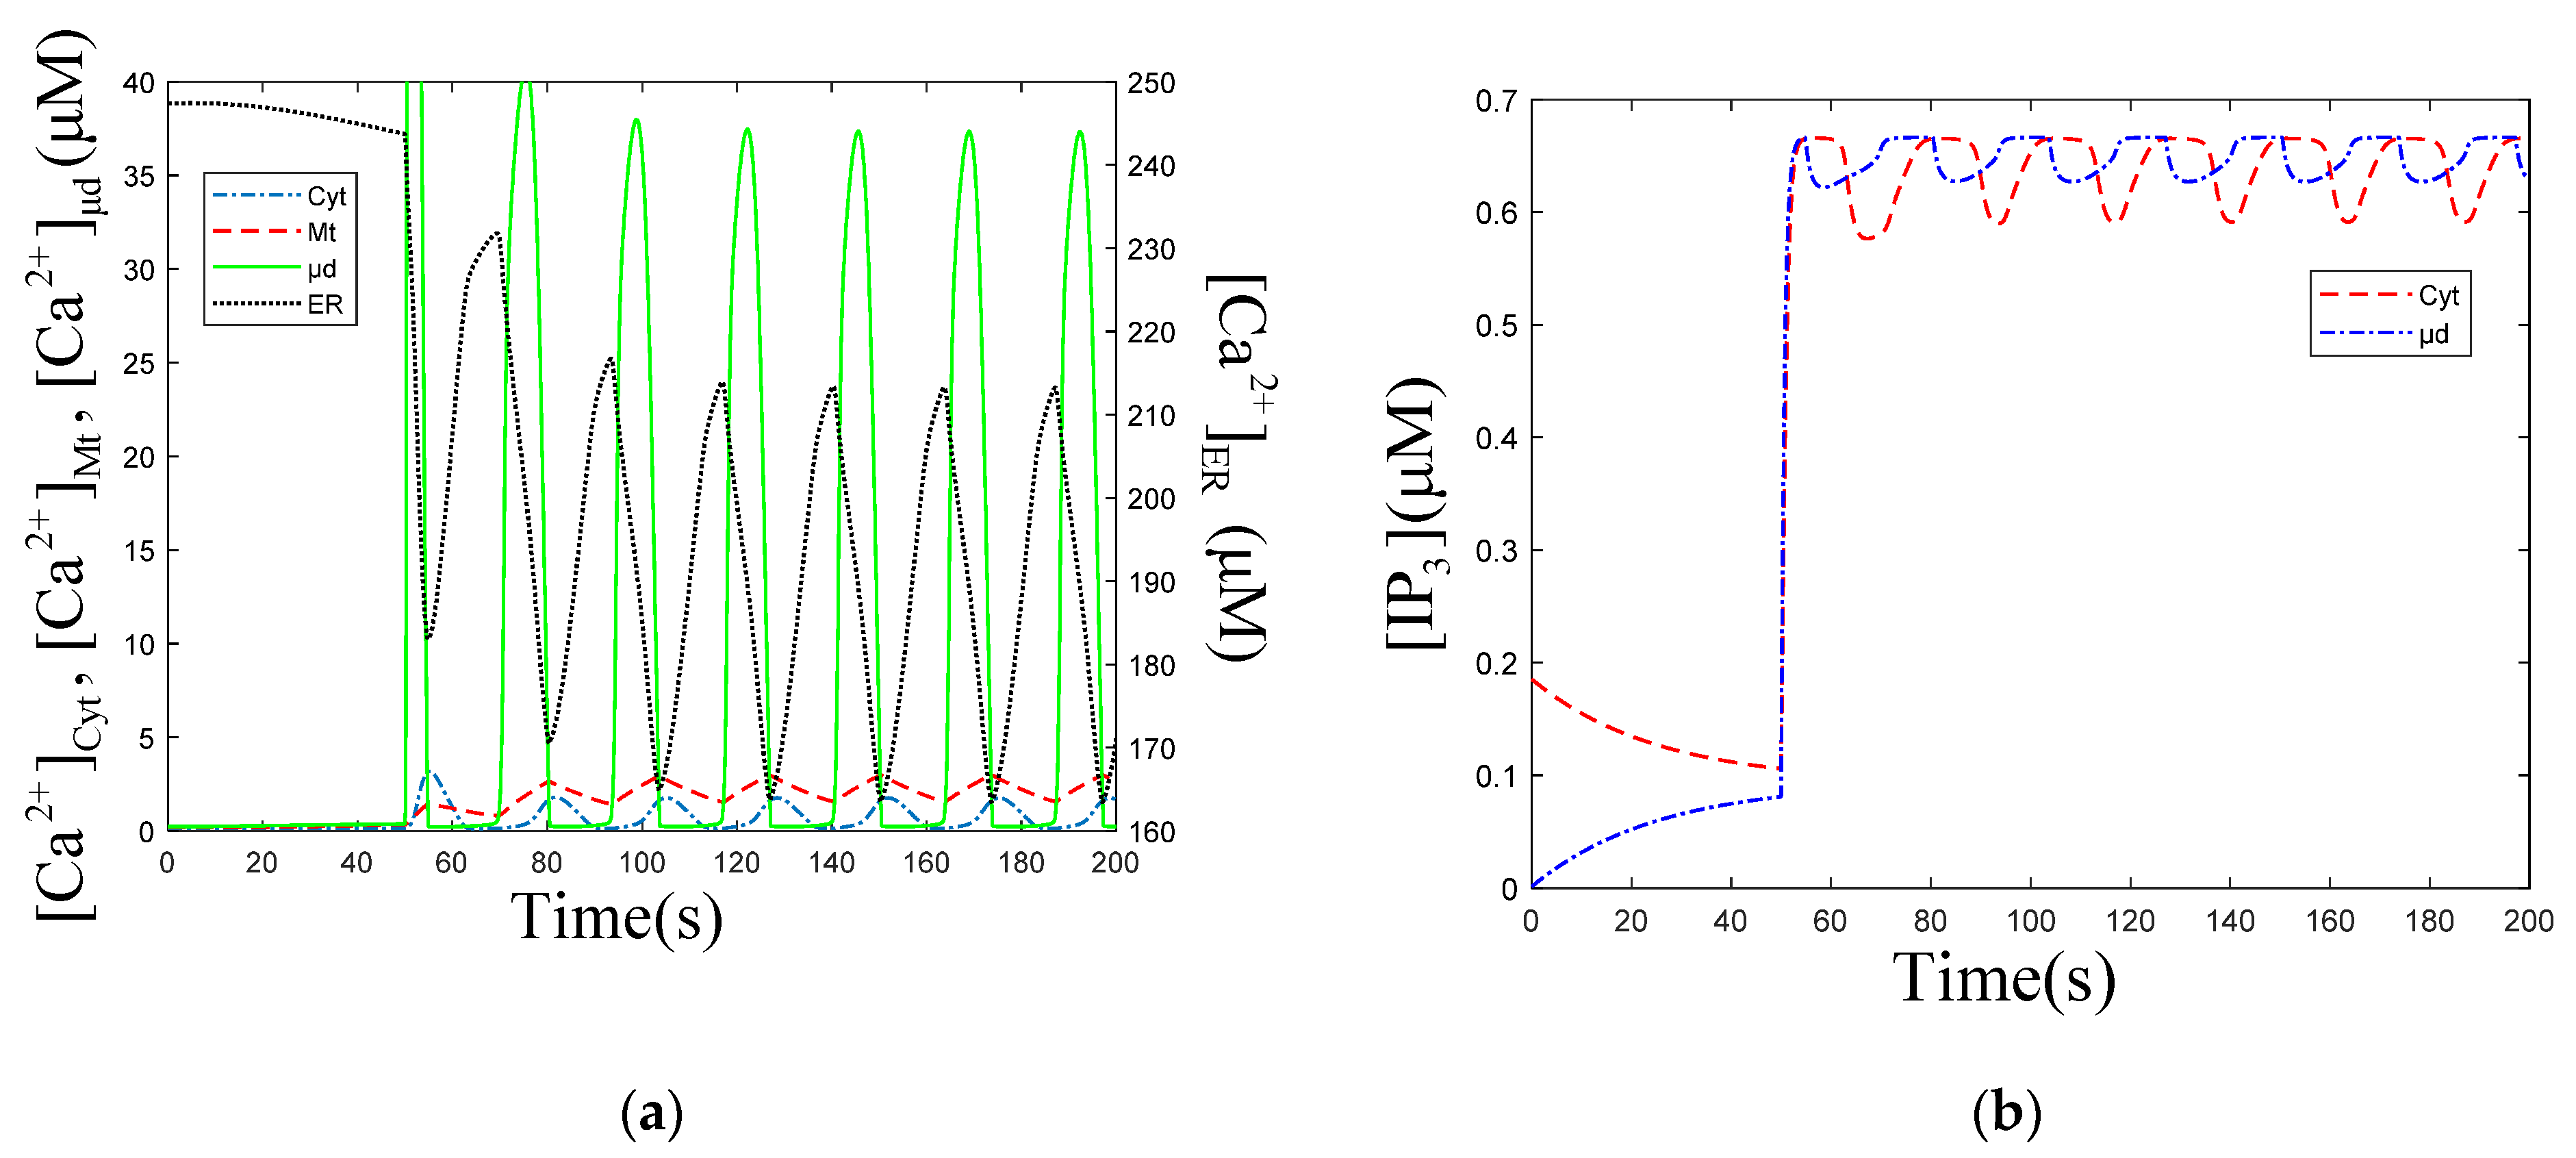
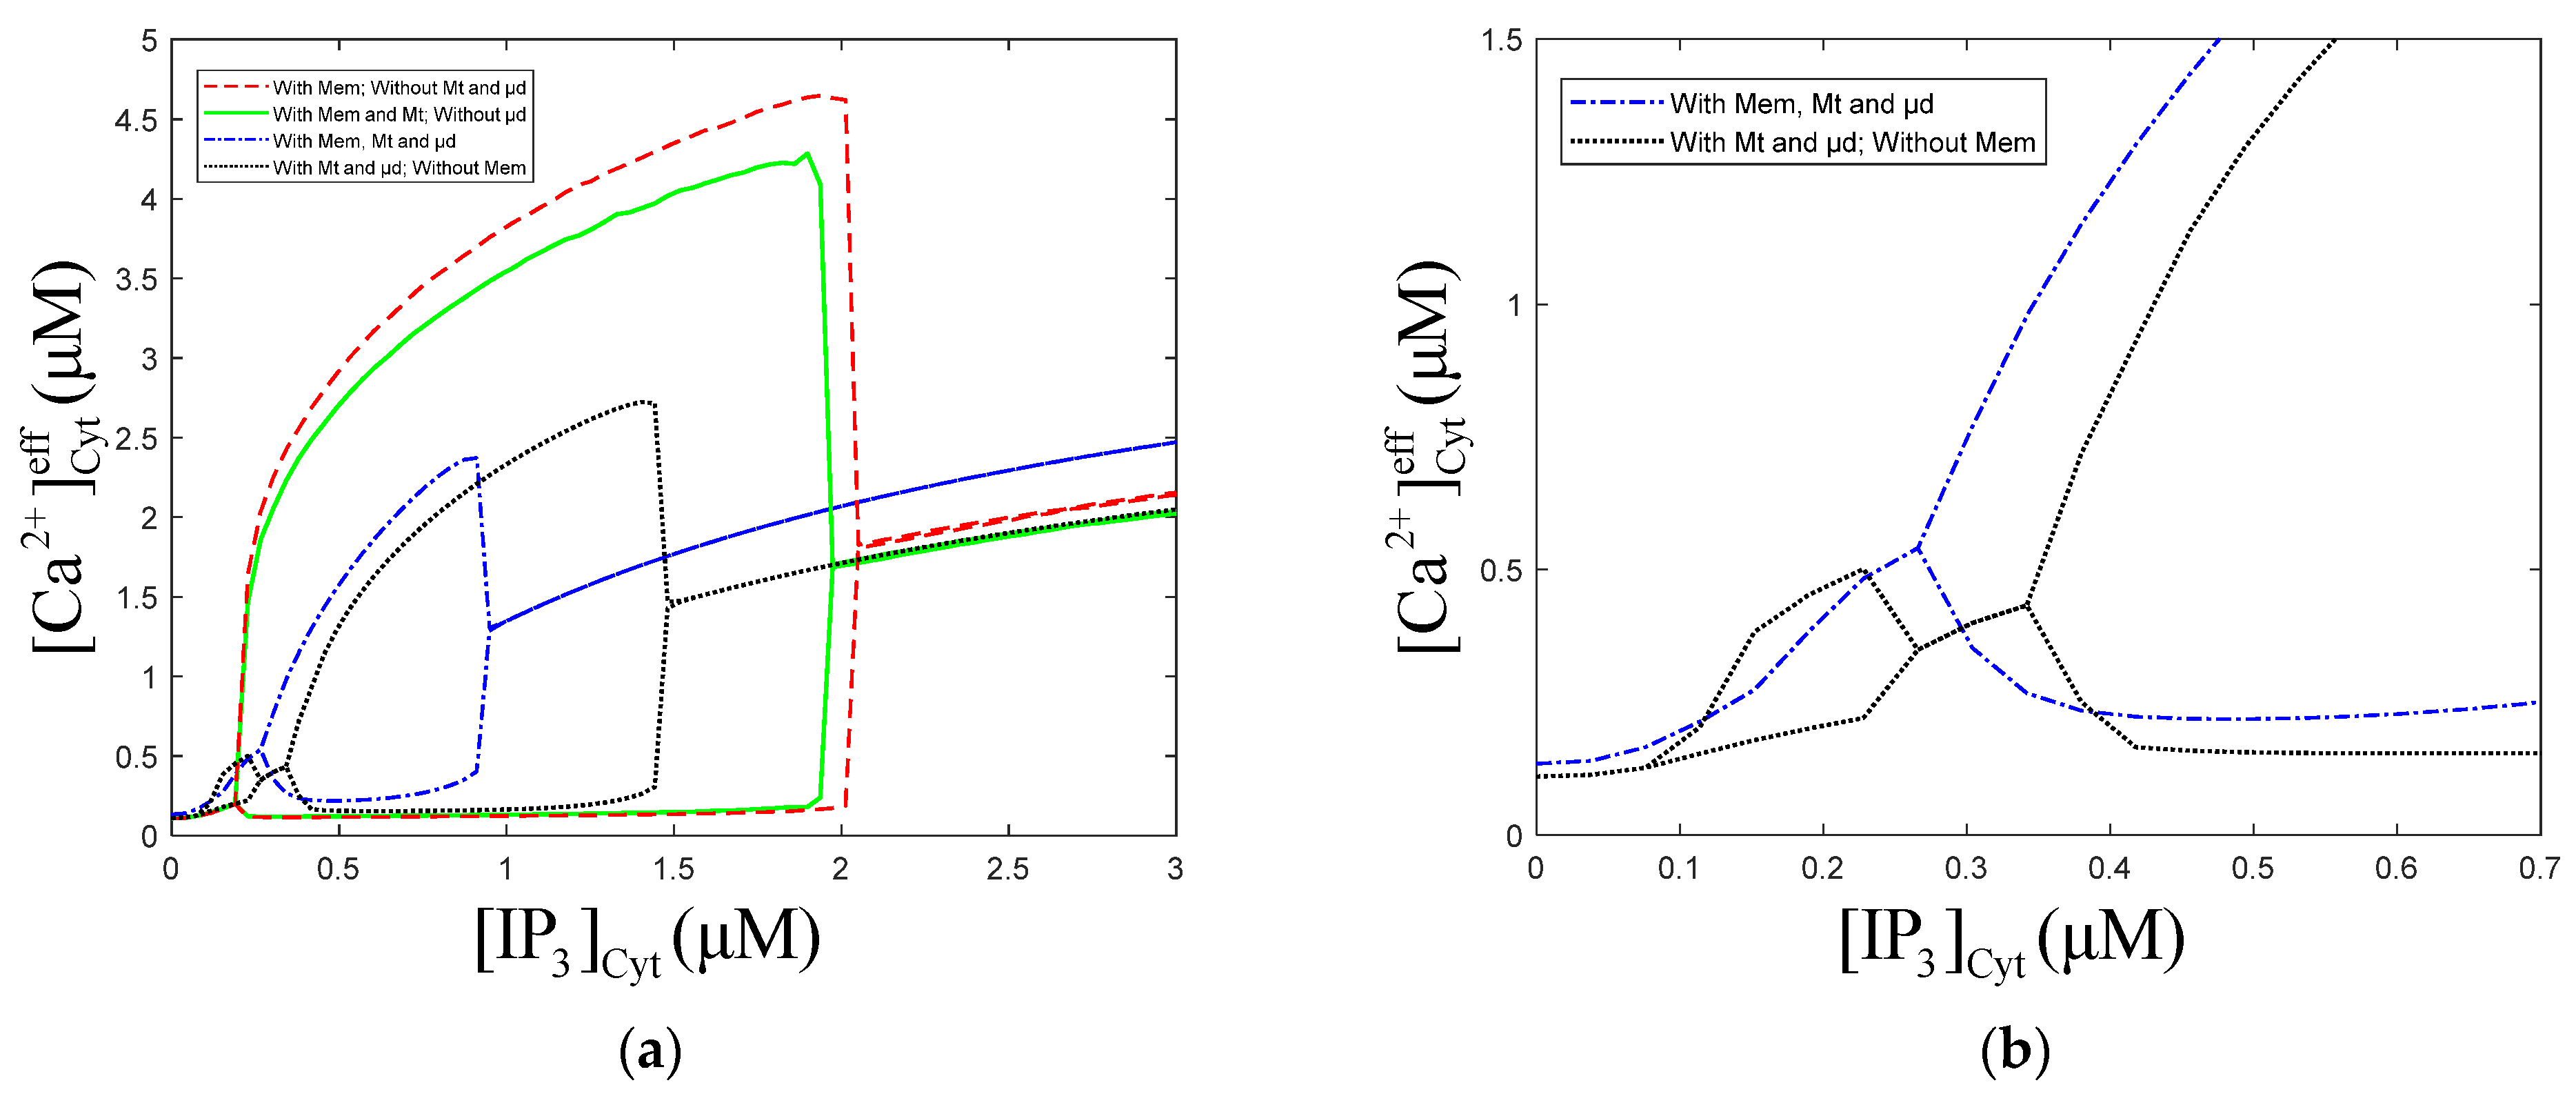
3.3. Effect of the on Oscillations
The numerical oscillation analysis diagrams in Figure 8a show that the Mt, μd, and Mem compartments can each reduce the amplitude of oscillations. Contrasting the dot curve with the solid curve, we can find that the addition of the μd compartment causes oscillation regions at low-level of 0.08~0.27 μM. Comparing the dot curve and dot solid curve, we find that the Mem compartment makes the oscillations at low-level disappear. The Mt compartment has a slight effect on the left and right bifurcation point value of oscillations. The oscillations region of the model, with Mt, μd, and Mem, shrink obviously, meaning that the μd and Mem compartments limit the range of oscillations. From Figure 8a, we can also draw a similar conclusion as Figure 2, which is that the presence or absence of Mt, μd, and Mem have little effect on the equilibrium calcium concentration.
Figure 8.
Numerical oscillation analysis diagrams with/without the Mt, μd and Mem. , , , . Stimulation applied at 50 s. The other parameters and constants are taken from Table 1. (b) is a larger view of from 0 to 0.6 in figure (a) of with/without Mem. means concentration of Cyt. means concentration of effective cytosolic compartment. (a) With Mt and μd, without Mem, the oscillation range of is 0.07 to 0.26 and 0.34 to 1.51 . With Mt, μd, and Mem, the oscillation range of is 0.26 to 0.94 . (b) Mem limits the calcium oscillations range of low concentration.
4. Discussion and Conclusions
In Qi’s model [33], the –MCU distance is regarded as the main factor by which μd affects calcium oscillations. He links the ER with Mt by one-dimensional diffusion of between and MCU. However, with the distance increases, the influence of diffusion in other directions will be more significant. Hence, the one-dimensional diffusion assumption will make the calculation error of larger, and the error of calcium oscillations larger. Therefore, in our model, we assume that the μd is a separate chamber with volume. As shown in Figure 6d, increases a little before 65 nm and decrease subsequently. From Figure 6e, we find that the ER–Mt distance increase makes the ER release more . This is because has a inhibition binding site, so when binds to this site, activity is inhibited. As the ER–Mt distance increases, can spread faster; therefore, the probability of binding to the inhibition site decreases, so released by increases. Hence, there is a little upward trend of , and, later, the effect of the increased volume of μd is greater than the release of , and begins to decrease. However, in Qi’s result, was decreasing all the time. Arash Moshkforoush’s model [34] does not consider the degradation and production of ; therefore, the concentration of in the cells is constant, which is not a physiological reality. dynamic behaviors have a significant effect on the range of parameter values and the oscillation patterns of oscillations [43]. Inhibition of protein kinase C eliminates oscillations, while formation is still maintained [44]. This is also shown in Figure 2a,b, which shows that at different degradation and production levels of , there are different amplitudes and frequencies of oscillations.
In this paper, the dynamic model of calcium oscillations in MCs is developed, which considers the major cellular compartments (Cyt, Mem, ER, and Mt), channels and buffer in these compartments, and the μd composed of the ER and Mt. In our simulations, the Mt and μd compartments can reduce the amplitude of oscillations. With the addition of the μd compartment, an oscillatory region will appear at high levels of (4 to 9 s−1) and at low levels of (0.08~0.27 μM), shown in Figure 2a and Figure 8a. Our model also shows that different concentrations of stimulation will change the amplitude and frequency of oscillations. The amplitude of oscillations increases, and the frequency of oscillations decreases with increases. Figure 4b shows that the oscillations process is in line with the actual law of cell calcium signal generation. The calcium signal can be divided into the following three levels: (i) at first, being the most fundamental event, a very low level of stimulation will cause a brief opening of a single channel and the release of calcium, which is called calcium blips; (ii) then, there is the basic event, which results from a small group of channels opening and the release of calcium, to form calcium sparks; (iii) finally, the synchronization of a large number of fundamental events produces the global calcium signal, and subsequently restores the resting state. According to our results, the amplitude of oscillations increases with the increase in the ER–Mt distance. Moreover, the amplitude also increases with the increase in the ER–Mt distance at D < 65 nm, but decreases with the increase in the ER–Mt distance at D > 65 nm. Therefore, we believe that μd has a better regulation effect on oscillations when the ER–Mt distance is less than about 65 nm, which also provides reference for determining the distance of μd in the subsequent studies. The periods of and oscillations are the same at different ER–Mt distances, and they increase with the ER–Mt distance. Meanwhile, from Figure 5a and Figure 7, we can understand that is 20 times higher than , and their oscillations are not synchronous. The presence of μd causes the ER to release less , and the effect of μd decreases with ER–Mt distance increases. This proves that μd acts as a buffer against the release of from the ER. All these results suggest that μd plays an important role in controlling oscillations at D < 65 nm. The degradation and production of can also regulate oscillations by maintaining different levels of . As shown in Figure 5b, before stimulation, and get closer, due to the diffusion between Cyt and μd. This is because the production and degradation of μd and Cyt maintain dynamic equilibrium at the initial moment, but the concentration of will affect oscillations; therefore, we assume that the production and degradation of are both zero before the stimulation (50 s), to reduce the impact of on calcium oscillations in the study of and . Then, at this time, the dynamic equilibrium is destroyed, and the concentrations of μd and Cyt are close to each other. We already know that the concentration of also has an effect on oscillations, hence the given concentration of is not used as the stimulation, but the system is deviated from the equilibrium state through diffusion after the production and degradation of is assumed to be zero, and then the values of and are restored, so as to reduce the impact of on calcium oscillations in the study of and .
From the biological point of view, due to the compensatory effect of biological systems, there are a few signals with stable periodic oscillations. After a period of time, the oscillation signals often return to the original equilibrium value, or reach a new equilibrium value. This is consistent with Figure 4b–d. is regulated by in a biphasic manner; therefore, activity is inhibited at higher concentrations. When the ER–Mt distance increases in our model, the volume of μd increases and the concentration of μd gradually decreases, and this causes the activity of to increase; therefore, more will outflow from the ER through the channels, causing the ER calcium oscillations amplitude increases shown in Figure 6e, and the cytoplasmic concentration increases shown in Figure 6c. Calcium oscillations have been widely accepted as a universal signal mode in cells. With the in-depth study of calcium oscillations, the basic theory of calcium oscillations regulating downstream biological effects through its frequency has been established [45,46]. In Figure 7, the calcium oscillation frequencies of Cyt and μd calculated by our model are basically the same, which also implies that the frequency of calcium oscillations is one of the ways of signal transmission.
In summary, the study provides a dynamic model that simulates calcium oscillations in mast cells and provides a theoretical basis for the mast cell calcium signal observed in the experiment. This enabled us to consolidate previous theoretical and experimental findings. The model results showed that Mem, Mt, and μd can all reduce the amplitude of oscillations. Moreover, μd can play a critical role in dynamics at appropriate ER–Mt distances (less than 65 nm). In future work, we will continue to study the influence of mitochondrial ATP and important calcium channel parameters on oscillations. Additionally, we will improve our model by adding other intracellular calcium pools (such as nucleus, Golgi apparatus, etc.), to make our model more accurate. Although we have oversimplified some details, we believe that this model is still useful and can provide us with some insights into the mechanism of mast cell calcium signaling regulation.
Author Contributions
Conceptualization, W.Y.; software, M.S.; formal analysis, M.S., Y.L.; data curation, M.S.; writing—original draft preparation, M.S.; writing—review and editing, W.Y., Y.L.; visualization, M.S., Y.L., W.Y.; supervision, W.Y.; project administration, W.Y.; funding acquisition, W.Y. All authors have read and agreed to the published version of the manuscript.
Funding
This research was funded by National Natural Science Foundation of China (grant number: 12172092, 82174488) and Shanghai Key Laboratory of Acupuncture Mechanism and Acupoint Function (grant number: 21DZ2271800).
Institutional Review Board Statement
Not applicable.
Informed Consent Statement
Not applicable.
Data Availability Statement
Not applicable.
Conflicts of Interest
The authors declare no conflict of interest.
References
- Ding, N.; Jiang, J.; Qin, P.; Wang, Q.; Hu, J.; Li, Z. Mast cells are important regulator of acupoint sensitization via the secretion of tryptase, 5-hydroxytryptamine, and histamine. PLoS ONE 2018, 13, e0194022. [Google Scholar] [CrossRef] [PubMed]
- Berridge, M.J.; Bootman, M.D.; Roderick, H.L. Calcium signalling: Dynamics, homeostasis and remodelling. Nat. Rev. Mol. Cell Biol. 2003, 4, 517–529. [Google Scholar] [CrossRef]
- Parekh, A.B. Decoding cytosolic Ca2+ oscillations. Trends Biochem. Sci. 2011, 36, 78–87. [Google Scholar] [CrossRef]
- Zhu, L.; Luo, Y.; Chen, T.; Chen, F.; Wang, T.; Hu, Q. Ca2+ oscillation frequency regulates agonist-stimulated gene expression in vascular endothelial cells. J. Cell Sci. 2008, 121, 2511–2518. [Google Scholar] [CrossRef]
- Smedler, E.; Uhlén, P. Frequency decoding of calcium oscillations. Biochim. Biophys. Acta 2013, 1840, 964–969. [Google Scholar] [CrossRef]
- Capite, J.D.; Parekh, A.B. CRAC channels and Ca2+ signaling in mast cells. Immunol. Rev. 2010, 231, 45–58. [Google Scholar] [CrossRef]
- Hoth, M.; Penner, R. Depletion of intracellular calcium stores activates a calcium current in mast cells. Nature 1992, 355, 353–356. [Google Scholar] [CrossRef]
- Baker, H.L.; Errington, R.J.; Davies, S.C.; Campbell, A.K. A mathematical model predicts that calreticulin interacts with the endoplasmic recticulum Ca. Biophys. J. 2002, 82, 582–590. [Google Scholar] [CrossRef]
- Contreras, L.; Drago, I.; Zampese, E.; Pozzan, T. Mitochondria: The calcium connection. BBA Bioenerg. 2010, 1797, 607–618. [Google Scholar] [CrossRef] [PubMed]
- Hajno’czky, G.; Robb-Gaspers, L.D.; Seitz, M.B.; Thomas, A.P. Decoding of cytosolic calcium oscillations in the mitochondria. Cell 1995, 82, 415–424. [Google Scholar] [CrossRef]
- Samanta, K.; Douglas, S.; Parekh, A.B. Mitochondrial Calcium Uniporter MCU Supports Cytoplasmic Ca2+ Oscillations, Store-Operated Ca2+ Entry and Ca2+-Dependent Gene Expression in Response to Receptor Stimulation. PLoS ONE 2014, 9, e101188. [Google Scholar] [CrossRef] [PubMed]
- Ishii, K.; Hirose, K.; Iino, M. Ca2+ shuttling between endoplasmic reticulum and mitochondria underlying Ca2+ oscillations. EMBO J. 2006, 7, 390–396. [Google Scholar] [CrossRef]
- Rizzuto, R.; De Stefani, D.; Raffaello, A.; Mammucari, C. Mitochondria as sensors and regulators of calcium signalling. Nat. Rev. Mol. Cell Biol. 2012, 13, 566–578. [Google Scholar] [CrossRef] [PubMed]
- De Stefani, D.; Rizzuto, R.; Pozzan, T. Calcium in Mitochondria Back and Forth. Annu. Rev. Biochem. 2016, 85, 161–192. [Google Scholar] [CrossRef] [PubMed]
- Csordás, G.; Renken, C.; Várnai, P.; Walter, L.; Weaver, D.; Buttle, K.F.; Balla, T.; Mannella, C.A.; Hajnóczky, G. Structural and functional features and significance of the physical linkage between ER and mitochondria. J. Cell Biol. 2006, 174, 915–921. [Google Scholar] [CrossRef]
- Raturi, A.; Simmen, T. Where the endoplasmic reticulum and the mitochondrion tie the knot: The mitochondria-associated membrane (MAM). Biochim. Biophys. Acta 2013, 1833, 213–224. [Google Scholar] [CrossRef]
- Patergnani, S.; Suski, J.M.; Agnoletto, C.; Bononi, A.; Bonora, M.; De Marchi, E.; Giorgi, C.; Marchi, S.; Missiroli, S.; Poletti, F.; et al. Calcium signaling around Mitochondria Associated Membranes (MAMs). Cell Commun. Signal. 2011, 9, 19. [Google Scholar] [CrossRef]
- de Brito, O.M.; Scorrano, L. An intimate liaison: Spatial organization of the endoplasmic reticulum–mitochondria relationship. EMBO J. 2010, 29, 2715–2723. [Google Scholar] [CrossRef] [PubMed]
- Wei, Y.; Huang, H.; Ding, G. A dynamic model of calcium signaling in mast cells and LTC4 release induced by mechanical stimuli. Chin. Sci. Bull. 2014, 59, 956–963. [Google Scholar]
- Miyakawa, T.; Mizushima, A.; Hirose, K.; Yamazawa, T.; Bezprozvanny, I.; Kurosaki, T.; Iino, M. Ca2+-sensor region of IP3 receptor controls intracellular Ca2+ signaling. EMBO J. 2001, 20, 1674–1680. [Google Scholar] [CrossRef]
- Berridge, M.J. Inositol trisphosphate and calcium signalling mechanisms. Biochim. Biophys. Acta 2009, 1793, 933–940. [Google Scholar] [CrossRef]
- Bezprozvanny, I.; Watras, J.; Ehrlich, B.E. Bell-shaped calcium-response curves of Ins (1,4,5) P3- and calcium-gated channels from endoplasmic reticulum of cerebellum. Nature 1991, 351, 751–754. [Google Scholar] [CrossRef]
- Csordás, G.; Várnai, P.; Golenár, T.; Roy, S.; Purkins, G.; Schneider, T.G.; Balla, T.; Hajnóczky, G. Imaging interorganelle contacts and local calcium dynamics at the ER-mitochondrial interface. Mol. Cell 2010, 39, 121–132. [Google Scholar] [CrossRef]
- Giacomello, M.; Drago, I.; Bortolozzi, M.; Scorzeto, M.; Gianelle, A.; Pizzo, P.; Pozzan, T. Ca2+ hot spots on the mitochondrial surface are generated by Ca2+ mobilization from stores, but not by activation of store-operated Ca2+ channels. Mol. Cell 2010, 38, 280–290. [Google Scholar] [CrossRef]
- Williams, G.S.; Boyman, L.; Chikando, A.C.; Khairallah, R.J.; Lederer, W.J. Mitochondrial calcium uptake. Proc. Natl. Acad. Sci. USA 2013, 110, 10479–10486. [Google Scholar] [CrossRef]
- Di Capite, J.; Shirley, A.; Nelson, C.; Bates, G.; Parekh, A.B. Intercellular Ca2+ wave propagation involving positive feedback between CRAC channels and cysteinyl leukotrienes. FASEB J. 2009, 23, 894–905. [Google Scholar] [CrossRef] [PubMed]
- Osipchuk, Y.; Cahalan, M. Cell-to-cell spread of calcium signals mediated by ATP receptors in mast cells. Nature 1992, 359, 241–244. [Google Scholar] [CrossRef] [PubMed]
- Dupont, G.; Berridge, M.J. Minimal model for signal-induced Ca2+ oscillations and for their frequency encoding through protein phosphorylation. Proc. Natl. Acad. Sci. USA 1990, 87, 1461–1465. [Google Scholar]
- Hufer, T. Model of Intercellular Calcium Oscillations in Hepatocytes: Synchronization of Heterogeneous Cells. Biophys. J. 1999, 77, 1244–1256. [Google Scholar] [CrossRef][Green Version]
- Li, Y.X.; Rinzel, J. Equations for InsP3 Receptor-mediated [Ca2+]i Oscillations Derived from a Detailed Kinetic Model: A Hodgkin-Huxley Like Formalism. J. Theor. Biol. 1994, 166, 461–473. [Google Scholar] [CrossRef] [PubMed]
- Falcke, M.; Hudson, J.; Camacho, P.; Lechleiter, J. Impact of Mitochondrial Ca2+ Cycling on Pattern Formation and Stability. Biophys. J. 1999, 77, 37–44. [Google Scholar] [CrossRef][Green Version]
- Xiao-Min, S.; Zeng-Rong, L. An Intracellular Calcium Oscillations Model Including Mitochondrial Calcium Cycling. Chin. Phys. Lett. 2005, 22, 3206. [Google Scholar] [CrossRef]
- Qi, H.; Li, L.; Shuai, J. Optimal microdomain crosstalk between endoplasmic reticulum and mitochondria for Ca2+ oscillations. Sci. Rep. 2015, 5, 7984. [Google Scholar] [CrossRef]
- Moshkforoush, A.; Ashenagar, B.; Tsoukias, N.M.; Alevriadou, B.R. Modeling the role of endoplasmic reticulum-mitochondria microdomains in calcium dynamics. Sci. Rep. 2019, 9, 17072. [Google Scholar] [CrossRef] [PubMed]
- Kapela, A.; Bezerianos, A.; Tsoukias, N.M. A mathematical model of Ca2+ dynamics in rat mesenteric smooth muscle cell: Agonist and NO stimulation. J. Theor. Biol. 2008, 253, 238–260. [Google Scholar] [CrossRef] [PubMed]
- Silva, H.S.; Kapela, A.; Tsoukias, N.M. A mathematical modelof plasma membrane electro physiology and calcium dynamics in vascular endothelial cells. Am. J. Physiol. Cell Physiol. 2007, 293, 277–293. [Google Scholar] [CrossRef] [PubMed]
- Csordas, G.; Hajnoczky, G. Plasticity of Mitochondrial Calcium Signaling. J. Biol. Chem. 2003, 278, 42273–42282. [Google Scholar] [CrossRef] [PubMed]
- Chalmers, S.; Mccarron, J.G. The mitochondrial membrane potential and Ca2+ oscillations in smooth muscle. J. Cell Sci. 2008, 121 Pt 1, 75–85. [Google Scholar] [CrossRef] [PubMed]
- Mccarron, J.G.; Olson, M.L.; Chalmers, S. Mitochondrial regulation of cytosolic Ca2+ signals in smooth muscle. Pflug. Arch. 2012, 464, 51–62. [Google Scholar] [CrossRef]
- Rizzuto, R.; Pinton, P.; Carrington, W.; Fay, F.S.; Fogarty, K.E.; Lifshitz, L.M.; Tuft, R.A.; Pozzan, T. Close contacts with the endoplasmic reticulum as determinants of mitochondrial Ca2+ responses. Science 1998, 280, 1763–1766. [Google Scholar] [CrossRef]
- Giedt, R.J.; Pfeiffer, D.R.; Matzavinos, A.; Kao CYAlevriadou, B.R. Mitochondrial dynamics and motility inside living vascular endothelial cells: Role of bioenergetics. Ann. Biomed. Eng. 2012, 52, 348–356. [Google Scholar] [CrossRef]
- Higgins, E.R.; Cannell, M.B.; Sneyd, J. A buffering SERCA pump in models of calcium dynamics. Biophys. J. 2006, 91, 151–163. [Google Scholar] [CrossRef] [PubMed]
- Kummer, U.; Olsen, L.F.; Dixon, C.J.; Green, A.K.; Bornberg-Bauer, E.; Baier, G. Switching from simple to complex oscillations in calcium signaling. Biphys. J. 2000, 79, 1188–1195. [Google Scholar] [CrossRef]
- Nash, M.S.; Young, K.W.; Challiss, R.A.J.; Nahorski, S.R. Intracellular signalling: Receptor-specific messenger oscillations. Nature 2011, 413, 381–382. [Google Scholar] [CrossRef] [PubMed]
- Politi, A.; Gaspers, L.D.; Thomas, A.P.; Höfer, T. Models of IP3 and Ca2+ oscillations: Frequency encoding and identification of underlying feedbacks. Biophys. J. 2006, 90, 3120–3133. [Google Scholar] [CrossRef] [PubMed]
- Michalak, M.; Parker, J.R.; Opas, M. Ca2+ signaling and calcium binding chaperones of the endoplasmic reticulum. Cell Calcium 2002, 32, 269–278. [Google Scholar] [CrossRef]
Publisher’s Note: MDPI stays neutral with regard to jurisdictional claims in published maps and institutional affiliations. |
© 2021 by the authors. Licensee MDPI, Basel, Switzerland. This article is an open access article distributed under the terms and conditions of the Creative Commons Attribution (CC BY) license (https://creativecommons.org/licenses/by/4.0/).