Article

A Comparative Study between Discrete Stochastic Arithmetic and Floating-Point Arithmetic to Validate the Results of Fractional Order Model of Malaria Infection

1
Department of Applied Mathematics and Programming, South Ural State University, Lenin Prospect 76, 454080 Chelyabinsk, Russia
2
Industrial Mathematics Laboratory, Baikal School of BRICS, Irkutsk National Research Technical University, 664074 Irkutsk, Russia
3
Department of Engineering Science, Bandırma Onyedi Eylül University, Bandırma 10200, Balıkesir, Turkey
4
Department of Mathematics, Comsats University Islamabad, Islamabad 45550, Pakistan
*
Author to whom correspondence should be addressed.
Mathematics 2021, 9(12), 1435; https://doi.org/10.3390/math9121435
Submission received: 8 May 2021 / Revised: 15 June 2021 / Accepted: 17 June 2021 / Published: 20 June 2021
(This article belongs to the Special Issue Mathematical Modeling and Its Application in Medicine)

Abstract

:
The researchers aimed to study the nonlinear fractional order model of malaria infection based on the Caputo-Fabrizio fractional derivative. The homotopy analysis transform method (HATM) is applied based on the floating-point arithmetic (FPA) and the discrete stochastic arithmetic (DSA). In the FPA, to show the accuracy of the method we use the absolute error which depends on the exact solution and a positive value ε . Because in real life problems we do not have the exact solution and the optimal value of ε , we need to introduce a new condition and arithmetic to show the efficiency of the method. Thus the CESTAC (Controle et Estimation Stochastique des Arrondis de Calculs) method and the CADNA (Control of Accuracy and Debugging for Numerical Applications) library are applied. The CESTAC method is based on the DSA. Also, a new termination criterion is used which is based on two successive approximations. Using the CESTAC method we can find the optimal approximation, the optimal error and the optimal iteration of the method. The main theorem of the CESTAC method is proved to show that the number of common significant digits (NCSDs) between two successive approximations are almost equal to the NCSDs of the exact and approximate solutions. Plotting several graphs, the regions of convergence are demonstrated for different number of iterations k = 5, 10. The numerical results based on the simulated data show the advantages of the DSA in comparison with the FPA.

1. Introduction

Malaria is a life-threatening disease caused by a parasite. The causative agent of this disease to humans is the bite of infected female Anopheles mosquitoes. But malaria is a preventable and treatable disease. According to studies, malaria can be caused by five types of parasites in humans, so that two of them can be a dangerous threat to humans. In 2019, almost half of the world’s population was at risk for malaria. Sub-Saharan Africa has the highest mortality rate. In 2019, there were about 229 million malaria cases, and the estimated number of malaria deaths was 409,000 [1].
Given the above, it is easy to understand the importance of examining this disease. Accordingly, various mathematical models have been proposed to control and predict the behavior of this disease according to various human and environmental factors. The optimal control for a fractional order malaria transmission model has been studied by Sweilam et al. [2]. The comparison of mathematical frameworks for modeling erythropoiesis in the context of malaria infection and the numerical simulation of a reaction-diffusion malaria infection model using B-splines collocation have been illustrated by Fonseca et al. [3] and Mittal et al. [4]. The effects of climate change on Plasmodium vivax malaria transmission dynamics based on mathematical models and the endectocide-treated cattle for malaria control are studied by Kim et al. [5] and Yakob [6]. Recently, many authors have focused on solving the mathematical models. Naik et al. [7] have discussed the fractional model of human immunodeficiency virus (HIV) infection under immune control. The HIV transmission with memory and the optimal control on fractional model of HIV infection has been illustrated by Naik et al. [8,9]. The modified epidemiological model of computer viruses and the homotopy analysis method (HAM) has been applied to solve this model by Noeiaghdam et al. [10,11]. The fractional model of energy systems to control the supply and demand of energy has been explained by Noeiaghdam et al. [12] and solving the fractional system of partial differential equations has been demonstrated by Suleman et al. [13].
There are many mathematical and engineering problems that can be solved using the HAM. Liao for the first time has presented the HAM to solve the linear and nonlinear problems [14,15,16]. As we know, in this method we are free to choose the auxiliary functions and parameters that it is one of abilities of this method than other methods. The HAM for solving the singular Volterra integral equations [17], solving integral equations using the homotopy-regularization method [18] and solving integral equations based on finding the optimal convergence control parameter of the HAM [19] are only some of the applications of the HAM and HATM for solving linear and nonlinear problems.
We should know that all mathematical methods that we apply to solve the problems are based on the FPA and we apply the mathematical applications such as Mathematica, Maple and Matlab to provide the accurate results. In the FPA, when we want to show the accuracy of the method we apply the traditional absolute error. Also in order to control the accuracy, this condition depends on a small positive value ε . But we should know that in the real life problems we do not have the exact solution. On the other hand, we do not know the optimal value of ε . Thus we will have one or two iterations for large values of ε without producing the accurate results and large number of iterations for small values of ε without improving the accuracy. This is the big fault of the mathematical methods based on the FPA.
Because of these problems we introduce the DSA instead of the FPA. In the DSA, we should apply the CESTAC method to validate the numerical results. The mathematical methods can be implemented on the DSA using the CADNA library. In this method, we do not need to apply the absolute error. The termination criterion of the CESTAC method is based on two successive approximations and in the right hand side instead of ε we have @ . 0 . This sign is the informatical zero. It can be produced only in the CESTAC method by the CADNA library and it shows that the NCSDs between two successive approximations are almost equal to zero [20,21,22,23]. The CADNA library should be done on Linux operating system and all CADNA codes should be written using C, C++, FORTRAN or ADA codes [24]. Recently, many methods have been validated using the CESTAC method and the CADNA library to solve various problems. This method has been applied to validate the numerical results of the homotopy analysis method, the homotopy perturbation method and the Admoian decomposition method for solving different kinds of integral equations [19,25,26]. Dynamical validation of fuzzy integral equations [27], control of accuracy on the load leveling problem [28], solving the reverse osmosis system [29,30], validation of collocation method for various problems [31], validation of mathematical models [32] and finding the optimal regularized parameter of the regularization method [18] are some applications of the CESTAC method and the CADNA library.
In this paper the fractional order model of malaria infection is introduced. The HATM is applied to solve the model. For this aim, the Laplace transformations as the linear operator of the HATM is used. Also the CESTAC method and the CADNA library are introduced and the advantages of the CESTAC method are discussed. The main theorem of the CESTAC method is proved. Using the method, the approximate solution of the problem is obtained and applying the CADNA library the numerical results are validated. Plotting several -curves the convergence regions are found. The numerical results are presented based on the FPA and the DSA. Comparing the results, the advantages of the DSA than the FPA to solve the fractional order of malaria infection can be found.

2. Preliminaries

In this section, we present some definitions and details of the fractional derivatives [33,34,35].
Definition 1.
Let g be a continuous function then the ρ-th order Caputo fractional derivative can be defined via integrable differentiations as follows
C D ρ g ( t ) = 1 Γ ( n ρ ) 0 t g ( n ) ( s ) ( t s ) ρ n + 1 d s , n = [ ρ ] + 1 .
Definition 2.
The ρ-th order Caputo-Fabrizio derivative for b > a , g H 1 ( a , b ) , and ρ ( 0 , 1 ) is defined in the following form
C F D ρ g ( t ) = M ( ρ ) 1 ρ a t e x p ρ 1 ρ ( t s ) g ( s ) d s , t 0 ,
where M ( ρ ) shows a normalization function and M ( 0 ) = M ( 1 ) = 1 . For function g which is not member of H 1 ( a , b ) , this derivative can be presented for g L 1 ( ˘ , b ) as follows:
C F D ρ g ( t ) = ρ M ( ρ ) 1 ρ b ( g ( t ) g ( s ) ) e x p ( ρ 1 ρ ( t s ) ) d s , 0 < ρ < 1 .
Also, ρ + n -th order fractional derivative C F D ρ + n for n 1 and ρ ( 0 , 1 ) can be defined as C F D ρ + n g ( t ) : = C F D ρ ( D n g ( t ) ) .
Definition 3.
For 0 < ρ 1 and M ( ρ ) = 1 , the Laplace transform for the Caputo-Fabrizio derivative can be presented in the following form
L [ C F D ρ + n g ( t ) ] ( s ) = s n + 1 L [ g ( t ) ] s n g ( 0 ) s n 1 g ( 0 ) . . . f ( n ) ( 0 ) s + ρ ( 1 s ) .
Definition 4.
The ρ-order Riemann-Liouville fractional integral for R e ( ρ ) > 0 is specified as
I ρ g ( t ) = 1 Γ ( ρ ) 0 t ( t s ) ρ 1 g ( s ) d s .
Definition 5.
The fractional integral of Caputo-Fabrizio is defined by
C F I ρ g ( t ) = 2 ( 1 ρ ) ( 2 ρ ) M ( ρ ) g ( t ) + 2 ( ρ ) ( 2 ρ ) M ( ρ ) 0 t g ( s ) d s , 0 < ρ < 1 .
Also, the left and right fractional integrals of ( a C F D ρ ) are defined [36] respectively by
( C F I a ρ g ) ( t ) = 1 ρ B ( ρ ) g ( t ) + ρ B ( ρ ) a t g ( s ) d s , ( C F I b ρ g ) ( t ) = 1 ρ B ( ρ ) g ( t ) + ρ B ( ρ ) t b g ( s ) d s .

3. Fractional Order Model of Malaria Infection

In this section, we consider the following fractional order malaria infection model [6]
0 C F D t ρ Ψ I = m P H β H Ψ S Ψ Z ( ε + μ H ) Ψ I , 0 C F D t ρ Ψ R = ε Ψ I + k Ψ A ( θ m P H β H Ψ Z + τ + μ H ) Ψ R , 0 C F D t ρ Ψ A = θ m P H β H Ψ R Ψ Z ( k + μ H ) Ψ A , 0 C F D t ρ Ψ Y = P H β Z ( Ψ I + σ Ψ A ) Ψ X ( ξ + μ v ) Ψ Y , 0 C F D t ρ Ψ Z = ξ Ψ Y μ v Ψ Z ,
where 0 < ρ 1 is the order of Caputo–Fabrizio fractional derivative and Ψ I ( 0 ) = Ψ 0 I , Ψ R ( 0 ) = Ψ 0 R , Ψ A ( 0 ) = Ψ 0 A , Ψ Y ( 0 ) = Ψ 0 Y and Ψ Z ( 0 ) = Ψ 0 Z . Ψ Z shows the infectious mosquitoes, Ψ S is the bited susceptible hosts and Ψ I is the infected hosts where the infected hosts before reversion to fully susceptible at rate τ can have level of temporary immunity ( 1 θ , where 0 θ 1 ). The hosts can become asymptomatically infected Ψ A during the recovered state Ψ R . Symptomatic infection is a temporary condition that may have different transmission potentials to ( σ ) carriers, after which people return to the improved group at a rate of κ . In this model, considering that a fixed human population is assumed, human mortality is compensated by births and we get Ψ S = 1 ( Ψ I + Ψ R + Ψ A ) . Sensitive ( Ψ X ) vectors begin to become infected after being bitten by an infected infectious host, but they are not yet infected ( Ψ Y ) , but after the extrinsic incubation period ( 1 ξ ) , become infectious ( Ψ Z ) . We apply m to show the ratio of vector-to-hosts which vectors typically outnumber hosts. Here, a stable vector population is assumed whereby births are set to balance deaths ( μ v ) and so Ψ X = 1 ( Ψ Y + Ψ Z ) . All parameters and values are detailed in Table 1 based on the mentioned data in [6].

4. Homotopy Analysis Transform Method

Applying the Laplace transform for both sides of Equation (1) we get
L [ 0 C F D t ρ Ψ I ] = L [ m P H β H Ψ S Ψ Z ( ε + μ H ) Ψ I ] , L [ 0 C F D t ρ Ψ R ] = L [ ε Ψ I + κ Ψ A ( θ m P H β H Ψ Z + τ + μ H ) Ψ R ] , L [ 0 C F D t ρ Ψ A ] = L [ θ m P H β H Ψ R Ψ Z ( κ + μ H ) Ψ A ] , L [ 0 C F D t ρ Ψ Y ] = L [ P H β Z ( Ψ I + σ Ψ A ) Ψ X ( ξ + μ v ) Ψ Y ] , L [ 0 C F D t ρ Ψ Z ] = L [ ξ Ψ Y μ v Ψ Z ] ,
and we can write
s L ( Ψ I ) Ψ I ( 0 ) s + ρ ( 1 s ) = L [ m P H β H Ψ S Ψ Z ( ε + μ H ) Ψ I ] , s L ( Ψ R ) Ψ R ( 0 ) s + ρ ( 1 s ) = L [ ε Ψ I + κ Ψ A ( θ m P H β H Ψ Z + τ + μ H ) Ψ R ] , s L ( Ψ A ) Ψ A ( 0 ) s + ρ ( 1 s ) = L [ θ m P H β H Ψ R Ψ Z ( κ + μ H ) Ψ A ] , s L ( Ψ Y ) Ψ Y ( 0 ) s + ρ ( 1 s ) = L [ P H β Z ( Ψ I + σ Ψ A ) Ψ X ( ξ + μ v ) Ψ Y ] , s L ( Ψ Z ) Ψ Z ( 0 ) s + ρ ( 1 s ) = L [ ξ Ψ Y μ v Ψ Z ] .
Now, we have
L ( Ψ I ) Ψ 0 I s s + ρ ( 1 s ) s L [ m P H β H Ψ S Ψ Z ( ε + μ H ) Ψ I ] = 0 , L ( Ψ R ) Ψ 0 R s s + ρ ( 1 s ) s L [ ε Ψ I + κ Ψ A ( θ m P H β H Ψ Z + τ + μ H ) Ψ R ] = 0 , L ( Ψ A ) Ψ 0 A s s + ρ ( 1 s ) s L [ θ m P H β H Ψ R Ψ Z ( κ + μ H ) Ψ A ] = 0 , L ( Ψ Y ) Ψ 0 Y s s + ρ ( 1 s ) s L [ P H β Z ( Ψ I + σ Ψ A ) Ψ X ( ξ + μ v ) Ψ Y ] = 0 , L ( Ψ Z ) Ψ 0 Z s s + ρ ( 1 s ) s L [ ξ Ψ Y μ v Ψ Z ] = 0 ,
We define the nonlinear operator as follows
N 1 ( φ 1 ( t ; p ) , . . . , φ 5 ( t ; p ) ) = L ( φ 1 ( t ; p ) ) Ψ 0 I s s + ρ ( 1 s ) s L [ m P H β H Ψ S φ 5 ( t ; p ) ( ε + μ H ) φ 1 ( t ; p ) ] , N 2 ( φ 1 ( t ; p ) , . . . , φ 5 ( t ; p ) ) = L ( φ 2 ( t ; p ) ) Ψ 0 R s s + ρ ( 1 s ) s L [ ε φ 1 ( t ; p ) + κ φ 3 ( t ; p ) ( θ m P H β H φ 5 ( t ; p ) + τ + μ H ) φ 2 ( t ; p ) ] , N 3 ( φ 1 ( t ; p ) , . . . , φ 5 ( t ; p ) ) = L ( φ 3 ( t ; p ) ) Ψ 0 A s s + ρ ( 1 s ) s L [ θ m P H β H φ 2 ( t ; p ) φ 5 ( t ; p ) ( κ + μ H ) φ 3 ( t ; p ) ] , N 4 ( φ 1 ( t ; p ) , . . . , φ 5 ( t ; p ) ) = L ( φ 4 ( t ; p ) ) Ψ 0 Y s s + ρ ( 1 s ) s L [ P H β Z ( φ 1 ( t ; p ) + σ φ 3 ( t ; p ) ) Ψ X ( ξ + μ v ) φ 4 ( t ; p ) ] , N 5 ( φ 1 ( t ; p ) , . . . , φ 5 ( t ; p ) ) = L ( φ 5 ( t ; p ) ) Ψ 0 Z s s + ρ ( 1 s ) s L [ ξ φ 4 ( t ; p ) μ v φ 5 ( t ; p ) ] ,
and using Equation (5), the zero order deformation equations can be defined as
( 1 p ) L [ φ 1 ( t ; p ) Ψ 0 I ( t ) ] = p H ( t ) N 1 ( φ 1 ( t ; p ) , . . . , φ 5 ( t ; p ) ) , ( 1 p ) L [ φ 2 ( t ; p ) Ψ 0 R ( t ) ] = p H ( t ) N 2 ( φ 1 ( t ; p ) , . . . , φ 5 ( t ; p ) ) , ( 1 p ) L [ φ 3 ( t ; p ) Ψ 0 A ( t ) ] = p H ( t ) N 3 ( φ 1 ( t ; p ) , . . . , φ 5 ( t ; p ) ) , ( 1 p ) L [ φ 4 ( t ; p ) Ψ 0 Y ( t ) ] = p H ( t ) N 4 ( φ 1 ( t ; p ) , . . . , φ 5 ( t ; p ) ) , ( 1 p ) L [ φ 5 ( t ; p ) Ψ 0 Z ( t ) ] = p H ( t ) N 5 ( φ 1 ( t ; p ) , . . . , φ 5 ( t ; p ) ) ,
where p [ 0 , 1 ] is the embedding parameter, 0 and H ( t ) 0 are the auxiliary parameter and function and L shows an auxiliary linear operator. Also, φ j ( t ; p ) for j = 1 , 2 , 3 , 4 , 5 are unknown functions and Ψ 0 I ( t ) , Ψ 0 R ( t ) , Ψ 0 A ( t ) , Ψ 0 Y ( t ) and Ψ 0 Z ( t ) are the initial guesses of Ψ I ( t ) , Ψ R ( t ) , Ψ A ( t ) , Ψ Y ( t ) and Ψ Z ( t ) . By replacing 0,1 instead of p we get
φ 1 ( t ; 0 ) = Ψ 0 I ( t ) , φ 1 ( t ; 1 ) = Ψ I ( t ) , φ 2 ( t ; 0 ) = Ψ 0 R ( t ) , φ 2 ( t ; 1 ) = Ψ R ( t ) , φ 3 ( t ; 0 ) = Ψ 0 A ( t ) , φ 3 ( t ; 1 ) = Ψ A ( t ) , φ 4 ( t ; 0 ) = Ψ 0 Y ( t ) , φ 4 ( t ; 1 ) = Ψ Y ( t ) , φ 5 ( t ; 0 ) = Ψ 0 Z ( t ) , φ 5 ( t ; 1 ) = Ψ Z ( t ) ,
thus clearly we can see that by increasing p from 0 to 1, the solution can be produced from initial guesses Ψ 0 I ( t ) , Ψ 0 R ( t ) , Ψ 0 A ( t ) , Ψ 0 Y ( t ) and Ψ 0 Z ( t ) to the solutions Ψ I ( t ) , Ψ R ( t ) , Ψ A ( t ) , Ψ Y ( t ) and Ψ Z ( t ) . Applying Taylor series we get
φ 1 ( t ; p ) = Ψ 0 I + k = 1 Ψ k I ( t ) p k , φ 2 ( t ; p ) = Ψ 0 R + k = 1 Ψ k R ( t ) p k , φ 3 ( t ; p ) = Ψ 0 A + k = 1 Ψ k A ( t ) p k , φ 4 ( t ; p ) = Ψ 0 Y + k = 1 Ψ k Y ( t ) p k , φ 5 ( t ; p ) = Ψ 0 Z + k = 1 Ψ k Z ( t ) p k ,
where Ψ k I ( t ) = 1 k ! k φ 1 ( t ; p ) p k | p = 0 , Ψ k R ( t ) = 1 k ! k φ 2 ( t ; p ) p k | p = 0 , Ψ k A ( t ) = 1 k ! k φ 3 ( t ; p ) p k | p = 0 , Ψ k Y ( t ) = 1 k ! k φ 4 ( t ; p ) p k | p = 0 and Ψ k Z ( t ) = 1 k ! k φ 5 ( t ; p ) p k | p = 0 . By choosing suitable values for auxiliary functions and parameters, series (8) will be convergent at p = 1 and we have
Ψ I ( t ) = Ψ 0 I + k = 1 Ψ k I ( t ) , Ψ R ( t ) = Ψ 0 R + k = 1 Ψ k R ( t ) , Ψ A ( t ) = Ψ 0 A + k = 1 Ψ k A ( t ) , Ψ Y ( t ) = Ψ 0 Y + k = 1 Ψ k Y ( t ) , Ψ Z ( t ) = Ψ 0 Z + k = 1 Ψ k Z ( t ) .
The k-th order deformation equation can be constructed as follows
L [ Ψ k I ( t ) χ k Ψ k 1 I ( t ) ] = H ( t ) R 1 , k ( Ψ k 1 I ) , L [ Ψ k R ( t ) χ k Ψ k 1 R ( t ) ] = H ( t ) R 2 , k ( Ψ k 1 R ) , L [ Ψ k A ( t ) χ k Ψ k 1 A ( t ) ] = H ( t ) R 3 , k ( Ψ k 1 A ) , L [ Ψ k Y ( t ) χ k Ψ k 1 Y ( t ) ] = H ( t ) R 4 , k ( Ψ k 1 Y ) , L [ Ψ k Z ( t ) χ k Ψ k 1 Z ( t ) ] = H ( t ) R 5 , k ( Ψ k 1 Z ) ,
where
R 1 , k ( Ψ I k 1 ( t ) , Ψ R k 1 ( t ) , Ψ A k 1 ( t ) , Ψ Y k 1 ( t ) , Ψ Z k 1 ( t ) ) = L ( Ψ k 1 I ) Ψ 0 I s ( 1 χ k ) s + ρ ( 1 s ) s L [ m P H β H Ψ k 1 S Ψ k 1 Z ( ε + μ H ) Ψ k 1 I ] , R 2 , k ( Ψ I k 1 ( t ) , Ψ R k 1 ( t ) , Ψ A k 1 ( t ) , Ψ Y k 1 ( t ) , Ψ Z k 1 ( t ) ) = L ( R k 1 ) Ψ 0 R s ( 1 χ k ) s + ρ ( 1 s ) s L [ ε Ψ k 1 I + κ Ψ k 1 A ( θ m P H β H Ψ k 1 Z + τ + μ H ) Ψ k 1 R ] , R 3 , k ( Ψ I k 1 ( t ) , Ψ R k 1 ( t ) , Ψ A k 1 ( t ) , Ψ Y k 1 ( t ) , Ψ Z k 1 ( t ) ) = L ( Ψ k 1 A ) Ψ 0 A s ( 1 χ k ) s + ρ ( 1 s ) s L [ θ m P H β H Ψ k 1 R Ψ k 1 Z ( κ + μ H ) Ψ k 1 A ] , R 4 , k ( Ψ I k 1 ( t ) , Ψ R k 1 ( t ) , Ψ A k 1 ( t ) , Ψ Y k 1 ( t ) , Ψ Z k 1 ( t ) ) = L ( Ψ k 1 Y ) Ψ 0 Y s ( 1 χ k ) s + ρ ( 1 s ) s L [ P H β Z ( Ψ k 1 I + σ Ψ k 1 A ) Ψ k 1 X ( ξ + μ v ) Ψ k 1 Y ] , R 5 , k ( Ψ I k 1 ( t ) , Ψ R k 1 ( t ) , Ψ A k 1 ( t ) , Ψ Y k 1 ( t ) , Ψ Z k 1 ( t ) ) = L ( Ψ k 1 Z ) Ψ 0 Z s ( 1 χ k ) s + ρ ( 1 s ) s L [ ξ Ψ k 1 Y μ v Ψ k 1 Z ] .
Applying inverse Laplace transform for both sides of the k-th order deformation Equation (10) we get
Ψ k I ( t ) = χ k Ψ k 1 I ( t ) + H ( t ) L 1 [ R 1 , k ( Ψ k 1 I ) ] , Ψ k R ( t ) = χ k Ψ k 1 R ( t ) + H ( t ) L 1 [ R 2 , k ( Ψ k 1 R ) ] , Ψ k A ( t ) = χ k Ψ k 1 A ( t ) + H ( t ) L 1 [ R 3 , k ( Ψ k 1 A ) ] , Ψ k Y ( t ) = χ k Ψ k 1 Y ( t ) + H ( t ) L 1 [ R 4 , k ( Ψ k 1 Y ) ] , Ψ k Z ( t ) = χ k Ψ k 1 Z ( t ) + H ( t ) L 1 [ R 5 , k ( Ψ k 1 Z ) ] ,
and by substituting the suitable values of χ k as
χ k = 0 , k 1 , 1 , k > 1 .
the approximate solutions will be obtained using the following series
Ψ k I ( t ) = j = 0 k Ψ j I ( t ) , Ψ k R ( t ) = j = 0 k Ψ j R ( t ) , Ψ k A ( t ) = j = 0 k Ψ j A ( t ) , Ψ k Y ( t ) = j = 0 k Ψ j Y ( t ) , Ψ k Z ( t ) = j = 0 k Ψ j Z ( t ) .

5. Discrete Stochastic Arithmetic-CESTAC Method

In the mathematical methods based on the FPA, researchers have applied the absolute error or difference between to discuss the accuracy of the methods as follows
| Ψ I ( t ) Ψ k I ( t ) | < ε , o r | Ψ k I ( t ) Ψ k 1 I ( t ) | < ε ,
where Ψ I ( t ) and Ψ k I ( t ) are the exact and approximate solutions of the problem and ε is a small positive value. But this condition can not be acceptable. In the real life problems we do not know the exact solution. Also, generally the researchers do not know the optimal value of ε . If we choose a small value as ε we will have huge number of iterations without improving the accuracy of the results and we will have so many extra iterations. Also, if we choose a large value as ε , the algorithm will be stopped at the first step without producing accurate results. Thus we propose the CESTAC method and the CADNA library which are based on the SA and instead of the stopping condition (14) we have new termination criterion
| Ψ k I ( x ) Ψ k 1 I ( x ) | = @ . 0 ,
where Ψ k I ( t ) and Ψ k 1 I ( t ) are two successive approximations and @ . 0 denotes the informatical zero [24,37,38,39].
In order to apply the CESTAC method, we collect all representable values by computer in set B. For w * R with α mantissa bits we can write the value W * B based on the binary FPA as
W * = w * ρ 2 E α ϕ ,
where ρ , 2 α ϕ and E show the sign, missing segment of the mantissa and the binary exponent of the result respectively [20,21,24,37]. By changing value α from 24 to 53, the accuracy of the results can be changed from single to double precisions. Let ϕ be a casual variable which is uniformly distributed on [ 1 , 1 ] . Making perturbation on the last mantissa bit of W * , the mean ( μ ) and the standard deviation ( σ ) can be found for the results of W * . It means that if we have k samples of W * as Φ = W 1 * , W 2 * , . . . , W k * and make perturbation on the last mantissa bit then we will have W ˜ * = i = 1 k W i * k and σ 2 = i = 1 k ( W i * W ˜ * ) 2 k 1 . Now, we will be able to find the NCSDs of W * and W ˜ * as
C W ˜ * , W * = log 10 k W ˜ * τ δ σ
where τ δ is the value of T distribution as the confidence interval is 1 δ , with k 1 freedom degree. In the CESTAC method, if we have W ˜ * = 0 or C W ˜ * , W * 0 , the algorithm will be stopped by showing the informatical zero sign as W * = @ . 0 . The mentioned process of the CESTAC method will be done using the CADNA library. Thus we do not need to produce the samples or calculate the mean and standard deviation values. We should apply the CADNA codes to write the solving process and after that all steps of the CESTAC method will be done using this library. For more details of this method and the CADNA library please see [20,21,24,37].
We have the following highlights on the CESTAC method and the CADNA library [22,23,38]:
  • In this method we do not need to have the exact solution.
  • In the CESTAC method the termination criterion does not depend on small values like ε .
  • The stopping condition of the CESTAC method depends on two successive iterations.
  • In the CESTAC method we have the informatical zero sign @ . 0 to show that the NCSDs between two successive approximations is zero. This sign can be produced only by the CADNA library.
  • Using the CESTAC method and the CADNA library producing the extra iterations can be prevented.
  • Applying this method the optimal number of iterations, optimal approximation and error can be found.
  • The CADNA library can find some of the numerical instabilities.
  • The CADNA library should be run on LINUX operating system.
  • The CADNA codes should be written using C, C++, FORTRAN or ADA codes.
Definition 6.
For two real numbers ω 1 and ω 2 , the NCSDs can be defined [37,38] as
C ω 1 , ω 2 = log 10 ω 1 + ω 2 2 ( ω 1 ω 2 ) = log 10 ω 1 ω 1 ω 2 1 2 , ω 1 ω 2 , C ω 1 , ω 1 = + .
Theorem 1.
Assume that the series (13) are the approximate solutions of the mathematical model of Malaria infection (1) which are produced by the HATM, then the NCSDs between two successive approximations are almost equal to the NCSDs between the exact and approximate solutions.
Proof. 
Using Definition 6 we have
C Ψ k I , Ψ k + 1 I C Ψ k I , Ψ I = log 10 Ψ k I + Ψ k + 1 I 2 ( Ψ k I Ψ k + 1 I ) log 10 Ψ k I + Ψ I 2 ( Ψ k I Ψ I ) = log 10 Ψ k I + Ψ k + 1 I 2 ( Ψ k + 1 I ) log 10 Ψ k I + Ψ I 2 ( Ψ k I Ψ I ) = log 10 Ψ k I + Ψ k + 1 I Ψ k I + Ψ I + log 10 Ψ k I Ψ I Ψ k + 1 I .
By increasing the iterations number k, we can see in the first term of Equation (18), the approximate and exact solutions Ψ k I , Ψ I are close together and we can neglect that. For the second term we have
log 10 Ψ k I Ψ I Ψ k + 1 I = log 10 i = 0 k Ψ i I i = 0 Ψ i I Ψ k + 1 I = log 10 i = k + 1 Ψ i I Ψ k + 1 I = log 10 1 + i = k + 2 L 1 H ( t ) i ( u i 1 ) L 1 H ( t ) k + 1 ( u k ) .
Based on the traditional HAM we can write
i = k + 2 L 1 H ( t ) i ( u i 1 ) L 1 H ( t ) k + 1 ( u k ) = i = k + 2 L 1 H ( t ) 1 ( i 1 ) ! i 1 N [ U ( t , v ) ] v i 1 | v = 0 L 1 H ( t ) 1 k ! k N [ U ( t , v ) ] v k | v = 0 = L 1 H ( t ) 1 ( k + 1 ) ! k + 1 N [ U ( t , v ) ] v k + 1 | v = 0 L 1 H ( t ) 1 k ! k N [ U ( t , v ) ] v k | v = 0 + L 1 H ( t ) 1 ( k + 2 ) ! k + 2 N [ U ( t , v ) ] v k + 2 | v = 0 L 1 H ( t ) 1 k ! k N [ U ( t , v ) ] v k | v = 0 + = O ( 1 k ) .
Therefore, we get
log 10 Ψ k I Ψ I Ψ k + 1 I = log 10 1 + O ( 1 k ) .
By repeating the process for other terms we have
log 10 Ψ k R Ψ R Ψ k + 1 R = log 10 1 + O ( 1 k ) , log 10 Ψ k Y Ψ Y Ψ k + 1 Y = log 10 1 + O ( 1 k ) , log 10 Ψ k A Ψ A Ψ k + 1 A = log 10 1 + O ( 1 k ) , log 10 Ψ k Z Ψ Z Ψ k + 1 Z = log 10 1 + O ( 1 k ) .
Since O ( 1 k ) < < 1 , then the right hand side of above relation decreases as k increases. Thus, the proof is complete. □

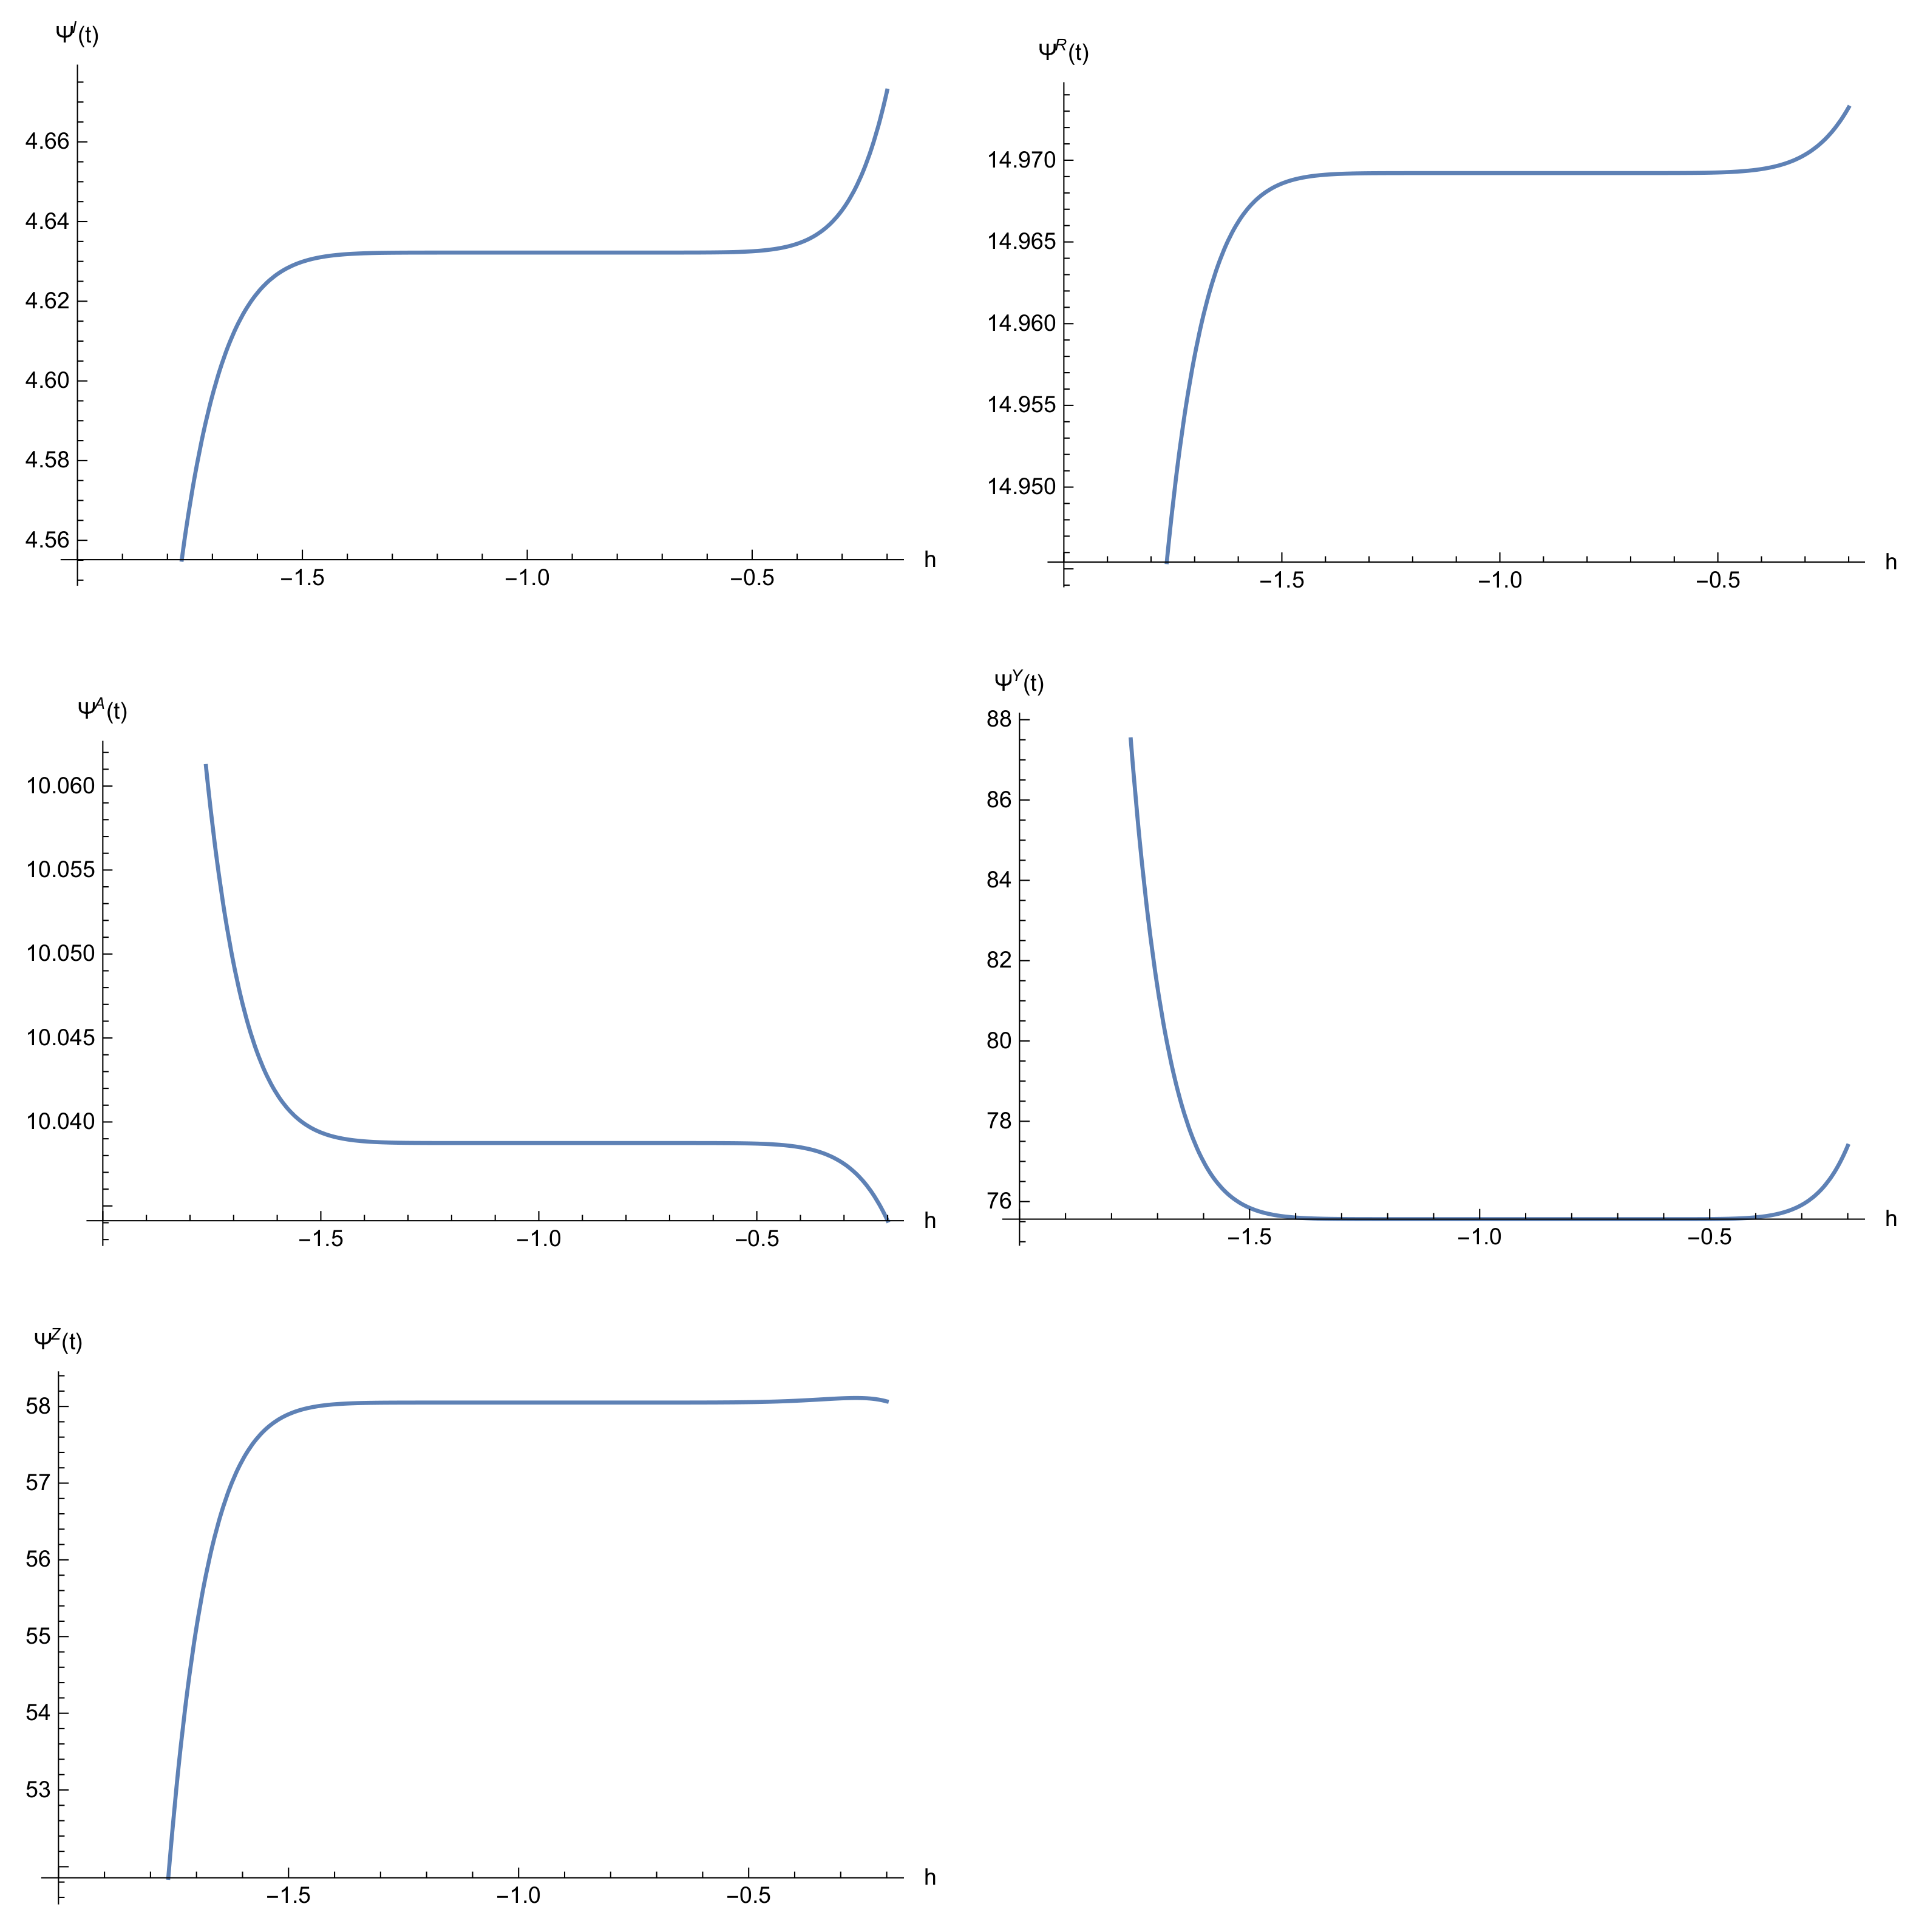
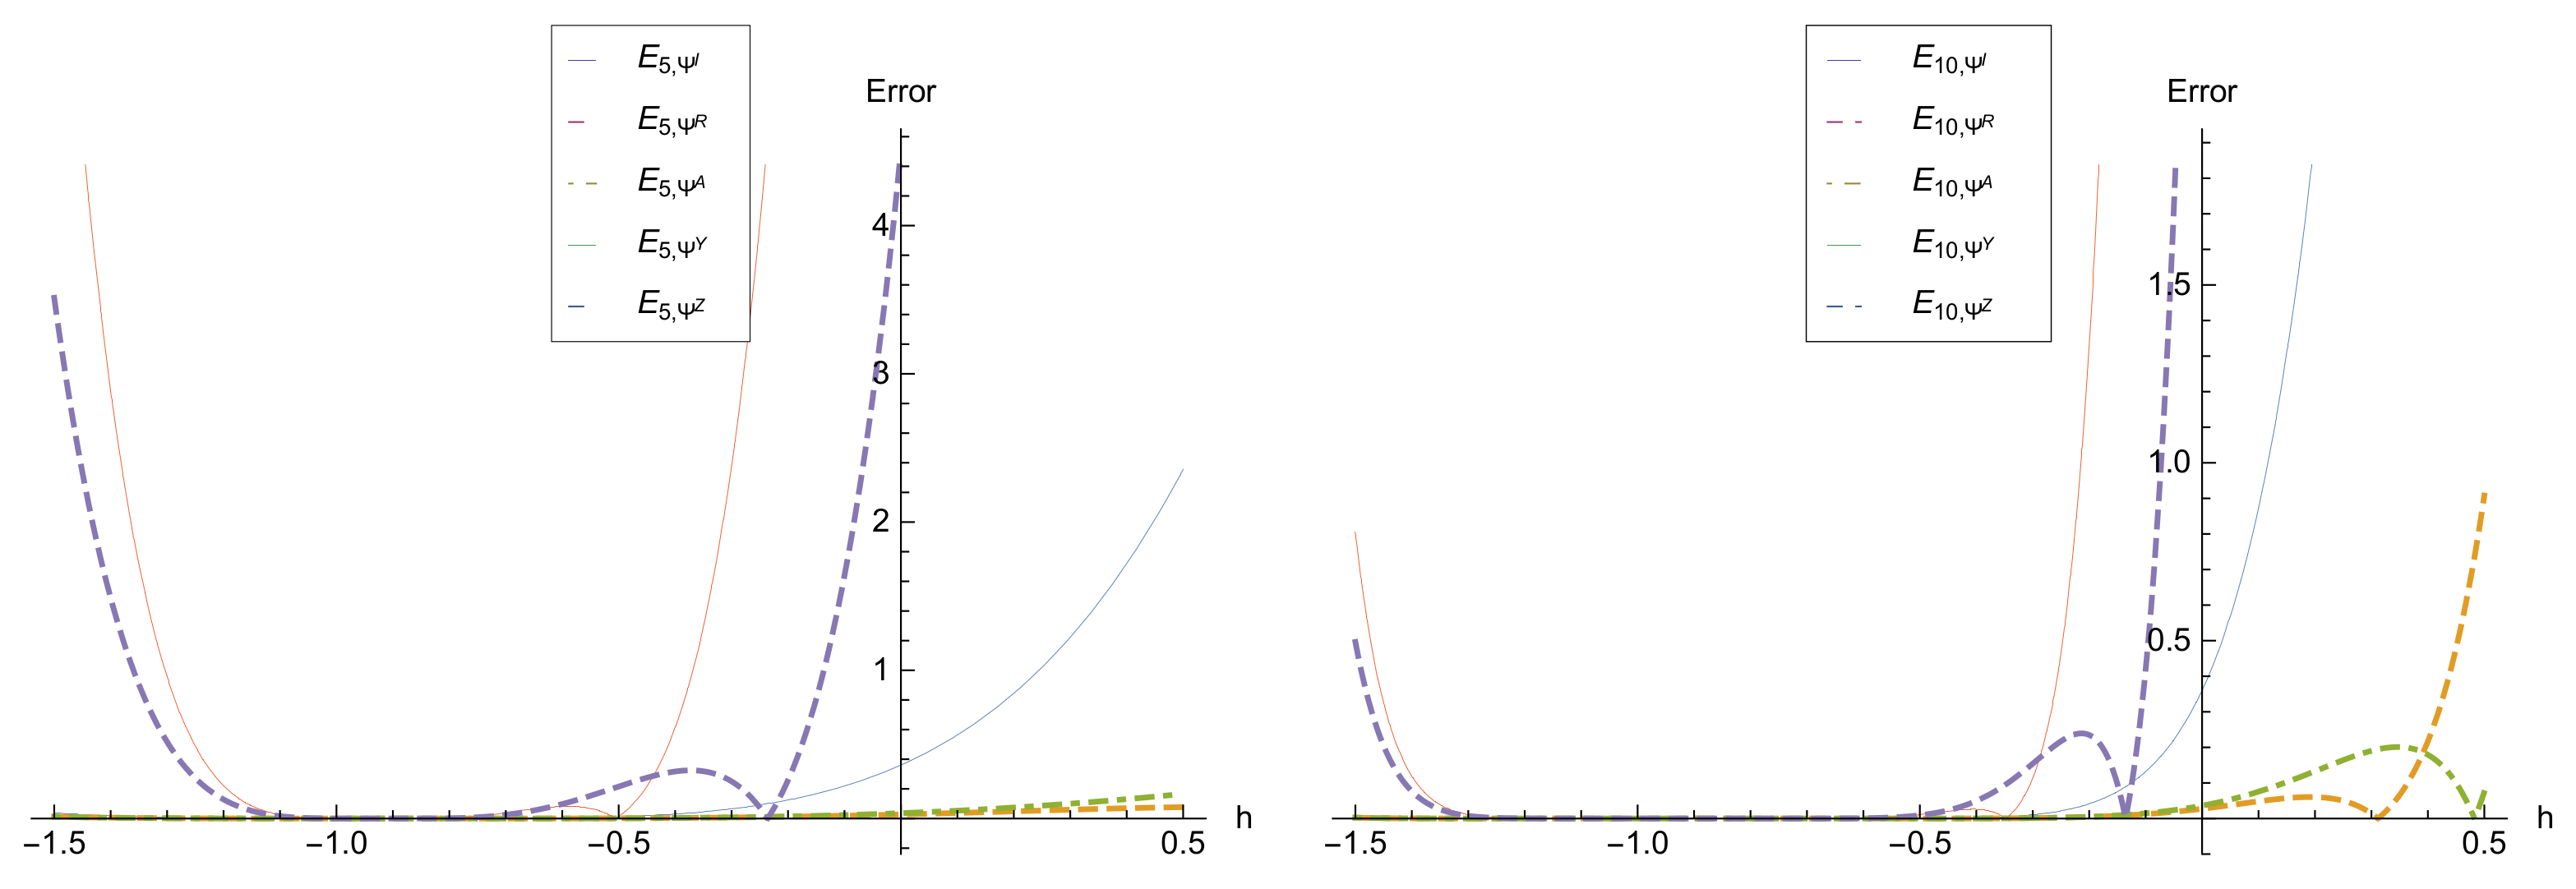
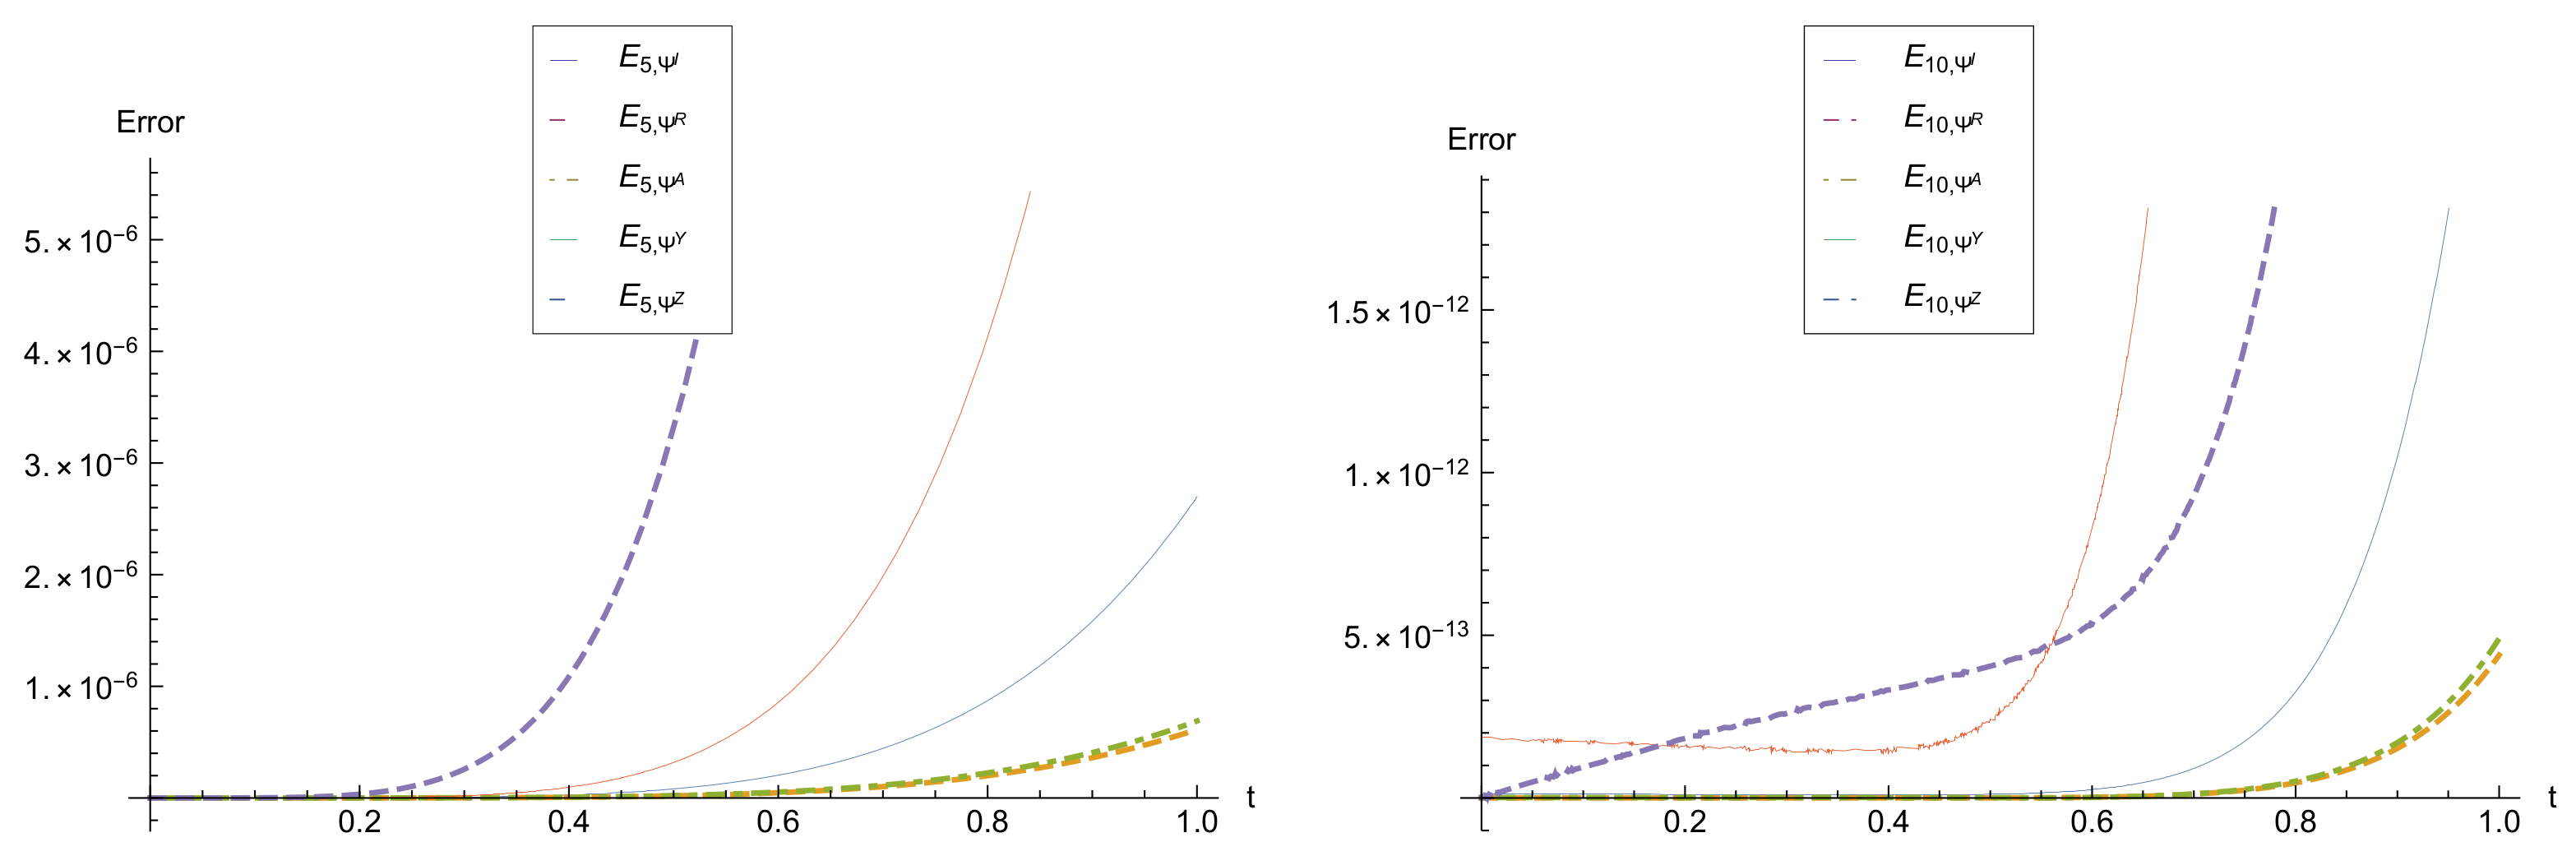
6. Results and Discussions

In this section, the numerical results of validation of the HATM based on both the SA and the FPA are presented using the simulated data. We know that because of existence of auxiliary parameters and functions in the HATM, this method is one of the flexible methods among semi-analytical methods. It can help us to make accurate solutions with fast convergence rate. Applying the HATM to solve the fractional model (1), the obtained solution will be based on t and . Thus for various values of t we will be able to find the solutions based on and plot the -curves. Applying these graphs we can find the convergence region of the solution. The parallel part of -curve with axis x will be the convergence region of the problem. We apply the presented values in Table 1 based on the mentioned data in [6]. The following approximate solutions are obtained for k = 5 :
Ψ 5 I ( t ) = 5 + 1.80089 t + 3.60178 2 t + 3.60178 3 t + 0.00120817 5 t 4 0.0000158921 5 t 5 , Ψ 5 R ( t ) = 15 + 0.13655 t + 0.273099 2 t + 0.273099 3 t + 0.000265351 5 t 4 3.30361 × 10 6 5 t 5 , Ψ 5 A ( t ) = 10 0.180842 t 0.361684 2 t 0.361684 3 t + + 0.000281714 5 t 4 + 3.59242 × 10 6 5 t 5 , Ψ 5 Y ( t ) = 100 + 138.5 t + 277 2 t + 277 3 t + + 0.0615969 5 t 4 + 0.000524847 5 t 5 , Ψ 5 Z ( t ) = 55 22.5 t 45 2 t 45 3 t + 0.0453403 5 t 4 0.000534686 5 t 5 .
Now the convergence regions can be obtained. In Figure 1 and Figure 2 the convergence regions based on the approximate solutions for k = 5 , 10 and are plotted. According to these figures the regions for k = 5 , ρ = 1 and t = 1 are
1.2 Ψ I , 5 0.7 , 1.2 Ψ R , 5 0.7 , 1.3 Ψ A , 5 0.6 , 1.1 Ψ Y , 5 0.7 , 1.1 Ψ Z , 5 0.8 .
Also for k = 10 we get
1.5 Ψ I , 10 0.5 , 1.5 Ψ R , 10 0.5 , 1.4 Ψ A , 10 0.5 , 1.2 Ψ Y , 10 0.7 , 1.2 Ψ Z , 10 0.7 .
In Figure 3, the residual error functions based on for t = 1 and k = 5 , 10 are plotted. Using this graph, obviously we can see the regions of convergence for different functions. For k = 5 and 1.2 0.7 we will have more accurate results than other regions. Also, for k = 10 we have 1.3 0.5 . Figure 4, shows the residual error functions based on t for = 1 and k = 5 , 10 . Completely clear that by increasing number of iterations k from 5 to 10 the HATM can produce more accurate results. In Table 2, the numerical results are obtained based on the FPA for = 1 and ε = 10 10 . But in this table we do not know the optimal value of ε . It means that we do not know for ε = 10 10 we can provide the accurate results or no. In Table 3, obviously the number of iterations for various ε are demonstrated. For large values of ε we can not provide accurate results and the algorithm is stopped soon. On the other hand, for small values of ε we have a large number of iterations without improving the accuracy. Because of the mentioned problems, we use the CESTAC method and the CADNA library which are based on the SA. Table 4 shows the results applying the CESTAC method. Thus instead of applying the absolute error or residual error, by finding difference of two successive approximations we can show the accuracy of the results and the main Theorem 1 supports us to do it. Using this technique, not only we do not need to have the exact solution but also we can find the optimal iteration and the optimal approximations. Thus, the optimal iteration is k o p t = 9 and the optimal approximations are
Ψ o p t I ( t ) = 4.81763160360134 , Ψ o p t R ( t ) = 14.9853816238038 , Ψ o p t A ( t ) = 10.0188240700409 , Ψ o p t Y ( t ) = 86.9982508153463 , Ψ o p t Z ( t ) = 56.8682257413900 .
The sign @ . 0 in the ninth step shows that the NCSDs for two successive approximations is almost equal to the NCSDs for exact and approximate solutions. But this sign can not be produced in the FPA and in the mathematical methods based on the FPA we need to provide a small positive value ε . Since we do not know the optimal value of ε , it can make problem in computations.

7. Conclusions

The main theorem of the CESTAC method has been proved which can support us to use the new termination criterion. In the numerical results by plotting several -curves we showed the convergence regions. According to the obtained results, we can see the advantages of the DSA than the FPA. In the DSA, we do not need to make more and extra iterations. Also, we can find the optimal iteration and the optimal approximations. But in the FPA, we do not have these abilities. More over in the DSA, the informatical zero sign @ . 0 can be produced which shows that the NCSDs for two successive approximations are almost equal to the number of common significant digits for exact and approximate solutions and then the numerical algorithm can be stopped. But in the FPA, the stopping condition depends on a small positive value ε that we do not have information about its optimality. Applying the method on the fractional models of HIV infection and COVID-19 are among our future plans.

Author Contributions

Conceptualization, S.N.; Data curation, S.N. and H.I.; Formal analysis, S.N.; Funding acquisition, S.N. and A.D.; Investigation, S.N. and H.I.; Methodology, S.N. and A.D.; Project administration, S.N.; Resources, S.N. and M.S.; Software, S.N.; Supervision, S.N.; Validation, S.N., A.D. and M.S.; Visualization, S.N. and A.D.; Writing—original draft, S.N., A.D., H.I. and M.S.; Writing—review & editing, S.N., A.D., H.I. and M.S. All authors have read and agreed to the published version of the manuscript.

Funding

A. Dreglea and S. Noeiaghdam have been supported by a grant from the Academic Council in the direction of the scientific school of Irkutsk National Research Technical University No. 14-NSH-RAN-2020.

Institutional Review Board Statement

Not applicable.

Informed Consent Statement

Not applicable.

Data Availability Statement

Not applicable.

Acknowledgments

The authors are thankful to Denis Sidorov for his useful suggestions which have improved the quality of the paper.

Conflicts of Interest

The authors declare no conflict of interest.

Abbreviations

The following abbreviations are used in this manuscript:
FPAFloating Point Arithmetic
DSADiscrete Stochastic Arithmetic
CESTACControle et Estimation Stochastique des Arrondis de Calculs
CADNAControl of Accuracy and Debugging for Numerical Applications
NCSDsNumber of Common Significant Digits
HATMHomotopy Analysis Transform Method
HAMHomotopy Analysis Method

References

  1. Overview. Available online: https://www.who.int/health-topics/malaria#tab=tab_1 (accessed on 15 February 2021).
  2. Sweilam, N.H.; AL–Mekhlafi, S.M.; Albalawi, A.O. Optimal control for a fractional order malaria transmission dynamics mathematical model. Alex. Eng. J. 2020, 59, 1677–1692. [Google Scholar] [CrossRef]
  3. Fonseca, L.L.; Voit, E.O. Comparison of mathematical frameworks for modeling erythropoiesis in the context of malaria infection. Math. Biosci. 2015, 270, 224–236. [Google Scholar] [CrossRef]
  4. Mittal, R.C.; Goel, R.; Ahlawat, N. An Efficient Numerical Simulation of a Reaction-Diffusion Malaria Infection Model using B-splines Collocation. Chaos Solitons Fractals 2021, 143, 110566. [Google Scholar] [CrossRef]
  5. Kim, J.E.; Choi, Y.; Lee, C.H. Effects of climate change on Plasmodium vivax malaria transmission dynamics: A mathematical modeling approach. Appl. Math. Comput. 2019, 347, 616–630. [Google Scholar] [CrossRef]
  6. Yakob, L. Endectocide-treated cattle for malaria control: A coupled entomological-epidemiological model. Parasite Epidemiol. Control 2016, 1, 2–9. [Google Scholar] [CrossRef] [Green Version]
  7. Naik, P.A.; Zu, J.; Owolabi, K.M. Modeling the mechanics of viral kinetics under immune control during primary infection of HIV-1 with treatment in fractional order. Phys. A Stat. Mech. Its Appl. 2020, 545, 123816. [Google Scholar] [CrossRef]
  8. Naik, P.A.; Yavuz, M.; Zu, J. The role of prostitution on HIV transmission with memory: A modeling approach. Alex. Eng. J. 2020, 59, 2513–2531. [Google Scholar] [CrossRef]
  9. Naik, P.A.; Zu, J.; Owolabi, K.M. Global dynamics of a fractional order model for the transmission of HIV epidemic with optimal control. Chaos Solitons Fractals 2020, 138, 109826. [Google Scholar] [CrossRef] [PubMed]
  10. Noeiaghdam, S. A novel technique to solve the modified epidemiological model of computer viruses. SeMA J. 2019, 76, 97–108. [Google Scholar] [CrossRef]
  11. Noeiaghdam, S.; Suleman, M.; Budak, H. Solving a modified non-linear epidemiological model of computer viruses by homotopy analysis method. Math. Sci. 2018, 12, 211–222. [Google Scholar] [CrossRef] [Green Version]
  12. Noeiaghdam, S.; Sidorov, D. Caputo-Fabrizio Fractional Derivative to Solve the Fractional Model of Energy Supply-Demand System. Math. Model. Eng. Probl. 2020, 7, 359–367. [Google Scholar] [CrossRef]
  13. Suleman, M.; Lu, D.; He, J.H.; Farooq, U.; Noeiaghdam, S.; Chandio, F.A. Elzaki Projected Differential Transform method for Fractional order System of Linear and Nonlinear Fractional Partial Differential Equation. Fractals 2018, 26, 1850041. [Google Scholar]
  14. Liao, S.J. Beyond Perturbation: Introduction to Homotopy Analysis Method; Chapman & Hall/CRC Press: Boca Raton, FL, USA, 2003. [Google Scholar]
  15. Liao, S.J. Homotopy Analysis Method in Nonlinear Differential Equations; Higher Education Press: Beijing, China; Springer: Berlin/Heidelberg, Germany, 2012. [Google Scholar]
  16. Liao, S.J. The Proposed Homotopy Analysis Techniques for the Solution of Nonlinear Problems. Ph.D. Thesis, Shanghai Jiao Tong University, Shanghai, China, 1992. [Google Scholar]
  17. Noeiaghdam, S.; Fariborzi Araghi, M.A. Homotopy regularization method to solve the singular Volterra integral equations of the first kind. Jordan J. Math. Stat. 2018, 11, 1–12. [Google Scholar]
  18. Noeiaghdam, S.; Fariborzi Araghi, M.A. A novel approach to find optimal parameter in the homotopy-regularization method for solving integral equations. Appl. Math. Inf. Sci. 2020, 14, 1–8. [Google Scholar]
  19. Noeiaghdam, S.; Fariborzi Araghi, M.A.; Abbasbandy, S. Finding optimal convergence control parameter in the homotopy analysis method to solve integral equations based on the stochastic arithmetic. Numer. Algorithms 2019, 81, 237–267. [Google Scholar] [CrossRef]
  20. Graillat, S.; Jézéquel, F.; Wang, S.; Zhu, Y. Stochastic arithmetic in multi precision. Math. Comput. Sci. 2011, 5, 359–375. [Google Scholar] [CrossRef]
  21. Graillat, S.; Jézéquel, F.; Picot, R. Numerical Validation of Compensated Summation Algorithms with Stochastic Arithmetic. Electron. Notes Theor. Comput. Sci. 2015, 317, 55–69. [Google Scholar] [CrossRef]
  22. Vignes, J. Discrete Stochastic Arithmetic for Validating Results of Numerical Software. Spec. Issue Numer. Algorithms 2004, 7, 377–390. [Google Scholar] [CrossRef]
  23. Vignes, J. A stochastic arithmetic for reliable scientific computation. Math. Comput. Simul. 1993, 35, 233–261. [Google Scholar] [CrossRef]
  24. Chesneaux, J.M. CADNA, an ADA tool for round–off error analysis and for numerical debugging. In Proceedings of the Congress on ADA in Aerospace, Barcelona, Spain, 20–25 May 1990. [Google Scholar]
  25. Noeiaghdam, S.; Dreglea, A.; He, J.H.; Avazzadeh, Z.; Suleman, M.; Fariborzi Araghi, M.A.; Sidorov, D.; Sidorov, N. Error estimation of the homotopy perturbation method to solve second kind Volterra integral equations with piecewise smooth kernels: Application of the CADNA library. Symmetry 2020, 12, 1730. [Google Scholar] [CrossRef]
  26. Noeiaghdam, S.; Sidorov, D.; Wazwaz, A.M.; Sidorov, N.; Sizikov, V. The numerical validation of the Adomian decomposition method for solving Volterra integral equation with discontinuous kernel using the CESTAC method. Mathematics 2021, 9, 260. [Google Scholar] [CrossRef]
  27. Noeiaghdam, S.; Fariborzi Araghi, M.A.; Abbasbandy, S. Valid implementation of Sinc-collocation method to solve the fuzzy Fredholm integral equation. J. Comput. Appl. Math. 2020, 370, 112632. [Google Scholar] [CrossRef]
  28. Noeiaghdam, S.; Sidorov, D.; Sizikov, V.; Sidorov, N. Control of accuracy on Taylor-collocation method to solve the weakly regular Volterra integral equations of the first kind by using the CESTAC method. Appl. Comput. Math. Int. J. 2020, 19, 81–105. [Google Scholar]
  29. Noeiaghdam, S.; Sidorov, D.; Zamyshlyaeva, A.; Tynda, A.; Dreglea, A. A valid dynamical control on the reverse osmosis system using the CESTAC method. Mathematics 2021, 9, 48. [Google Scholar] [CrossRef]
  30. Noeiaghdam, S.; Fariborzi Araghi, M.A. A novel algorithm to evaluate definite integrals by the Gauss-Legendre integration rule based on the stochastic arithmetic: Application in the model of osmosis system. Math. Model. Eng. Probl. 2020, 7, 577–586. [Google Scholar] [CrossRef]
  31. Noeiaghdam, S.; Fariborzi Araghi, M.A. Valid implementation of the Sinc-collocation method to solve the linear integral equations by CADNA library. J. Math. Model. 2019, 7, 63–84. [Google Scholar]
  32. Noeiaghdam, S.; Micula, S.; Nieto, J.J. A Novel Technique to Control the Accuracy of a Nonlinear Fractional Order Model of COVID-19: Application of the CESTAC Method and the CADNA Library. Mathematics 2021, 9, 1321. [Google Scholar] [CrossRef]
  33. Caputo, M.; Fabrizio, M. A new definition of fractional derivative without singular kernel. Prog. Fract. Differ. Appl. 2015, 1, 73–85. [Google Scholar]
  34. Aydogan, S.M.; Baleanu, D.; Mousalou, A.; Rezapour, S. On high order fractional integro-differential equations including the Caputo–Fabrizio derivative. Bound. Value Probl. 2018, 90, 1–15. [Google Scholar] [CrossRef]
  35. Losada, J.; Nieto, J.J. Properties of the new fractional derivative without singular kernel. Prog. Fract. Differ. Appl. 2015, 1, 87–92. [Google Scholar]
  36. Abdeljawad, T.; Baleanu, D. On fractional derivatives with exponential kernel and their discrete versions. Rep. Math. Phys. 2017, 80, 11–27. [Google Scholar] [CrossRef] [Green Version]
  37. Chesneaux, J.M.; Jézéquel, F. Dynamical control of computations using the Trapezoidal and Simpson’s rules. J. Univ. Comput. Sci. 1998, 4, 2–10. [Google Scholar]
  38. Jézéquel, F.; Mecanique, C.R. A dynamical strategy for approximation methods. Comptes Rendus Mec. 2006, 334, 362–367. [Google Scholar] [CrossRef] [Green Version]
  39. Laboratoire D’Informatique de Paris 6. Available online: https://www-pequan.lip6.fr/ (accessed on 10 December 2020).
Figure 1. The -curves for t = 1 and k = 5 .
Mathematics 09 01435 g001
Figure 2. The -curves for t = 1 and k = 10 .
Mathematics 09 01435 g002
Figure 3. Graph of residual error functions based on for t = 1 and k = 5 , 10 .
Mathematics 09 01435 g003
Figure 4. Graph of residual error functions based on t for = 1 and k = 5 , 10 .
Mathematics 09 01435 g004
Table 1. List of parameters and functions [6].
ParametersMeaningValues
β z Transmission coefficient (vectors → hosts) = bite rate × transmission probability 0.1 = 1 3 × 0.3
β H Transmission coefficient (hosts → vectors) = bite rate × transmission probability 0.007 = 1 3 × 0.02
ε Clearance rate of symptomatic infection 1 200
μ H Birth and death rate of humans (i.e., stable population) 1 21 , 900
κ Clearance rate of asymptomatic infection 1 200
θ Asymptomatic secondary infection rate0.5
τ Full susceptibility reversion rate 1 1000
σ Adjustment factor for asymptomatic transmissibility to vector0.25
μ v Birth (or maturation) and death rate of vectors (i.e., stable population)0.1
ξ Rate of parasite development within vector0.1
Table 2. The numerical results based on the FPA for t = 0.5 , ρ = 1 , = 1 and ε = 10 10 .
Ψ k I | Ψ k I Ψ k 1 I |
Ψ k R | Ψ k R Ψ k 1 R |
k Ψ k A | Ψ k A Ψ k 1 A |
Ψ k Y | Ψ k Y Ψ k 1 Y |
Ψ k Z | Ψ k Z Ψ k 1 Z |
4.819911000000000278484.81991100000000027848
14.9863450500000006115914.98634505000000061159
110.0180842000000005498410.01808420000000054984
86.1500000000000056843486.15000000000000568434
57.2500000000000000000057.25000000000000000000
4.817219750000000466630.00269124999999981185
14.985279890000001046250.00106515999999956534
210.018927612500000634550.00084341250000008472
87.032562500000011596060.88256250000000591172
56.847499999999996589390.40250000000000341061
4.817649991250000596210.00043024125000012958
14.985385754875000685620.00010586487499963937
310.018819684125000790690.00010792837499984387
86.997304750000012063540.03525774999999953252
56.868917749999994271090.02141774999999768170
4.817631113562500289050.00001887768750030716
14.985381608768751249270.00000414610624943634
410.018824085912500621020.00000440178749983033
86.998267200000015009210.00096245000000294567
56.868209306249994483550.00070844374999978754
4.817631610190625579550.00000049662812529050
14.985381712006564214330.00000010323781296506
510.018823973649375602690.00000011226312501833
86.998250798531259420090.00001640146875558912
56.868226015187495647750.00001670893750116420
4.817631603695954112250.00000000649467146729
14.985381710484430684010.00000000152213353033
610.018823975369874901280.00000000172049929859
86.998250814109695738810.00000001557843631872
56.868225739267181495510.00000027592031415224
4.817631603570140086390.00000000012581402586
14.985381710479297012740.00000000000513367127
710.018823975372797008280.00000000000292210700
86.998250824897198185680.00000001078750244687
56.868225741349313295810.00000000208213180031
Table 3. The number of iterations for different values of ε based on the FPA.
ε Small Values ε = 10 10 ε = 10 8 ε = 10 5 ε = 10 2 Large Values
k > > 776421
Table 4. The numerical results using the CESTAC method for t = 0.5 , ρ = 1 and = 1 .
Ψ k I | Ψ k I Ψ k 1 I |
Ψ k R | Ψ k R Ψ k 1 R |
k Ψ k A | Ψ k A Ψ k 1 A |
Ψ k Y | Ψ k Y Ψ k 1 Y |
Ψ k Z | Ψ k Z Ψ k 1 Z |
0.4819910999999994.81991099999999
14.9863450514.98634505
110.018084199999910.0180841999999
86.149999999999986.1499999999999
57.249999999999957.2499999999999
4.817219749999990.269125 × 10 2
14.98527989000000.10651599999 × 10 2
210.01892761249990.843412499998 × 10 3
87.03256249999990.8825625
56.84749999999990.4025
4.817649991249990.43024124999 × 10 3
14.9853857548750.1058648749 × 10 3
310.01881968412490.107928375 × 10 3
86.997304750.0352577499999
56.868917750.02141775
4.817631113562490.1887768749 × 10 4
14.98538160876870.414610625 × 10 5
410.01882408591240.44017875 × 10 5
86.99826719999990.9624499999 × 10 3
56.868209306250.70844375 × 10 3
4.817631610190620.49662812 × 10 6
14.98538162494810.161793 × 10 7
510.01882406831860.175938 × 10 7
86.99825079853120.16401468 × 10 4
56.86822601518740.167089374 × 10 4
4.817631603695950.649467 × 10 8
14.98538162380780.11402 × 10 8
610.01882407003910.17204 × 10 8
86.99825081410960.15578 × 10 7
56.86822573926710.2759203 × 10 6
4.81763160360170.9425 × 10 10
14.98538162380270.513 × 10 11
710.01882407004210.292 × 10 11
86.99825081580020.16906 × 10 8
56.86822574134930.20821 × 10 8
4.817631603601760.6 × 10 13
14.98538162380390.122 × 10 11
810.01882407004080.12 × 10 11
86.99825081534630.4539 × 10 9
56.868225741390.407 × 10 10
4.817631603601340.41 × 10 12
14.98538162380380.4 × 10 13
910.01882407004090.4 × 10 13
86.9982508153463@.0
56.86822574139@.0
Publisher’s Note: MDPI stays neutral with regard to jurisdictional claims in published maps and institutional affiliations.

