Abstract
Models implemented in statistical software for the precision analysis of diagnostic tests include random-effects modeling (bivariate model) and hierarchical regression (hierarchical summary receiver operating characteristic). However, these models do not provide an overall mean, but calculate the mean of a central study when the random effect is equal to zero; hence, it is difficult to calculate the covariance between sensitivity and specificity when the number of studies in the meta-analysis is small. Furthermore, the estimation of the correlation between specificity and sensitivity is affected by the number of studies included in the meta-analysis, or the variability among the analyzed studies. To model the relationship of diagnostic test results, a binary covariance matrix is assumed. Here we used copulas as an alternative to capture the dependence between sensitivity and specificity. The posterior values were estimated using methods that consider sampling algorithms from a probability distribution (Markov chain Monte Carlo), and estimates were compared with the results of the bivariate model, which assumes statistical independence in the test results. To illustrate the applicability of the models and their respective comparisons, data from 14 published studies reporting estimates of the accuracy of the Alcohol Use Disorder Identification Test were used. Using simulations, we investigated the performance of four copula models that incorporate scenarios designed to replicate realistic situations for meta-analyses of diagnostic accuracy of the tests. The models’ performances were evaluated based on p-values using the Cramér–von Mises goodness-of-fit test. Our results indicated that copula models are valid when the assumptions of the bivariate model are not fulfilled.
1. Introduction
The exponential growth of the medical literature and the increasingly widespread use of information and communication technologies, together with the dispersion of scientific literature, make it difficult for researchers and health professionals to access relevant information. Meta-analysis is a quantitative statistical analysis of several separate but similar experiments or studies, to test the pooled data for statistical significance that uses statistical models to estimate the results of several studies in a single measure [1].
The correct diagnosis of disease is of primary interest in psychology and medicine. Diagnostic tests are medical tests that detect the condition of a patient who is at risk of developing a disease [2]. As many of the results of diagnostic tests are based on a single biomarker, such results will not always lead to a correct diagnosis [3]. Consequently, meta-analysis is critical for investigating the available information on the accuracy of a diagnostic test [4,5]. In primary diagnostic studies, test accuracy is usually measured using sensitivity and specificity. To use likelihood ratios in the calculation of probabilities, these data must be transformed into an odds ratio. These calculations are simplified using nomograms [4,5]. Sensitivity and specificity vary according to the cutoff used to classify the absence or presence of the disease. The results can be represented graphically as a receiver operating characteristic (ROC) curve, which allows the characteristics of the test to be determined according to the different cutoffs, and which can be used to select the most appropriate value. The area under the curve is an estimator of the overall relevance of a test. It is notable that the information available regarding the validity of diagnostic tests is generated in different populations. Therefore, the estimates obtained in these studies are subject to random variability and biases if the studies were not correctly designed. The variability of the measurements will be influenced by multiple factors that are of interest to know and control. Among them, it is especially important to distinguish intra- and inter-study variations.
Due to this particularity, the bivariate nature of the data must be preserved by modeling sensitivity and specificity together. Two models have been established in recent years: a hierarchical model [6] and a bivariate model [7]. These models, which capture the inverse relationship between sensitivity and meta-analytic specificity, have the advantage of modeling the heterogeneity between the studies included in the analysis and the correlation between both measures. Moreover, covariates can be included, allowing better management of extreme values of sensitivity and specificity, and standard software (e.g., R) can be used for analysis. However, these models have certain weaknesses, they work on a logit scale and assume that the random effects are distributed as a bivariate normal, thus allowing for a single dependence or correlation structure. In other words, sensitivity and specificity values are modeled through monotonic transformations, resulting in symmetric distributions, which is not the case for meta-analyses of diagnostic tests, where the aforementioned measures present great variability.
Recently, a mixed model of copulas was proposed as an extension of the generalized linear mixed model [8], which uses the functional dependence of a copula for random effects using marginal distributions (normal and/or beta).
Academic illustrations of hierarchical and bivariate models have involved large numbers of studies in the meta-analysis, but this is not always the case, as meta-analyses of diagnostic test accuracy may include small numbers of studies [9]. Other problems are related to the convergence of hierarchical models and the lack of clarity when choosing the statistical model for meta-analysis of diagnostic tests [9].
In the present study, we used copulas to analyze diagnostic accuracy, avoiding the aforementioned disadvantages, but with the strengths of the models, hierarchical summary ROC (HSROC), and bivariate random-effects meta-analysis (BRMA) [10]. The copula approach employs beta distributions for sensitivity and specificity, which allows modeling of true positives (TPs) and true negatives (TNs) using marginal beta-binomial distributions [11]. Copulas permit the representation of the structure of functional dependence between sensitivity and specificity in a natural manner through multivariate distributions. In this study, using simulation and the re-analysis of a previously published dataset, we evaluated the sensitivity and specificity performance measures with the classical bivariate model using copulas. As the most important summary measures in diagnostic tests are sensitivity and specificity, we considered statistical models that summarize these measures. In addition, other measures, such as likelihood ratios, can be derived from the parameters of the aforementioned models.
We introduce the concept of the theory and selection of the BRMA, HSROC, and copula models with their different bivariate distributions for sensitivity and specificity in Section 2. After giving an overview of the approaches mentioned above, we describe the simulation study in Section 3, followed by the results of the hierarchical models, copulas, and the simulation study in Section 4. Finally, results analysis and recommendations for selecting an appropriate meta-analytic approach in practice are discussed in Section 5.
2. Materials and Methods
2.1. Statistical Methods
Performing a meta-analysis is a two-stage process. In the first step, the results of each study are estimated, although in the case of the evaluation of diagnostic tests, each study is summarized using a pair of indices that describe the validity of the test [12]. Typically, these two indices are either sensitivity and specificity, or the positive and negative likelihood ratios. In the second step, global validity indices must be calculated using various methods. In the study and analysis of diagnostic precision, methodological homogeneity is not always achieved. Therefore, it is of vital importance to quantify the heterogeneity among the studies.
2.2. Evaluation of Heterogeneity
The statistical heterogeneity of the results of the different studies included in the meta-analysis can be visualized using a forest plot. In these graphs, the estimators of the indices are represented together with their confidence intervals, and they are usually presented in a paired and ordered manner according to one of the indices. A possible cause of heterogeneity is the different thresholds to detect a positive result, which is termed the characteristic threshold effect.
2.3. Threshold Effect
To explore this source of variation, it is useful to graphically represent the pairs of sensitivity and specificity of each study in a ROC plane. In this plane, the zone closest to the upper left corner assumes good diagnostic performance, whereas the central zone, the diagonal in which sensitivity and specificity are equal, represents a null diagnostic capability. If there were a threshold effect, the points in the ROC space would reflect a concave curve. Changing the positivity threshold of a test would result in higher (or lower) sensitivity with the consequent opposite effect on specificity.
The statistical models for meta-analysis represent the inverse relationship between sensitivity and specificity using a summary ROC (SROC) curve. However, on several occasions, the included studies are homogeneous, i.e., all studies are used the same threshold. Thus, the threshold effect must be ruled out as a source of heterogeneity. In this situation, the overall result of the review could be obtained from the weighted combination of the indices of the individual studies. Generally, this modeling can be performed using a fixed- or random-effects model, considering the statistical significance of heterogeneity. Several statistical models have been proposed to construct SROC curves. The former model (Moses model) [13] builds a linear regression between a pair of variables created from the validity indices of each study, thereby characterizing the DOR. The objective of the method is to obtain a combined estimate of the instrument’s precision, knowing its variation among the different studies and that the threshold effect may be present.
2.4. Bivariate and Hierarchical Approach
The Moses model has several disadvantages. In one aspect, it does not consider the precision with which sensitivity and specificity were estimated in each study, nor does it model the heterogeneity among studies. To overcome these problems, regression models featuring a hierarchical approach have been proposed. The first model is called the bivariate random-effects model [7]. It assumes a bivariate normal distribution for the logit transformations of sensitivity and specificity. In other words, it models the inverse relationship of these measures by using a regression model.
The model captures the correlation and precision between both indices, as well as the heterogeneity attributable to the studies included in the meta-analysis. At the study level, the model assumes that the TPs and false positives (FPs) for each study ) behave as a binomial distribution. At the between-studies level, a bivariate random-effects model is assumed for and , where normal priors are assumed for the study-specific parameters as presented in Equations (1) and (2) [14].
The second model is the HSROC model [6]. In this model, the functional relationship of sensitivity and specificity is modeled by the threshold [15]. This is a multilevel model, i.e., it fits the classification data of the studies through random-effects logistic regression. It includes two levels corresponding to the intra-study and inter-study variation, respectively.
The model represents the cutoff and precision points of the test as random effects. For each study TPs, and FPs follow binomial distributions as presented in Equation (3) [16].
In the equation, index 1 denotes sick individuals, and index 2 represents non-sick individuals. Then, the parameterization of sensitivity and specificity is expressed as presented in Equation (4) [16].
In the equation, and represent the threshold and test accuracy for study i, respectively, and is a parameter that characterizes the symmetry of the SROC curve. These parameters are modeled using normal distributions as indicated in Equation (5) [16].
The BRMA and HSROC models are adjusted using the likelihood method, assuming that the logit transformations of the data are distributed according to a normal distribution with a homogeneous variance. However, the mean and variance of sensitivity and specificity are affected by the underlying prevalence.
Both models propose stochastic distributions on two levels. At the lower level, TPs and FPs are represented as binomial distributions and prevalence (proportions) using logit transformations. At the upper level, the random effects of the studies, which model heterogeneity in the precision of the test, are represented [17].
When covariates are not included, the bivariate and HSROC models are identical, although they differ in their parameterizations [17,18,19]. The parameters of the bivariate model directly characterize sensitivity, specificity, and correlation, whereas the HSROC model describes the precision, threshold, and shape of the curve to build an SROC curve [20]. Therefore, sensitivity and specificity of a diagnostic test may vary with disease prevalence.
A third model is a mixed copula model, which is an extension of the general linear mixed model [8] that uses a copula representation of the distribution of random effects with normal and beta marginal distributions [21]. A previous analysis [22] demonstrated that the use of copulas is feasible for studying diagnostic test accuracy as the assumption of multivariate normality is not fulfilled in this context. The joint modeling of sensitivity and specificity in the studies using bivariate beta distributions exceeds the aforementioned requirement [16]. As sensitivity and specificity take values between 0 and 1, the use of a beta distribution to describe the inverse relationship between the two values appears more natural. The beta distribution when combined with the binomial distribution gives rise to beta-binomial distributions, which model the random effects.
The methods discussed in the previous section were applied using a previously published dataset [23], which analyzed alcohol misuse in certain individuals considering both the 10-item Alcohol Use Disorder Identification Test (AUDIT) (gold standard) and its three-item abbreviated version (AUDIT-C) to accurately detect unhealthy drinking habits. The study examined whether AUDIT-C has similar accuracy as AUDIT in detecting alcohol consumption in unhealthy adults. A score of 8 points is considered positive. It would be a perfect instrument if it provided a positive classification when the result was greater than or equal to 8 points for all individuals with abuse problems, and negative otherwise [24]. The meta-analysis included 14 studies with sensitivity and specificity of approximately 0.86 and 0.78, respectively, and prevalence rates of 5–37% [9]; the abovementioned measures can be estimated from Table 1.

Table 1.
Alcohol Use Disorder Identification Test abbreviated version data.
2.5. A Statistical Method for Meta-Analysis of Diagnostic Tests Using a Copula Approach
Copulas represent a useful stochastic concept for modeling dependence on random variables. A copula is a joint distribution function with uniformly distributed marginal functions. It can be used to model the separate dependence of marginal distributions [25]; i.e., it is a function that approximates the set behavior of random variables from their individual behaviors [26]. Assuming two random variables with distribution function , a prior study [27] demonstrated that there is a C function that allows the joint distribution to be written as Equation (6).
In the equation, is a distribution function for a bivariate pair of uniform random variables, and is a distribution function for the original variables [11]. Therefore, a bivariate copula is a function that fulfills the following properties [28]: .
The concept of the copula allows modeling of the dependence between marginal distributions through the copula parameters. In the present paper, we used only a parametric model, even though there are non-parametric copulas that can be used to model the dependence between random variables.
These association parameters can be transformed in correlation measurements, such as the Spearman or Kendall correlation coefficients. Prior research illustrated that both measurements can be used to describe dependence [29]. In the next section, a brief description of the copulas used in this work is given. Here, we consider four copula functions that can be introduced into Equation (3) to model negative correlation.
2.6. The Hierarchical Copula Model
It is assumed that each individual study in the meta-analysis reports a 2 × 2 table with values of , and false negatives (FN) , as well as summary measures established by sensitivity and specificity [11]. It is further assumed that and are distributed according to a binomial distribution [11], as presented in Equation (7). The focus is on modeling the inverse relationship of sensitivity and specificity using bivariate copulas, which allows for marginal and study-specific estimates.
The prior marginal distributions for sensitivity and specificity are assumed as beta distributions with parameters and [30], i.e., making an assumption about Se and Sp in their original scale (0 and 1), respectively [11], as noted in Equation (8).
The corresponding density function for the sensitivity is defined by Equation (9).
Specificity is defined analogously, in which is the function gamma with for The expected for each beta distribution is defined as , and it describes the meta-analytical parameters of interest (sensitivity and specificity) [30]. In addition, the variance estimate explains the variability attributable to the heterogeneity of the studies [31]. The beta distribution is used due to its flexibility, and it is conjugated to the binomial distribution [30,31] (for further details, see Appendix A). To model the potential dependence between TP and TN, we applied the concept of copulas [11]. In our case, a two-dimensional cumulative distribution function was constructed [31]. Therefore, using Sklar’s Theorem,
Note that in the case of a copula, the likelihood is determined analytically, and it has a closed form [31]. Therefore, the standard methods of maximum likelihood are used for parameter estimation. One advantage is that there is a diversity of copulas that capture the inverse relationship between sensitivity and specificity. This fact contrasts with the standard model, in which a bivariate normal is used to represent the correlation between sensitivity and specificity. There are several copulas that can be used, each resulting in a new model for the meta-analysis of precision diagnostic studies [32]. Specifically, we used the bivariate copulas Gaussian, Clayton, Farlie–Gumbel–Morgenstern (FGM), and Frank, which can be adjusted according to Equation (10) [22]. Such copulas are often used in meta-analyses for diagnostic accuracy studies [30,31].
2.7. Selection of a Model Copula
The aim was to identify the family or families that best fit the joint distribution of and among the aforementioned copulas. This is performed using the Cramér–von Mises goodness-of-fit test; herein, the fit of a dataset to different copulas is compared using a goodness-of-fit test (for details of this test [33]. This is equivalent to testing the hypothesis.
where represents a family of copulas.
We have employed the simulation approach used in a previous study [17] to define the simulation scenarios and generate the simulated datasets as described below.
3. Simulation Study and Goodness-of-Fit of Copula Models
A simulation study was conducted to select the best setting among the copulas. Different simulation scenarios were designed to reproduce the real conditions found in studies of the accuracy of diagnostic tests in a meta-analysis [17].
3.1. Generation of Simulated Data
The number of studies (between 5 and 35) in each meta-analysis was randomly generated. The total number of persons included in each study was randomly sampled using a uniform distribution U (30; 1 255). The status of individuals in each study was classified as sick or healthy using the result of a continuous test x with random sampling [9,17,34,35]. The measures of the tetrachoric tables were generated using the CopulaRemada package of the statistical program R through the function rCopulaREMADA.beta [17,22].
The TP, FN, FP, and TN values were based on the test result and condition of the individual. In addition, the values of sensitivity and specificity were modeled using a uniform distribution with parameters between 0.8 and 1 [17,35]. We generated 21,011 studies in 1058 independent meta-analysis datasets to allow a reliable analysis of the goodness-of-fit of previously analyzed models [17]; values close to those proposed by the goodness-of-fit of copula models were assessed by examining the test statistic estimates and p-value, as proposed previously [33].
3.2. Adjusting the Hierarchical HSROC and Copula Models
We used the CopulaDTA package to adjust the copulas analyzed in the previous section. The package provides statistical models within the Bayesian framework and bivariate (beta-binomial) functions constructed as the product of marginal (beta) and copulas densities [36] (see Appendix D).
The HSROC package was used to estimate the parameter values of the HSROC model. The package allows the standard reference to be imperfect, and also assumes that it is independent of the test under evaluation. Calculations were performed using Gibbs samplers [37]. The package has four functions, of which HSROC and HSROCSummary are the main functions. The HSROC function must be run first to estimate the model parameter values, and then the HSROCSummary function must be run to obtain a summary of the estimates made by the Gibbs sampler [37]. The remaining functions, simdata and beta.parameter, are secondary. The former generates a meta-analysis of diagnostic tests based on the HSROC model, whereas the latter returns the shape parameter of the SROC curve [37].
4. Results of the Adjustment to AUDIT-C Data and Simulated Data
A goodness-of-fit test, with a certain confidence level, is key to inferring the statistical population of the data before fitting any model. For our analysis, we used statistical tests based on measures such as the chi-square, Cook distance, and Mahalanobis distance [38,39]. In that sense, Figure 1 reveals the presence of influential studies in the BRMA modeling and that the goodness of the adjustment and bivariate normality is not adequate, particularly due to studies 3 and 8 (Table 1).
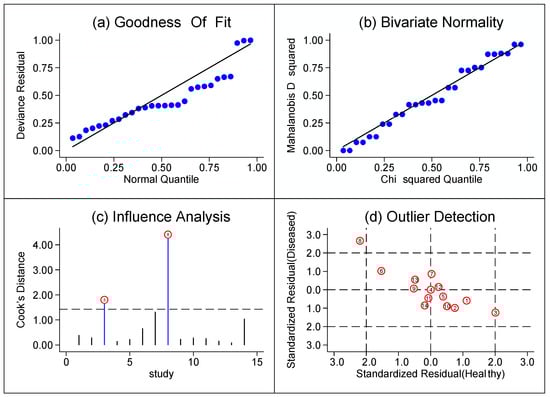
Figure 1.
Graphical depiction of residual-based (a) goodness-of-fit, (b) bivariate normality, (c) influence and (d) outlier detection analyses.
Conversely, Figure 2 reveals how the different values of sensitivity and specificity are located below or above the dotted line (the average), indicating the presence of strong heterogeneity in both measures. That is, the graph demonstrates different values of the test performance means toward higher sensitivity and lower specificity, providing indirect evidence of certain heterogeneity threshold variability.
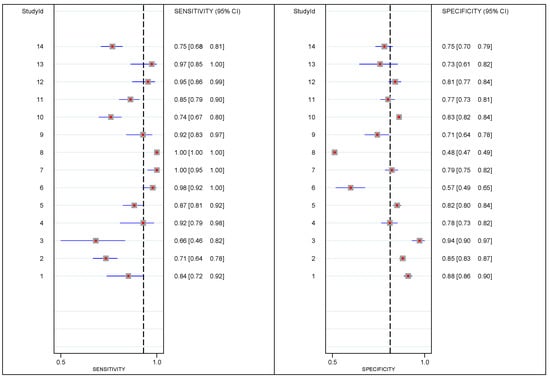
Figure 2.
Plot of the study-specific sensitivity and specificity (red points) and their corresponding 95% exact confidence intervals (thick blue lines), for the AUDIT-C data.
As mentioned previously, the HSROC and BRMA models are equivalent when there is no inclusion of covariates, thus, we analyzed the outputs produced by the HSROC package of R. The HSROCSummary function generates graphs of the convergence of the Gibbs sampler. Each graph presents the dispersion of the posterior sample versus the iteration number of the Gibbs sampler. The trace plots for the sensitivity and specificity are illustrated in Appendix B. In our case, convergence was satisfactorily achieved. Another type of output generated by the HSROCSummary function is the density plot. Appendix C presents density plots for some of the between-study parameters. The function also generates an SROC curve.
The SROC curve characterizes the correlation between sensitivity and (1 − specificity) of the studies considering their heterogeneity. The adjustment of the SROC curve for the AUDIT-C data is presented in Figure 3, revealing that the values for sensitivity and specificity were 0.430 (95% confidence interval (CI) = 0 − 0.913) and 0.982 (95% CI = 0.734 − 1), respectively.
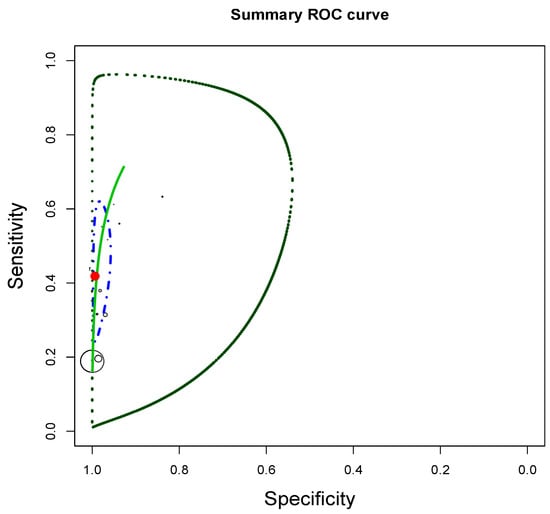
Figure 3.
Summary receiver operating characteristic (SROC) for AuditC data. The dots represent the sensitivities and specificities found in the included studies. The line green represents the estimated SROC curve. The dashed line around it represents the 95% confidence interval of the estimated SROC curve. The red circle represents the estimated pooled sensitivity and specificity, and the blue ellipse represents its 95% confidence interval.
The clear circle denotes the individual studies, and its diameter is proportional to the sample size of the study. The sensitivity and specificity of the 14 studies are summarized by a black circle. The 95% prediction region for future studies is defined by the black dot curve. The 95% credible region that characterizes the summary values of sensitivity and specificity is denoted by a black dot curve with lines [40]. Finally, the correlation between sensitivity and (1 − specificity) was 0.854.
Table 2 shows the posteriori mean the 95% confidence interval of the marginal means and estimated correlation parameters for the different copulas. Thus, the table reveals that Frank’s copula was the most extreme, with a correlation coefficient of −0.600. However, the Gauss and Clayton 90 (C90) models also had large correlation coefficients of −0.570 and −0.466, respectively.
Table 2.
Posteriori means, 95% confidence intervals, and estimated sensitivity, specificity, and correlation parameters for different copulas for AuditC data.
Importantly, the sensitivity and specificity results for the AUDIT-C data in the copula models were extremely similar to previously reported values [23]. That is, the estimates made by the copulas are more reliable than the estimates made by the HSROC model.
As the data were not distributed as a bivariate normal, and the correlation between performance measures was positive, modeling of dependency through copulas should be used. The algorithms used are presented in Appendix D.
For each aforementioned copula, the respective goodness-of-fit tests were performed. The results are presented in Table 3. To link marginal beta distributions with a bivariate dependent distribution, the best fit was observed using the FGM copula. This is revealed by the value of the statistic and p-value, which leads to the acceptance of the hypothesis of equality of empirical and parametric distributions. For the FGM copula, the value of the statistic and p-value were 0.022 and 0.903, respectively. Note that the p-value for the FGM copula was highest among the copulas.
Table 3.
Results of goodness-of-fit tests for the copula model based on p-value and statistic on the (0,1) scale.
The simulated studies were generated from scenarios designed to reproduce realistic situations encountered in diagnostic test accuracy studies. These scenarios included factors such as: number of studies, number of persons, inter-study variability in accuracy and threshold, sensitivity, and specificity, [17]. The results of the simulation process are shown below.
Simulation Results
Table 4 shows the mean estimates of the statistic, p-value of the hypothesis test, and standard error (SE) for each copula model according to the number of simulated studies for each meta-analysis. The FGM copula best fit the simulated data when the number of studies ranged from 5 to 22, as the average value of the statistic was lowest among the copula models. When the number of studies was between 23 and 28, the Gaussian copula had the best fit, whereas the best fit was achieved using the Clayton copula when the number of studies was between 29 and 35.
Table 4.
Results of goodness-of-fit tests for the copula model based on statistic, SE and p-value on the (0,1) scale. The results presented here come from the situation in which the number of studies (between 5 and 35 studies) in each meta-analysis was randomly generated. The total number of persons included in each study was randomly sampled using a uniform distribution U (30; 1 255).
5. Conclusions and Remarks
In this paper, definitions, implications, and methodologies were presented for the development of models for meta-analyses of diagnostic tests associated with copulas applied to a particular data set, although previous studies [41,42] noted that it might be difficult to estimate copulas from a dataset, especially for count data. In general terms, copulas are functions that approximate the set behavior of random variables based on their individual (marginal) behaviors [26].
Sensitivity and specificity measurement models make more realistic assumptions about marginal distribution functions (e.g., those that deviate from the assumption of normality). Although they may be more expensive in computational terms, they are best measured via summaries of a meta-analysis of diagnostic tests. In this sense, models derived from copulas offer a flexible analytical structure that is appropriate for measuring sensitivity and specificity.
In the meta-analysis of diagnostic tests, large heterogeneity can be found [43,44] due to variation in prevalence, the number of studies, the analyzed population, the laboratory procedures, and other factors. For this reason, bivariate copulas can be expanded and modeled in conjunction with sensitivity and specificity using multivariate copulas.
The HSROC model does not operate on the original scale of sensitivity and specificity, but instead, it functions on the corresponding logit scale. By generally relying on the bivariate normal distribution for the random effects, it only allows one single correlation structure [12,45]. For that reason, we proposed the use of copulas to study the accuracy of diagnostic tests, as such functions avoid the limitations of bivariate and HSROC models.
The use of copulas allows the study of dependencies with structures that are not necessarily linear, which is possible in diagnostic situations in which the results are obtained after dichotomization. Copula models that use beta-binomial distributions to characterize the marginal of TPs and TNs are linked to bivariate or multivariate copulas, i.e., it is a bivariate logistic regression model with random effects, presenting greater flexibility in capturing the functional dependence between sensitivity and specificity [32]. In other words, hierarchical models assume a normal bivariate behavior between the logit transformations of sensitivity and specificity. When the bivariate normality assumption is not met, copula modeling is used. This modeling employs beta-binomial distributions to characterize the marginal distributions of TPs and TNs, i.e., it displays greater flexibility in capturing the functional dependence between sensitivity and specificity [32,46].
We illustrated the procedure using a dataset published in the literature. The data were adjusted by assuming binary-associated tests and taking covariance as a parameter. It is important to note that the four copulas naturally and correctly capture the dependence structure between sensitivity and specificity (inverse relationship). The FGM copula displayed better fit than the Gauss, C90, Clayton 270, and Frank copulas, as it obtained the highest sensitivity. Conversely, Frank’s copula estimated the highest correlation between sensitivity and specificity, and the estimated values for the pair of summary measures (sensitivity and specificity) were extremely similar to the reported values [23]. This was not the case with the HSROC method, reflecting the effect that hierarchical modeling has in capturing the relationship between sensitivity and specificity [9].
Likewise, from the results of the 2 × 2 table, the best modeling for the study data corresponded with the FGM copula according to the Cramér–von Mises goodness-of-fit test. In the same sense, copula modeling estimated higher sensitivity values than the HSROC model; that is, for the present context, parameter estimates by couples were better than the hierarchical model.
An beneficial feature of copulas is that through beta-binomial distributions, the measurements of TPs and TNs are models, which is attributable to the fact that the beta distribution is conjugated with the binomial distribution (Hoyer and Kuss 2018). An explicit advantage of the beta-binomial distribution is that the size of the studies is automatically accounted for and the relationship between sensitivity and specificity is captured in a natural manner. These characteristics are not found in the BRMA model. In other words, modeling by copulas is a true random-effects model, which means that all tests within studies have a single specific parameter (sensitivity or specificity) [31].
A meta-analysis is a two-stage process, but this is not true for the copula model or Chu and Cole approach as they model the numbers of TPs and TNs directly by binomial distributions, which is an advantage of these models.
The use of hypothesis testing through the p-value helps in the selection of a dependent bivariate copula model. This allows analysts to quickly identify a copula model for constructing a bivariate dependent distribution that fits a data set well.
We simulated meta-analysis under several scenarios (e.g., different numbers of studies) and evaluated the hierarchical model of copulas. The presented methodology allows us to identify the best fit among the copulas analyzed in this work. The findings suggested that when the number of studies ranges from 5 to 22, the FGM copula has the best fit.
The modeling proposed using bivariate copulas with beta-binomial margins is a valid alternative for studying the accuracy of diagnostic tests. It is important to note that tools must be proposed to facilitate the selection and evaluation of the best model among the hierarchical and copulas approaches. In the meantime, it is a good alternative to conduct estimations of the parameters of the copula and hierarchical models to validate their reliability [11].
We have demonstrated that hierarchical copulas offer a straightforward method in the study of meta-analysis of diagnostic tests, where the accuracy of the tests depends on thresholds, while also taking into account the stochastic relationship of sensitivity and specificity [47,48].
Our simulations and application to motivating examples support and extend the empirical evidence suggesting that copula methods generate reliable results in the study of diagnostic test meta-analyses [11]. Simulation results show that the choice of analysis method strongly affects the accuracy of the diagnostic test. Estimates of sensitivity and specificity using the copula models outperform the estimates made by the BRMA and HSROC models. Two aspects appear to contribute most to improving the accuracy of the diagnostic test: the ability to capture the inverse relationship between sensitivity and specificity without transformations; and the ability to provide marginal estimates of the parameters from bivariate distributions [49].
Our study has some limitations. First, we were unable to explore the effect of SROC curve asymmetry in depth. We addressed the factors we considered vital, and varied the number of studies and individuals in a meta-analysis to reproduce reality. Second, the analyses of the simulated data sets were conducted only in R statistical software, and the parameter estimates of the HSROC and copulas models may differ between software packages due to model fitting options.
Finally, we suggest that further research should address copula independence tests over nonparametric models, e.g., Bernstein or spline-based copulas.
Author Contributions
Conceptualization, J.P.-C.; formal analysis, J.P.-C., S.B.-O. and A.N.-L.; writing—review, P.G.-V. and A.S.-G.; methodology, J.P.-C. and S.B.-O.; software, J.P.-C., S.B.-O. and A.N.-L., writing—original draft, J.P.-C. All authors have read and agreed to the published version of the manuscript.
Funding
This research did not receive any specific grant from funding agencies in the public, commercial, or not-for-profit.
Data Availability Statement
Not applicable.
Acknowledgments
We are greatly indebted to three anonymous referees for many helpful comments.
Conflicts of Interest
The authors declare that there are no conflicts of interest regarding the publication of this paper.
List of Abbreviations
| AUDIT | Alcohol Use Disorder Identification Test |
| AUDIT-C | Alcohol Use Disorder Identification Test abbreviated version |
| BRMA | Bivariate random-effects meta-analysis |
| C270 | Clayton 270 |
| C90 | Clayton 90 |
| CI | confidence interval |
| FGM | Farlie–Gumbel–Morgenstern |
| FN | False negative |
| FP | False positive |
| HSROC | Hierarchical summary ROC |
| MCMC | Markov chain Monte Carlo |
| ROC | Receiver operating characteristic |
| Se | Sensibility |
| SE | Standard error |
| Sp | Specificity |
| SROC | Summary ROC |
| TN | True negative |
| TP | True positive |
Appendix A
Beta Distribution Combined with a Binomial Distribution
Theorem 1.
The beta distribution is conjugated to the binomial distribution.
Bayes’ Theorem leads to:
where f is the density of the beta distribution and . Then:
Finally, we obtain a post-beta distribution for with .
Therefore, posteriori distribution belongs to the same family as priori distributions.
Appendix B

Figure A1.
Convergence of Priori Distributions.
Appendix C

Figure A2.
Posterior Distribution of the Parameters of the Hierarchical Summary Receiver Operating Characteristic Model.
Appendix D
Example R Code
# *****HSROC Model****
> library(HSROC)
> AuditC <- data.frame(`++` = c(47,126,19,36,
130,84,68,752,59,142,137,57,34,152),
`-+`= c(9,51,10,3,
19,2,0,0,5,50,24,3,1,51),
`+-` = c(101,272,12,78,
211,68,112,3226,55,571,107,103,21,88),
`--`= c(738,1543,192,276,
959,89,423,2977,136,2788,358,437,56,264))
> names(AuditC)<-c(“++,””-+,””+-,””--“)
> alpha = c(2.51, 2.54, 3.81, 2.41,
2.64, 2.70, 3.31, 3.39, 3.11, 2.99, 3.31,3.33,3,3)
> theta = c(−0.51, −0.39, 0.33, −2.06,
−0.14, −0.08, 1.11, 0.38, −0.86, −0.38,0.33,−2.06,1.11,1.11)
> s1 = rep(0.9,14)
> c1 = rep(0.9,14)
> pi = c(0.38, 0.17, 0.78, 0.07,
0.74, 0.84, 0.52, 0.95, 0.07, 0.56,0.55,0.80,0.90,0.88)
> within = cbind(alpha, theta, s1, c1, pi)
> within = cbind(theta, alpha, s1, c1, pi)
> THETA = −0.16
> sig.theta = 0.75
> LAMBDA = 2.58
> sig.alpha = 0.5
> beta = 0.25
> between = c(THETA, sig.theta, LAMBDA,
sig.alpha, beta)
> init = list(within, between)
> HSROC(data=AuditC, iter.num=50000, init=init)
# *****Copula Model****
> library(CopulaDTA)
auditec1 <- data.frame(TP = c(47,126,19,36,
130,84,68,752,59,142,137,57,34,152),
FN = c(9,51,10,3,
19,2,0,0,5,50,24,3,1,51),
FP = c(101,272,12,78,
211,68,112,3226,55,571,107,103,21,88),
TN = c(738,1543,192,276,
959,89,423,2977,136,2788,358,437,56,264))
#Fit Gauss Copula
> co.gauss <- cdtamodel(“gauss”)
> gauss.fit <- fit(
+ co.gauss,
+ data = auditec1,
+ SID = “ID,”
+ iter = 10000,
+ warmup = 1000,
+ thin = 30,
+ seed = 3)
#Fit 90° Copula
> co.c90 <- cdtamodel(copula = “c90”)
> c90.fit <- fit(co.c90,
+ data=auditec1,
+ SID=”ID,”
+ iter=10000,
+ warmup=1000,
+ thin=30,
+ seed=718117096)
#Fit 270° Copula
> co.c270 <- cdtamodel(copula = “c270”)
> c270.fit <- fit(co.c270,
+ data=auditec1,
+ SID=“ID,”
+ iter=10000,
+ warmup=1000,
+ thin=20,
+ seed=3)
#Fit FGM Copula
> co.fgm <- cdtamodel(copula = “fgm”)
> fgm.fit <- fit(fgm.1,
+ data=auditec1,
+ SID=“ID,”
+ iter=10000,
+ warmup=1000,
+ thin=20,
+ seed=3)
#Fit Frank Copula
> co.frank <- cdtamodel(copula = “frank”)
> frank.fit <- fit(co.frank,
+ data=auditec1,
+ SID=“ID,”
+ iter=10000,
+ warmup=1000,
+ thin=20,
+ seed=1959300748)
References
- Ahn, E.; Kang, H. Introduction to systematic review and meta-analysis. Korean J. Anesthesiol. 2018, 71, 103–112. [Google Scholar] [CrossRef]
- Doebler, P.; Holling, H.; Böhning, D. A mixed model approach to meta-analysis of diagnostic studies with binary test outcome. Psychol. Methods 2012, 17, 418–436. [Google Scholar] [CrossRef]
- Califf, R.M. Biomarker definitions and their applications. Exp. Biol. Med. 2018, 243, 213–221. [Google Scholar] [CrossRef] [PubMed]
- Egger, M.; Smith, G.D.; Schneider, M. (Eds.) Systematic Reviews of Observational Studies. In Systematic Reviews in Health Care: Meta-Analysis in Context, 2nd ed.; BMJ Publishing Group: London, UK, 2001; Volume 8, pp. 211–227. [Google Scholar] [CrossRef]
- Hasselblad, V.; Hedges, L.V. Meta-analysis of screening and diagnostic tests. Psychol. Bull. 1995, 117, 167–178. [Google Scholar] [CrossRef] [PubMed]
- Rutter, C.M.; Gatsonis, C.A. A hierarchical regression approach to meta-analysis of diagnostic test accuracy evaluations. Stat. Med. 2001, 20, 2865–2884. [Google Scholar] [CrossRef]
- Reitsma, J.B.; Glas, A.S.; Rutjes, A.W.; Scholten, R.J.; Bossuyt, P.M.; Zwinderman, A.H. Bivariate analysis of sensitivity and specificity produces informative summary measures in diagnostic reviews. J. Clin. Epidemiol. 2005, 58, 982–990. [Google Scholar] [CrossRef] [PubMed]
- Chu, H.; Nie, L.; Chen, Y.; Huang, Y.; Sun, W. Bivariate random effects models for meta-analysis of comparative studies with binary outcomes: Methods for the absolute risk difference and relative risk. Stat. Methods Med. Res. 2010, 21, 621–633. [Google Scholar] [CrossRef]
- Takwoingi, Y.; Guo, B.; Riley, R.D.; Deeks, J.J. Performance of methods for meta-analysis of diagnostic test accuracy with few studies or sparse data. Stat. Methods Med. Res. 2017, 26, 1896–1911. [Google Scholar] [CrossRef]
- Chu, H.; Guo, H. Letter to the editor. Biostatistics 2008, 10, 201–203. [Google Scholar] [CrossRef]
- Kuss, O.; Hoyer, A.; Solms, A. Meta-analysis for diagnostic accuracy studies: A new statistical model using beta-binomial distributions and bivariate copulas. Stat. Med. 2014, 33, 17–30. [Google Scholar] [CrossRef]
- Lee, J.; Kim, K.W.; Choi, S.H.; Huh, J.; Park, S.H. Systematic Review and Meta-Analysis of Studies Evaluating Diagnostic Test Accuracy: A Practical Review for Clinical Researchers-Part II. Statistical Methods of Meta-Analysis. Korean J. Radiol. 2015, 16, 1188–1196. [Google Scholar] [CrossRef]
- Moses, L.E.; Shapiro, D.; Littenberg, B. Combining independent studies of a diagnostic test into a summary roc curve: Data-analytic approaches and some additional considerations. Stat. Med. 1993, 12, 1293–1316. [Google Scholar] [CrossRef]
- Schwarzer, G.; Carpenter, J.R.; Rücker, G. Meta-Analysis with R; Springer: Berlin, Germany, 2015. [Google Scholar]
- Riley, R.D.; Dodd, S.R.; Craig, J.V.; Thompson, J.R.; Williamson, P.R. Meta-analysis of diagnostic test studies using individual patient data and aggregate data. Stat. Med. 2008, 27, 6111–6136. [Google Scholar] [CrossRef] [PubMed]
- Steinhauser, S.; Schumacher, M.; Rücker, G. Modelling multiple thresholds in meta-analysis of diagnostic test accuracy studies. BMC Med. Res. Methodol. 2016, 16, 1–15. [Google Scholar] [CrossRef]
- Bauz, S.; Pambabay-Calero, J.J.; Nieto-Librero, A.B.; Galindo-Villardón, M.P. Meta-Analysis in DTA with Hierarchical Models Bivariate and HSROC: Simulation Study. In Selected Contributions on Statistics and Data Science in Latin America; Antoniano-Villalobos, I., Mena, R., Mendoza, M., Naranjo, L., Nieto-Barajas, L., Eds.; Springer: Cham, Switzerland, 2019; Volume 301, pp. 33–42. [Google Scholar] [CrossRef]
- Arends, L.R.; Hamza, T.H.; van Houwelingen, J.C.; Heijenbrok-Kal, M.H.; Hunink, M.G.M.; Stijnen, T. Bivariate Random Effects Meta-Analysis of ROC Curves. Med. Decis. Mak. 2008, 28, 621–638. [Google Scholar] [CrossRef]
- Harbord, R.M.; Deeks, J.J.; Egger, M.; Whiting, P.; Sterne, J. A unification of models for meta-analysis of diagnostic accuracy studies. Biostatistics 2007, 8, 239–251. [Google Scholar] [CrossRef]
- Macaskill, P.; Gatsonis, C.; Deeks, J.; Harbord, R.; Takwoingi, Y. Cochrane Handbook for Systematic Reviews of Diagnostic Test Accuracy; Chapter 10 Analysing and Presenting Results; The Cochrane Collaboration: London, UK, 2010. [Google Scholar]
- Senturk, D. Explanatory Item Response Models: A Generalized Linear and Nonlinear Approach. Technometrics 2006, 48, 568–569. [Google Scholar] [CrossRef]
- Nikoloulopoulos, A.K. A mixed effect model for bivariate meta-analysis of diagnostic test accuracy studies using a copula representation of the random effects distribution. Stat. Med. 2015, 34, 3842–3865. [Google Scholar] [CrossRef]
- Kriston, L.; Hölzel, L.; Weiser, A.-K.; Berner, M.M.; Härter, M. Meta-analysis: Are 3 Questions Enough to Detect Unhealthy Alcohol Use? Ann. Intern. Med. 2008, 149, 879–888. [Google Scholar] [CrossRef]
- Babor, T.; Higgins-Biddle, J.C.; Saunders, J.B.; Monteiro, M.G. The Alcohol Use Disorders Identification Test: Guidelines for Use in Primary Care; World Health Organization: Geneva, Switzerland, 2001; pp. 1–40. [Google Scholar]
- Muhammad, N.; Coolen-Maturi, T.; Coolen, F.P. Nonparametric predictive inference with parametric copulas for combining bivariate diagnostic tests. Stat. Optim. Inf. Comput. 2018, 6, 398–408. [Google Scholar] [CrossRef][Green Version]
- Ghalibaf, M.B. Relationship Between Kendall’s tau Correlation and Mutual Information. Revista Colombiana de Estadística 2020, 43, 3–20. [Google Scholar] [CrossRef]
- SKLAR, M. Fonctions de repartition a n dimensions et leurs marges. Publ. Inst. Stat. Univ. Paris 1959, 8, 229–231. [Google Scholar]
- Nelsen, R.B. An Introduction to Copulas; Springer Science & Business Media: Berlin, Germany, 2000; Volume 42, p. 317. [Google Scholar]
- Schweizer, B.; Wolff, E.F. On Nonparametric Measures of Dependence for Random Variables. Ann. Stat. 1981, 9, 879–885. [Google Scholar] [CrossRef]
- Hoyer, A.; Kuss, O. Meta-analysis of diagnostic tests accounting for disease prevalence: A new model using trivariate copulas. Stat. Med. 2015, 34, 1912–1924. [Google Scholar] [CrossRef]
- Hoyer, A.; Kuss, O. Meta-analysis for the comparison of two diagnostic tests to a common gold standard: A generalized linear mixed model approach. Stat. Methods Med Res. 2016, 27, 1410–1421. [Google Scholar] [CrossRef]
- Zapf, A.; Hoyer, A.; Kramer, K.; Kuss, O. Nonparametric meta-analysis for diagnostic accuracy studies. Stat. Med. 2015, 34, 3831–3841. [Google Scholar] [CrossRef]
- Coakley, C.W.; Conover, W.J. Practical Nonparametric Statistics. J. Am. Stat. Assoc. 2000, 95, 332. [Google Scholar] [CrossRef]
- Bachmann, L.M.; Puhan, M.A.; Ter Riet, G.; Bossuyt, P.M. Sample sizes of studies on diagnostic accuracy: Literature survey. BMJ 2006, 332, 1127–1129. [Google Scholar] [CrossRef] [PubMed]
- Morris, T.P.; White, I.R.; Crowther, M.J. Using simulation studies to evaluate statistical methods. Stat. Med. 2019, 38, 2074–2102. [Google Scholar] [CrossRef]
- Nyaga, V.N.; Arbyn, M.; Aerts, M. CopulaDTA: An R Package for Copula-Based Bivariate Beta-Binomial Models for Diagnostic Test Accuracy Studies in a Bayesian Framework. J. Stat. Softw. 2017, 82, 1–27. [Google Scholar] [CrossRef]
- Schiller, I.; Dendukuri, N. HSROC: An R Package for Bayesian Meta-Analysis of Diagnostic Test Accuracy; Version 2.1.8; R Core Team: Vienna, Austria, 2015. [Google Scholar]
- Huerta, M.; Leiva, V.; Lillo, C.; Rodriguez, M.; Leiva-Sanchez, V. A beta partial least squares regression model: Diagnostics and application to mining industry data. Appl. Stoch. Model. Bus. Ind. 2018, 34, 305–321. [Google Scholar] [CrossRef]
- Wang, Y.; Liu, Q.; Hou, H.-D.; Rho, S.; Gupta, B.; Mu, Y.-X.; Shen, W.-Z. Big data driven outlier detection for soybean straw near infrared spectroscopy. J. Comput. Sci. 2018, 26, 178–189. [Google Scholar] [CrossRef]
- Dukic, V.; Gatsonis, C. Meta-analysis of diagnostic test accuracy assessment studies with varying number of thresholds. Biometrics 2003, 59, 936–946. [Google Scholar] [CrossRef]
- Genest, C.; Nešlehová, J. A Primer on Copulas for Count Data. ASTIN Bull. 2007, 37, 475–515. [Google Scholar] [CrossRef]
- Mikosch, T. Copulas: Tales and Facts—Rejoinder. Extremes 2006, 9, 55–62. [Google Scholar] [CrossRef]
- Chu, H.; Nie, L.; Cole, S.R.; Poole, C. Meta-analysis of diagnostic accuracy studies accounting for disease prevalence: Alternative parameterizations and model selection. Stat. Med. 2009, 28, 2384–2399. [Google Scholar] [CrossRef]
- Pambabay-Calero, J.J.; Bauz-Olvera, S.A.; Nieto-Librero, A.B.; Galindo-Villardon, M.P.; Hernandez-Gonzalez, S. An alternative to the Cochran-(Q) statistic for analysis of heterogeneity in meta-analysis of diagnostic tests based on HJ BIPLOT. Investig. Oper. 2018, 39, 536–545. [Google Scholar]
- Pambabay-Calero, J.J.; Bauz-Olvera, S.A.; Nieto-Librero, A.B.; Galindo-Villardón, M.P.; Sánchez-García, A.B. A tutorial for meta-analysis of diagnostic tests for low-prevalence diseases: Bayesian models and software. Methodology 2020, 16, 258–277. [Google Scholar] [CrossRef]
- Liu, Y.; DeSantis, S.M.; Chen, Y. Bayesian mixed treatment comparisons meta-analysis for correlated outcomes subject to reporting bias. J. R. Stat. Soc. Ser. C 2017, 67, 127–144. [Google Scholar] [CrossRef] [PubMed]
- Krog, J.; Jacobsen, L.H.; Lund, F.W.; Wüstner, D.; Lomholt, M.A. Bayesian model selection with fractional Brownian motion. J. Stat. Mech. Theory Exp. 2018, 2018, 093501. [Google Scholar] [CrossRef]
- Krog, J.; Lomholt, M.A. Bayesian inference with information content model check for Langevin equations. Phys. Rev. E 2017, 96, 062106. [Google Scholar] [CrossRef]
- Thapa, S.; Lomholt, M.A.; Krog, J.; Cherstvy, A.G.; Metzler, R. Bayesian analysis of single-particle tracking data using the nested-sampling algorithm: Maximum-likelihood model selection applied to stochastic-diffusivity data. Phys. Chem. Chem. Phys. 2018, 20, 29018–29037. [Google Scholar] [CrossRef]
Publisher’s Note: MDPI stays neutral with regard to jurisdictional claims in published maps and institutional affiliations. |
© 2021 by the authors. Licensee MDPI, Basel, Switzerland. This article is an open access article distributed under the terms and conditions of the Creative Commons Attribution (CC BY) license (https://creativecommons.org/licenses/by/4.0/).