Abstract
Sign, Wilcoxon and Mann-Whitney tests are nonparametric methods in one or two-sample problems. The nonparametric methods are alternatives used for testing hypothesis when the standard methods based on the Gaussianity assumption are not suitable to be applied. Recently, the functional data analysis (FDA) has gained relevance in statistical modeling. In FDA, each observation is a curve or function which usually is a realization of a stochastic process. In the literature of FDA, several methods have been proposed for testing hypothesis with samples coming from Gaussian processes. However, when this assumption is not realistic, it is necessary to utilize other approaches. Clustering and regression methods, among others, for non-Gaussian functional data have been proposed recently. In this paper, we propose extensions of the sign, Wilcoxon and Mann-Whitney tests to the functional data context as methods for testing hypothesis when we have one or two samples of non-Gaussian functional data. We use random projections to transform the functional problem into a scalar one, and then we proceed as in the standard case. Based on a simulation study, we show that the proposed tests have a good performance. We illustrate the methodology by applying it to a real data set.
1. Introduction
Different phenomena in diverse fields can be modeled by means of random observations that are represented as curves. Since the beginning of the nineties, the functional data analysis (FDA) [1] has been used to describe, analyze and model this type of observations. The FDA is concerned with the study of realizations of functional random variables, that is, variables taking values in an infinite dimensional space [2]. Functional versions of a wide spectrum of statistical areas (as exploratory data analysis [3], linear models [4], sampling [5], time series [6], geostatistics [7] and multivariate analysis [8], among others) have been developed. A state-of-the-art review on methodological, practical and theoretical aspects of the FDA can be found in [9,10].
Statistical inference based on FDA has shown recently new theoretical developments [11,12]. There has been an increasing interest in methods for testing hypothesis using data from functional variables. Some basic inferential techniques in one-sample problems for functional data are given in [13]. In the case of two-sample problems, testing hypothesis that the generating distributions of two sets of curves are identical has been approached in several contexts, such as differences in mean curves, covariance functions or cumulative distribution functions (CDFs) [14]. In addition, in [1], a pointwise t-test is introduced, whereas in [15], a method to test whether two groups of curves have the same mean function is presented, when these curves are observed at different times without noise. Furthermore, a pseudolikelihood ratio test is derived in [16] and a -norm-based test of the two-sample Behrens-Fisher problem for functional data is proposed and studied in [17] (note that it tests the equality of mean functions of two Gaussian processes with possibly unequal covariance functions). A review of several tests when two or more functional samples are involved is given in [13]. In a distribution-free context, the Anderson-Darling statistic for testing the null hypothesis that two samples of curves (observed with noise at discrete grids) have the same underlying distribution is derived in [14]. Many authors have treated the problem of testing hypothesis with more than two functional samples. Several alternatives for one-or-two-way ANOVA have been proposed in [18,19,20,21]. These methods can be applied to the two-sample case.
Some approaches to solve the two-sample problem for functional data are based on the Gaussianity assumption [13,15], that is, they assume that the sample at each group is a realization of a Gaussian stochastic process. Other approaches suppose that functional variables follow a Wishart process with some of them requiring homoscedasticity [13]. In a nonparametric context, some methods based on permutations and bootstrap have become very popular for testing hypothesis with functional data [15]. This is probably due to the flexibility of permutation methods to test complex hypothesis, especially when the asymptotic distributions are difficult to derive or the parametric assumptions are hard to justify. To the best of our knowledge, no studies on the adaptation of the sign, Wilcoxon and Mann-Whitney statistics [22,23] to the context of functional data have been conducted.
The objective of this paper is to derive the sign, Wilcoxon, and Mann-Whitney statistics using data from functional variables. We utilize random projections [21] to transform the functional problem into a scalar one, and then we proceed as in the standard case by using these statistics. As mentioned, there are several statistics that may be applied when the curves come from Gaussian processes. Consequently, the procedures proposed here are particularly useful when curves and random projections are realizations of non-Gaussian stochastic processes.
The rest of the paper is organized as follows. In Section 2, a review about both standard nonparametric tests for one-sample and two-sample problems, as well as some concepts on FDA, are provided. In Section 3, the sign, Wilcoxon and Mann-Whitney tests for functional data based on random projections are defined. In Section 4, the numerical results of this study are reported. First, a Monte Carlo simulation study is conducted to evaluate the performance of the results proposed, and then we provide an application of the proposed tests to a real data set. The paper ends with some conclusions, discussion and future research in Section 5.
2. Background
This section is based on the works presented in [1,21,22,23]. First, we provide an overview about the sign and Wilcoxon tests for one-sample and two-sample problems. Then, we present the pointwise t-test for functional data and hypothesis testing for Gaussian functional data based on random projections.
2.1. Sign, Wilcoxon and Mann-Whitney Tests
Let be a random sample drawn from a symmetric distribution with CDF with median . Suppose we are interested in testing the hypotheses given by
Defining , for , the above hypotheses can be written as
where is the median of the random variable Z. Now, consider the absolute values , for , and order them increasingly. Let denote the rank of in this ordering, for . To compute the sign (S) and Wilcoxon () statistics, for , define an indicator variable stated as
and set
The statistic S defined in (1) is the number of positive values of Z and is the sum of signed ranks of that are positive. At the level of significance, is rejected if or , where is the 100-th percentile of the binomial distribution with sample size n and [23]. Analogously, is rejected if or , where is chosen to make the type I error probability equal to . Values of are given in Table A.4 of [23].
In the case of a paired sample from a bivariate distribution with CDF with medians and , the statistics S and defined in (1) may also be used to test the hypotheses established as
by taking
and using again a binomial distribution or the critical values from the distribution of the statistic [23]. In this case, and is the rank of , for . In both cases (one sample and paired sample), a large-sample approximation based on the standard Gaussian distribution can be used.
When and are two independent random samples from distributions with CDFs and , respectively, the Wilcoxon [24] or Mann-Whitney [25] statistics may be considered as alternatives to test the hypotheses stated as
In this case, the Wilcoxon (W) and the Mann-Whitney (U) statistics are defined respectively as
with denoting the rank of , for , in the combined sample of size , and
Note that is rejected at the level if or if . The critical values are given in Table A.6 of [23]. Mann and Whitney [25] showed that, in case of no ties, one has
which implies that tests based on U are equivalent to tests based on W [23]. In both cases (Wilcoxon and Mann-Whitney statistics), large sample approximations based on Gaussianity of W and U allow us to carry out the tests using critical values of the standard Gaussian distribution.
2.2. Functional Data and Random Projections
A functional variable , for , is defined in [2] as a random variable taking values in a space of functions. Then, are a random sample of , that is, , for , are independent and identically distributed functional variables following the same underlying distribution of . Given that in practice the functions are known only for a finite number of measured values, a model is required to fit the function . Usually this modeling is carried out by using basis functions [1], which are a system of known functions that are mathematically independent of each other. This system approximates arbitrarily well any curve by a linear combination of a sufficiently large number K of these functions [9]. Fourier, B-splines and wavelet smoothing methods are widely used in this context [17]. Generally, the number of basis functions for smoothing is chosen by cross-validation [1].
In the case of one sample, the problem for functional data is described as follows. Suppose we have a random sample coming from a stochastic process with mean function , for , and covariance function , for . Let be the observations of obtained after using a smoothing method. Now, the hypotheses of interest are stated as
where is some known fixed function. A review of alternatives to test the hypothesis in (3) is given in [13], where pointwise, -norm-based and F-type tests are introduced, among others. Almost all of these tests are based on the Gaussianity assumption, that is, they assume that , for each t. The simplest option in this case is the pointwise test. Under Gaussianity, we have
with . The null hypothesis is rejected whenever the observed absolute value of defined in (4) and based on the observations is greater than , where denotes the -th percentile of the Student-t distribution with degrees of freedom. The case of a paired sample , for , or two independent samples , for and , can be tested similarly defining the statistic stated in (4) properly; see details in [15]. When the Gaussianity assumption is not satisfied, tests based on bootstrap [13] and permutations [26] may be applied.
Random projections refer to the technique of mapping a set of points from a high dimensional space to a randomly chosen low-dimensional space [27]. Given a set of functional data , for , the hypotheses of interest can be tested projecting the functions on a one-dimensional subspace generated by in H, where H is a separable Hilbert space of square integrable functions. Thus, , for , where often is a Brownian motion. Random projections have been recently applied in many contexts of the FDA [28], such as goodness-of-fit tests [29], clustering [30], and ANOVA [21], among others.
3. Sign, Wilcoxon and Mann Withney Tests for Functional Data
This section derives the sign, Wilcoxon and Mann-Whitney tests for functional data based on random projections for one-sample and two-sample problems.
3.1. The Case of One Sample
Let be a sample from a stochastic process with median function , for , defined in the space of real continuous functions on the compact interval I. The hypotheses of interest are given by
where is some particular function. In order to carry out the test:
- Define , for .
- Generate a Brownian motion , for .
- Obtain random projections , for .
- Let be the median of Z. Then, based on , for , test the hypotheses given byusing the statistics S and defined in (1). The critical values are defined in the same way as in Section 2.1.
In the case of a paired functional sample from a bivariate functional vector with medians and , respectively, for , the statistics S and stated in (1) can be also used to test the hypotheses established as
defining and as
with , for , being a Brownian motion. In both cases for the hypotheses defined in (5) and (6), a large sample approximation based on the Gaussian distribution may be used by standardizing the statistics S and [23].
3.2. The Case of Two Samples
Let and be two independent random samples from the functional variables and with medians and , respectively. Suppose we want to test the hypotheses stated as
Then, the random projections given by
and
can be used once again to test these hypotheses using the Mann-Whitney and Wilcoxon statistics defined in (2).
4. Numerical Results
This section reports the numerical results of our study. First, a simulation study is conducted to evaluate the performance of the tests proposed, and then we apply these tests to a real data set.
4.1. Simulation Study
We perform Monte Carlo simulations to evaluate the methodology presented in Section 3. We assess the power of the test for detecting differences between medians of two functional paired samples, with the one-sample problem being a particular case.
Consider a set of paired curves with
and
where , for is a common mean function, whereas and are a paired stochastic process with generalized Tukey-lambda distribution [31]. To obtain the realizations , the paired stochastic process , for , is simulated by using the function rpaired.gld of an R library named PairedData [32]. To simulate curves under the null hypothesis, consider the models defined in (7) and (8) with , that is, a constant function at zero for all t, and ; see Figure 1.
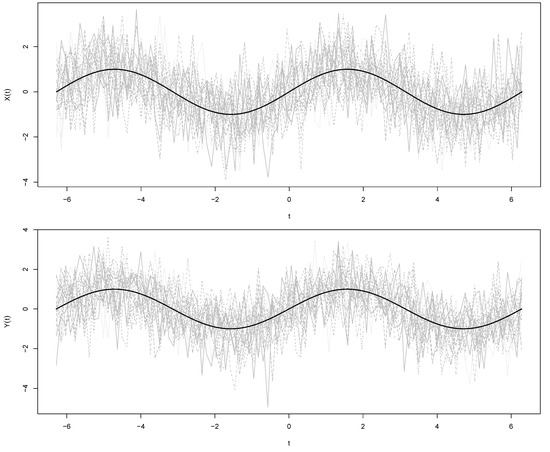
Figure 1.
Curves simulated (gray lines) under the null hypothesis in group 1 (at the top) and group 2 (at the bottom). The black lines in both cases correspond to the mean curve .
In order to evaluate the power of the sign and Wilcoxon tests, we take , for all , with . We consider five sample sizes . At each case, 1000 realizations are generated and used to estimate empirically the power of the tests. Based on each sample size n, we conduct both a sign and Wilcoxon test as defined in Section 3. We utilize the libraries PASWR [33] and stats of R to carry out the tests at each iteration. At each case, the power of the test is obtained as the percentage of p-values less than 0.05. As an illustration, the simulations under the null hypothesis (with ) are shown in Figure 1. With the data of this simulation, the p-values obtained are 0.03 and 0.04, respectively. Following a similar procedure based on 1000 simulations, the p-values obtained were 0.03 (sign test) and 0.046 (Wilcoxon test). In Figure 2 and Figure 3, we show the empirical power curves of the tests for each one of the sampling sizes n and values . In both figures, note that the power of the tests increases when and n increase, that is, the simulation study provides evidence that the sign and Wilcoxon tests for functional data proposed here are unbiased and consistent empirically. It is important to emphasize that, in the case of the Wilcoxon test, a symmetry test [34,35] must be performed beforehand. A comparison of the power curves in Figure 2 and Figure 3 indicates that, as in the standard case, the Wilcoxon test is slightly more powerful.
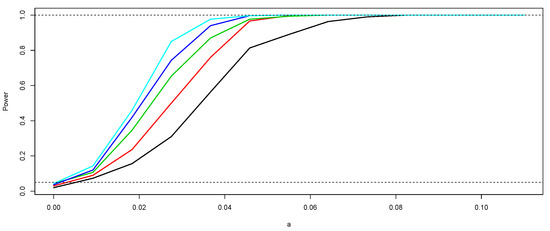
Figure 2.
Empirical power of the sign test according to and n. The black curve corresponds to the power of the test for and the light blue curve to the case of . The other curves correspond to (red), (green), and (dark blue).
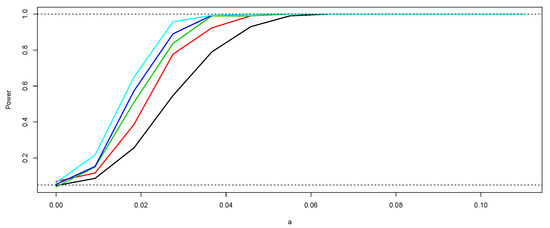
Figure 3.
Empirical power of the Wilcoxon test according to and n. The black curve corresponds to the power of the test for and the light blue curve to the case of . The other curves correspond to (red), (green), and (dark blue).
4.2. Application to Canadian Temperature Data
We apply the Mann-Whitney test of Section 3 to a meteorological data set widely used in FDA. This data set corresponds to daily average (30 years) of temperature (in Celsius degrees) at each one of 35 weather stations located across climate zones of Canada [1]. Some approaches for ANOVA, regression and cluster analysis [36] for functional data have been illustrated using this data set.
We show that statistical inference for functional data assuming Gaussianity can be unrealistic with these data and that the approaches presented here are valid alternatives under this scenario of non-Gaussianity. In order to carry out the analysis, we use the data from Atlantic and Continental zones (15 and 9 stations, respectively); see Figure 4. The data for each station are obtained from Ramsay and Silverman’s website (http://www.functionaldata.org). We smooth the data for each station using 65 Fourier basis functions. The number of basis functions is obtained by the generalized cross-validation criterion. According to [26], temperature curves of Atlantic coastal display little amplitude cool winters and summers. They appear to have a temperature around five Celsius degrees warmer than the Canadian average. In addition, the temperature of Continental stations show high amplitude and peakedness with cold winters and hot summers. Note that they are slightly warmer than average in the summer but are colder in the winter by about five Celsius degrees; see Figure 4. These descriptions suggest that there are heterogeneous patterns between these two data sets. In order to establish from a statistical point of view if there are significant differences between these zones, we apply a Mann-Whitney test for functional data as described in Section 3.
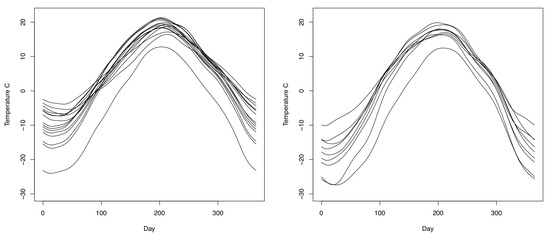
Figure 4.
Temperature curves (in Celsius degrees) of the Atlantic (left) and Continental (right) climate zones obtained after daily data averages are smoothed using 65 Fourier basis functions.
Initially, a Brownian motion is generated. Then, we compute the random projections
and
where and are the smoothed curves based on the Fourier basis. By using and , the Mann-Whitney test is applied. Before performing this test, the projections of each group are tested for Gaussianity using the Shapiro-Wilk test. The p-values of this test are 0.0013 (Atlantic zone) and 0.044 (Continental zone), respectively. This indicates that, in both cases we reject the hypothesis of Gaussianity at a level of significance , which suggests that using a two-sample t-test for these functional data is inadequate. In this scenario of non-Gaussianity, a Mann-Whitney test is a better alternative. The p-value for this test is 0.0013, that is, there are significant differences between the median temperature curves of both zones.
In order to establish in which periods of the year the differences occur, we apply a pointwise t-test for functional data based on permutations (a valid approach because this test does not assumes Gaussianity) using the function tperm.fd of the an R library named fda [26]; see Figure 5. The dotted line in this Figure suggests that differences between these zones are given in both January to March and September to December. The results found are consistent with the description of Canada’s climate variability, since the Atlantic and Continental regions have opposite temperature patterns. The Atlantic region of Canada is typically warmer during the winter and cooler during the summer, while in this season the parts of the country farthest from open water are the coldest ones. Note that our statistical analysis performed contributes to the explanation of these differences.
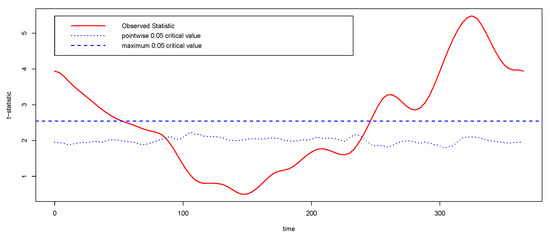
Figure 5.
A t-test based on permutations for the temperature data of Atlantic and Continental zones. The dashed line gives a critical value for the maximum of the t-statistic and the dotted line provides the permutation critical value for the pointwise statistic.
5. Conclusions, Discussion and Future Research
This paper reported the following findings:
- (i)
- An extension of the sign test to the functional data context was proposed.
- (ii)
- The Wilcoxon test in the functional data field was derived.
- (iii)
- The Mann-Whitney test for functional data analysis was stated.
- (iv)
- The power of the tests for detecting differences between medians of two functional paired samples was evaluated by Monte Carlo simulations.
- (v)
- An illustration with a real data set was considered to show potential applications of the results proposed.
In summary, we proposed nonparametric alternatives of methods used for testing hypothesis when one-sample, paired-sample and two-sample problems with non-Gaussian functional data are stated. We utilized random projections to become the functional problem into a scalar one, and then we proceeded as in the standard case. Based on a simulation study, we showed that the proposed tests have a good performance. Specifically, the empirical power curve for the sign test provided evidence that this test is unbiased and consistent. The same result was obtained with the Wilcoxon test. We illustrated our methods with a real data set. Thus, our proposal may be a knowledge addition to the tools of diverse practitioners, including engineers, statisticians and data scientists.
Some additional aspects which deserve study for future work in this field, which arose from the present investigation, are the following:
- (i)
- A power comparison between global tests for one-sample and two-sample problems with functional data can be considered.
- (ii)
- The extension to the case of a nonparametric test for the k-sample problem and designs in random blocks are also of interest.
- (iii)
- Applications to other models involving functional data are also of practical relevance [37,38,39,40,41,42,43].
- (iv)
- Usages of the methodology considered in this study may be of interest in diverse fields where the functional data analysis is employed [1].
Therefore, the proposed methodology in this study promotes new challenges and opens other issues to be considered in future research.
Author Contributions
Data curation, R.M. and R.G.; formal analysis, R.M., R.G. and V.L.; investigation, R.M., R.G. and V.L.; methodology, R.M., R.G. and V.L.; writing—original draft, R.G. and V.L. All authors have read and agreed to the published version of the manuscript.
Funding
This research was supported partially by project grant “Fondecyt 1200525” (V. Leiva) from the National Agency for Research and Development (ANID) of the Chilean government.
Institutional Review Board Statement
Not applicable.
Informed Consent Statement
Not applicable.
Data Availability Statement
The data are available from Ramsay and Silverman’s website (http://www.functionaldata.org).
Acknowledgments
The authors would also like to thank the Editor and Reviewers for their constructive comments which led to improving the presentation of the manuscript.
Conflicts of Interest
The authors declare no conflict of interest.
References
- Ramsay, J.; Silverman, B. Functional Data Analysis; Springer: New York, NY, USA, 2005. [Google Scholar]
- Ferraty, F.; Vieu, P.; Viguier-Pla, S. Factor-based comparison of groups of curves. Comput. Stat. Data Anal. 2007, 51, 4903–4910. [Google Scholar] [CrossRef]
- Sangalli, L.M.; Secchi, P.; Vantini, S.; Veneziani, A. A case study in exploratory functional data analysis: Geometrical features of the internal carotid artery. J. Am. Stat. Assoc. 2009, 104, 37–48. [Google Scholar] [CrossRef]
- Cardot, H.; Sarda, P. Estimation in generalized linear models for functional data via penalized likelihood. J. Multivar. Anal. 2005, 92, 24–41. [Google Scholar] [CrossRef]
- Bohorquez, M.; Giraldo, R.; Mateu, J. Optimal sampling for spatial prediction of functional data. Stat. Methods Appl. 2010, 25, 39–54. [Google Scholar] [CrossRef]
- Hörmann, S.; Kokoszka, P. Weakly dependent functional data. Ann. Stat. 2019, 38, 845–1884. [Google Scholar] [CrossRef]
- Reyes, A.; Giraldo, R.; Mateu, J. Residual kriging for functional spatial prediction of salinity curves. Commun. Stat. Theory Methods 2015, 44, 798–809. [Google Scholar] [CrossRef]
- Górecki, T.; Krzyśko, M.; Waszak, T.; Wołyński, W. Selected statistical methods of data analysis for multivariate functional data. Stat. Pap. 2018, 59, 153–182. [Google Scholar] [CrossRef]
- Kokoszka, P.; Reimherr, M. Introduction to Functional Data Analysis; CRC: New York, NY, USA, 2017. [Google Scholar]
- Górecki, T.; Smaga, L. fdANOVA: An R software package for analysis of variance for univariate and multivariate functional data. Comput. Stat. 2019, 34, 571–597. [Google Scholar] [CrossRef]
- Horváth, L.; Kokoszka, P. Inference for Functional Data with Applications; Springer: New York, NY, USA, 2012. [Google Scholar]
- Aneiros, G.; Cao, R.; Fraiman, R.; Genest, C.; Vieu, P. Recent advances in functional data analysis and high-dimensional statistics. J. Multivar. Anal. 2019, 170, 3–9. [Google Scholar] [CrossRef]
- Zhang, J. Analysis of Variance for Functional Data; CRC: Boca Raton, FL, USA, 2013. [Google Scholar]
- Pomann, G.; Staicu, A.; Ghosh, S. A two-sample distribution-free test for functional data with application to a diffusion tensor imaging study of multiple sclerosis. J. R. Stat. Soc. C 2016, 65, 395–414. [Google Scholar] [CrossRef]
- Zhang, C.H.; Peng, H.; Zhang, J. Two samples tests for functional data. Commun. Stat. Theory Methods 2010, 39, 559–578. [Google Scholar] [CrossRef]
- Staicu, A.; Li, Y.; Crainiceanu, C.; Ruppert, D. Likelihood ratio tests for dependent data with applications to longitudinal and functional data analysis. Scand. J. Stat. 2014, 41, 932–949. [Google Scholar] [CrossRef]
- Zhang, J.; Liang, X.; Xiao, S. On the two-sample Behrens-Fisher problem for functional data. J. Stat. Theory Pract. 2010, 4, 571–587. [Google Scholar] [CrossRef]
- Zhang, J.; Liang, X. One-way ANOVA for functional data via globalizing the pointwise F-test. Scand. J. Stat. 2014, 41, 51–71. [Google Scholar] [CrossRef]
- Aristizabal, J.; Giraldo, R.; Mateu, J. Analysis of variance for spatially correlated functional data: Application to brain data. Spat. Stat. 2019, 32, 100381. [Google Scholar] [CrossRef]
- Cuevas, A.; Febrero, M.; Fraiman, R. An ANOVA test for functional data. Comput. Stat. Data Anal. 2004, 47, 111–122. [Google Scholar] [CrossRef]
- Cuesta-Albertos, A.; Febrero-Bande, M. A simple multiway ANOVA for functional data. TEST 2010, 19, 537–557. [Google Scholar] [CrossRef]
- Conover, W. Practical Nonparametric Statistics; Wiley: New York, NY, USA, 1999. [Google Scholar]
- Hollander, M.; Wolfe, D. Nonparametric Statistical Methods; Wiley: New York, NY, USA, 1999. [Google Scholar]
- Wilcoxon, F. Individual comparisons by ranking methods. Biometrics 1945, 1, 80–83. [Google Scholar] [CrossRef]
- Mann, H.; Whitney, D. On a test of whether one of two random variables is stochastically larger than the other. Ann. Math. Stat. 1947, 18, 50–60. [Google Scholar] [CrossRef]
- Ramsay, J.; Graves, S.; Hooker, G. fda: Functional Data Analysis, Manual. R Package Version 5.1. 2020. Available online: https://CRAN.R-project.org/package=fda (accessed on 22 November 2020).
- Vempala, S. The Random Projection Method; American Mathematical Society: Providence, RI, USA, 2005. [Google Scholar]
- Nieto-Reyes, A. Random projections: Applications to statistical data depth and goodness of fit test. Bol. Estad. Investig. Operat. 2019, 35, 7–22. [Google Scholar]
- Cuesta-Albertos, J.; del Barrio, E.; Fraiman, R.; Matrán, C. The random projection method in goodness of fit for functional data. Comput. Stat. Data Anal. 2007, 51, 4814–4831. [Google Scholar] [CrossRef]
- Cuevas, A.; Febrero, M.; Fraiman, R. Robust estimation and classification for functional data via projection-based depth notions. Comput. Stat. 2004, 22, 48–496. [Google Scholar] [CrossRef]
- Freimer, M.; Kollia, G.; Mudholkar, G.; Lin, C. A study of the generalized Tukey lambda family. Commun. Stat. Theory Methods 2007, 17, 3547–3567. [Google Scholar] [CrossRef]
- Champely, S. Paired Data Analysis, R Package Version 1.1.0. 2013. Available online: http://cran.r-project.org/package=Paired.Data (accessed on 22 November 2020).
- Arnholt, A. PASWR: Probability and Statistics with R, R Package Version 1.1. 2012. Available online: https://CRAN.R-project.org/package=PASWR (accessed on 22 November 2020).
- Babativa, G.; Corzo, J. A proposed runs trimming test for the hypothesis of symmetry. Rev. Colomb. Estad. 2010, 33, 251–271. [Google Scholar]
- Gastwirth, J.; Gel, J.; Hui, V.; Miao, W.; Noguchi, K. Lawstat: Tools for Biostatistics, Public Policy, and Law. R Package Version 3.3. 2019. Available online: https://CRAN.R-project.org/package=lawstat (accessed on 22 November 2020).
- Giraldo, R.; Delicado, P.; Mateu, J. Hierarchical clustering of spatially correlated functional data. Stat. Neerl. 2007, 66, 403–421. [Google Scholar] [CrossRef]
- Giraldo, R.; Herrera, L.; Leiva, V. Cokriging prediction using as secondary variable a functional random field with application in environmental pollution. Mathematics 2020, 8, 1305. [Google Scholar] [CrossRef]
- Ignaccolo, R.; Mateu, J.; Giraldo, R. Kriging with external drift for functional data for air quality monitoring. Stoch. Environ. Res. Risk Assess. 2014, 28, 1171–1186. [Google Scholar] [CrossRef]
- Diaz-Garcia, J.A.; Galea, M.; Leiva, V. Influence diagnostics for multivariate elliptic regression linear models. Commun. Stat. Theory Methods 2003, 32, 625–641. [Google Scholar] [CrossRef]
- Leiva, V.; Saulo, H.; Leao, J.; Marchant, C. A family of autoregressive conditional duration models applied to financial data. Comput. Stat. Data Anal. 2014, 79, 175–191. [Google Scholar] [CrossRef]
- Garcia-Papani, F.; Uribe-Opazo, M.A.; Leiva, V.; Aykroyd, R.G. Birnbaum-Saunders spatial modelling and diagnostics applied to agricultural engineering data. Stoch. Environ. Res. Risk Assess. 2017, 31, 105–124. [Google Scholar] [CrossRef]
- Martinez, S.; Giraldo, R.; Leiva, V. Birnbaum-Saunders functional regression models for spatial data. Stoch. Environ. Res. Risk Assess. 2019, 33, 1765–1780. [Google Scholar] [CrossRef]
- Sánchez, L.; Leiva, V.; Galea, M.; Saulo, H. Birnbaum-Saunders quantile regression models with application to spatial data. Mathematics 2020, 8, 1000. [Google Scholar] [CrossRef]
Publisher’s Note: MDPI stays neutral with regard to jurisdictional claims in published maps and institutional affiliations. |
© 2020 by the authors. Licensee MDPI, Basel, Switzerland. This article is an open access article distributed under the terms and conditions of the Creative Commons Attribution (CC BY) license (http://creativecommons.org/licenses/by/4.0/).