Abstract
In many areas of applied sciences, the last step of a study often consists in analyzing in depth the collected data. Among all the kinds of data, the lifetime data are well-known to convey a great deal of information whose capture is necessary to identify one or more key phenomena. In this regards, numerous mathematical models have been proposed, including those based on lifetime distributions. In this paper, we introduce a new four-parameter lifetime distribution based on the type II Topp-Leone-G family and the power Lomax distribution. In comparison to the existing distributions, the new one is characterized by very flexible probability functions: increasing, decreasing, J, and reverse J shapes are observed for the probability density and hazard rate functions, giving first signs on the potential of adaptability of the related model. With this idea in mind, the new distribution is studied in detail, from both the theoretical and applied sides. After showing its main mathematical properties, the related model is investigated with estimation of the parameters by the maximum likelihood method. We applied it to two practical datasets, including the well-know aircraft windshield data. We show that the new model performs better than several modern adversary models, motivating its use in an applied setting.
Keywords:
mathematical model; probability distribution; power Topp-Leone distribution; estimation; data analysis MSC:
60E05; 62E15; 62F10
1. Introduction
1.1. From the Lomax Distribution to the Power Lomax Distribution
Over the last decades, the so-called Lomax distribution (introduced in [1]) was revealed to be a goldest distribution for a plethora of applications in applied sciences. We refer the reader to the works of [2] for applications in life testing, [3] for applications in queue service discipline, [4] for applications in personal wealth, and [5] for applications in internet traffic, to name a few. The use of the Lomax distribution is often motivated by its heavy tailed nature and the simplicity of the related probability functions, providing an interesting polynomial alternative to the exponential-type distributions (exponential, Rayleigh, Weibull, etc.) (see [6]). Indeed, the mathematical definition of the Lomax distribution is based on the following cumulative distribution function (cdf):
with . Thus, is a shape parameter and is a scale parameter. The corresponding probability function (pdf) is given by
In view of this pdf, we can notice that the Lomax distribution naturally appears as a special case of other well-known distributions, such as the Pareto type II, Pareto type IV, Feller-Pareto, Fisher and beta of the second kind distributions.
However, the Lomax distribution has some limitations: beyond the data showing heavy tailed features, the related model can lack of flexibility and be useless for a thorough analysis. For this reason, numerous efforts have been launched to generalized these distributions in the best way possible. Among these generalizations, we would like to mention the Marshall-Olkin extended Lomax distribution by [7], the exponentiated Lomax distribution by [8], the McDonald Lomax distribution by [9], the Poisson Lomax distribution by [10], the gamma Lomax distribution by [11], the exponential Lomax distribution by [12], the transmuted Lomax distribution by [13], the weighted Lomax distribution by [14], the Weibull Lomax distribution by [15], the Gompertz Lomax distribution by [16], the Transformed-Transformer Lomax distribution by [17], and the power Lomax (PL) distribution by [18].
For the purposes of this paper, let us now discuss the PL distribution. First, it is defined by the following cdf:
with . Thus, and are two shape parameters and is a scale parameter. The corresponding pdf is given by
The additional parameter has a significant effect on the flexibility on the pdf. In particular, one can show that is increasing if and decreasing if . This generalization thus reaches of new level of flexibility in term of modeling by keeping a relative simplicity for the expressions of the corresponding probability functions.
1.2. On the Extensions of the PL Distribution through the Use of General Families of Distributions
In the recent literature, some recent extensions of the PL distribution have seen the light through the use of general families of distributions. We refer to the exponentiated PL distribution introduced by [19], the odds generalized exponential PL distribution proposed by [20], and the transmuted PL distribution studied by [21]. The first one is a member of the exponentiated-G family by [22], the second one is member of the odds generalized exponential-G family by [23], and the third one is a member of the transmuted-G family by [24], all defined with the PL distribution as baseline distribution.
The main idea of these three extensions is to exploit the parameter(s) of the considered general family as tuning parameter(s) to increase the desirable properties of the former PL distribution, including more possibilities for the values of the mean, variance, mode, skewness and kurtosis. The practical gain is flagrant, with better fits for various datasets in comparison to the former PL distribution. Thus, the consideration of new powerful families of distributions can give desirable extensions of the PL distributions, with possible new perspectives.
With this idea in mind, let us now briefly present an emergent family of distributions: the type II Topp-Leone-G (TIITL-G) family introduced by [25], known to be a suitable alternative to the exponentiated-G, odds generalized exponential-G and transmuted-G families (among others). For the mathematical backgrounds, the cdf of the TIITL-G family is given by
where is a positive shape parameter and is a cdf of a baseline continuous distribution which may depend on a parameter vector . The corresponding pdf is given by
where is the pdf corresponding to . One can remark that the TIITL-G family is a simplified version of the Kumaraswamy-G family by [26]. The role of the parameter is to create new possible levels of skewness and tail weights from the cdf . Therefore, the TIITL-G family was naturally used to extend several well-known distributions, with applications. For instance, we refer the reader to the works of [27,28] for extension of the inverse and generalized inverse Rayleigh distributions and [29] for extension of the inverted Kumaraswamy distribution.
In this paper, a similar methodology is adopted but with a focus on the PL distribution. Indeed, we extend the PL distribution through the TIITL-G family; the special member of the TIITL-G family defined with the PL distribution as baseline distribution is considered.
1.3. Novelty and Contributions
Thus, we create a new four-parameter lifetime distribution, called the type II Topp-Leone power Lomax (TIITLPL). The main contributions of this study are the followings:
- To improve the characteristics and flexibility of the PL distribution by using the TIITL-G family (as motivated above). In particular, increasing, decreasing, J, and reverse J shapes are observed for the probability density and hazard rate functions, illustrating this claim.
- To introduce an extended version of the PL distribution whose quantile function has a closed-form.
- To study important statistical properties of the TIITLPL distribution, including the skewness, kurtosis, and various kinds of moments and order statistics.
- To explore the inferential features of the TIITLPL distribution through the use of the maximum likelihood method, providing a comprehensive methodology for the practitioner.
- To provide better fits than the competing modified models. In this study, an exhaustive list of such competitor models are considered (including those described in [11,19,21,30,31,32,33], to name a few), with favorable results for the TIITLPL model.
All these points are developed in detail through the study, with discussions and comparisons to the existing works.
1.4. Paper Organization
In Section 2, we define the TIITLPL distribution and present its main functions of interest. Some mathematical properties of the distribution are investigated in Section 3. Section 4 focuses on the inference of the TIITLPL model, with estimation of the unknown parameters by the method of maximum likelihood. In Section 5, we illustrate the importance of the TIITLPL model by means of two practical datasets: the well-known aircraft windshield and cancer patient datasets. A conclusion is proposed in Section 6.
2. The TIITLPL Distribution
This section is devoted to the presentation of the TIITLPL distribution, including its main probability functions with analytical and graphical studies.
2.1. Definition
As developed in the Introduction, the cdf of the TIITLPL distribution is obtained by compounding the cdf given by Equation (5) with the one given by Equation (3). Thus, it is given by
with . In addition, by Equations (6) and (4), the corresponding pdf follows:
Remark 1.
The common brace term of the cdf and pdf can also be expressed as
Thus, for instance, the pdf can be expressed as
Let us now study some analytical properties of . When , by using standard limited developments, we get . Hence, if , we have ; if , we have ; and, , we have .
In addition, when , we have . That is, for all the values of the parameters, we have .
The critical points of can be described analytically. Indeed, a critical point of , say , satisfies the non-linear equation given by (where the differentiation is according to x), with
Then, the nature of can be determined by investigating the sign of the real number . In view of the complexity of the equation above, there is no closed-form for , but numerical solutions exist via the use of any mathematical software. To handle the flexibility of , Figure 1 shows some plots of this function for selected values of , , , and . We observe that is left skewed, right skewed, J, reverse J, and near symmetrical shaped.
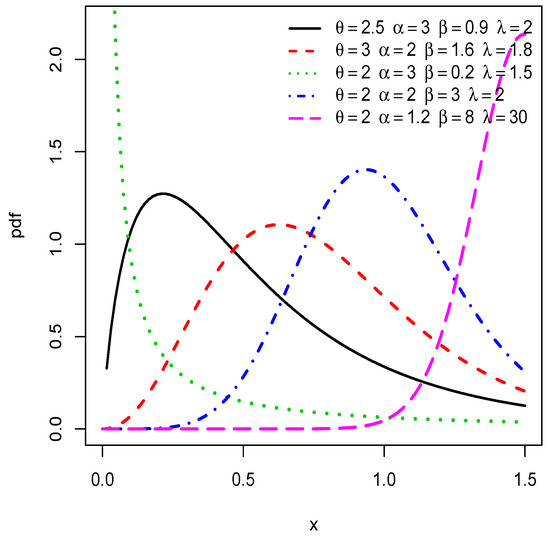
Figure 1.
Plots of the pdf of the TIITLPL distribution for selected values of the parameters.
2.2. Common Reliability Functions
The survival function (sf), hazard rate function (hrf), reversed hazard rate function, and cumulative hazard rate function of the TIITLPL distribution are given, respectively, by
and
Among them, the most informative function remains the hrf. Let us now study it analytically.
When , we obtain . Hence, if , we have ; if , we have ; and, , we have .
In addition, when , we get . Thus, for all the values of the parameters, we have . We see that the parameters have no effect on the rate of convergence of , contrary to .
Furthermore, the critical points of can be described analytically. Then, a critical point of , say , satisfies the non-linear equation given by , with
Then, the sign of the real number can inform us on the nature of . Again, no closed-form for exist, but we can evaluate it numerically at least. The flexibility of is illustrated in Figure 2 for selected values of , , , and . In particular, we observe that is increasing, decreasing, upside-down bathtub, and constant shaped.
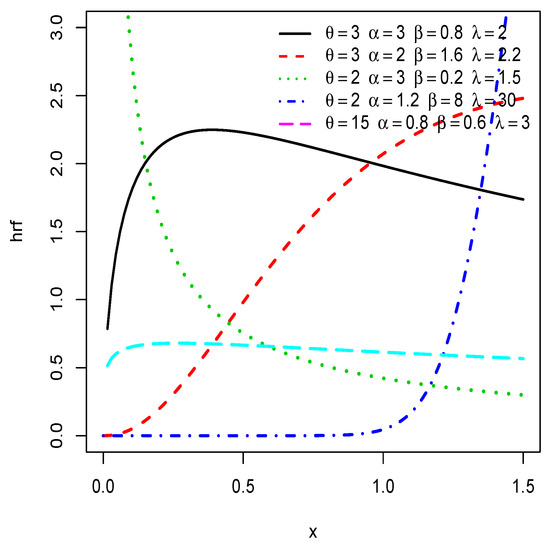
Figure 2.
Plots of the hrf of the TIITLPL distribution for selected values of the parameters.
3. Mathematical Properties
The main mathematical properties of the TIITLPL distribution are discussed in this section.
3.1. Quantile Function and Applications
The quantile function of a distribution is useful to described important properties of the distribution. Here, we present the quantile function of the TIITLPL distribution, as well as related properties, applications, and functions.
3.1.1. Definition
The quantile function of the TIITLPL distribution is defined by , . After some algebraic manipulations, we get
In particular, the quartiles of the TIITLPL distribution can be expressed. Here, we just mention the median (second quartile) given by
Table 1 presents the numerical values of the median of the TIITLPL distribution for some values of the parameters. We see that various values can be obtained, i.e., , showing the flexibility of the central tendency of the distribution.

Table 1.
The numerical values of the median of the TIITLPL distribution for some values of the parameters.
3.1.2. Generated Values
The following result holds in our setting: For a random variable U following the uniform distribution on , the random variable follows the TIITLPL distribution. Hence, generated values from the TIITLPL distribution are obtained as follows. Let be n independent realizations from U. Then, n values from the TIITLPL distribution are given by , where for .
3.1.3. Some Related Functions
Important functions can be derived from the quantile function. For instance, upon differentiation of according to u, the quantile density function is given by
In addition, the hazard quantile function is defined by , i.e.,
These functions are useful in reliability. In particular, can be interpreted as a certain the conditional probability involving the point of distribution. In addition, the quantile function is uniquely determined as the following integral expression:
We refer the reader to [34,35].
3.1.4. Skewness and Kurtosis Based on the Quantile Function
A common approach to measure the skewness and kurtosis of a distribution is to consider measures defined with moments. However, these moments do not always exist. This is particularly true for heavy-tailed distributions such as the Lomax or PL distribution. For this reason, some alternatives are given by the use of the quantile function. In particular, to measure the skewness, we can use the Galton skewness coefficient defined by
To evaluate the kurtosis, we can use the Moors kurtosis coefficient defined by
The sign of S is informative on the direction of the skewness of the distribution: for right skewed, for symmetric, and for left skewed. The value of K measures the tail-heaviness of the distribution; in general, the bigger is the value of K is, the heavier is the tail of the distribution. We refer the reader to [36,37] for further details on these measures.
Three-dimensional plots for S and K are proposed in Figure 3 and Figure 4. We see smooth variations for the three-dimensional surface corresponding to these measures (in green), with possible high variations according to the values of the parameters, showing the flexibility of the distribution on these aspects.
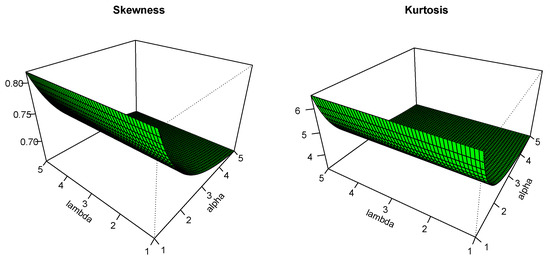
Figure 3.
Plots for S and K for , , and .
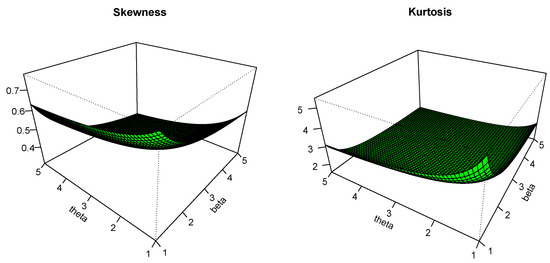
Figure 4.
Plots for S and K for , , and .
3.2. Useful Expansions
The following result proposes a series expansion for the pdf of the TIITLPL distribution.
Theorem 1.
For any , we have
where
with .
Proof.
Owing to Equation (7), by applying the generalized binomial and standard binomial formulas in a row, we get
By differentiating the (left and right) functions above according to x, we get the desired result. This ends the proof of Theorem 1. □
A generalization of this result is given below.
Theorem 2.
Let υ be a positive integer. For any , we have
where
Proof.
We start the proof by expanding the function . Owing to Equation (9) and the generalized binomial and standard binomial formulas, we obtain
By differentiating the functions above according to x and noticing that
we establish the desired result. This ends the proof of Theorem 2. □
One can remark that .
Theorems 1 and 2 are useful for determining sums expressions of important statistical measures. Some of them are presented in the next.
3.3. Moments
Two kinds of moments for the TIITLPL distribution are now investigated, with discussions.
3.3.1. Ordinary moments
Let X be a random variable following the TIITLPL distribution. Then, if it exists, the sth ordinary moment of X is given by
Since, when , we have , this integral exists if and only if (there is no problem of existence when ). If the parameters s, , , , and are fixed, we can evaluate the numerical values of by using a mathematical software such as R, Matlab, and Mathematica.
A sum expression of can be derived to Theorem 1, as presented below.
Proposition 1.
Let us suppose that . Then, we have
where
and denotes the standard beta function defined by .
Proof.
Now, by applying the two changes of variables and in a row, we get
By putting the above equalities together and noticing that , we end the proof of Proposition 1. □
By taking , we obtain the mean of X, i.e., . The variance of X is obtained by . Further, one can determine the sth central moment and sth cumulant of X defined by, respectively,
with . One can also express several measures of skewness and kurtosis based on the central moments (or cumulants).
3.3.2. Incomplete Moments
Let X be a random variable following the TIITLPL distribution and, for any , let be the random variable such that if and 0 otherwise. Then, the sth incomplete moment of X is given by
Note that always exists. As for the ordinary moments, if the parameters s, t, , , , and are fixed, a numerical calculation of is always possible by any mathematical software.
In this regards, by using the R software, Table 2 collects the numerical values of the first four incomplete moments of the TIITLPL distribution with for some values of the parameters. We observe that the parameters of the distribution have a high impact on these values.
Table 2.
The numerical values of the first four incomplete moments of the TIITLPL distribution with for some values of the parameters.
From the analytical point of view, a sum expression of is presented below.
Proposition 2.
Proof.
The proof is similar to the one of Proposition 1, only the upper bound of the integral term must be adjusted. Thus, Theorem 1 gives
where is given by Equation (10) and
Now, by applying the two changes of variables and , i.e., , in a row, we get
Since , by combining the above equalities, we end the proof of Proposition 2. □
From the incomplete moments of X, one can define important quantities and functions. For instance, one can express the mean deviations of X about the mean and the median M by, respectively,
Other quantities can be defined in a similar manner. Well-known functions defined with the s-incomplete moment include the sth lower and upper conditional moments of X defined by, respectively,
and
3.4. Order Statistics
Let X be a random variable following the TIITLPL distribution and, for a random sample of size n from X, say , let be the ith order statistic such that , where for . In full generality, the study of the order statistics is of importance since they naturally appear in various applications, mainly those involving systems composed of several components that can fail independently of each other. Here, some distributional properties of are presented. First, the pdf of is given by
It follows from the binomial formula that
An immediate application of Theorem 2 gives us the following series expansion:
where
and is defined by Equation (11) with .
From this series expansion, structural properties of the distribution of can be determined, as several kinds of moments. For instance, after some algebraic manipulations, the sth moment of is given by
where .
Let us now focus on the extreme order statistics defined by and , having the pdfs given by, respectively,
and
The following result concerns the limiting distributions of and , involving the well-known Weibull and Fréchet distributions.
Theorem 3.
- The limiting distribution of is the Weibull distribution with the following cdf: , , i.e., there exist and such that
- The limiting distribution of is the Fréchet distribution with the following cdf: , , i.e., there exist and such that
Proof.
- Let us recall that, when , we have and . Hence, owing to l’Hospital’s rule, we haveIt follows from ([38] Theorem 8.3.6) the desired result.
- Let us recall that, when , we have . Thus, by applying l’Hospital’s rule, we haveThe desired result follows from ([39] Theorem 1.6.2 and Corollary 1.6.3).
The proof of Theorem 3 is completed. □
4. Inference
We now investigate the inferential aspect of the TIITLPL model. The unknown parameters are estimated by the well-established maximum likelihood estimation method.
4.1. Maximum Likelihood Estimation Method
The maximum likelihood estimation method consists in determining the parameters that maximize the likelihood function of the sample data, called the maximum likelihood estimates (MLEs). For the purpose of this paper, from an observed sample from the TIITLPL distribution, the corresponding likelihood function is given by
The MLEs of , , , and are denoted by , , , and , respectively. They can also be obtained by maximization of a more tractable function: the log-likelihood function is given by
Thus, , , , and are the simultaneous solutions of the following non-linear equations: , , and , according to the parameters. Here, these partial derivatives are of complexed form, i.e.,
and
Let us just mention that, owing to Equation (13), the MLEs satisfy the following simple relation:
However, we have no closed-forms for the MLEs. Numerical maximization algorithms are useful in this regards; most of the statistical softwares can be used to provide numerical evaluations of the MLEs. Finally, the choice of the MLEs in our context is motivated as usual: theoretical results ensure that, under some (abstract regularity) conditions, the subjacent random versions of the MLEs converge (in some senses) to the real value of the unknown parameters, which is a very desirable property for practical purposes. In addition, thanks to the existing theory on the MLEs, one can provide asymptotic confidence sets and likelihood tests involving , , , and , which is, however, out the scope of this study.
4.2. Simulation
Thus, mathematical guarantees justify the use of the MLEs in our setting. We now illustrate this fact through a complete numerical study. We proceed as follows:
- One thousand random samples of size , 100, 200, and 500 are generated from the TIITLPL distribution by the use of the quantile function (see Section 3.1.2).
- Eight different sets of values of true parameters , , , and in order, are taken asSet 1 , Set 2 , Set 3 ,Set 4 , Set 5 , Set 6 ,Set 7 , Set 8 .
- The mean of the obtained MLEs (Estimates) and the mean squared errors (MSEs) for the selected sets of parameters are calculated.
-
Table 3. Estimates and MSEs of TIITLPL distribution for MLEs by using different parameter values.
Table 4. Estimates and MSEs of TIITLPL distribution for MLEs by using different parameter values.
The calculations were performed via Mathematica 9. We observe that the MSEs converge to zero when the sample size is increased, which is consistent with the well-known theoretical convergence properties of the MLEs.
5. Applications
In this section, the highly effectiveness of TIITLPL distribution is proved by the use of two well-known practical datasets: the aircraft windshield dataset and the cancer patient data, presented in more detail below.
We also make comparisons with other distributions by providing a formative evaluation of the goodness of fit of the models. The following goodness of fit measures are considered: the Akaike information criterion (AIC), consistent AIC (CAIC), Hannan–Quinn information criterion (HQIC), Anderson–Darling (A), and Cramér–von Mises (W). In general, the smaller the values of these statistics is, the better the fit to the data is.
5.1. Aircraft Windshield Data
The first dataset was studied by [40], which represents the failure times for a particular windshield device. A brief statistical description of them is given in Table 5.
Table 5.
Descriptive statistics for the aircraft windshield data.
In particular, we see that the data are platykurtosis. More informative descriptive illustrations are given in Figure 5.
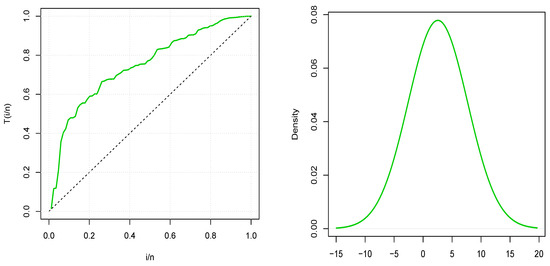
Figure 5.
Plots TTT and kernel density plot for the aircraft windshield data.
The total time on test (TTT) plot in Figure 5 shows a concave TTT-transform, indicating that the hrf is possibly increasing. Moreover, the basic kernel density estimator is nearly symmetrical (unimodal). Hence, the TIITLPL model could be appropriate for fitting this dataset.
Thus, for the aircraft windshield data, we compare the fit of the TIITLPL distribution with the following distributions: the gamma Lomax (GL) distribution by [11], beta Lomax (BL) distribution by [30], transmuted Weibull Lomax (TWL) distribution by [33], Kumaraswamy Weibull (KwW) distribution by [41], McDonald Weibull (McW) distribution by [42], beta Weibull (BW) distribution by [43], transmuted log-logistic (TLL) distribution by [44], and (standard) log-logistic (LL) distribution and transmuted Marshall-Olkin Fréchet (TMOFr) distribution by [45].
The MLEs of the parameters of these distributions and the corresponding standard errors (SEs) for windshield data are provided in Table 6. The statistics AIC, CAIC, HQIC, A, and W are listed in Table 7.
Table 6.
MLEs and SEs (in parentheses) for the aircraft windshield data.
Table 7.
The AIC, CAIC, HQIC, A, and W statistics for the aircraft windshield data.
We note from the results in Table 7 that the TIITLPL model gives the smallest values of AIC, CAIC, HQIC, A, and W as compared to the other competitive models. Therefore, the TIITLPL distribution provides the best fit for the aircraft windshield data. To illustrate and complete these numerical results, Figure 6 plots the histogram and the estimated pdf of the TIITLPL distribution, the Probability-Probability (P-P) plot showing a nice line adjustment of the scatter plot, and the estimated cdf and sf over the empirical cdf and sf, respectively.
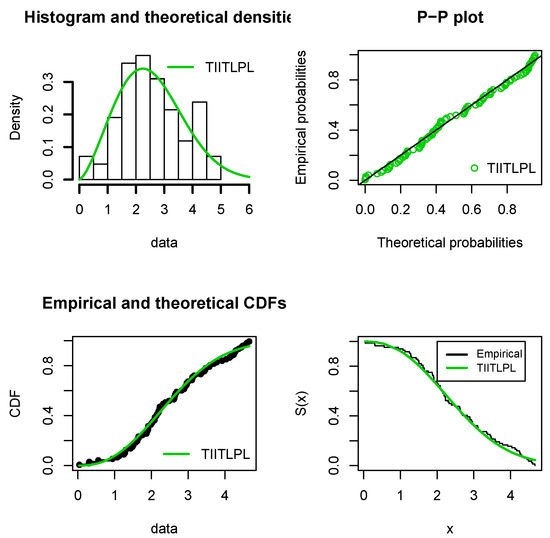
Figure 6.
Several kinds of fits of the TIITLPL distribution for the aircraft windshield data.
In addition, we would like to mention that, for this dataset, the TIITLPL distribution outperforms the EPL distribution by [19] presented in the Introduction; if we compare Table 7 and ([19] Table 5), the AIC, CAIC, A, and are favorable for the TIITLPL distribution.
5.2. Cancer Patient Data
The cancer patient dataset describes the remission times (in months) of a random sample of 128 bladder cancer patients studied by [46]. A brief statistical description of them is given in Table 8.
Table 8.
Descriptive statistics for the cancer patient data.
We can remark that the data are right skewed with a high kurtosis showing the heavy tailed nature of the data. More informations are given in Figure 7 with the consideration of a TTT plot and a basic kernel estimation of the unknown subjacent pdf.
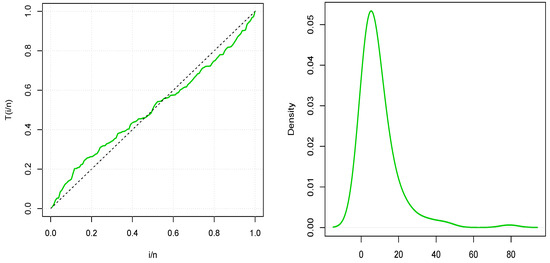
Figure 7.
Plots TTT and kernel density plot for the cancer patient data.
The TTT-plot in Figure 7 shows that the TTT-transform is first concave then convex giving an indication of bathtub shape of the hrf. Furthermore, the kernel density estimator is heavy right skewed (unimodal). Hence, the TIITLPL model could be appropriate model for fitting the cancer patient dataset.
For these data, we thus compare the fit of the TIITLPL distribution with some other distributions: the transmuted modified Weibull (TMW) distribution by [47], transmuted additive Weibull (TAW) distribution by [31], generalized inverse gamma (GIG) distribution by [32], beta exponentiated Burr XII (BEBXII) distribution by [48], beta Fréchet (BFr) distribution by [49], Kumaraswamy log-logistic (KwLL) distribution by [50], transmuted complementary Weibull geometric (TCWG) distribution by [51], Kumaraswamy exponentiated Burr XII (KwEBXII) distribution by [52], generalized transmuted Weibull (GTW) distribution by [53], and the exponentiated transmuted generalized Rayleigh (ETGR) distribution by [54].
The MLEs of the parameters of these distributions and the corresponding SEs for the cancer patient data are provided in Table 9. The statistics AIC, CAIC, HQIC, A, and W are listed in Table 10.
Table 9.
MLEs and SEs (in parentheses) for the cancer patient data.
Table 10.
The AIC, CAIC, HQIC, A, and W statistics for the cancer patient data.
We note from the results in Table 10 that the TIITLPL model gives the smallest values of AIC, CAIC, HQIC, A, and W as compared to the other competitive models. Therefore, TIITLPL distribution provides the best fit for the cancer patient data.
Figure 8 plots the histogram and the estimated pdf of the TIITLPL distribution, the probability-probability (P-P) plot, and the estimated cdf and sf over the empirical cdf and sf, respectively, all showing nice fits for the TIITLPL distribution.
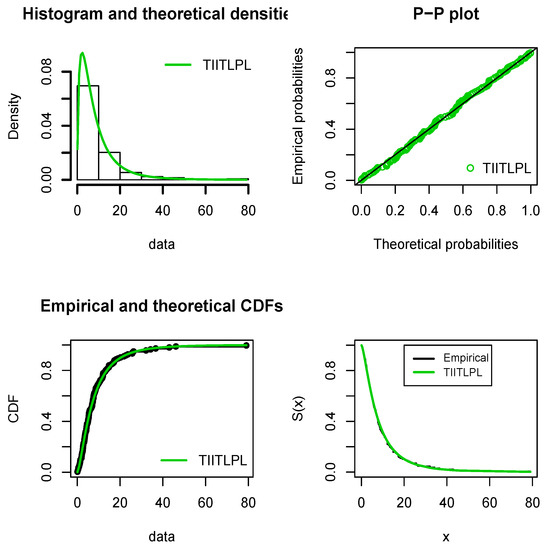
Figure 8.
Several kinds of fits of the TIITLPL distribution for the cancer patient data.
As a last remark, for this dataset, we observe that the TIITLPL distribution outperforms the TPL distribution by [21] presented in the Introduction; if we compare Table 10 with ([21] Table 2), the AIC, CAIC, and HQIC are favorable for the TIITLPL distribution.
6. Final Remarks
Motivated by the high demand of data analysis in applied sciences, we introduce a new four-parameter lifetime distribution, called the TIITLPL distribution, having desirable properties in this regards. We study its main mathematical aspects, proving comprehensible results of independent interest. Then, the related model is explored by the use of the maximum likelihood method. Two concrete datasets are then analyzed, including the well-known aircraft windshield data. Fair comparisons are performed with modern and well-established adversary models, with favorable issues for the TIITLPL model. Thanks to its potentiality, we hope that the TIITLPL distribution will give satisfaction to researchers in various applied areas wishing a depth analysis of their lifetime data.
Author Contributions
S.A.-M., F.J., C.C. and M.E. contributed equally to this work. All authors have read and agreed to the published version of the manuscript.
Funding
This work was funded by the Deanship of Scientific Research (DSR), King Abdul Aziz University, Jeddah, under grant No. D-143-363-1440.
Acknowledgments
We thank the three reviewers for their very constructive suggestions and comments on the manuscript. This work was funded by the Deanship of Scientific Research (DSR), King Abdul Aziz University, Jeddah, under grant No. D-143-363-1440. The authors gratefully acknowledge the DSR technical and financial support.
Conflicts of Interest
The authors declare no conflict of interest.
Abbreviations
| cdf | cumulative distribution function |
| probability distribution function | |
| PL | Power Lomax |
| TIITL-G | type II Topp-Leone-G |
| TIITLPL | type II Topp-Leone power Lomax |
| sf | survival function |
| hrf | hazard rate function |
| MLE | maximum likelihood estimate |
| MSE | mean squared error |
| AIC | Akaike information criterion |
| CAIC | consistent Akaike information criterion |
| HQIC | Hannan-Quinn information criterion |
| Anderson-Darling | |
| Cramér-von Mises | |
| TTT | total time on test |
| GL | gamma Lomax |
| BL | beta Lomax |
| TWL | Transmuted Weibull Lomax |
| KwW | Kumaraswamy Weibull |
| McW | McDonald Weibull |
| BW | beta Weibull |
| TLL | transmuted log-logistic |
| LL | log-logistic |
| TMOFr | transmuted Marshall-Olkin Fréchet |
| SE | standard error |
| TMW | transmuted modified Weibull |
| TAW | transmuted additive Weibull |
| GIG | generalized inverse gamma |
| BEBXII | beta exponential Burr XII |
| BFr | beta Fréchet |
| KwLL | Kumaraswamy log-logistic |
| TCWG | transmuted complementary Weibull geometric |
| KwEBXII | Kumaraswamy exponentiated Burr XII |
| GTW | generalized transmuted-W |
| ETGR | exponentiated transmuted generalized Rayleigh |
| Nomenclature | |
| cdf of the Lomax distribution | |
| pdf of the Lomax distribution | |
| cdf of the power Lomax distribution | |
| pdf of the power Lomax distribution | |
| cdf of the TIITL-G family | |
| pdf of the TIITL-G family | |
| cdf of the TIITLPL distribution | |
| pdf of the TIITLPL distribution | |
| sf of the TIITLPL distribution | |
| hrf of the TIITLPL distribution | |
| reverse hazard rate function of the TIITLPL distribution | |
| cumulative hazard rate function of the TIITLPL distribution | |
| quantile function of the TIITLPL distribution | |
| M | Median of the TIITLPL distribution |
| quantile density function of the TIITLPL distribution | |
| hazard quantile function of the TIITLPL distribution | |
| S | Galton skewness of the TIITLPL distribution |
| K | Moors kurtosis of the TIITLPL distribution |
| coefficient in the considered series expansion for | |
| coefficient in the considered series expansion for | |
| sth ordinary moment of the TIITLPL distribution | |
| coefficient in the considered series expansion for | |
| sth central moment of the TIITLPL distribution | |
| sth cumulant of the TIITLPL distribution | |
| sth incomplete moment taken on t of the TIITLPL distribution | |
| mean deviation about the mean of the TIITLPL distribution | |
| mean deviation about the median of the TIITLPL distribution | |
| lower conditional moment taken on t of the TIITLPL distribution | |
| upper conditional moment taken on t of the TIITLPL distribution | |
| ith order statistic of the TIITLPL distribution | |
| pdf of the ith order statistic of the TIITLPL distribution | |
| coefficient in the considered series expansion for | |
| sth moment of the ith order statistic of the TIITLPL distribution | |
| likelihood function of the TIITLPL distribution | |
| log-likelihood function of the TIITLPL distribution | |
| , , and | MLEs of , , and , respectively |
| n | size of the considered sample or the number of data |
References
- Lomax, K.S. Business failures: Another example of the analysis of failure data. J. Am. Stat. Assoc. 1954, 49, 847–852. [Google Scholar] [CrossRef]
- Hassan, A.; Al-Ghamdi, A. Optimum step stress accelerated life testing for Lomax distribution. J. Appl. Sci. Res. 2009, 5, 2153–2164. [Google Scholar]
- Harris, C. The Pareto distribution as a queue service discipline. Oper. Res. 1968, 16, 307–313. [Google Scholar] [CrossRef]
- Atkinson, A.; Harrison, A. Distribution of Personal Wealth in Britain; Cambridge University Press: Cambridge, UK, 1978. [Google Scholar]
- Chen, J.; Addie, R.G.; Zukerman, M.; Neame, T.D. Performance evaluation of a queue fed by a Poisson Lomax Burst Process. IEEE Commun. Lett. 2015, 19, 367–370. [Google Scholar] [CrossRef]
- Bryson, M.C. Heavy-tailed distribution: properties and tests. Technometrics 1974, 16, 61–68. [Google Scholar] [CrossRef]
- Ghitany, M.E.; Al-Awadhi, F.A.; Alkhalfan, L.A. Marshall Olkin extended Lomax distribution and its application to censored data. Commun. Stat. Theory Methods 2007, 36, 1855–1866. [Google Scholar] [CrossRef]
- Abdul-Moniem, I.B.; Abdel-Hameed, H.F. On exponentiated Lomax distribution. Int. J. Math. Arch. 2012, 3, 2144–2150. [Google Scholar]
- Lemonte, A.J.; Cordeiro, G.M. An extended Lomax distribution. Statistics 2013, 47, 800–816. [Google Scholar] [CrossRef]
- Al-Zahrani, B.; Sagor, H. The Poisson-Lomax distribution. Rev. Colomb. Estad. 2014, 37, 225–245. [Google Scholar] [CrossRef]
- Cordeiro, G.M.; Ortega, E.M.; Popovíc, B.V. The gamma Lomax distribution. J. Stat. Comput. Simul. 2015, 85, 305–319. [Google Scholar] [CrossRef]
- El-Bassiouny, A.H.; Abdo, N.F.; Shahen, H.S. Exponential Lomax distribution. Int. J. Comput. Appl. 2015, 121, 24–29. [Google Scholar]
- Ashour, S.K.; Eltehiwy, M.A. Transmuted Lomax distribution. Am. J. Appl. Math. Stat. 2013, 1, 121–127. [Google Scholar] [CrossRef]
- Kilany, N.M. Weighted Lomax distribution. SpringerPlus 2016, 5, 1862. [Google Scholar] [CrossRef] [PubMed]
- Tahir, M.H.; Cordeiro, G.M.; Mansoor, M.; Zubair, M. The Weibull-Lomax distribution: Properties and applications. Hacet. J. Math. Stat. 2015, 44, 461–480. [Google Scholar] [CrossRef]
- Oguntunde, P.E.; Khaleel, M.A.; Ahmed, M.T.; Adejumo, A.O.; Odetunmibi, O.A. A New Generalization of the Lomax Distribution with Increasing, Decreasing and Constant Failure Rate. Model. Simul. Eng. 2017, 2017, 6043169. [Google Scholar] [CrossRef]
- Alzaghal, A.; Hamed, D. New families of generalized Lomax distributions: Properties and Applications. Int. J. Stat. Probab. 2019, 8, 51–68. [Google Scholar] [CrossRef][Green Version]
- Rady, E.A.; Hassanein, W.A.; Elhaddad, T.A. The power Lomax distribution with an application to bladder cancer data. SpringerPlus 2016, 5, 1838. [Google Scholar] [CrossRef]
- Al-Marzouki, S. A new generalization of power Lomax distribution. Int. J. Math. Appl. 2018, 7, 59–68. [Google Scholar]
- Assar, S.M. On odds generalized exponential-power Lomax distribution. J. Math. Stat. 2018, 14, 167–174. [Google Scholar] [CrossRef]
- Moltok, T.T.; Dikko, H.G.; Asiribo, O.E. A transmuted Power Lomax distribution. Afr. J. Nat. Sci. 2017, 20, 67–78. [Google Scholar]
- Gupta, R.D.; Kundu, D. Exponentiated exponential family: An alternative to Gamma and Weibull distributions. Biom. J. 2001, 43, 117–130. [Google Scholar] [CrossRef]
- Tahir, M.H.; Cordeiro, G.M.; Alizadeh, M.; Mansoor, M.; Zubair, M. The odd generalized exponential family of distributions with applications. J. Stat. Distrib. Appl. 2015, 2, 1–28. [Google Scholar] [CrossRef]
- Shaw, W.T.; Buckley, I.R. The Alchemy of Probability Distributions: beyond Gram-Charlier Expansions, and a Skew-kurtotic-normal Distribution from a Rank Transmutation Map. arXiv 2009, arXiv:0901.0434. [Google Scholar]
- Elgarhy, M.; Nasir, M.A.; Jamal, F.; Ozel, G. The type II Topp-Leone generated family of distributions: Properties and applications. J. Stat. Manag. Syst. 2018, 21, 1529–1551. [Google Scholar] [CrossRef]
- Cordeiro, G.M.; de Castro, M. A new family of generalized distributions. J. Stat. Comput. Simul. 2011, 81, 883–893. [Google Scholar] [CrossRef]
- Mohammed, H.F.; Yahia, N. On type II Topp-Leone inverse Rayleigh distribution. Appl. Math. Sci. 2019, 13, 607–615. [Google Scholar] [CrossRef]
- Yahia, N.; Mohammed, H.F. The type II Topp-Leone generalized inverse Rayleigh distribution. Int. J. Contemp. Math. Sci. 2019, 14, 113–122. [Google Scholar] [CrossRef]
- ZeinEldin, R.A.; Jamal, F.; Chesneau, C.; Elgarhy, M. Type II Topp-Leone inverted Kumaraswamy distribution with statistical inference and applications. Symmetry 2019, 11, 1459. [Google Scholar] [CrossRef]
- Eugene, N.; Lee, C.; Famoye, F. Beta-normal distribution and its applications. Commun. Stat. Theory Methods 2002, 31, 497–512. [Google Scholar] [CrossRef]
- Elbatal, I.; Aryal, G. On the transmuted additive Weibull distribution. Aust. J. Stat. 2013, 42, 117–132. [Google Scholar] [CrossRef]
- Mead, M. Generalized inverse gamma distribution and its application in reliability. Commun. Stat. Theory Methods 2015, 44, 1426–1435. [Google Scholar] [CrossRef]
- Afify, A.Z.; Nofal, Z.M.; Yousof, H.M.; El Gebaly, Y.M.; Butt, N.S. The transmuted Weibull Lomax distribution: Properties and application. Pak. J. Stat. Oper. Res. 2015, 11, 135–152. [Google Scholar] [CrossRef]
- Gilchrist, W. Statistical Modelling with Quantile Functions; Chapman and Hall/CRC: Boca Raton, FL, USA, 2000. [Google Scholar]
- Nair, N.U.; Sankaran, P.G. Quantile-based reliability analysis. Commun. Stat. Theory Methods 2009, 38, 222–232. [Google Scholar] [CrossRef]
- Galton, F. Inquiries into Human Faculty and Its Development; Macmillan and Company: London, UK, 1883. [Google Scholar]
- Moors, J.J.A. A quantile alternative for Kurtosis. J. R. Stat. Soc. Ser. 1988, 37, 25–32. [Google Scholar] [CrossRef]
- Arnold, B.; Balakrishnan, N.; Nagaraja, H. A First Course in Order Statistics; Wiley: New York, NY, USA, 1992. [Google Scholar]
- Leadbetter, M.; Lindgren, G.; Rootzén, H. Extremes and Related Properties of Random Sequences and Processes; Springer: New York, NY, USA, 1987. [Google Scholar]
- Murthy, D.N.P.; Xie, M.; Jiang, R. Weibull Models; Wiley: New York, NY, USA, 2004. [Google Scholar]
- Cordeiro, G.M.; Ortega, E.M.M.; Nadarajah, S. The Kumaraswamy Weibull distribution with application to failure data. J. Frankl. Inst. 2010, 349, 1174–1197. [Google Scholar] [CrossRef]
- Cordeiro, G.M.; Hashimoto, E.M.; Ortega, E.M. The McDonald-Weibull model. Stat. J. Theor. Appl. Stat. 2014, 48, 256–278. [Google Scholar] [CrossRef]
- Lee, C.; Famoye, F.; Olumolade, O. Beta-Weibull distribution: Some properties and applications to censored data. J. Mordern Appl. Stat. Methods 2007, 6, 173–186. [Google Scholar] [CrossRef]
- Aryal, G.R. Transmuted log-logistic distribution. J. Stat. Appl. Probab. 2013, 2, 11–20. [Google Scholar] [CrossRef]
- Afify, A.Z.; Hamedani, G.G.; Ghosh, I.; Mead, E.M. The transmuted Marshall-Olkin Fréchet distribution: Properties and applications. Int. J. Probab. Stat. 2015, 4, 132–148. [Google Scholar] [CrossRef]
- Lee, E.T.; Wang, J.W. Statistical Methods for Survival Data Analysis, 3rd ed.; JohnWiley and Sons, Inc.: Hoboken, NJ, USA, 2003. [Google Scholar]
- Khan, M.S.; King, R. Transmuted modified Weibull distribution: A generalization of the modified Weibull probability distribution. Eur. J. Pure Appl. Math. 2013, 6, 66–88. [Google Scholar]
- Mead, M. A new generalization of Burr XII distribution. J. Stat. Adv. Theory Appl. 2014, 12, 53–73. [Google Scholar]
- Nadarajah, S.; Gupta, A.K. The beta Fréchet distribution. Far East J. Theor. Stat. 2004, 14, 15–24. [Google Scholar]
- De Santana, T.V.F.; Ortega, E.M.M.; Cordeiro, G.M.; Silva, G.O. The Kumaraswamy log-logistic distribution. J. Stat. Theory Appl. 2012, 11, 265–291. [Google Scholar]
- Afify, A.Z.; Nofal, Z.M.; Butt, N.S. Transmuted complementary Weibull geometric distribution. Pak. J. Stat. Oper. Res. 2014, 10, 435–454. [Google Scholar] [CrossRef]
- Mead, M.E.; Afify, A.Z. On five parameter Burr XII distribution: Properties and applications. S. Afr. Stat. J. 2017, 51, 67–80. [Google Scholar]
- Nofal, Z.M.; Afify, A.Z.; Yousof, H.M.; Cordeiro, G.M. The generalized transmuted-G family of distributions. Commun. Stat. Theory Methods 2017, 46, 4119–4136. [Google Scholar] [CrossRef]
- Afify, A.Z.; Nofal, Z.M.; Ebraheim, A.N. Exponentiated transmuted generalized Rayleigh: A new four parameter Rayleigh distribution. Pak. J. Stat. Oper. Res. 2015, 11, 115–134. [Google Scholar] [CrossRef]
© 2019 by the authors. Licensee MDPI, Basel, Switzerland. This article is an open access article distributed under the terms and conditions of the Creative Commons Attribution (CC BY) license (http://creativecommons.org/licenses/by/4.0/).