Comparative Evaluation and Ranking of the European Countries Based on the Interdependence between Human Development and Internal Security Indicators


Abstract
:1. Introduction
2. Materials and Methods
2.1. Criteria and Their Definitions
- Capacity: Do security providers have the resources needed to address security violation?
- Process: Are the resources directed towards violence prevention used effectively?
- Legitimacy: Are security providers trusted by the people? Do they abuse their position?
- Outcomes: Do people feel safe in their neighbourhoods? Are crime rates low?
2.2. General Description of WEBIRA Method
3. Results
4. Discussion
5. Conclusions
Author Contributions
Funding
Conflicts of Interest
References
- Hollis, S. The Global construction of EU. Dev. Pol. J. Eur. Integr. 2014, 36, 567–583. [Google Scholar] [CrossRef]
- Abdelmottlep, M.A. World Internal Security and Police Index 2016. International Police Science Association (IPSA), 2016. Available online: http://insyde.org.mx/wp-content/uploads/WISPI-Report_EN_WEB_0.pdf (accessed on 21 January 2019).
- Abbott, P.; Teti, A. A Generation in waiting for jobs and justice: Young people not in education employment or training in North Africa. Arab Transform. Work. Pap. 2017. [Google Scholar] [CrossRef]
- Fritza, M.; Koch, M. Economic development and prosperity patterns around the world: Structural challenges for a global steady-state economy. Glob. Environ. Chang. 2016, 38, 41–48. [Google Scholar] [CrossRef]
- Rivera, M.A. The synergies between human development, economic growth, and tourism within a developing country: An empirical model for Ecuador. J. Dest. Mark. Manag. 2017, 6, 221–232. [Google Scholar] [CrossRef]
- Sen, A. Development as Freedom; Oxford University Press: Oxford, UK, 1999. [Google Scholar]
- Asongu, S.A.; Nwachukwu, J.C.; Pyke, C. The right to life: Global evidence on the role of security officers and the police in modulating the effect of insecurity on homicide. Soc. Indic. Res. 2018, 140, 1–14. [Google Scholar] [CrossRef]
- Mitchell, N.J.; Carey, S.C.; Butler, C.K. The impact of pro-government militias on human rights violations. Int. Interact. 2014, 40, 812–826. [Google Scholar] [CrossRef]
- Asongu, S.A.; Nwachukwu, J.C. Mitigating externalities of terrorism on tourism: Global evidence from police, security officers and armed service personnel. Curr. Issues Tour. 2018. [Google Scholar] [CrossRef]
- Abdelzaher, D.; Fernandez, W.D.; Schneper, W.D. Legal rights, national culture and social networks: Exploring the uneven adoption of United Nations Global Compact. Int. Bus. Rev. 2019, 28, 12–24. [Google Scholar] [CrossRef]
- Human Development Indices and Indicators 2018 Statistical Update. HDRO (Human Development Report Office) United Nations Development Programme. Retrieved 14 September 2018. Available online: http://hdr.undp.org/sites/default/files/2018_human_development_statistical_update.pdf (accessed on 21 January 2019).
- Lestari, W.W.; Sanar, V.E. Analysis indicator of factors affecting human development index (Ipm). Geosfera Indonesia 2018, 2, 11–18. [Google Scholar] [CrossRef]
- Naanwaab, C. does economic freedom promote human development? New evidence from a cross-national study. J. Dev. Areas 2018, 52, 183–198. [Google Scholar] [CrossRef]
- Hirai, T. The Creation of the Human Development Approach; Palgrave Macmillan: London, UK, 2017. [Google Scholar]
- Zaborskis, A.; Grincaite, M.; Lenzi, M.; Tesler, R.; Moreno-Maldonado, C.; Mazur, J. Social inequality in adolescent life satisfaction: Comparison of measure approaches and correlation with macro-level indices in 41 countries. Soc. Indic. Res. 2019, 141, 1055–1079. [Google Scholar] [CrossRef]
- Murray, S.R.; Juodakis, J.; Bacelis, J.; Sand, A.; Norman, J.E.; Sengpiel, V.; Jacobsson, B. Geographical differences in preterm delivery rates in Sweden: A population-based cohort study. Acta Obstet. Gynecol. Scand. 2019, 98, 106–116. [Google Scholar] [CrossRef]
- Liu, S.Y.; Wu, P.C.; Huang, T.Y. Nonlinear Causality between Education and Health: The Role of Human Development Index. Appl. Res. Qual. Life 2018, 13, 761–777. [Google Scholar] [CrossRef]
- Sayed, H.; Hamed, R.; Hosny, S.H.; Abdelhamid, A.H. Avoiding ranking contradictions in human development index using goal programming. Soc. Indic. Res. 2018, 138, 405–442. [Google Scholar] [CrossRef]
- Carvalhal Monteiro, R.L.; Pereira, V.; Costa, H.G. A multicriteria approach to the human development index classification. Soc. Indic. Res. 2018, 136, 417–438. [Google Scholar] [CrossRef]
- Krylovas, A.; Dadelo, S.; Kosareva, N.; Zavadskas, E.K. Entropy-KEMIRA approach for MCDM problem solution in human resources selection task. Int. J. Inf. Technol. Decis. Mak. 2017, 16, 1151–1154. [Google Scholar] [CrossRef]
- Krylovas, A.; Kosareva, N.; Zavadskas, E.K. WEBIRA—Comparative analysis of weight balancing method. Int. J. Comput. Commun. Control 2017, 12, 238–253. [Google Scholar] [CrossRef]
- Kosareva, N.; Krylovas, A.; Zavadskas, E.K. Statistical analysis of MCDM data normalization methods using Monte Carlo approach. The case of ternary estimates matrix. Econ. Comput. Econ. Cybern. Stud. Res. 2018, 52, 159–175. [Google Scholar] [CrossRef]
- Saaty, T.L. The Analytic Hierarchy Process; McGraw-Hill: New York, NY, USA, 1980. [Google Scholar]
- Krylovas, A.; Zavadskas, E.K.; Kosareva, N.; Dadelo, S. New KEMIRA method for determining criteria priority and weights in solving MCDM problem. Int. J. Inf. Technol. Decis. Mak. 2014, 13, 1119–1134. [Google Scholar] [CrossRef]
- Hashemkhani Zolfani, S.; Saparauskas, J. New Application of SWARA Method in Prioritizing Sustainability Assessment Indicators of Energy System. Inzinerine Ekonomika—Eng. Econ. 2013, 24, 408–414. [Google Scholar] [CrossRef]
- Garcia, N.; Puente, J.; Fernandez, I.; Priore, P. Suitability of a consensual Fuzzy inference system to evaluate suppliers of strategic products. Symmetry 2018, 10, 22. [Google Scholar] [CrossRef]
- Shannon, C.E. A mathematical theory of communication. Bell Syst. Technol. J. 1948, 27, 379–423. [Google Scholar] [CrossRef]
- Pekelman, D.; Sen, S.K. Mathematical programming models for the determination of attribute weights. Manag. Sci. 1974, 20, 1217–1229. [Google Scholar] [CrossRef]
- Zavadskas, E.K.; Podvezko, V. Integrated determination of objective criteria weights in MCDM. Int. J. Inf. Technol. Decis. Mak. 2016, 15, 267–283. [Google Scholar] [CrossRef]
- Diakoulaki, D.; Mavrotas, G.; Papayannakis, L. Determining objective weights in multiple criteria problems: The CRITIC method. Comput. Oper. Res. 1995, 22, 763–770. [Google Scholar] [CrossRef]
- Krylovas, A.; Kosareva, N.; Zavadskas, E.K. Scheme for statistical analysis of some parametric normalization classes. Int. J. Comput. Commun. Control 2018, 13, 972–987. [Google Scholar] [CrossRef]
- MacCrimmon, K.R. Decision Making among Multiple-Attribute Alternatives: A Survey and Consolidated Approach, No. RM-4823-ARPA, Santa Monica: RAND Corporation, 1968. Available online: http://citeseerx.ist.psu.edu/viewdoc/download?doi=10.1.1.924.1201&rep=rep1&type=pdf (accessed on 21 January 2019).
- Vinogradova, I.; Podvezko, V.; Zavadskas, E.K. The recalculation of the weights of criteria in MCDM methods using the Bayes approach. Symmetry 2018, 10, 205. [Google Scholar] [CrossRef]
- Kemeny, J.G.; Snell, J.L. Mathematical Models in the Social Sciences; MIT Press Classic: New York, NY, USA, 1963. [Google Scholar]
- Lorbeer, B.; Kosareva, A.; Deva, B.; Softić, D.; Ruppel, P.; Küpper, A. Variations on the Clustering Algorithm BIRCH. Big Data Res. 2017, 11, 44–53. [Google Scholar] [CrossRef]
- Feldman, R.; Sanger, J. The Text Mining Handbook: Advanced Approaches in Analyzing Unstructured Data; Cambridge University Press: Cambridge, UK, 2007; Available online: https://wtlab.um.ac.ir/images/e-library/text_mining/The%20Text%20Mining%20HandBook.pdf (accessed on 21 January 2019).
- Weiss, S.M.; Indurkhya, N.; Zhang, T.; Damerau, F.J. Text Mining: Predictive Methods for Analyzing Unstructured Information; Springer: Berlin/Heidelberg, Germany, 2005. [Google Scholar]
- Boulton, F.; Louise, N. Can the health of a nation be correlated to its state of internal peace? Med. Confl. Surviv. 2016, 32, 70–79. [Google Scholar] [CrossRef] [PubMed]
- Menshikov, V.; Volkova, O.; Stukalo, N.; Simakhova, A. Social economy as a tool to ensure national security. J. Secur. Sustain. Issue 2017, 2, 11–231. [Google Scholar] [CrossRef]
- Lowatcharina, G.; Stallmann, J.I. The differential effects of decentralization on policeintensity: A cross-national comparison. Soc. Sci. J. 2018. [Google Scholar] [CrossRef]

| Domain | Indicator | Definition |
|---|---|---|
| Capacity | Police | Number of Police and Internal Security Officers per 100,000 people |
| Armed Forces | Number of Armed Service Personnel per 100,000 people | |
| Private Security | Number of Private Security Contractors per 100,000 people | |
| Prison Capacity | Ratio of Prisoners to Official Prison Capacity | |
| Process | Corruption | Control of Corruption |
| Effectiveness | Criminal Justice effectiveness, impartial, respects rights | |
| Bribe Payments to Police | % of Respondents who paid a bribe to a police officer in the past year | |
| Underreporting | Ratio of police reported thefts to survey reported thefts | |
| Legitimacy | Due Process | Due process of law and rights of the accused |
| Confidence in Police | % of Respondents who have confidence in their local police | |
| Public Use, Private Gain | Government officials in the police and the military do not use public office for private gain | |
| Political Terror | Use of Force by Government Against Its Own Citizens | |
| Outcomes | Homicide | Number of Intentional Homicides per 100,000 people |
| Violent Crime | % Assaulted or mugged in the last year | |
| Terrorism | Composite measure of deaths, injuries and incidents of terrorism | |
| Public Safety Perceptions | Perceptions of safety walking alone at night |
| Country | Mean Years of Schooling (years) | Expected Years of Schooling (years) | Life Expectancy at Birth (years) | GNI per Capita (PPP $) | Outcomes | Capacity | Legitimacy | Process |
|---|---|---|---|---|---|---|---|---|
| Albania | 10.00 | 14.80 | 78.50 | 11.89 | 0.72 | 0.647 | 0.562 | 0.297 |
| Armenia | 11.70 | 13.00 | 74.80 | 9.14 | 0.893 | 0.921 | 0.516 | 0.479 |
| Austria | 12.10 | 16.10 | 81.80 | 45.42 | 0.894 | 0.77 | 0.899 | 0.817 |
| Azerbaijan | 10.70 | 12.70 | 72.10 | 15.60 | 0.871 | 0.723 | 0.487 | 0.295 |
| Belarus | 12.30 | 15.50 | 73.10 | 16.32 | 0.686 | 0.975 | 0.486 | 0.472 |
| Belgium | 11.80 | 19.80 | 81.30 | 42.16 | 0.807 | 0.71 | 0.847 | 0.79 |
| Bosnia and Herzegovina | 9.70 | 14.20 | 77.10 | 11.72 | 0.824 | 0.916 | 0.642 | 0.465 |
| Bulgaria | 11.80 | 14.80 | 74.90 | 18.74 | 0.753 | 0.985 | 0.556 | 0.494 |
| Cyprus | 12.10 | 14.60 | 80.70 | 31.57 | 0.77 | 0.736 | 0.794 | 0.634 |
| Croatia | 11.30 | 15.00 | 77.80 | 22.16 | 0.854 | 0.939 | 0.695 | 0.605 |
| Czech Republic | 12.70 | 16.90 | 78.90 | 30.59 | 0.827 | 0.875 | 0.772 | 0.638 |
| Denmark | 12.60 | 19.10 | 80.90 | 47.92 | 0.885 | 0.648 | 0.904 | 0.948 |
| Estonia | 12.70 | 16.10 | 77.70 | 28.99 | 0.734 | 0.967 | 0.804 | 0.754 |
| Finland | 12.40 | 17.60 | 81.50 | 41.00 | 0.893 | 0.674 | 0.919 | 0.922 |
| France | 11.50 | 16.40 | 82.70 | 39.25 | 0.783 | 0.773 | 0.817 | 0.734 |
| Georgia | 12.80 | 15.00 | 73.40 | 9.19 | 0.766 | 0.823 | 0.752 | 0.593 |
| Germany | 14.10 | 17.00 | 81.20 | 46.14 | 0.852 | 0.778 | 0.867 | 0.876 |
| Greece | 10.80 | 17.30 | 81.40 | 24.65 | 0.704 | 0.783 | 0.691 | 0.583 |
| Hungary | 11.90 | 15.10 | 76.10 | 25.39 | 0.793 | 0.541 | 0.647 | 0.632 |
| Iceland | 12.40 | 19.30 | 82.90 | 45.81 | 0.906 | 0.635 | 0.893 | 0.81 |
| Ireland | 12.50 | 19.60 | 81.60 | 53.75 | 0.805 | 0.841 | 0.852 | 0.78 |
| Italy | 10.20 | 16.30 | 83.20 | 35.30 | 0.761 | 0.724 | 0.725 | 0.681 |
| Latvia | 12.80 | 15.80 | 74.70 | 25.00 | 0.695 | 0.934 | 0.691 | 0.558 |
| Lithuania | 13.00 | 16.10 | 74.80 | 28.31 | 0.68 | 0.903 | 0.733 | 0.605 |
| Montenegro | 11.30 | 14.90 | 77.30 | 16.78 | 0.833 | 0.914 | 0.681 | 0.481 |
| Netherlands | 12.20 | 18.00 | 82.00 | 47.90 | 0.866 | 0.707 | 0.858 | 0.898 |
| Norway | 12.60 | 17.90 | 82.30 | 68.01 | 0.801 | 0.658 | 0.916 | 0.908 |
| Poland | 12.30 | 16.40 | 77.80 | 26.15 | 0.858 | 0.848 | 0.738 | 0.676 |
| Portugal | 9.20 | 16.30 | 81.40 | 27.32 | 0.834 | 0.909 | 0.732 | 0.679 |
| Romania | 11.00 | 14.30 | 75.60 | 22.65 | 0.805 | 0.835 | 0.616 | 0.535 |
| Russian Federation | 12.00 | 15.50 | 71.20 | 24.23 | 0.449 | 0.984 | 0.33 | 0.415 |
| Serbia | 11.10 | 14.60 | 75.30 | 13.02 | 0.851 | 0.886 | 0.587 | 0.462 |
| Slovakia | 12.50 | 15.00 | 77.00 | 29.47 | 0.825 | 0.945 | 0.773 | 0.564 |
| Slovenia | 12.20 | 17.20 | 81.10 | 30.59 | 0.903 | 0.91 | 0.758 | 0.703 |
| Spain | 9.80 | 17.90 | 83.30 | 34.26 | 0.849 | 0.854 | 0.837 | 0.627 |
| Sweden | 12.40 | 17.60 | 82.60 | 47.77 | 0.848 | 0.611 | 0.886 | 0.92 |
| Switzerland | 13.40 | 16.20 | 83.50 | 57.63 | 0.864 | 0.674 | 0.9 | 0.824 |
| United Kingdom | 12.90 | 17.40 | 81.70 | 39.12 | 0.771 | 0.654 | 0.84 | 0.828 |
| Maximum | 14.10 | 19.80 | 83.50 | 68.01 | 0.91 | 0.99 | 0.92 | 0.95 |
| Minimum | 9.20 | 12.70 | 71.20 | 9.14 | 0.45 | 0.54 | 0.33 | 0.30 |
| Factors (Criteria) | Life Expectancy at Birth y1 | Mean Years of Schooling y2 | Expected Years of Schooling y3 | GNI per Capita y4 | Legitimacy x1 | Outcomes x2 | Capacity x3 |
|---|---|---|---|---|---|---|---|
| GNI per capita | 0.757 ** | 0.451 ** | 0.762 ** | 1 | |||
| 0.000 | 0.005 | 0.000 | |||||
| Legitimacy | 0.823 ** | 0.390 * | 0.711 ** | 0.794 ** | 1 | ||
| 0.000 | 0.016 | 0.000 | 0.000 | ||||
| Outcomes | 0.467 ** | −0.003 | 0.159 | 0.268 | 0.539 ** | 1 | |
| 0.003 | 0.987 | 0.339 | 0.103 | 0.000 | |||
| Capacity | −0.537 ** | −0.116 | −0.384 * | −0.531 ** | −0.492 ** | −0.319 | 1 |
| 0.001 | 0.487 | 0.017 | 0.001 | 0.002 | 0.051 | ||
| Process | 0.754 ** | 0.506 ** | 0.772 ** | 0.868 ** | 0.890 ** | 0.404 * | −0.498 ** |
| 0.000 | 0.001 | 0.000 | 0.000 | 0.000 | 0.012 | 0.001 |
| Country (Alternative) | Outcomes | Capacity | Legitimacy | Process | Mean Years of Schooling | Expected Years of Schooling | Life Expectancy at Birth | GNI per Capita |
|---|---|---|---|---|---|---|---|---|
| Factors | ||||||||
| Albania | 0.5929 | 0.7612 | 0.3938 | 0.0030 | 0.1632 | 0.2957 | 0.5934 | 0.0465 |
| Armenia | 0.9715 | 0.1441 | 0.3157 | 0.2817 | 0.5102 | 0.0422 | 0.2926 | 0 |
| Austria | 0.9737 | 0.4842 | 0.9660 | 0.7993 | 0.5918 | 0.4788 | 0.8617 | 0.6161 |
| Azerbaijan | 0.9234 | 0.5900 | 0.2665 | 0 | 0.3061 | 0 | 0.0731 | 0.1096 |
| Belarus | 0.5185 | 0.0225 | 0.2648 | 0.2710 | 0.6326 | 0.3943 | 0.1544 | 0.1219 |
| Belgium | 0.7833 | 0.6193 | 0.8777 | 0.7580 | 0.5306 | 1 | 0.8211 | 0.5607 |
| Bosnia and Herzegovina | 0.8205 | 0.1554 | 0.5297 | 0.2603 | 0.1020 | 0.2112 | 0.4796 | 0.0436 |
| Bulgaria | 0.6652 | 0 | 0.3837 | 0.3047 | 0.5306 | 0.2957 | 0.3008 | 0.1630 |
| Cyprus | 0.7024 | 0.5608 | 0.7877 | 0.5191 | 0.5918 | 0.2676 | 0.7723 | 0.3809 |
| Croatia | 0.8862 | 0.1036 | 0.6196 | 0.4747 | 0.4285 | 0.3239 | 0.5365 | 0.2211 |
| Czech Republic | 0.8271 | 0.2477 | 0.7504 | 0.5252 | 0.7142 | 0.5915 | 0.6260 | 0.3642 |
| Denmark | 0.9540 | 0.7590 | 0.9745 | 1 | 0.6938 | 0.9014 | 0.7886 | 0.6586 |
| Estonia | 0.6236 | 0.0405 | 0.8047 | 0.7029 | 0.7142 | 0.4788 | 0.5284 | 0.3371 |
| Finland | 0.9715 | 0.7004 | 1 | 0.9601 | 0.6530 | 0.6901 | 0.8373 | 0.5411 |
| France | 0.7308 | 0.4774 | 0.8268 | 0.6722 | 0.4693 | 0.5211 | 0.9349 | 0.5114 |
| Georgia | 0.6936 | 0.3648 | 0.7164 | 0.4563 | 0.7346 | 0.3239 | 0.1788 | 0.0007 |
| Germany | 0.8818 | 0.4662 | 0.9117 | 0.8897 | 1 | 0.6056 | 0.8130 | 0.6283 |
| Greece | 0.5579 | 0.4549 | 0.6129 | 0.4410 | 0.3265 | 0.6478 | 0.8292 | 0.2633 |
| Hungary | 0.7527 | 1 | 0.5382 | 0.5160 | 0.5510 | 0.3380 | 0.3983 | 0.2760 |
| Iceland | 1 | 0.7882 | 0.9558 | 0.7886 | 0.6530 | 0.9295 | 0.9512 | 0.6228 |
| Ireland | 0.7789 | 0.3243 | 0.8862 | 0.7427 | 0.6734 | 0.9718 | 0.8455 | 0.7577 |
| Italy | 0.6827 | 0.5878 | 0.6706 | 0.5911 | 0.2040 | 0.5070 | 0.9756 | 0.4442 |
| Latvia | 0.5382 | 0.1148 | 0.6129 | 0.4027 | 0.7346 | 0.4366 | 0.2845 | 0.2693 |
| Lithuania | 0.5054 | 0.1846 | 0.6842 | 0.4747 | 0.7755 | 0.4788 | 0.2926 | 0.3256 |
| Montenegro | 0.8402 | 0.1599 | 0.5959 | 0.2848 | 0.4285 | 0.3098 | 0.4959 | 0.1296 |
| Netherlands | 0.9124 | 0.6261 | 0.8964 | 0.9234 | 0.6122 | 0.7464 | 0.8780 | 0.6583 |
| Norway | 0.7702 | 0.7364 | 0.9949 | 0.9387 | 0.6938 | 0.7323 | 0.9024 | 1 |
| Poland | 0.8949 | 0.3085 | 0.6926 | 0.5834 | 0.6326 | 0.5211 | 0.5365 | 0.2888 |
| Portugal | 0.8424 | 0.1711 | 0.6825 | 0.5880 | 0 | 0.5070 | 0.8292 | 0.3086 |
| Romania | 0.7789 | 0.3378 | 0.4855 | 0.3675 | 0.3673 | 0.2253 | 0.3577 | 0.2293 |
| Russian Federation | 0 | 0.0022 | 0 | 0.1837 | 0.5714 | 0.3943 | 0 | 0.2563 |
| Serbia | 0.8796 | 0.2229 | 0.4363 | 0.2557 | 0.3877 | 0.2676 | 0.3333 | 0.0658 |
| Slovakia | 0.8227 | 0.0900 | 0.7521 | 0.4119 | 0.6734 | 0.3239 | 0.4715 | 0.3452 |
| Slovenia | 0.9934 | 0.1689 | 0.7266 | 0.6248 | 0.6122 | 0.6338 | 0.8048 | 0.3643 |
| Spain | 0.8752 | 0.2950 | 0.8607 | 0.5084 | 0.1224 | 0.7323 | 0.9837 | 0.4266 |
| Sweden | 0.8730 | 0.8423 | 0.9439 | 0.9571 | 0.6530 | 0.6901 | 0.9268 | 0.6560 |
| Switzerland | 0.9080 | 0.7004 | 0.9677 | 0.8101 | 0.8571 | 0.4929 | 1 | 0.8235 |
| United Kingdom | 0.7045 | 0.7454 | 0.8658 | 0.8162 | 0.7551 | 0.6619 | 0.8536 | 0.5091 |
| No | No | ||||||||
|---|---|---|---|---|---|---|---|---|---|
| 1 | 0 | 0 | 0 | 1 | 13 | 0 | 0.1 | 0.4 | 0.5 |
| 2 | 0 | 0 | 0.1 | 0.9 | 14 | 0 | 0.2 | 0.3 | 0.5 |
| 3 | 0 | 0 | 0.2 | 0.8 | 15 | 0.1 | 0.1 | 0.3 | 0.5 |
| 4 | 0 | 0.1 | 0.1 | 0.8 | 16 | 0.1 | 0.2 | 0.2 | 0.5 |
| 5 | 0 | 0 | 0.3 | 0.7 | 17 | 0 | 0.2 | 0.4 | 0.4 |
| 6 | 0 | 0.1 | 0.2 | 0.7 | 18 | 0.1 | 0.1 | 0.4 | 0.4 |
| 7 | 0.1 | 0.1 | 0.1 | 0.7 | 19 | 0 | 0.3 | 0.3 | 0.4 |
| 8 | 0 | 0 | 0.4 | 0.6 | 20 | 0.1 | 0.2 | 0.3 | 0.4 |
| 9 | 0 | 0.1 | 0.3 | 0.6 | 21 | 0.2 | 0.2 | 0.2 | 0.4 |
| 10 | 0 | 0.2 | 0.2 | 0.6 | 22 | 0.1 | 0.3 | 0.3 | 0.3 |
| 11 | 0.1 | 0.1 | 0.2 | 0.6 | 23 | 0.2 | 0.2 | 0.3 | 0.3 |
| 12 | 0 | 0 | 0.5 | 0.5 |
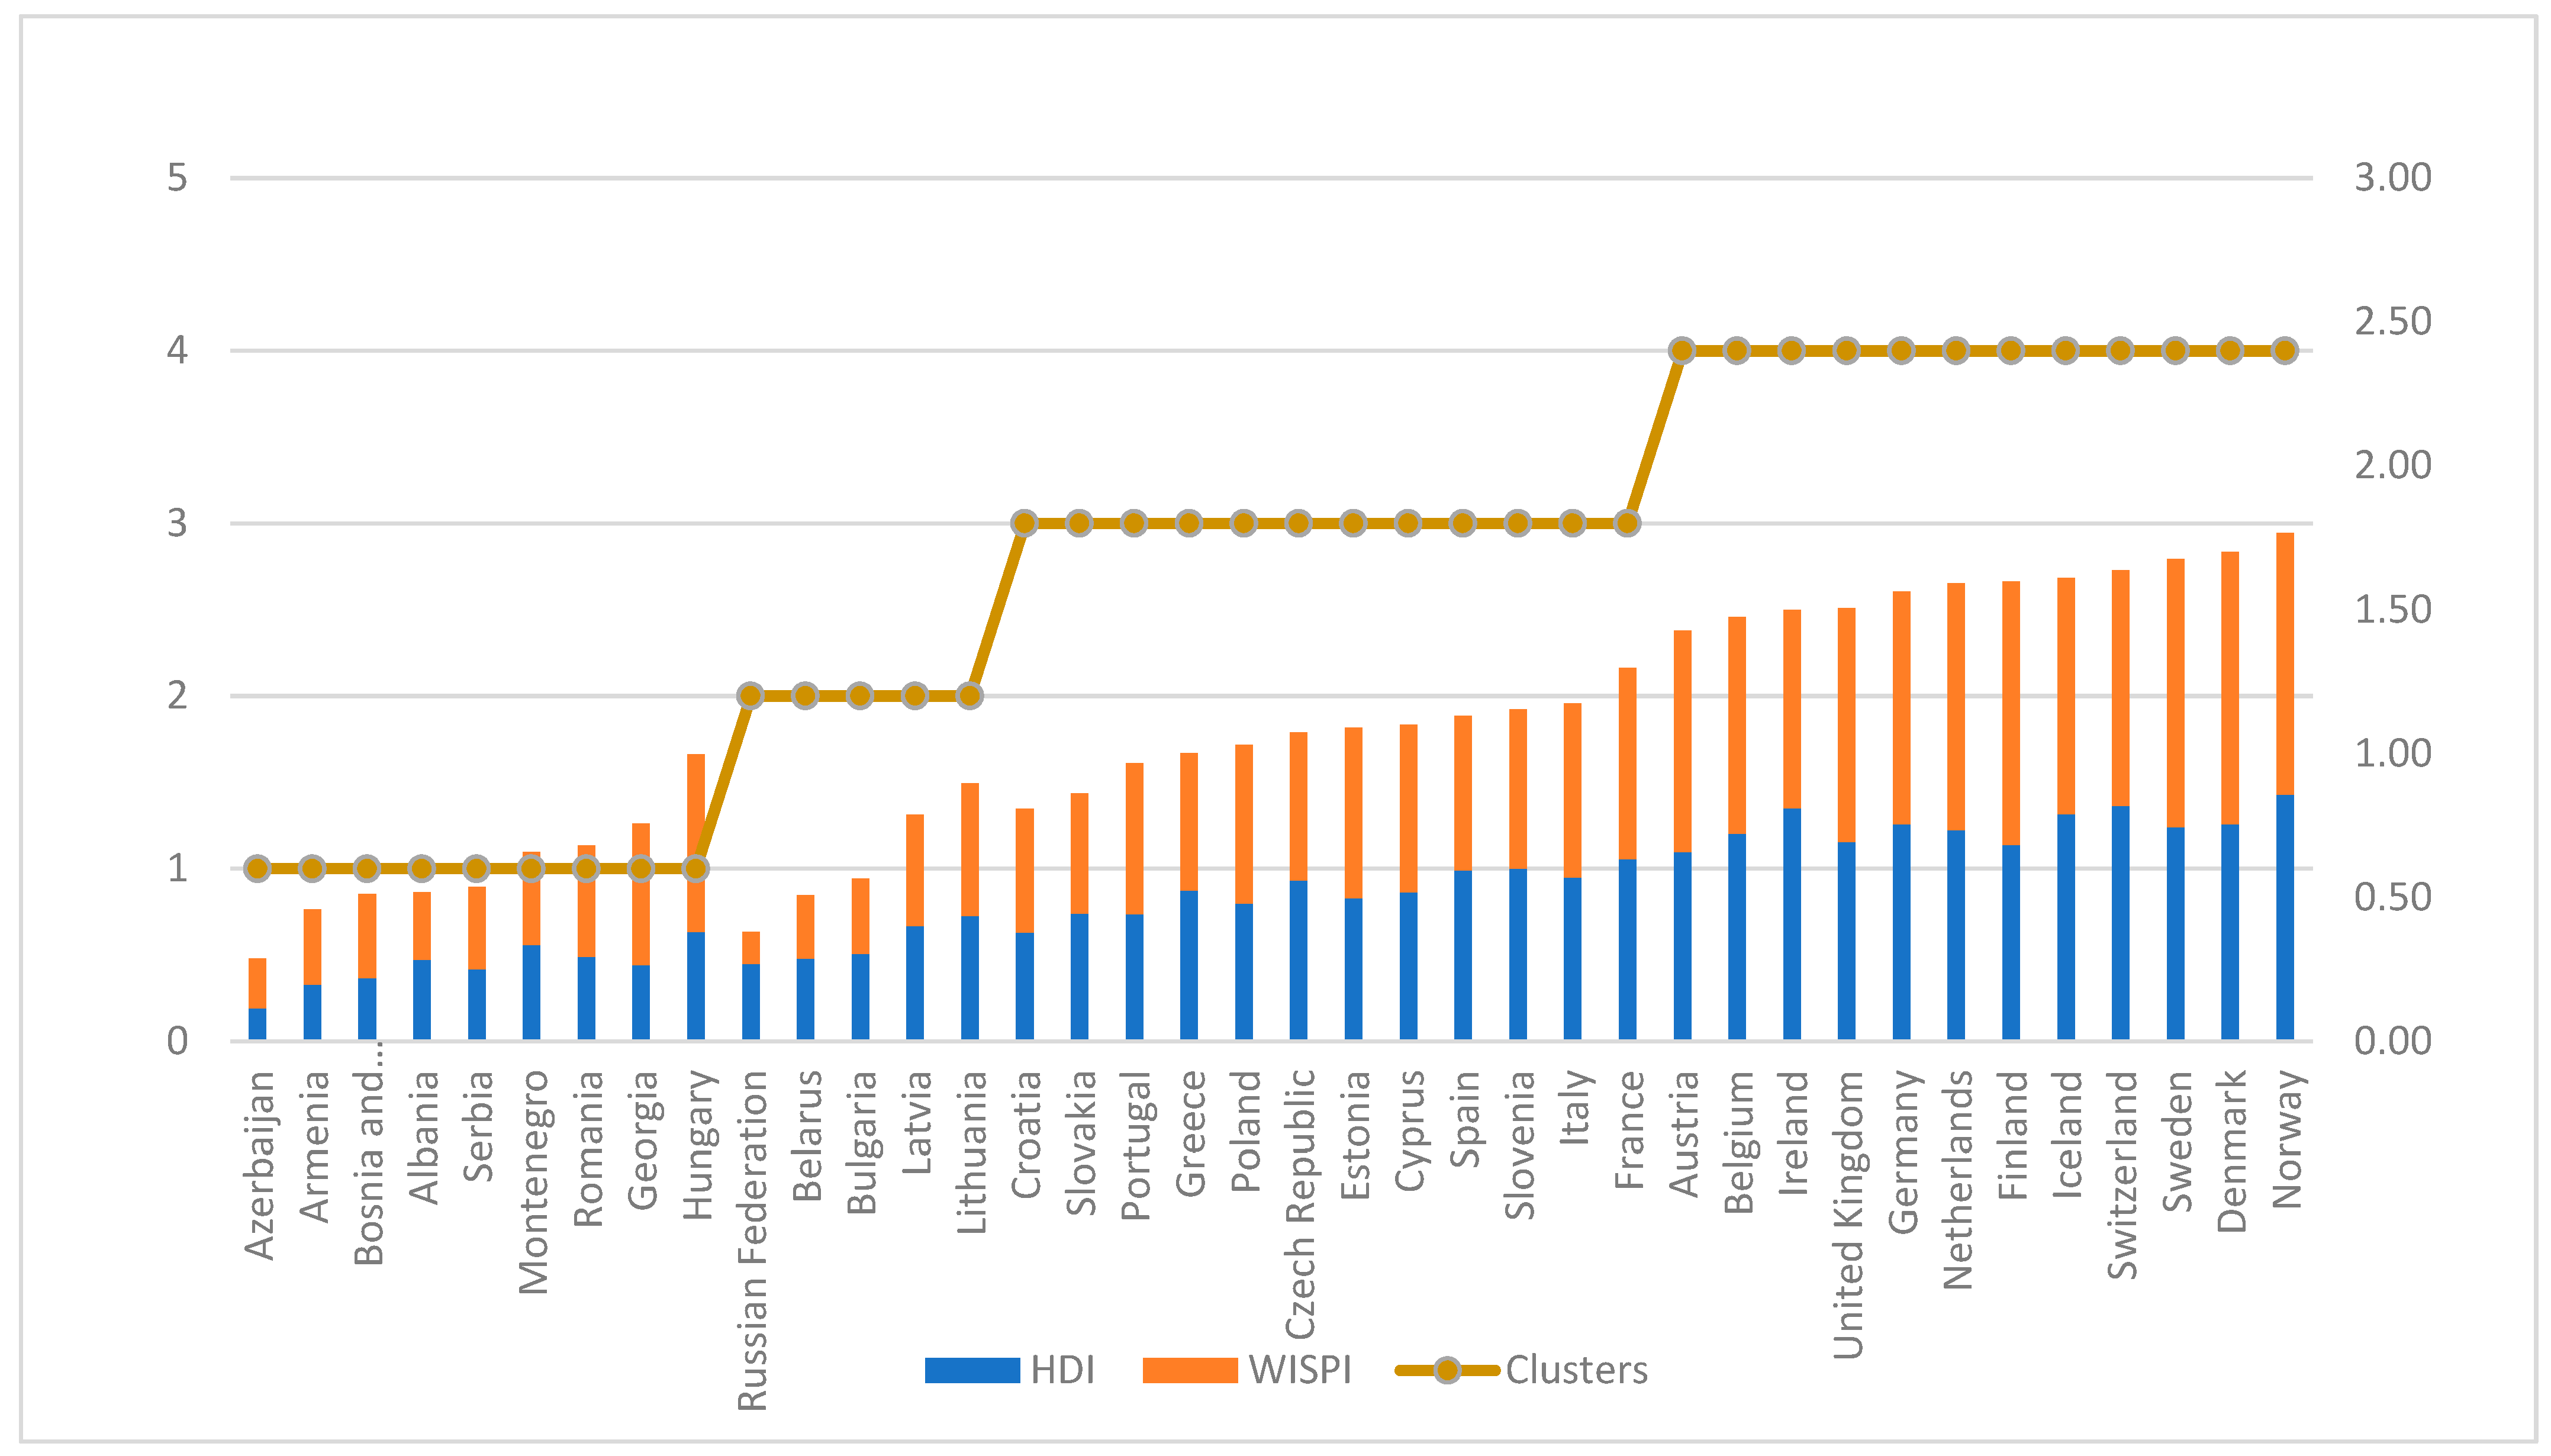
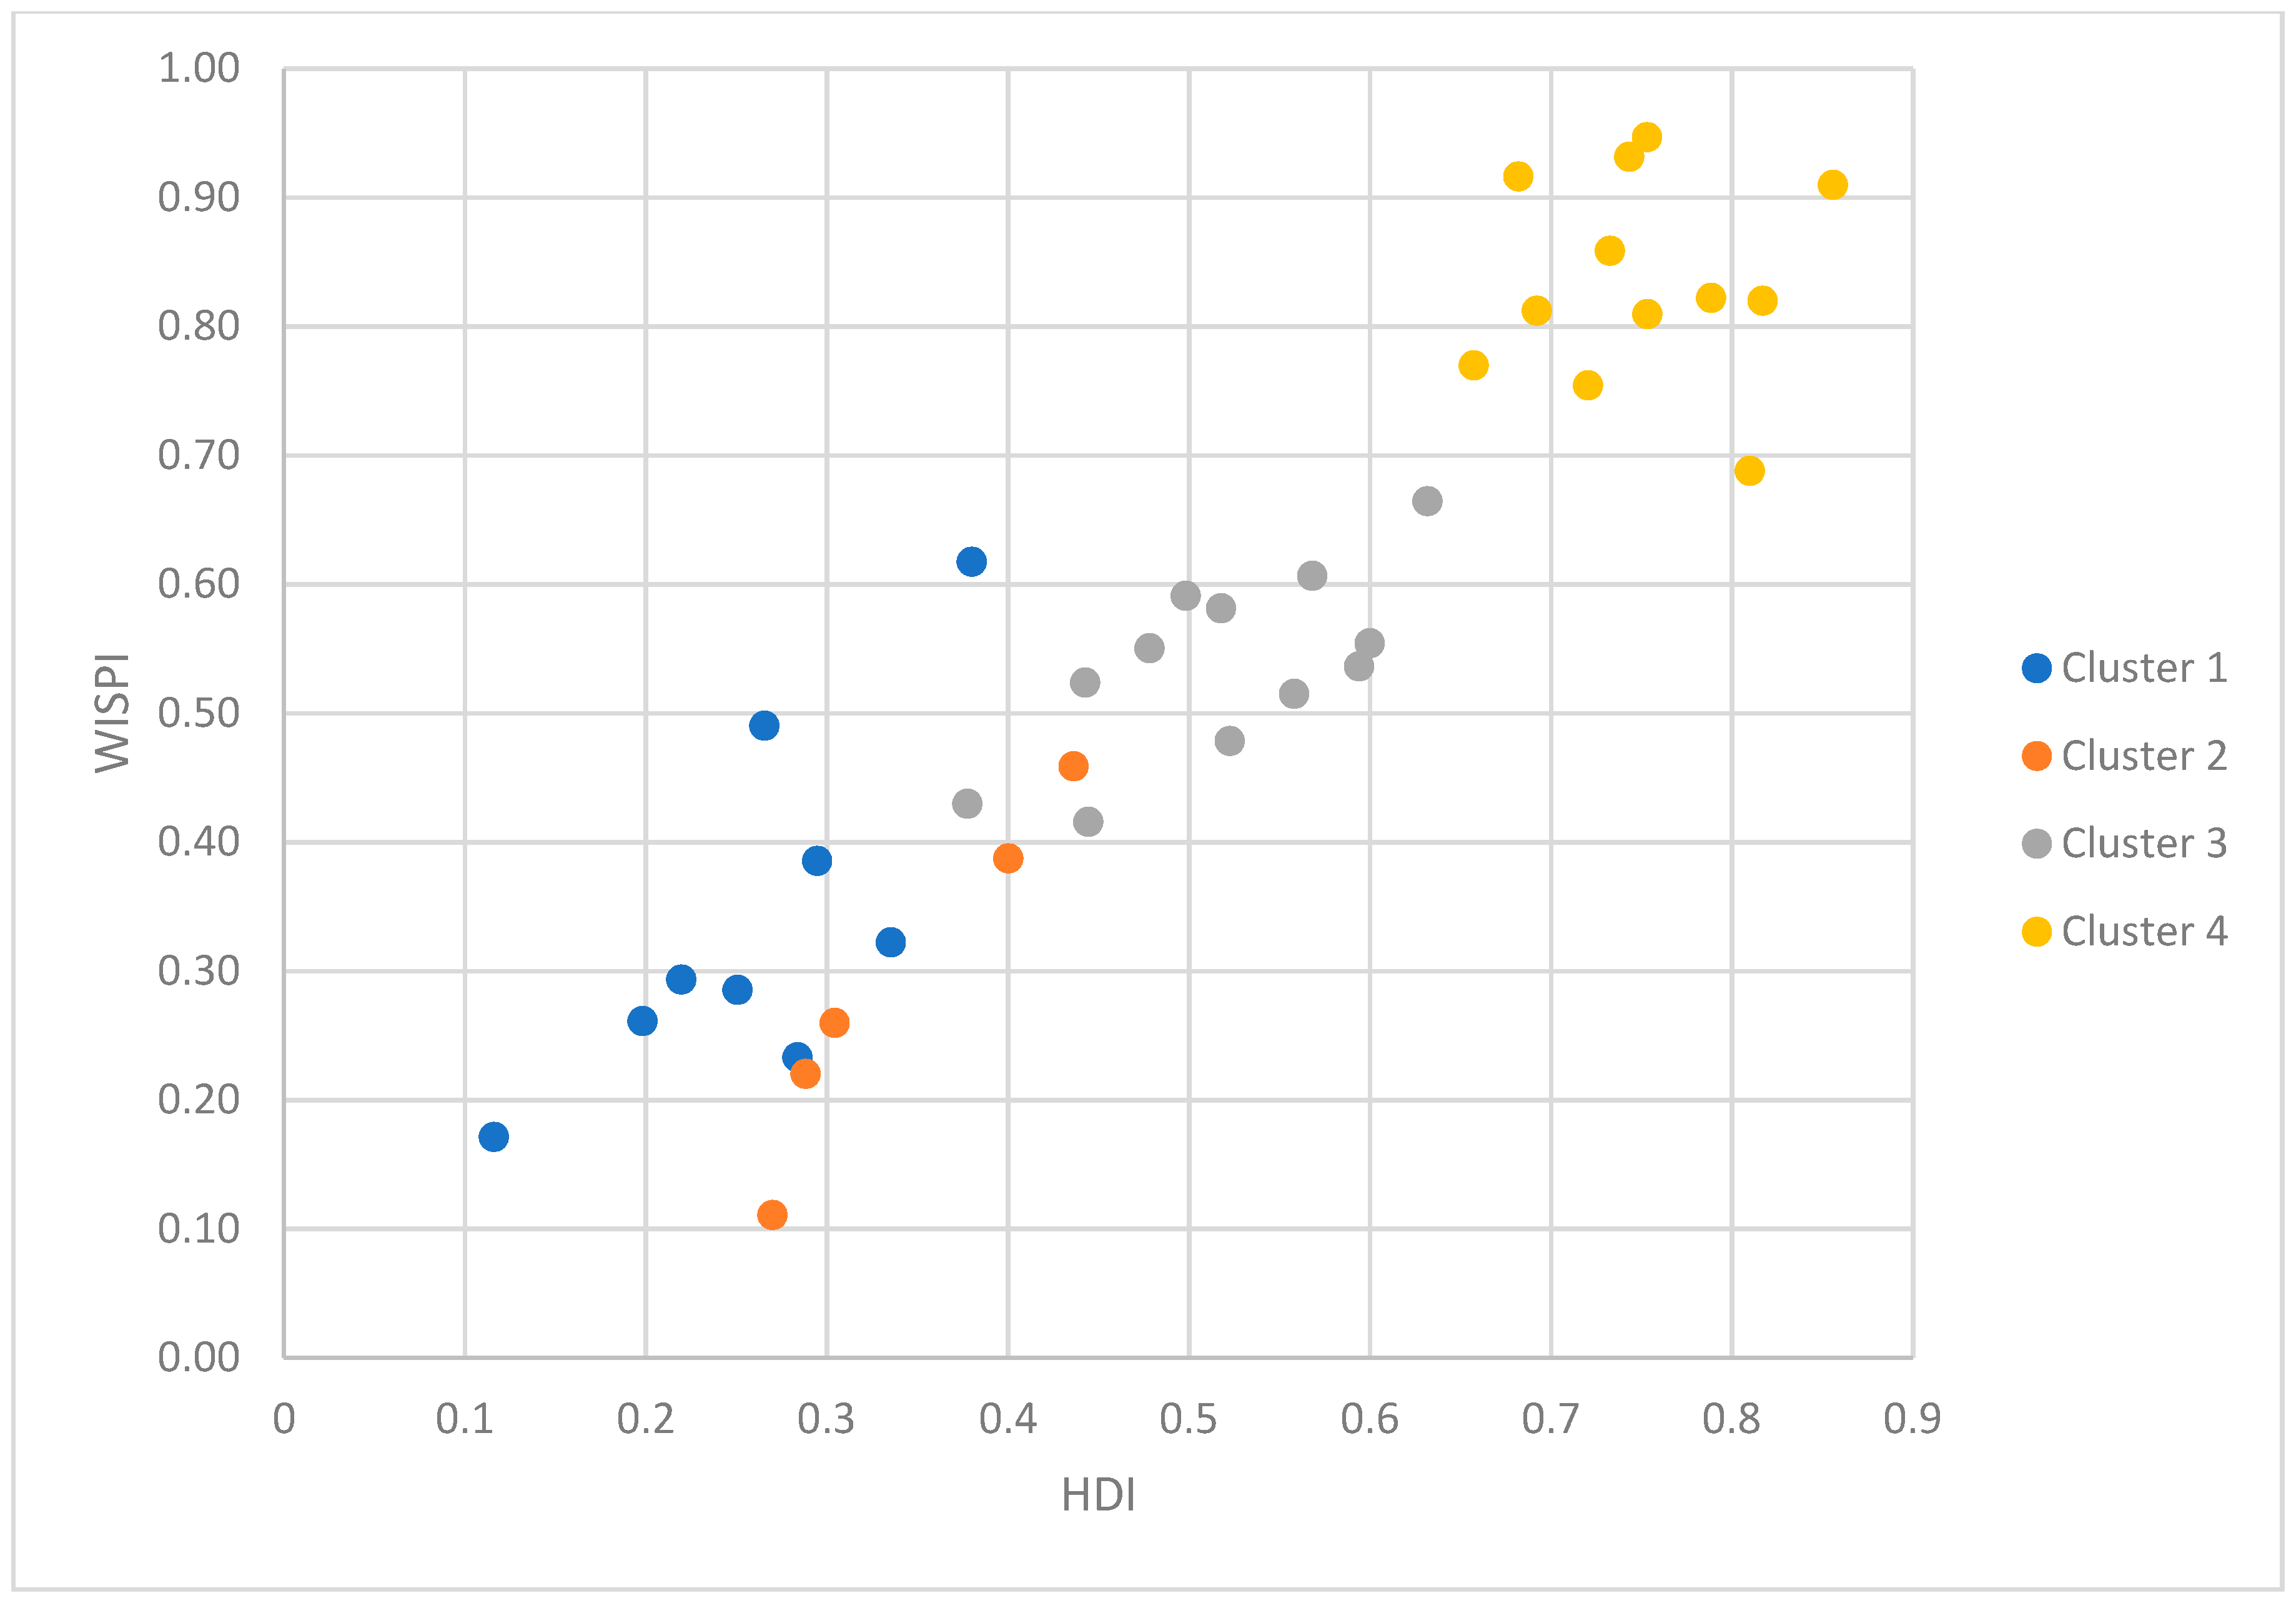
| Country (Alternative) | WEBIRA Rank (HDI + WISPI) | HDI Rank | WISPI Rank | HDI Minus WISPI | k-Means | |||
|---|---|---|---|---|---|---|---|---|
| Norway | 1.7655 | 0.8560 | 0.9095 | 1 | 1 | 4 | −3 | 4 |
| Denmark | 1.6999 | 0.7532 | 0.9467 | 2 | 6 | 1 | 5 | 4 |
| Sweden | 1.675 | 0.7435 | 0.9315 | 3 | 7 | 2 | 5 | 4 |
| Switzerland | 1.6368 | 0.8171 | 0.8197 | 4 | 2 | 7 | −5 | 4 |
| Iceland | 1.6107 | 0.7887 | 0.8220 | 5 | 4 | 6 | −2 | 4 |
| Finland | 1.5984 | 0.6822 | 0.9162 | 6 | 11 | 3 | 8 | 4 |
| Netherlands | 1.5913 | 0.7327 | 0.8586 | 7 | 8 | 5 | 3 | 4 |
| Germany | 1.5629 | 0.7535 | 0.8094 | 8 | 5 | 9 | −4 | 4 |
| United Kingdom | 1.5043 | 0.6923 | 0.8120 | 9 | 10 | 8 | 2 | 4 |
| Ireland | 1.4978 | 0.8101 | 0.6877 | 10 | 3 | 12 | −9 | 4 |
| Belgium | 1.4749 | 0.7207 | 0.7542 | 11 | 9 | 11 | −2 | 4 |
| Austria | 1.4272 | 0.6575 | 0.7697 | 12 | 12 | 10 | 2 | 4 |
| France | 1.2962 | 0.6320 | 0.6642 | 13 | 13 | 13 | 0 | 3 |
| Italy | 1.1746 | 0.5682 | 0.6064 | 14 | 16 | 15 | 1 | 3 |
| Slovenia | 1.154 | 0.6000 | 0.5540 | 15 | 14 | 18 | −4 | 3 |
| Spain | 1.1303 | 0.5941 | 0.5362 | 16 | 15 | 20 | −5 | 3 |
| Cyprus | 1.0991 | 0.5179 | 0.5812 | 17 | 19 | 17 | 2 | 3 |
| Estonia | 1.0891 | 0.4983 | 0.5908 | 18 | 20 | 16 | 4 | 3 |
| Czech Republic | 1.0731 | 0.5583 | 0.5148 | 19 | 17 | 22 | −5 | 3 |
| Poland | 1.0287 | 0.4784 | 0.5503 | 20 | 21 | 19 | 2 | 3 |
| Greece | 1.0009 | 0.5227 | 0.4782 | 21 | 18 | 24 | −6 | 3 |
| Hungary | 0.9974 | 0.3801 | 0.6173 | 22 | 26 | 14 | 12 | 1 |
| Portugal | 0.9664 | 0.4428 | 0.5236 | 23 | 23 | 21 | 2 | 3 |
| Lithuania | 0.895 | 0.4364 | 0.4586 | 24 | 24 | 25 | −1 | 2 |
| Slovakia | 0.8601 | 0.4445 | 0.4156 | 25 | 22 | 27 | −5 | 3 |
| Croatia | 0.8073 | 0.3778 | 0.4295 | 26 | 27 | 26 | 1 | 3 |
| Latvia | 0.7876 | 0.4004 | 0.3872 | 27 | 25 | 28 | −3 | 2 |
| Georgia | 0.7557 | 0.2656 | 0.4901 | 28 | 34 | 23 | 11 | 1 |
| Romania | 0.6799 | 0.2947 | 0.3852 | 29 | 30 | 29 | 1 | 1 |
| Montenegro | 0.6575 | 0.3354 | 0.3221 | 30 | 28 | 30 | −2 | 1 |
| Bulgaria | 0.564 | 0.3044 | 0.2596 | 31 | 29 | 34 | −5 | 2 |
| Serbia | 0.5361 | 0.2508 | 0.2853 | 32 | 35 | 32 | 3 | 1 |
| Albania | 0.5167 | 0.2838 | 0.2329 | 33 | 32 | 35 | −3 | 1 |
| Bosnia and Herzegovina | 0.5129 | 0.2197 | 0.2932 | 34 | 36 | 31 | 5 | 1 |
| Belarus | 0.5084 | 0.2883 | 0.2201 | 35 | 31 | 36 | −5 | 2 |
| Armenia | 0.4594 | 0.1983 | 0.2611 | 36 | 37 | 33 | 4 | 1 |
| Russian Federation | 0.3808 | 0.2701 | 0.1107 | 37 | 33 | 38 | −5 | 2 |
| Azerbaijan | 0.2874 | 0.1161 | 0.1713 | 38 | 38 | 37 | 1 | 1 |
© 2019 by the authors. Licensee MDPI, Basel, Switzerland. This article is an open access article distributed under the terms and conditions of the Creative Commons Attribution (CC BY) license (http://creativecommons.org/licenses/by/4.0/).
Share and Cite
Krylovas, A.; Dadelienė, R.; Kosareva, N.; Dadelo, S. Comparative Evaluation and Ranking of the European Countries Based on the Interdependence between Human Development and Internal Security Indicators. Mathematics 2019, 7, 293. https://doi.org/10.3390/math7030293
Krylovas A, Dadelienė R, Kosareva N, Dadelo S. Comparative Evaluation and Ranking of the European Countries Based on the Interdependence between Human Development and Internal Security Indicators. Mathematics. 2019; 7(3):293. https://doi.org/10.3390/math7030293
Chicago/Turabian StyleKrylovas, Aleksandras, Rūta Dadelienė, Natalja Kosareva, and Stanislav Dadelo. 2019. "Comparative Evaluation and Ranking of the European Countries Based on the Interdependence between Human Development and Internal Security Indicators" Mathematics 7, no. 3: 293. https://doi.org/10.3390/math7030293
APA StyleKrylovas, A., Dadelienė, R., Kosareva, N., & Dadelo, S. (2019). Comparative Evaluation and Ranking of the European Countries Based on the Interdependence between Human Development and Internal Security Indicators. Mathematics, 7(3), 293. https://doi.org/10.3390/math7030293