Article

Analysis of Dynamics in Multiphysics Modelling of Active Faults

1
School of Petroleum Engineering, University of New South Wales (UNSW), Sydney, NSW 2052, Australia
2
CSIRO Mineral Resources Flagship, North Ryde, NSW 2113, Australia
*
Author to whom correspondence should be addressed.
Mathematics 2016, 4(4), 57; https://doi.org/10.3390/math4040057
Submission received: 30 April 2016 / Revised: 9 September 2016 / Accepted: 14 September 2016 / Published: 22 September 2016
(This article belongs to the Special Issue Applied Mathematics and Mechanics)

Abstract

:
Instabilities in Geomechanics appear on multiple scales involving multiple physical processes. They appear often as planar features of localised deformation (faults), which can be relatively stable creep or display rich dynamics, sometimes culminating in earthquakes. To study those features, we propose a fundamental physics-based approach that overcomes the current limitations of statistical rule-based methods and allows a physical understanding of the nucleation and temporal evolution of such faults. In particular, we formulate the coupling between temperature and pressure evolution in the faults through their multiphysics energetic process(es). We analyse their multiple steady states using numerical continuation methods and characterise their transient dynamics by studying the time-dependent problem near the critical Hopf points. We find that the global system can be characterised by a homoclinic bifurcation that depends on the two main dimensionless groups of the underlying physical system. The Gruntfest number determines the onset of the localisation phenomenon, while the dynamics are mainly controlled by the Lewis number, which is the ratio of energy diffusion over mass diffusion. Here, we show that the Lewis number is the critical parameter for dynamics of the system as it controls the time evolution of the system for a given energy supply (Gruntfest number).

1. Introduction

Understanding instabilities in the earth is important for disaster management, risk assessment and insurance. The analysis of large earthquakes that generate on sometimes hundreds of kilometre-long faults has been, thus far, approached from a statistical and empirical angle. The reasons for using this approach are that the dynamics related to earthquake and fault motion are likely stochastic rather than deterministic in nature [1,2,3], thus making approaches that aim at physics-based forecasting of deterministic dynamics just part of the whole story. Unpredictability is an inherent part of such systems. One angle of approach to mathematically predict the observed rich dynamics is to perform laboratory experiments and characterize their behaviour with simple geomechanical parametrization (e.g., rate and state variable friction) and then apply these laboratory laws to the large field length- and time-scales [4,5,6]. Another approach is to record the rich dynamics via geophysical methods and formulate mathematical rule-based models that reproduce their dynamics [7]. Both approaches have thus far failed to deliver predictive tools.
In this work, we study the dynamics of a highly non-linear system of reaction-diffusion partial differential equations, which was shown to adequately approximate the physical processes occurring in seismogenic thrust faults [8,9,10]. The system of equations describes the evolution of temperature and excess pore fluid pressure in a fault prone to chemical reactions under mechanical loading. The system has multiple manifolds in time and space, being able to describe transition from pervasive creep in long time- and length- scales to localised slip in time and space.
We propose that the steady state response and the dynamic evolution of the system are determined by two bifurcation parameters. The onset of the localisation phenomenon can be characterised by an energy input parameter, the Gruntfest number, which is the ratio of energy supply to the system divided by the energy stored in the system. The dynamics of the system can be described by the Lewis number, i.e., the ratio of mass diffusion over energy diffusion. In the following, we detail the outcomes of the numerical bifurcation analysis of the aforementioned system.

2. Materials and Methods

2.1. Problem Formulation—Previous Work

In the present work, we follow a Continuum Mechanics approach that was previously presented in [8,11] for modelling a fault in creeping flow conditions, including multiphysics processes explained below. Therefore, we assume that all the deformation occurs in an infinite shear zone of thickness d (Figure 1). By adopting isochoric deformation, the stress equilibrium equation is satisfied and the remaining equations to be solved are the pore-pressure and temperature diffusion (see also [12]). They are derived from the mass balance and the energy balance laws:
β m Δ p t = k π μ f 2 Δ p z 2 + 1 ρ f 1 ρ s j , ρ C p m T t = κ 2 T z 2 + χ σ i j ϵ ˙ i j Δ H r ,
where Δ p is the excess pore-pressure, k π is the permeability of the material, μ f is the fluid viscosity, ρ s , ρ f and ρ m are the densities of the solid and fluid phases, and that of the mixture in the zone respectively, j is the mass production rate due to possible chemical reactions taking place, T is the temperature, κ is the thermal conductivity, C p the specific heat capacity, χ the proportion of the mechanical work dissipated into heat, the so-called Taylor-Quinney coefficient, σ denotes the stress, ϵ ˙ the strain rate, Δ H is the enthalpy of the chemical reactions and r the reaction rate.
Note that the effects of thermal pressurisation as well as that of the convective terms are neglected following the analysis in [8]. Here, we extend our previous consideration and adopt the visco-plastic flow law of [13,14] for the material, where the effect of high pore-pressure and temperature is taken into account:
ϵ ˙ d = ϵ ˙ 0 e a Δ p + E m e c h R T τ ¯ * m ,
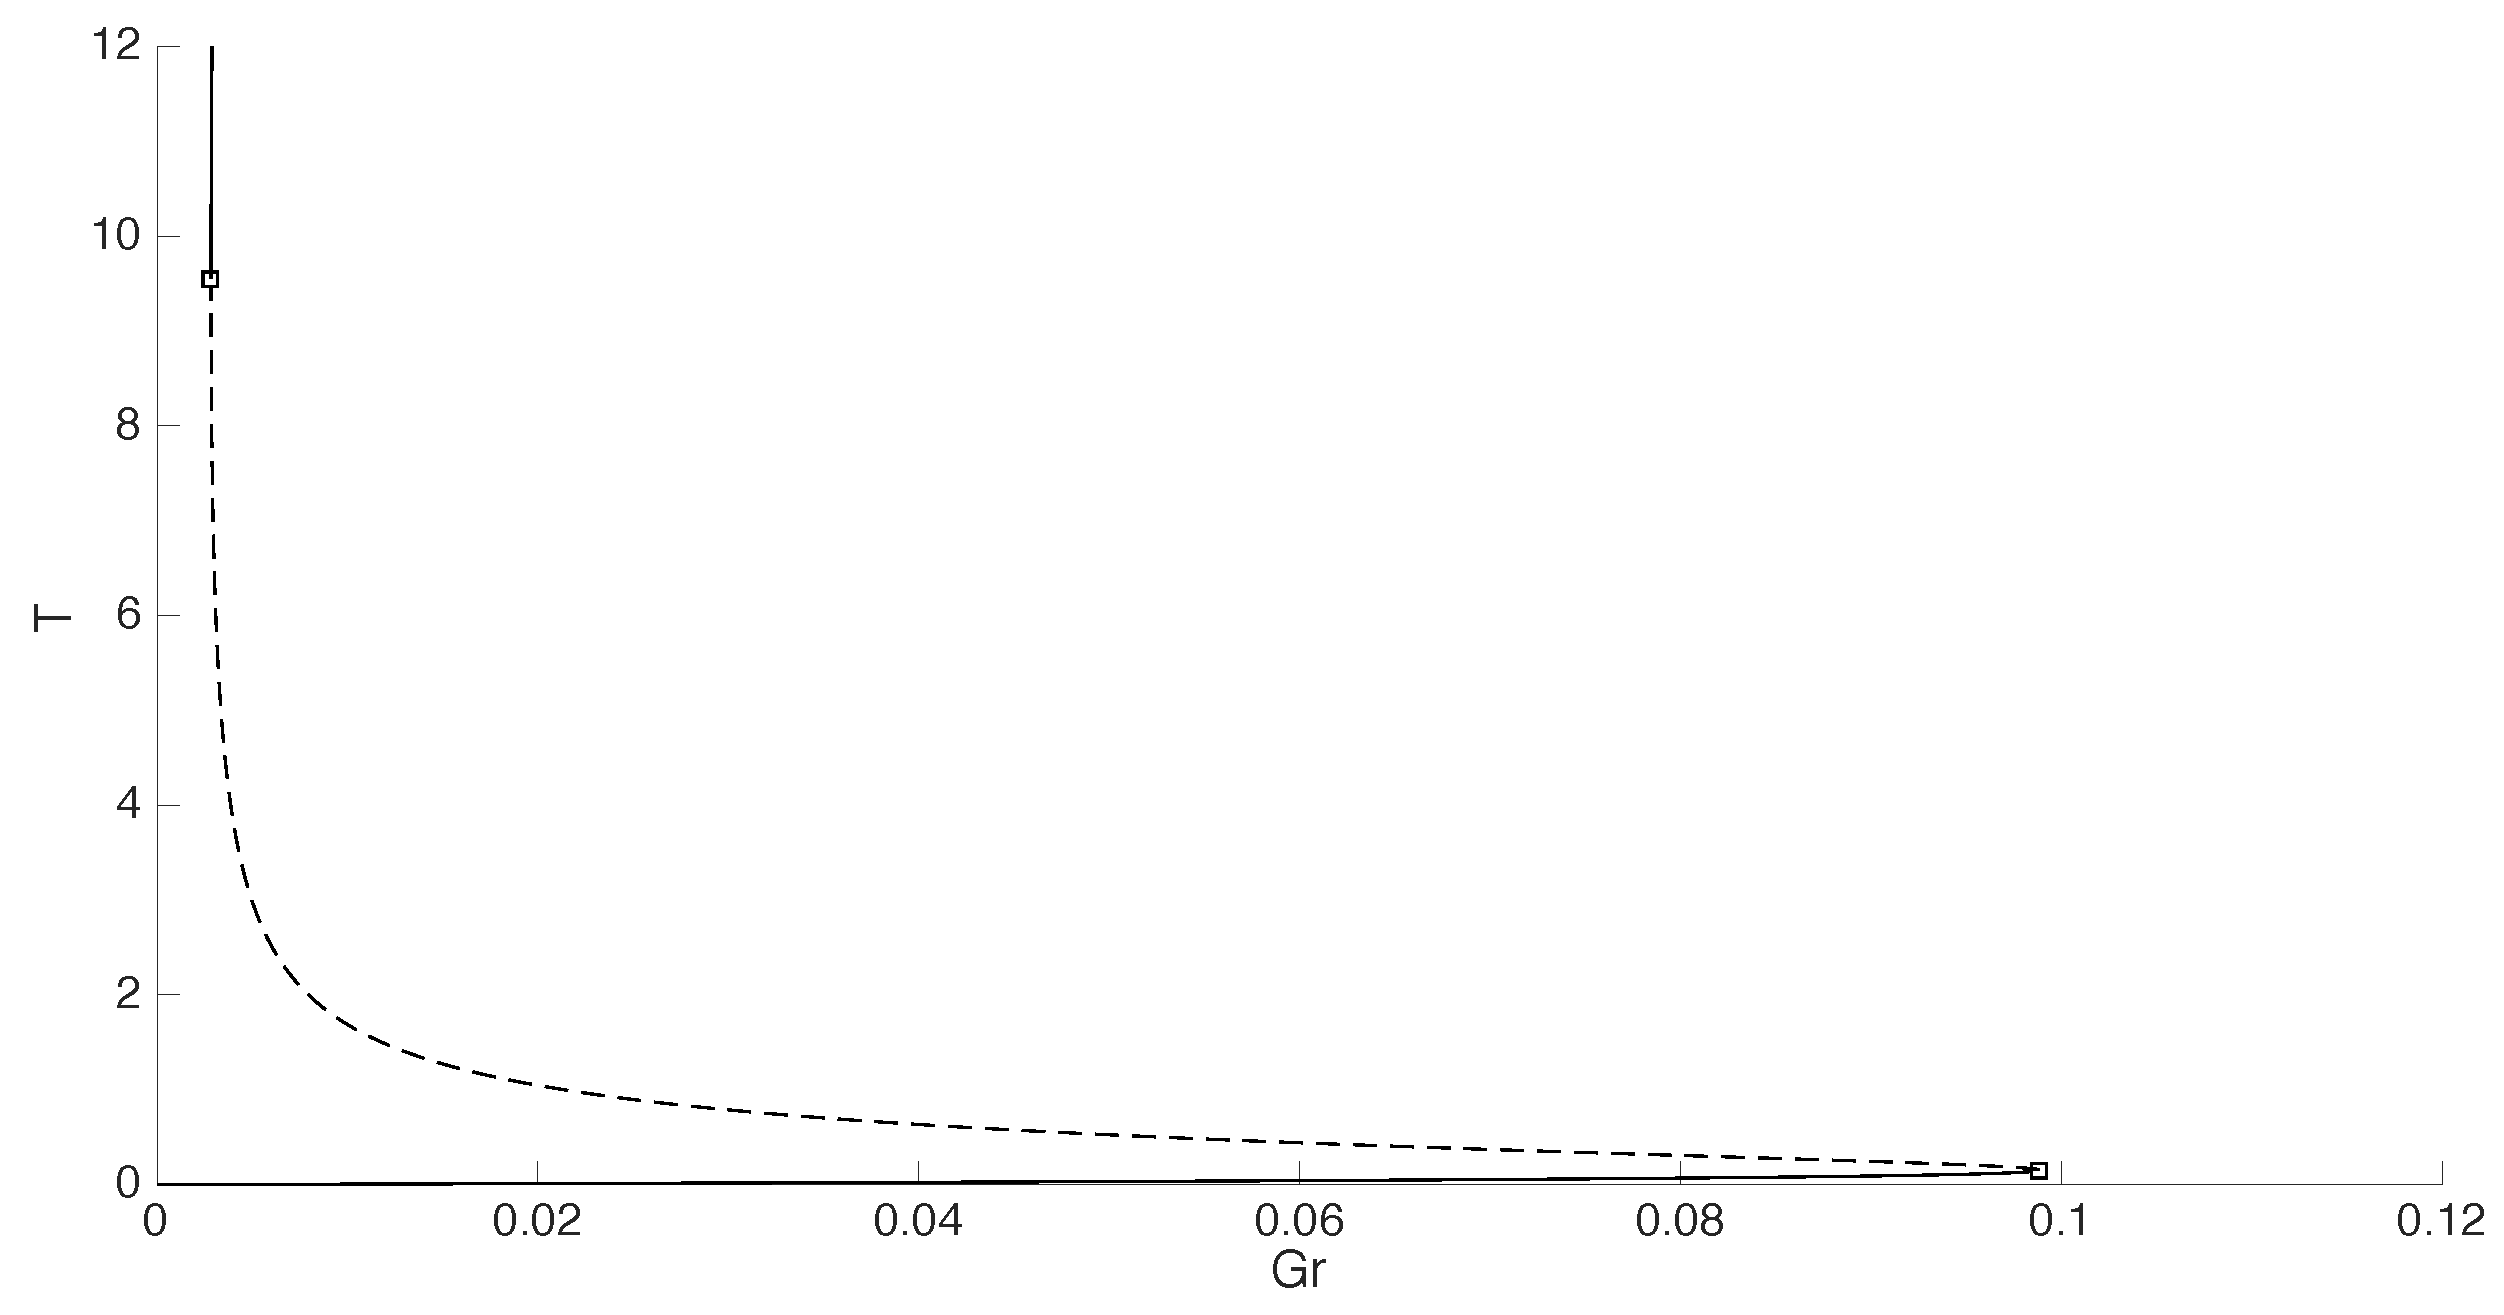
where ϵ ˙ d is the deviatoric part of the stain rate, Δ p is the excess pore-pressure, T is the temperature, τ ¯ * is the normalised shear component of overstress, R is the universal gas constant, E m e c h is the activation energy for the thermal softening of the material, and ϵ ˙ 0 , a, and m are material constants. The notation τ ¯ * m refers to the MacKauley brackets typically used in plasticity modelling. The behaviour of this law is equivalent to the Arrhenius-type rate and state law presented in [11]. By only considering the effect of shear heating in the material behaviour χ > 0 , there is a material instability at a critical amount of shear heating χ σ i j ϵ ˙ i j , where a stable creep branch can turn into a thermal runaway. This instability is very well known from combustion physics and is well documented in [15] and attributed to Frank Kamenetsky. Since we introduce an Arrhenius dependency on temperature, our solutions have a stable upper branch after a blow-up instability [16] . It was found that inclusion of Arrhenius temperature-dependency alone is not enough to stabilize the system for real-case scenarios, as the upper branch stabilizes at a prohibitively high temperature; hence, an arbitrary temperature cutoff was introduced to stabilize the numerical solutions [17]. The explicit inclusion of a phase change mechanism, like melting of the material or an endothermic chemical reaction, [11] solves this problem, as the cutoff is effectively achieved by an energy sink. In this contribution, we use the essential form of this instability mechanism by extending it to include chemical reactions. As in the simple shear heating case, the steady state response reveals three branches: a low stable, an intermediate unstable and an upper stable one. Ref. [11] explains that the higher branch provides a temperature threshold that is high enough to trigger possible energy-consuming internal processes, like endothermic chemical reactions (Figure 2).
Thus, we allow the material in the fault to undergo a reversible reaction of the type:
A B s A s + B f .
The above expression is an upscaled version of a series of endothermic reactions that can take place in the shear zone and result in transforming the original solid material A B s into a new product A s , while releasing excess fluid (in principle liquid phase) B f . More details can be found in [18]. We use a continuum representation of a porous solid medium, inside which the fluid-release chemical reaction contributes to or creates an internal volume fraction occupied by the fluid. In a fully saturated medium, this is identical to the porosity ϕ. During the endothermic (forward) branch of the chemical reactions, new pore space is created, while, in the exothermic branch (reverse reaction), the original pore space can be recovered. This internal mass conservation process can be quantified by the solid products defining a partial solid ratio s = V A / [ ( 1 ϕ ) V ] . The chemical reaction introduces a mass production rate term in the mass balance law:
j = ρ A B ( 1 ϕ ) ( 1 s ) k F e E c R T ,
where ρ A B the density of the reactants, k F is the pre-exponential factor of the Arrhenius law for the reaction and E c the activation energy of the reaction. Following the derivations of [8], we normalise the Equation (1) using the dimensionless variables:
t = c t h ( d / 2 ) 2 t , z = z d / 2 , T = T T r e f T r e f , Δ p = β m Δ p ,
where c t h = κ / ρ C p m is the thermal diffusivity of the material. We end up with the dimensionless system of equations (asterisks dropped for convenience):
Δ p t = 1 L e 2 Δ p z 2 + ( 1 ϕ ) ( 1 s ) μ r e A r c T 1 + T , T t = 2 T z 2 + G r e α Δ p + A r m T 1 + T D a ( 1 ϕ ) ( 1 s ) e A r c T 1 + T .
The dimensionless groups appearing in the system of Equation (6) are defined as
L e = c t h c h y = μ f β m c t h k π , μ r = ρ A B k F ( d / 2 ) 2 c t h β m 1 ρ f 1 ρ s e A r c , G r = χ τ n ϵ ˙ 0 κ T r e f d 2 2 e A r m , D a = k F | Δ H | ρ A B κ T r e f d 2 2 e A r c , A r c = E c R T r e f , A r m = E m R T r e f , α = a β m .
In this study, we use typical values for the parameter groups, listed in Table 1.
Finally, we form the corresponding boundary value problem, which consists of the Equation (6) and Dirichlet boundary conditions for the excess pore pressure and temperature, Δ p | z = ± 1 = 0 and T | z = ± 1 = T b . We find that, as in the classical shear heating, only case this boundary value problem presents multiple steady states. We also note that the inclusion of chemistry enriches the dynamics of the system, it being very sensitive to the chemical reaction chosen. A particular case study was already discussed in [9], and here we extend the analysis to a systematic parameter study of the Lewis number. The main numerical solution techniques used for the analysis of such a system are discussed in the following.

2.2. Method

We solve the system of Equation (6) using the Spectral Elements Method (e.g., [19]), which is ideally suited to solve problems that are smooth enough, as a spectral formulation gives the fastest convergence rate [20]. We used a Matlab (R2016b, The MathWorks Inc., Natick, MA, USA) implementation with a numerical tolerance of 10−10 for steady-state and 10−8 for transient solutions. For the steady-state solution, we augmented the system of equations with the pseudo-arclength continuation equation of [21], whereas for the transient resolution, we use the built-in ode23Smathvariantnormal solver of Matlab. The results from these methods are identical to the ones presented in [8,9], and we calibrated the required mesh size through a sensitivity analysis shown in Figure 3, opting for 30 mesh points to balance numerical accuracy and computational cost.

3. Results

3.1. Gruntfest and Damköhler Numbers

The behaviour of the system is evidently characterised by the set of dimensionless parameters appearing in Equation (6). In our previous works, [8,9,10], we have highlighted the importance of the ratio of the Grunfest number, G r , over the Damköhler number, D a .
Both dimensionless groups express the characteristic time scale of the material’s internal processes over the one of energy transfer, i.e., heat conduction. The Gruntfest number [22] characterises the heat production due to shear heating, whereas the Damköhler number characterises the heat absorption due to the chemical reaction. As thoroughly discussed in [8], the Damköhler number is corresponding to the endothermic reaction with the lowest activation enthalpy that can be triggered for the material inside the shear zone and it is expected to be constant should that be given. On the contrary, the uncertainty on the magnitude of the Taylor-Quinney coefficient, along with the dependence of the Gruntfest number on the shear stress at the boundary, and, therefore, the depth where the fault is located, leads us to adopt G r as the main bifurcation parameter of the system. A systematic analysis of the effect of the Damköhler number on instabilities is well-documented in combustion physics, e.g., [15]. A particular analysis for the problem discussed here will be the subject of future studies.
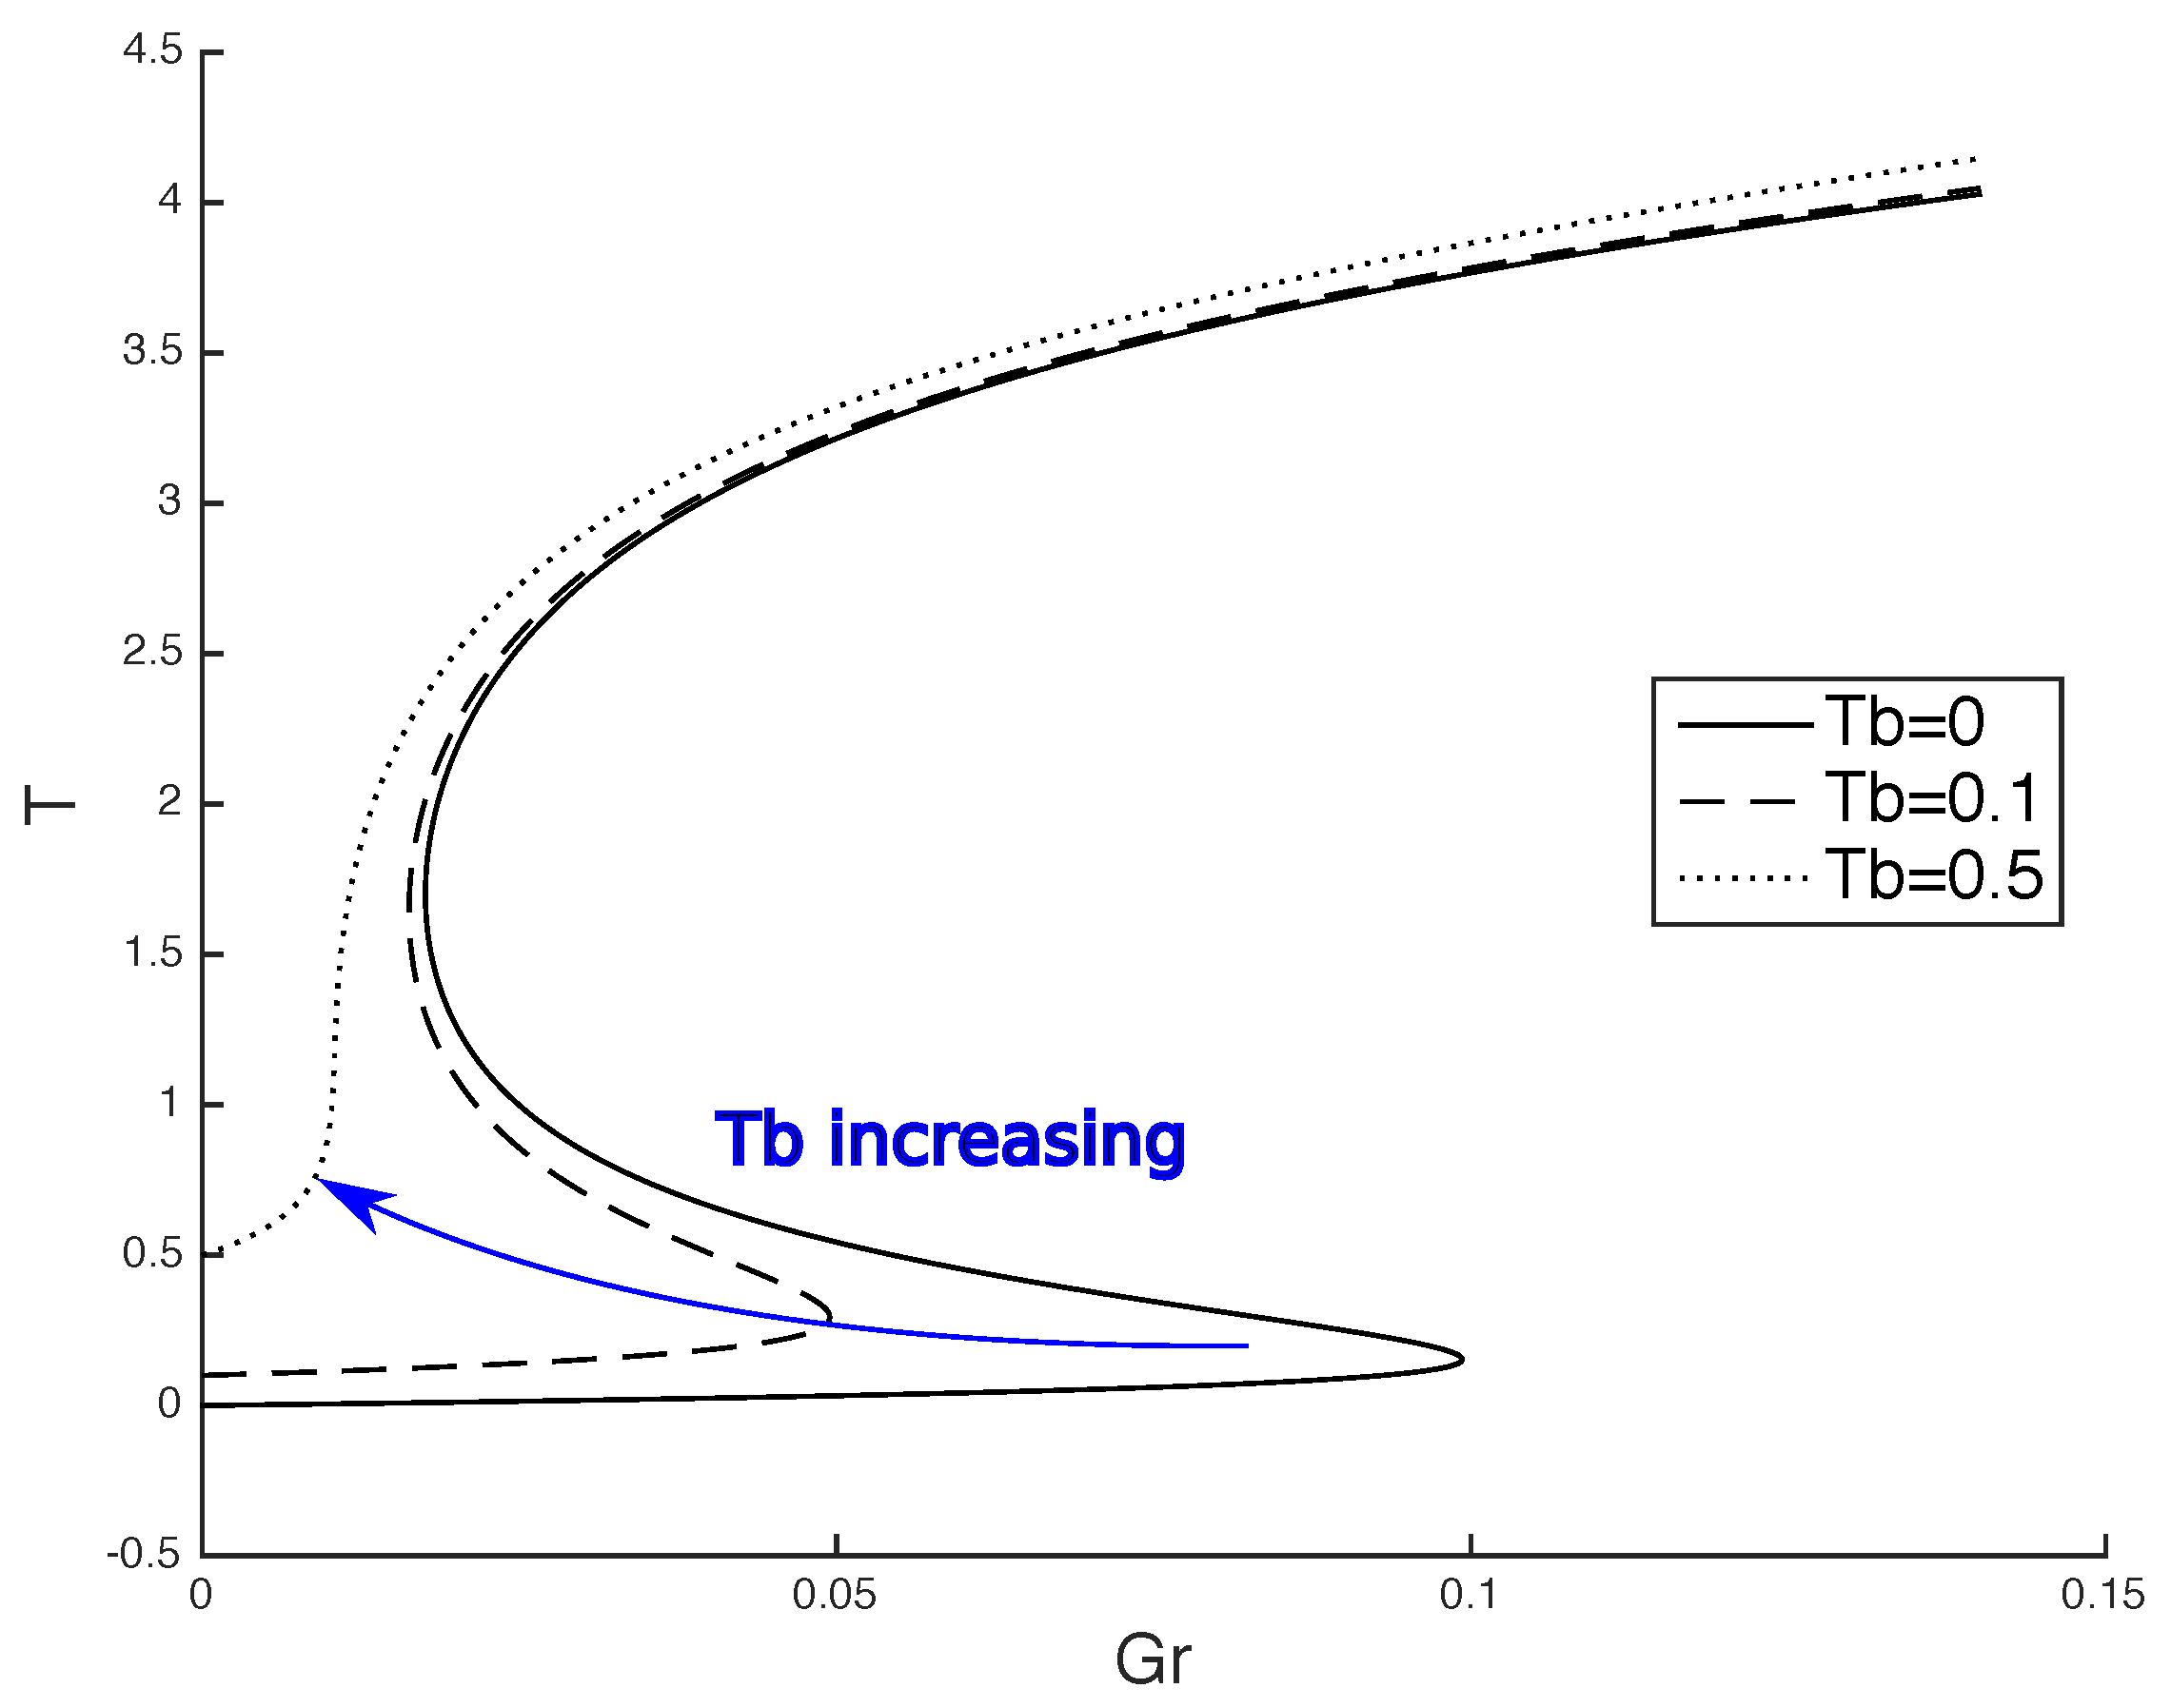
The numerical continuation analysis reveals that the bifurcation diagram of the steady state solutions with respect to the Gruntfest number is an S-type of curve (hereinafter called S-curve) like the one presented in Figure 4. This means that there exist two saddle points after which the curve folds back on itself. Thus, we identify three solution branches: a lower stable, a middle unstable and a higher one. The latter is of variable stability based on the magnitude of the other parameters, presenting areas of stable state or periodic solutions. The characterisation of the stability was based on the eigenvalues of the discretised problem, which was verified also by studying the results of the transient response of the system for various initial conditions. The equilibrium and the dynamics of this branch will be thoroughly discussed in the following subsections. Before that, though, we should comment on the physical meaning of these branches. For that, the limits of the Gruntfest number can shed some light.
Given a Damköhler number, one can visualise the lower and the upper branch of the S-curve as energy states of the system. Indeed, up to the first saddle point of the curve which has a Grunfest number G r S , l o w , the excess pore pressure build-up is minimal and the system is in a regime of steady creep. The relatively low temperatures signify that the heat conduction mechanism is “fast” enough to counterbalance the heat production due to shearing. As highlighted in [8], this lower branch is also governed by the boundary temperature, T b and the ratio A r m / A r c of the Arrhenius numbers of the two energetic mechanisms. Above a certain threshold, defined by both parameters, the two saddle points collapse and vanish. This leads to a stretched S-curve for the steady state solutions (Figure 4). Further analysis of the effect of these two parameters is beyond the scope of the present manuscript, and the reader should refer to aforementioned work for more information.
At the other extreme, when G r , the heat produced due to friction is significantly larger than the heat that the system can transfer across the shear zone, meaning that there is enough energy for the reaction to set in. At this limit of high Gruntfest numbers, the system is governed by the chemical reaction.
Important phenomena from a dynamics perspective occur for values of the Gruntfest number near the G r S , l o w . It is an area where both the steady creep and the reaction regime can co-exist. In [9], it was shown that, in the case of a fault located at depth of a few tens of kilometres where the dominant reaction is calcite decomposition, the system provides oscillations for G r > G r S , l o w and up to a higher value G r H , indicating the existence of a Hopf point at this value. Furthermore, it was shown that the lowest saddle point constitutes a homoclinic point.
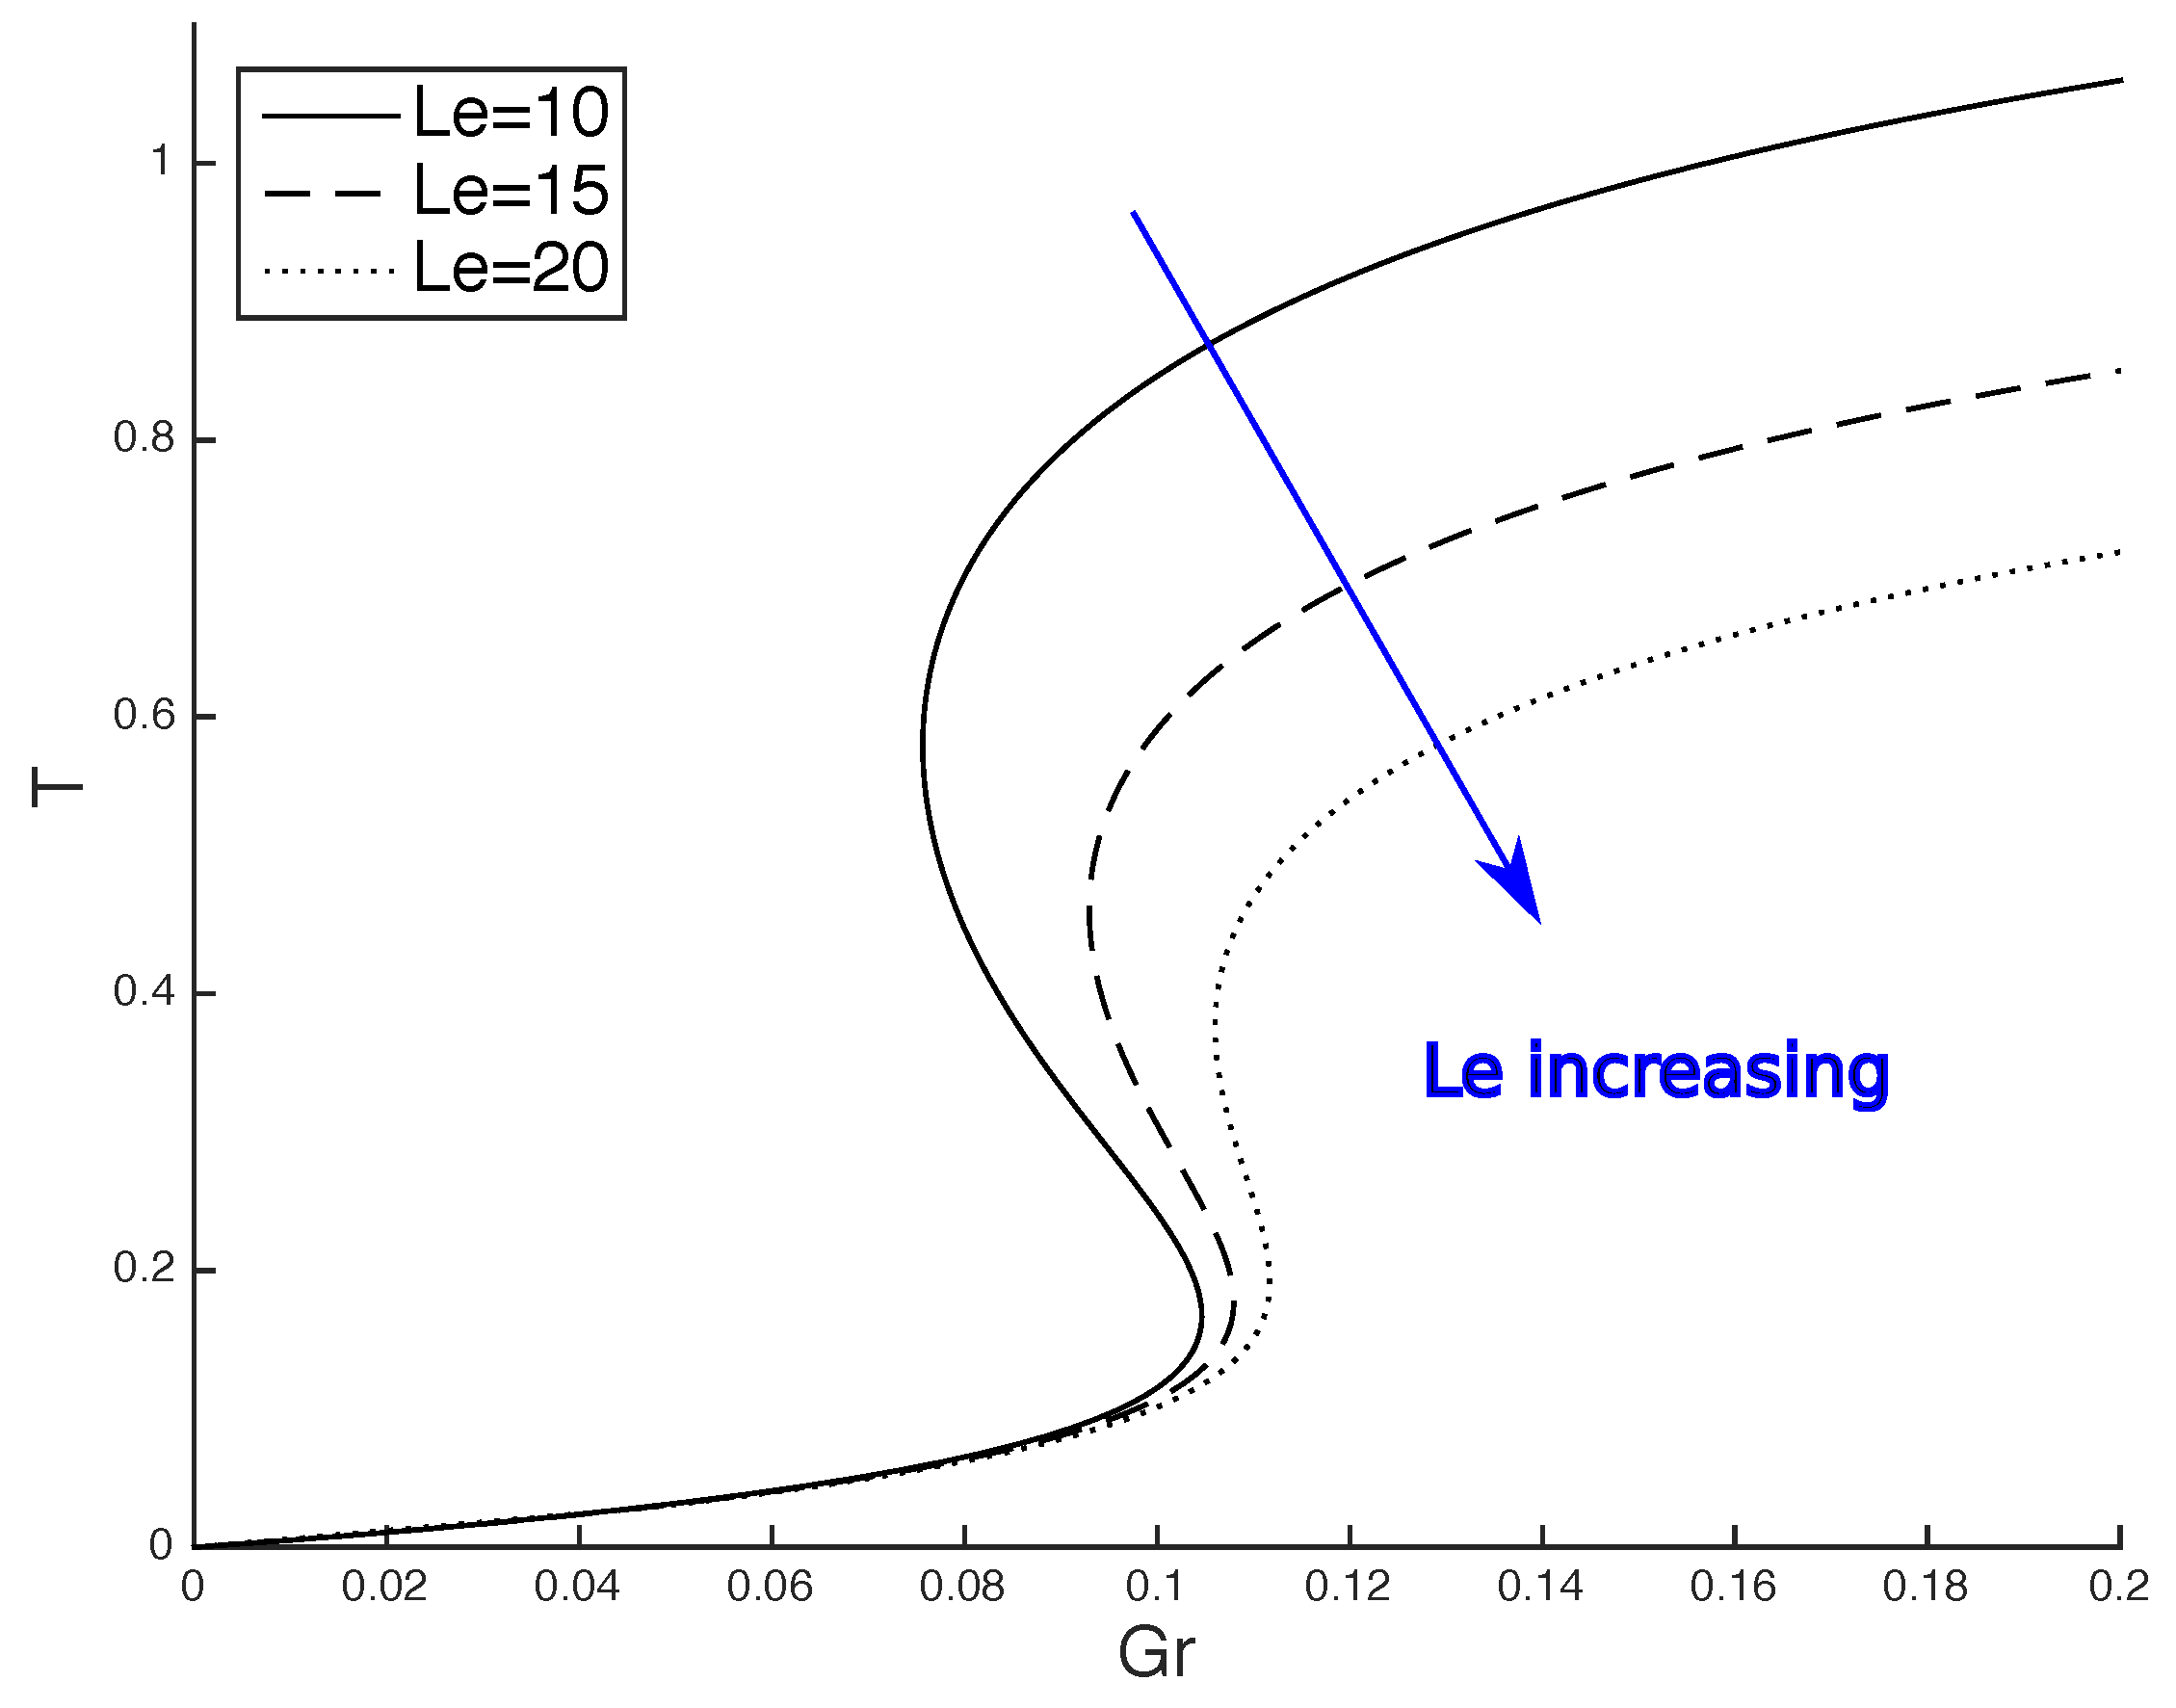
In general, the behaviour of the system on the upper branch or in its vicinity is determined by the Lewis number, L e (see Figure 5). Indeed, for L e = 0 , there is no pore-pressure build-up and the result is an upper branch of high temperatures. All eigenvalues in that case are real, so no periodic solutions are expected. Upon increasing the Lewis number, the temperatures at which the upper branch is admissible become lower again up to the point where the S-curve becomes stretched (Figure 5). For all these reasons, a thorough study of the effect of L e on the steady state and dynamic response of the system of Equation (6) is required.

3.2. Lewis Number

The Lewis number, L e , expresses the ability of the system to diffuse heat over the ability of the system to diffuse mass. At the limit L e 0 , the hydraulic diffusivity of the shear zone, c h y , is very high compared to the heat diffusivity, hence the aforementioned inability of the system to increase excess pore-pressure. Indeed, the excess pore-pressure diffusion equation will be simplified to a Laplace equation, and, due to the boundary conditions used, it will be Δ p = 0 . We can therefore say that this is the isobaric limit, and the effect of the chemical reaction is equivalent to the one of a dry phase transition. As previously mentioned, the upper branch in this case is stable and the eigenvalues are real. At the other extreme, L e + , heat diffusion is dominant and the temperature increase is small. Therefore, this corresponds to the undrained limit. Even though there exists only one solution branch, similarly to the previous case, it is stable and the eigenvalues are real.
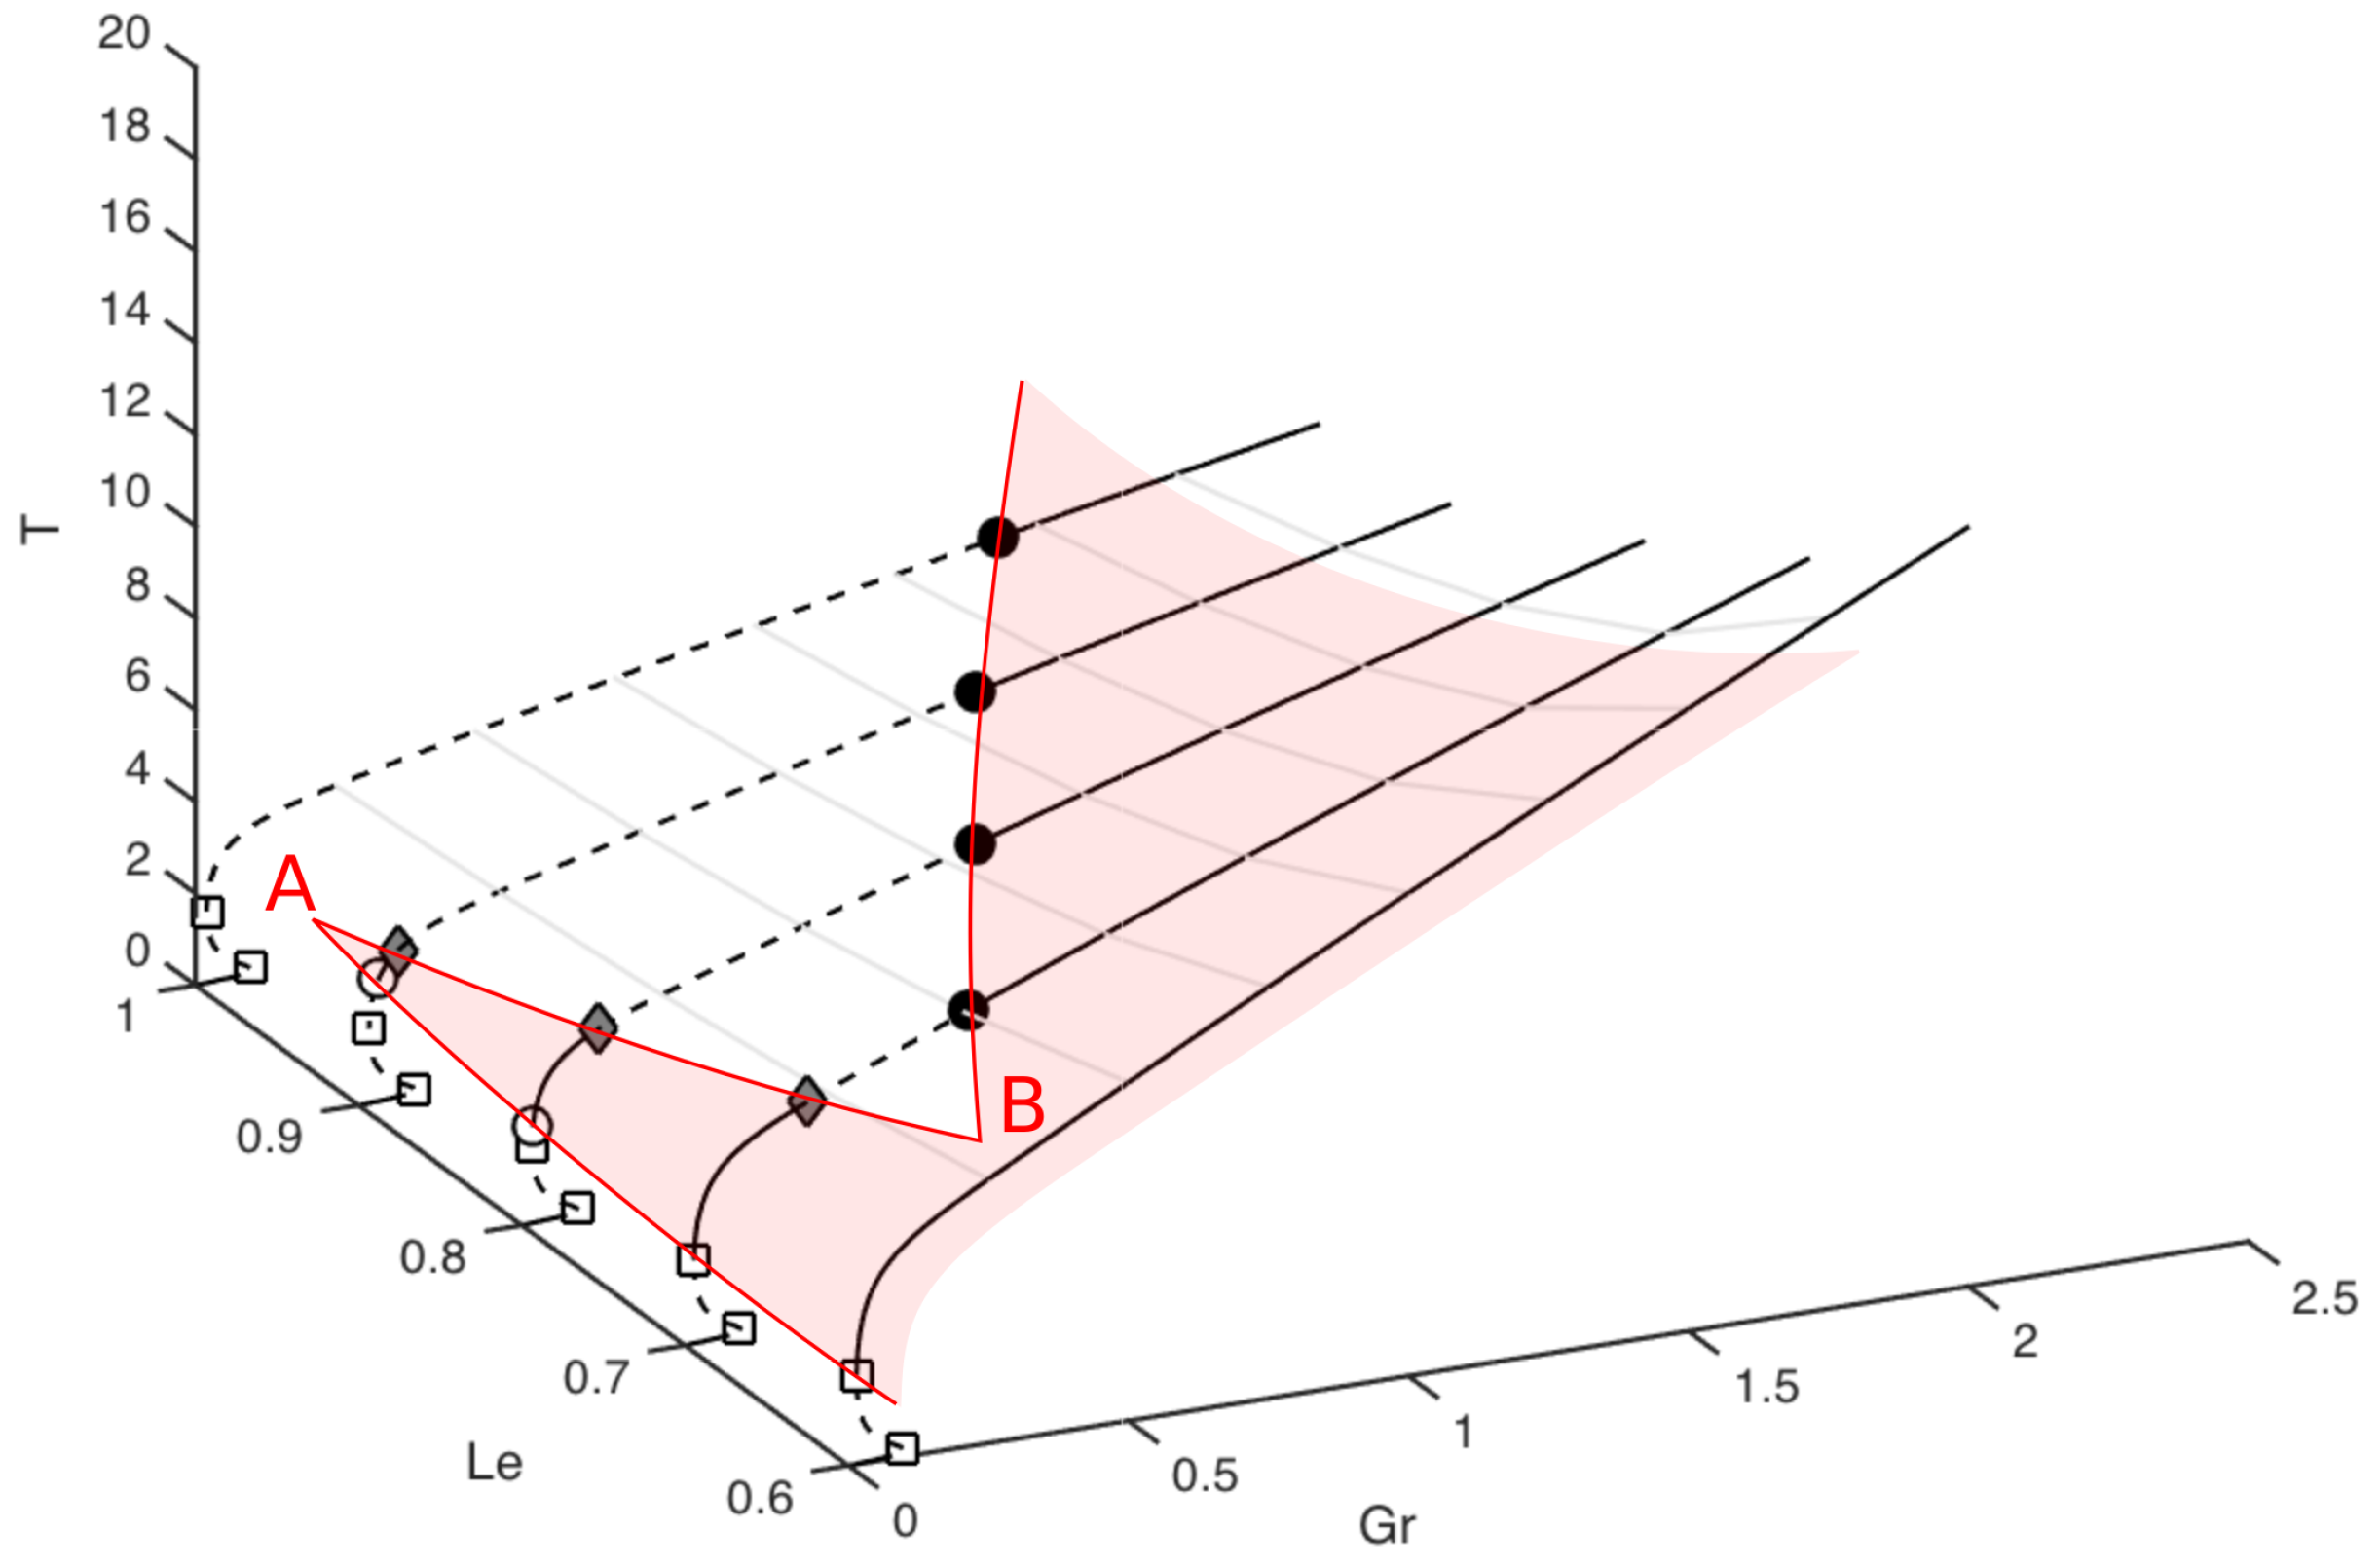
The main unknown parameter involved in L e is the permeability k π . In view of that, both scenarios are unrealistic for real faults. On the contrary, an interesting area is the one where L e spans between 10−1 and 102. The results presented in this section are summarised in Figure 6, where we present, in the L e × G r × T space, all the critical points and sketch their variation with L e .
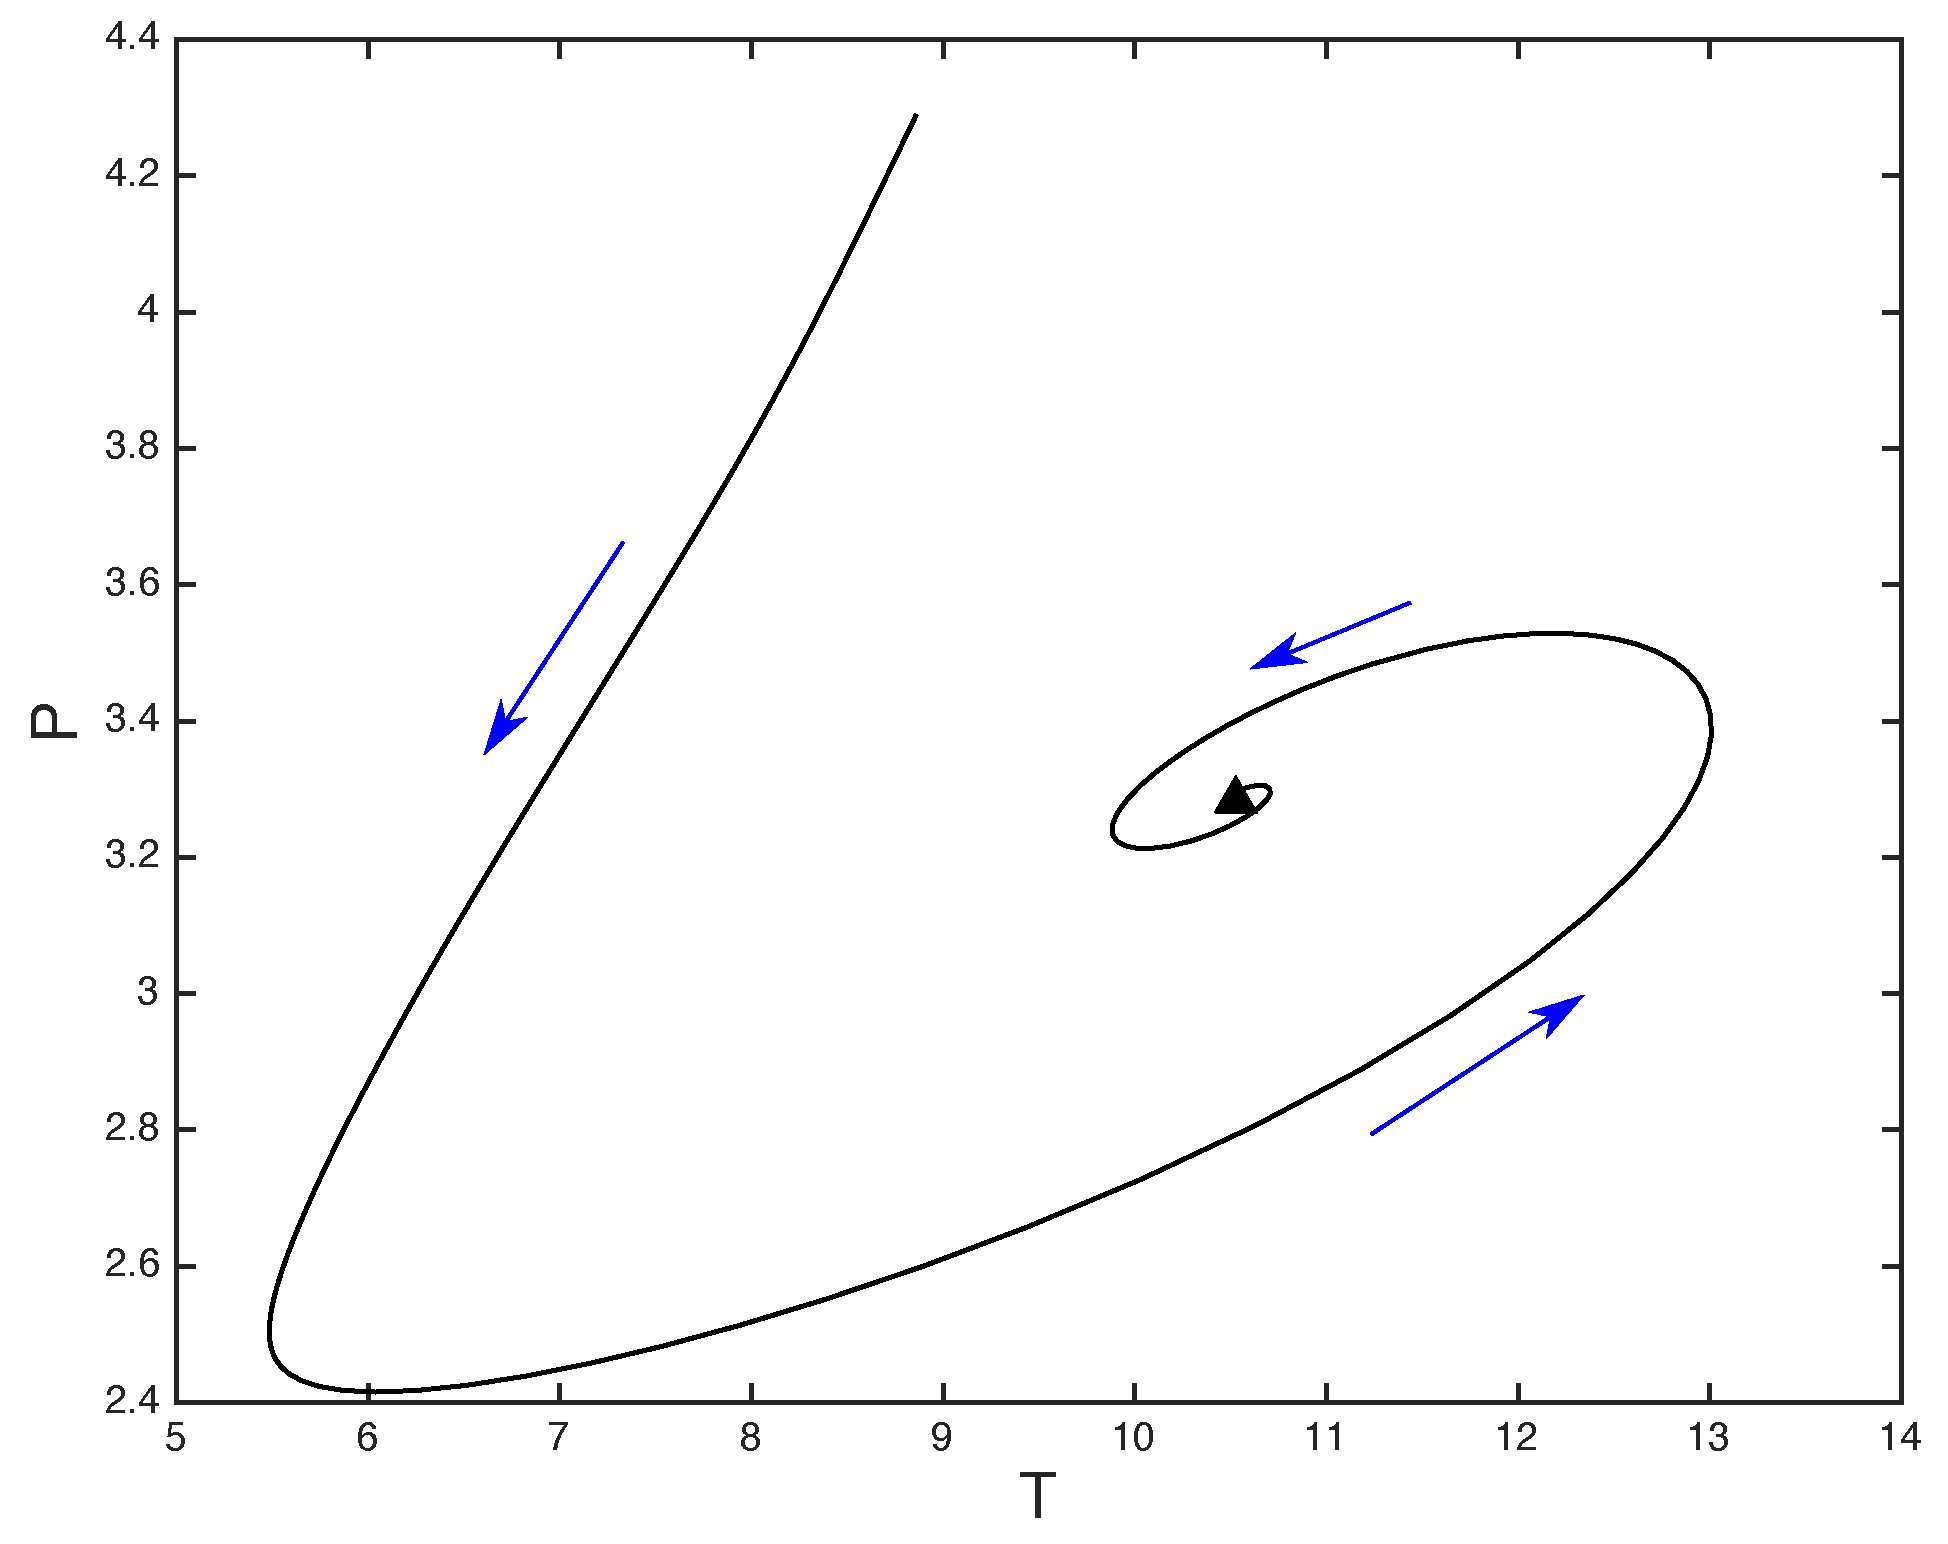
Starting from a low Lewis number value and up to L e = 0.6 , the only difference observed in the upper branch of the steady solutions compared to the L e 0 limit is the appearance of complex eigenvalues. Nonetheless, the real parts remain negative and the dynamics in the vicinity of the branch are represented by a spiral converging to its centre (Figure 7) in the Δ p × T phase space, irrespective of the value of G r .
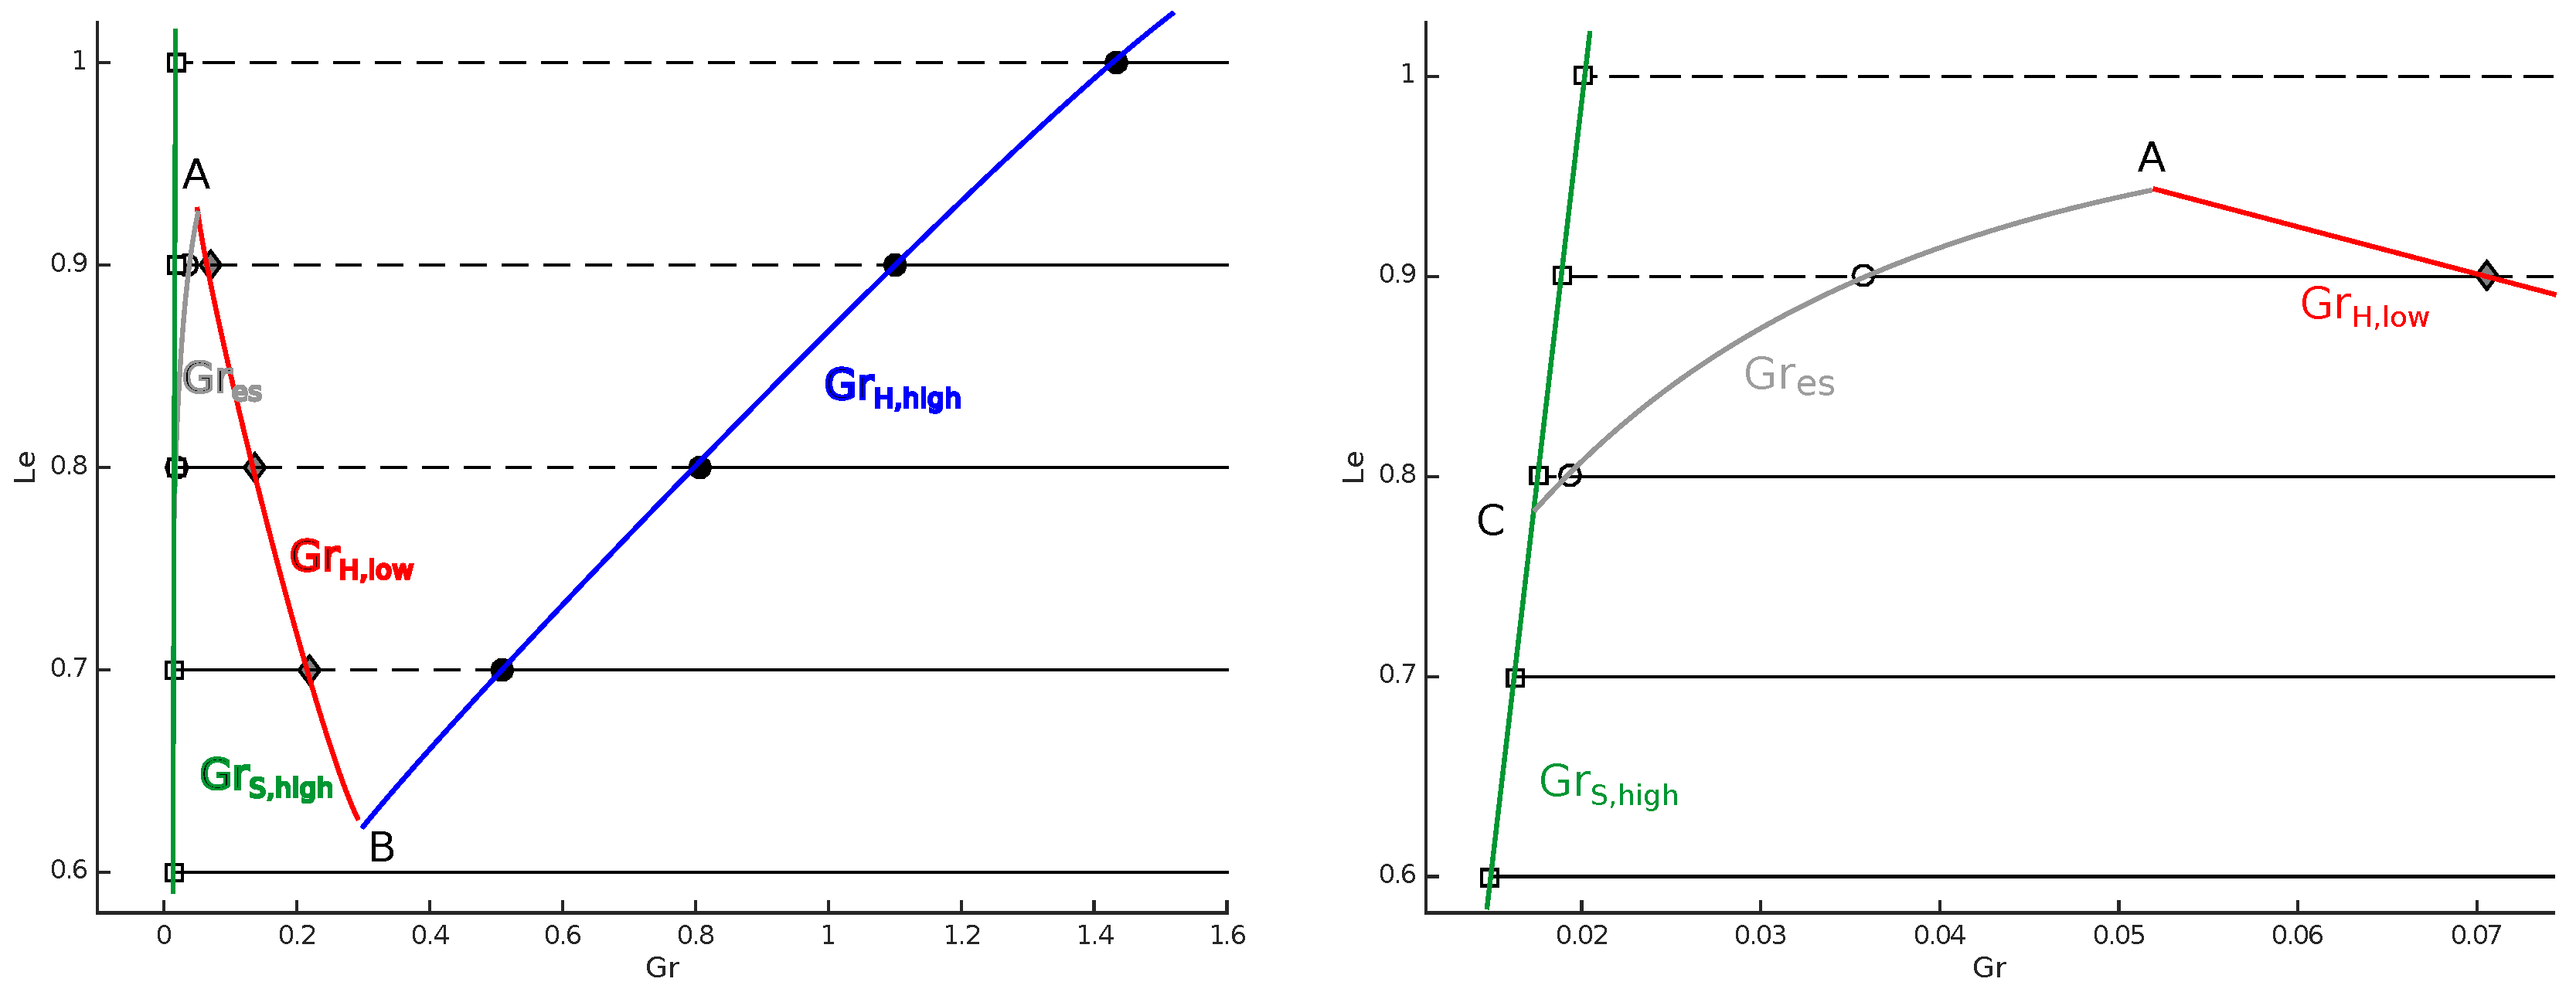
However, for a critical value of Lewis number, L e c r , l o w that lies in the interval (0.6, 0.7), denoted by point B in Figure 6, there appears a supercritical Hopf point in the Lewis space, which marks the onset of periodic solutions. From that point, two curves of Hopf points in Grunfest ( G r H , l o w = G r H , l o w ( L e ) and G r H , h i g h = G r H , h i g h ( L e ) ) are starting (denoted by red and blue in Figure 8). Those two curves are marking the boundaries of the periodic solution zone, from stable spirals outside (marked by solid black curves in Figure 8) to limit cycles inside (marked by dashed black curves up to point A in Figure 8).
The same behaviour can be described from a Gruntfest evolution perspective. In essence, the stable equilibrium point becomes unstable when traversing the G r H , l o w boundary and a limit cycle grows around it. This dynamic response changes again when passing the G r H , h i g h boundary, after which the cycles vanish.
In addition to all that, after a second critical value of Lewis number, L e c r , m e d i u m , which lies in the interval (0.7, 0.8) and is denoted by C in Figure 8, the upper branch becomes unstable right after the turning point, for G r G r S , h i g h , G r e s . As in the case of the Hopf point curves, there exist a G r S , h i g h = G r S , h i g h ( L e ) curve (denoted by green in Figure 8) and a G r e s = G r e s ( L e ) curve (denoted by grey in Figure 8) which define an instability area in the upper branch.
As shown in Figure 8, the area L e 0.8 , 0.92 presents the richest dynamic behaviour with four different areas: (A) unstable spirals that lead to the lower branch in G r S , h i g h , G r e s ; (B) stable spirals that lead to the upper branch in G r e s , G r H , l o w ; (C) stable limit cycles in G r H , l o w , G r H , h i g h and (D) stable spirals for large values G r G r H , h i g h , + . A point in each of these interval is selected and the corresponding phase diagram is presented in Figure 9.
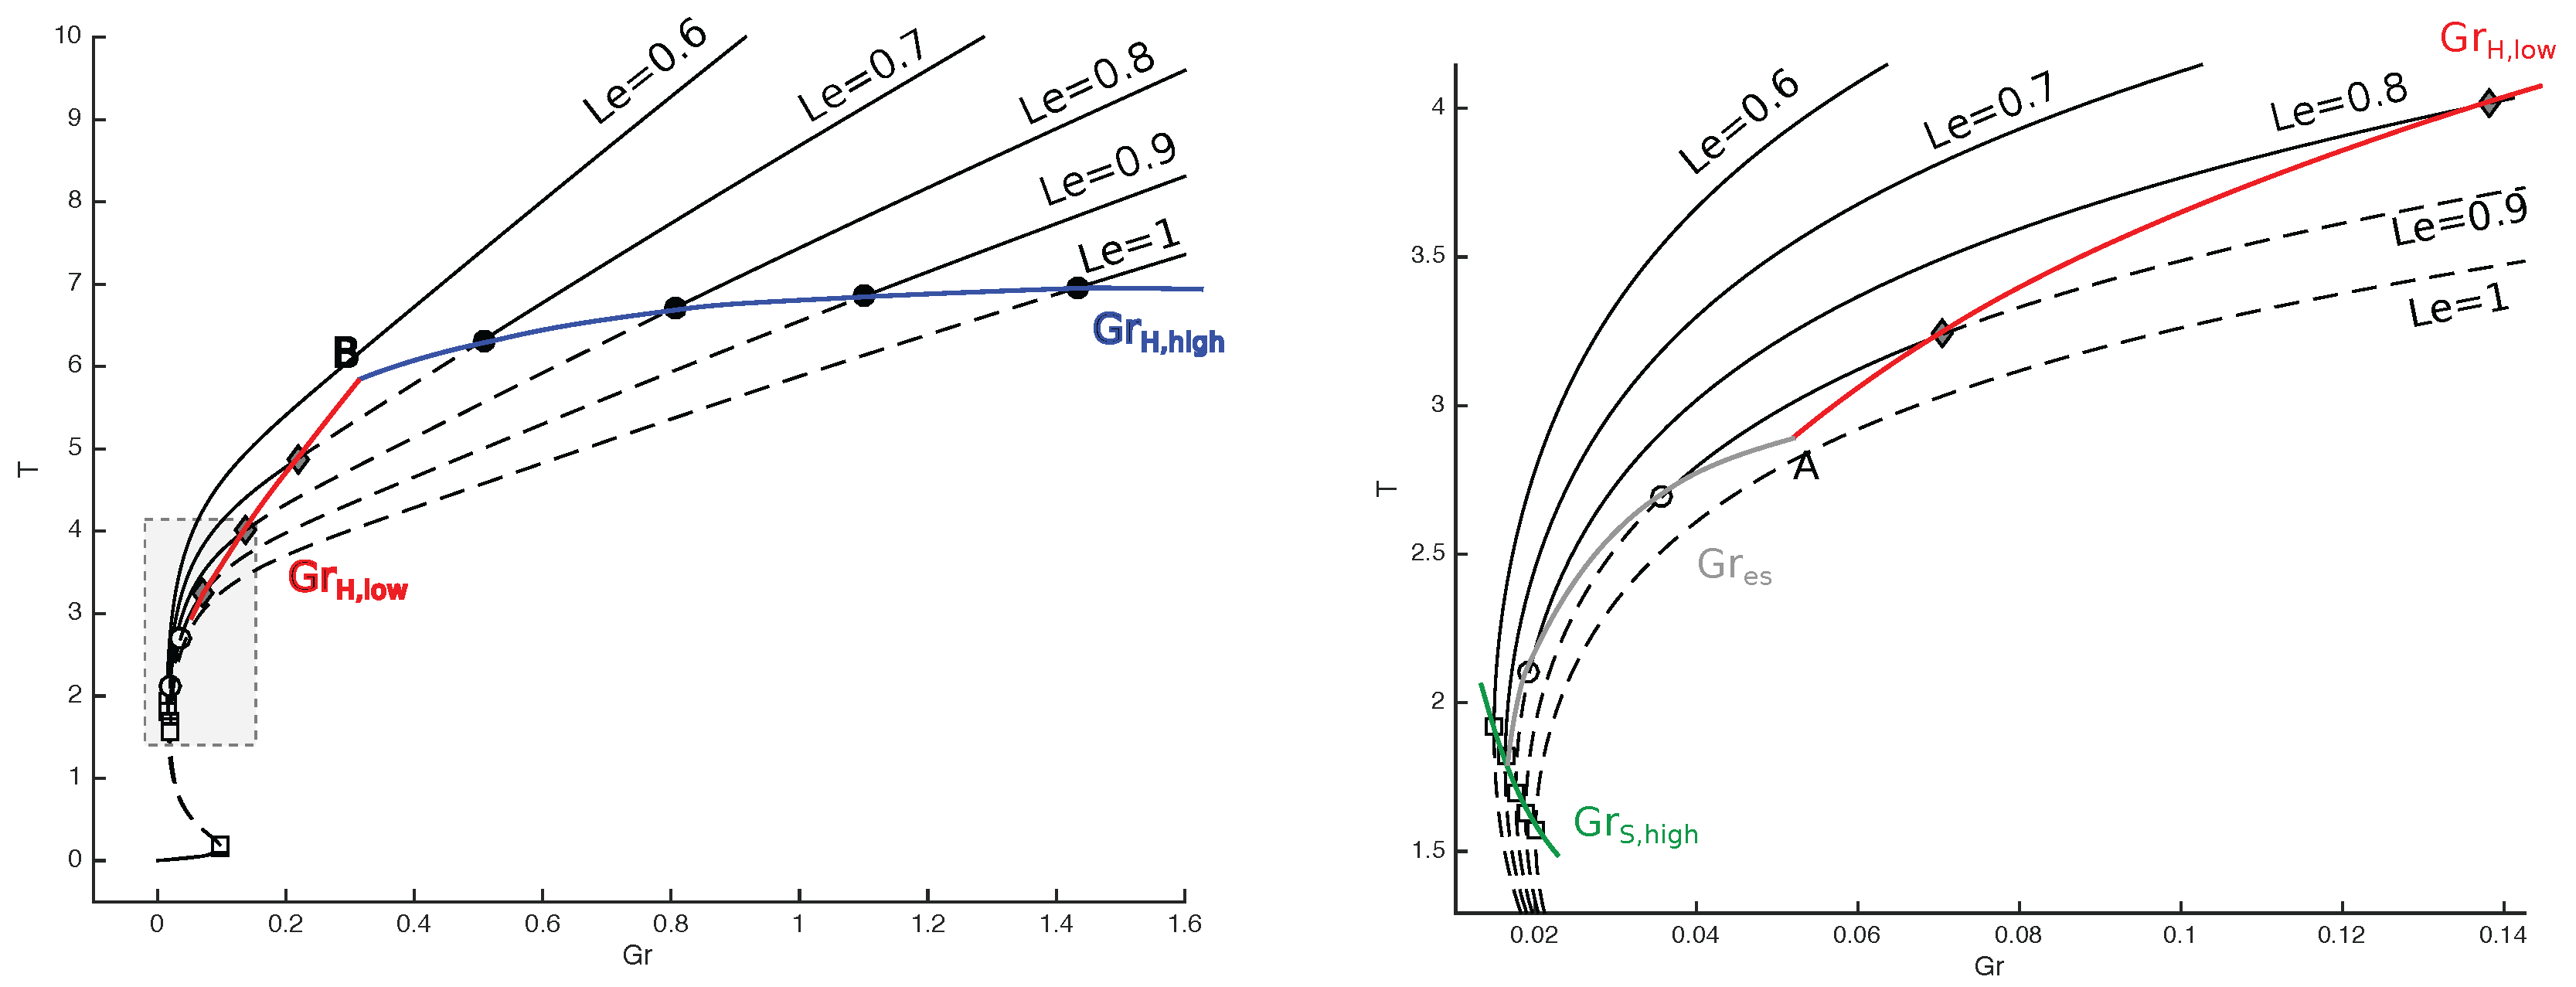
In Figure 10, we present the projection of the surface of Figure 6 on the G r × T space in order to visualise the critical points described above with respect to the lower branch of the S-curve.
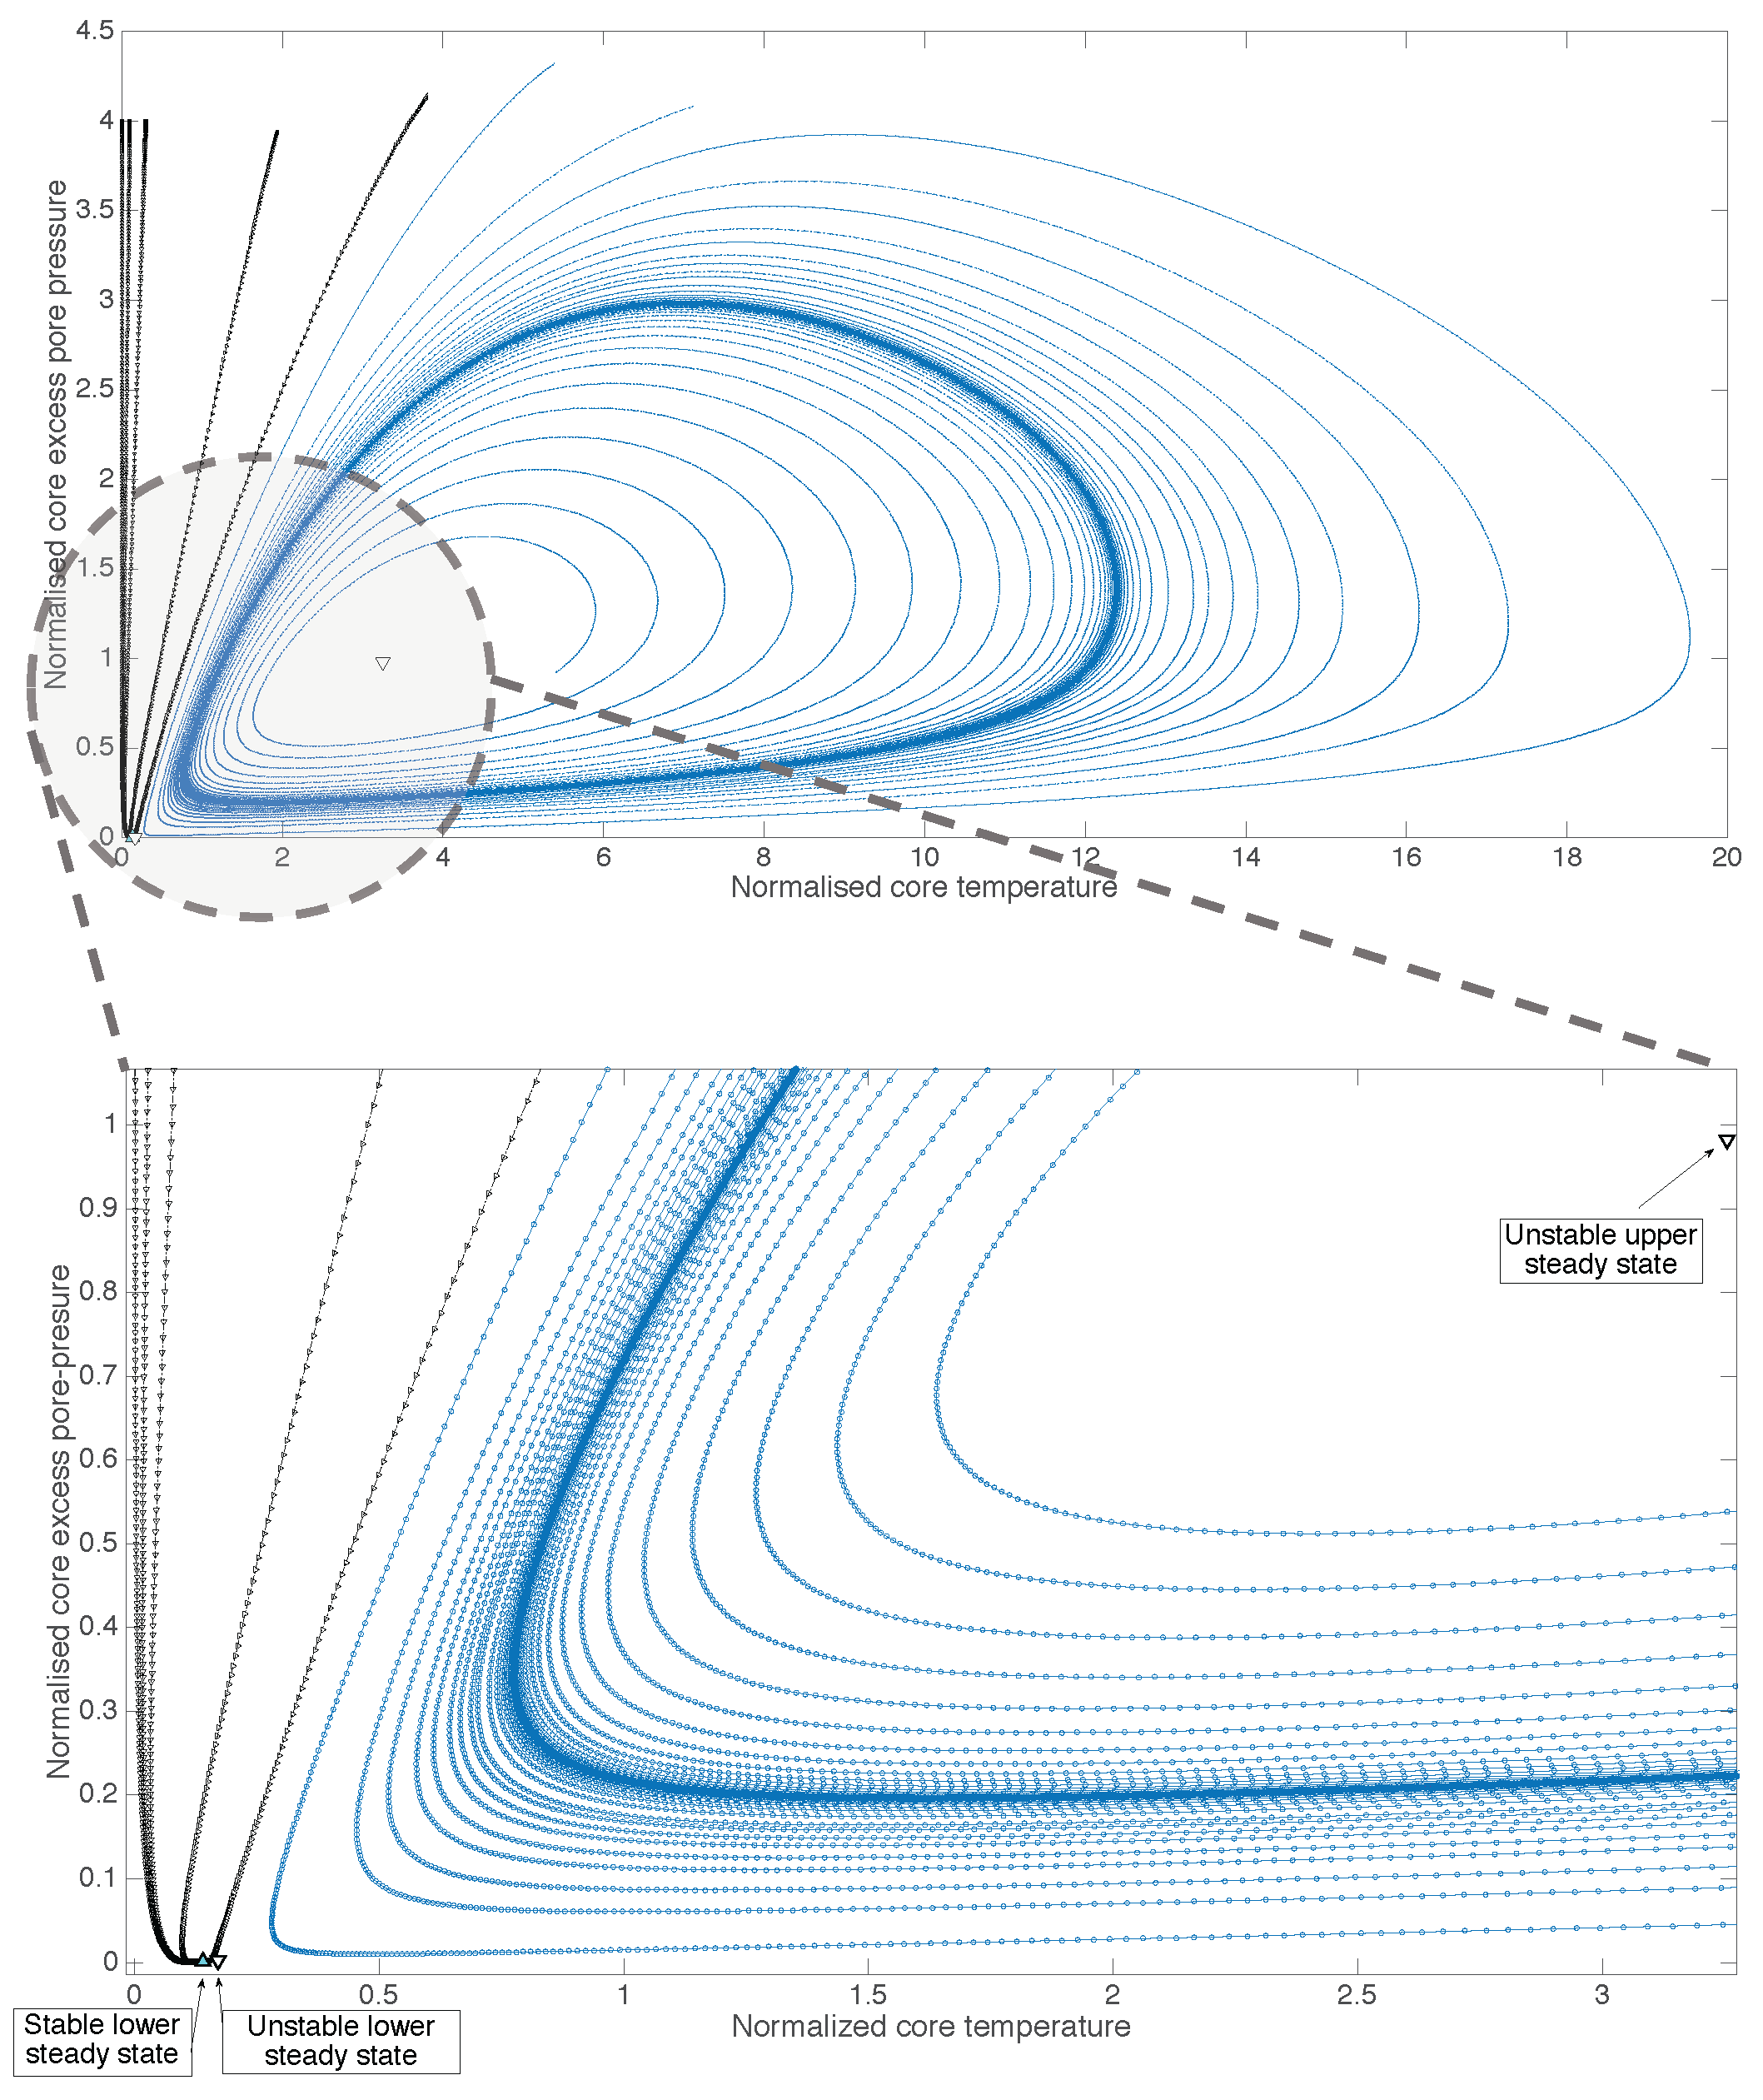
Note that, in the area of Grunfest numbers where both upper and low branches coexist ( G r < G r S , l o w ) and the upper branch is either stable or presents stable periodic solutions, the system is bi-stable (Figure 11), and there exists a manifold that acts as a separartix between the two solutions.
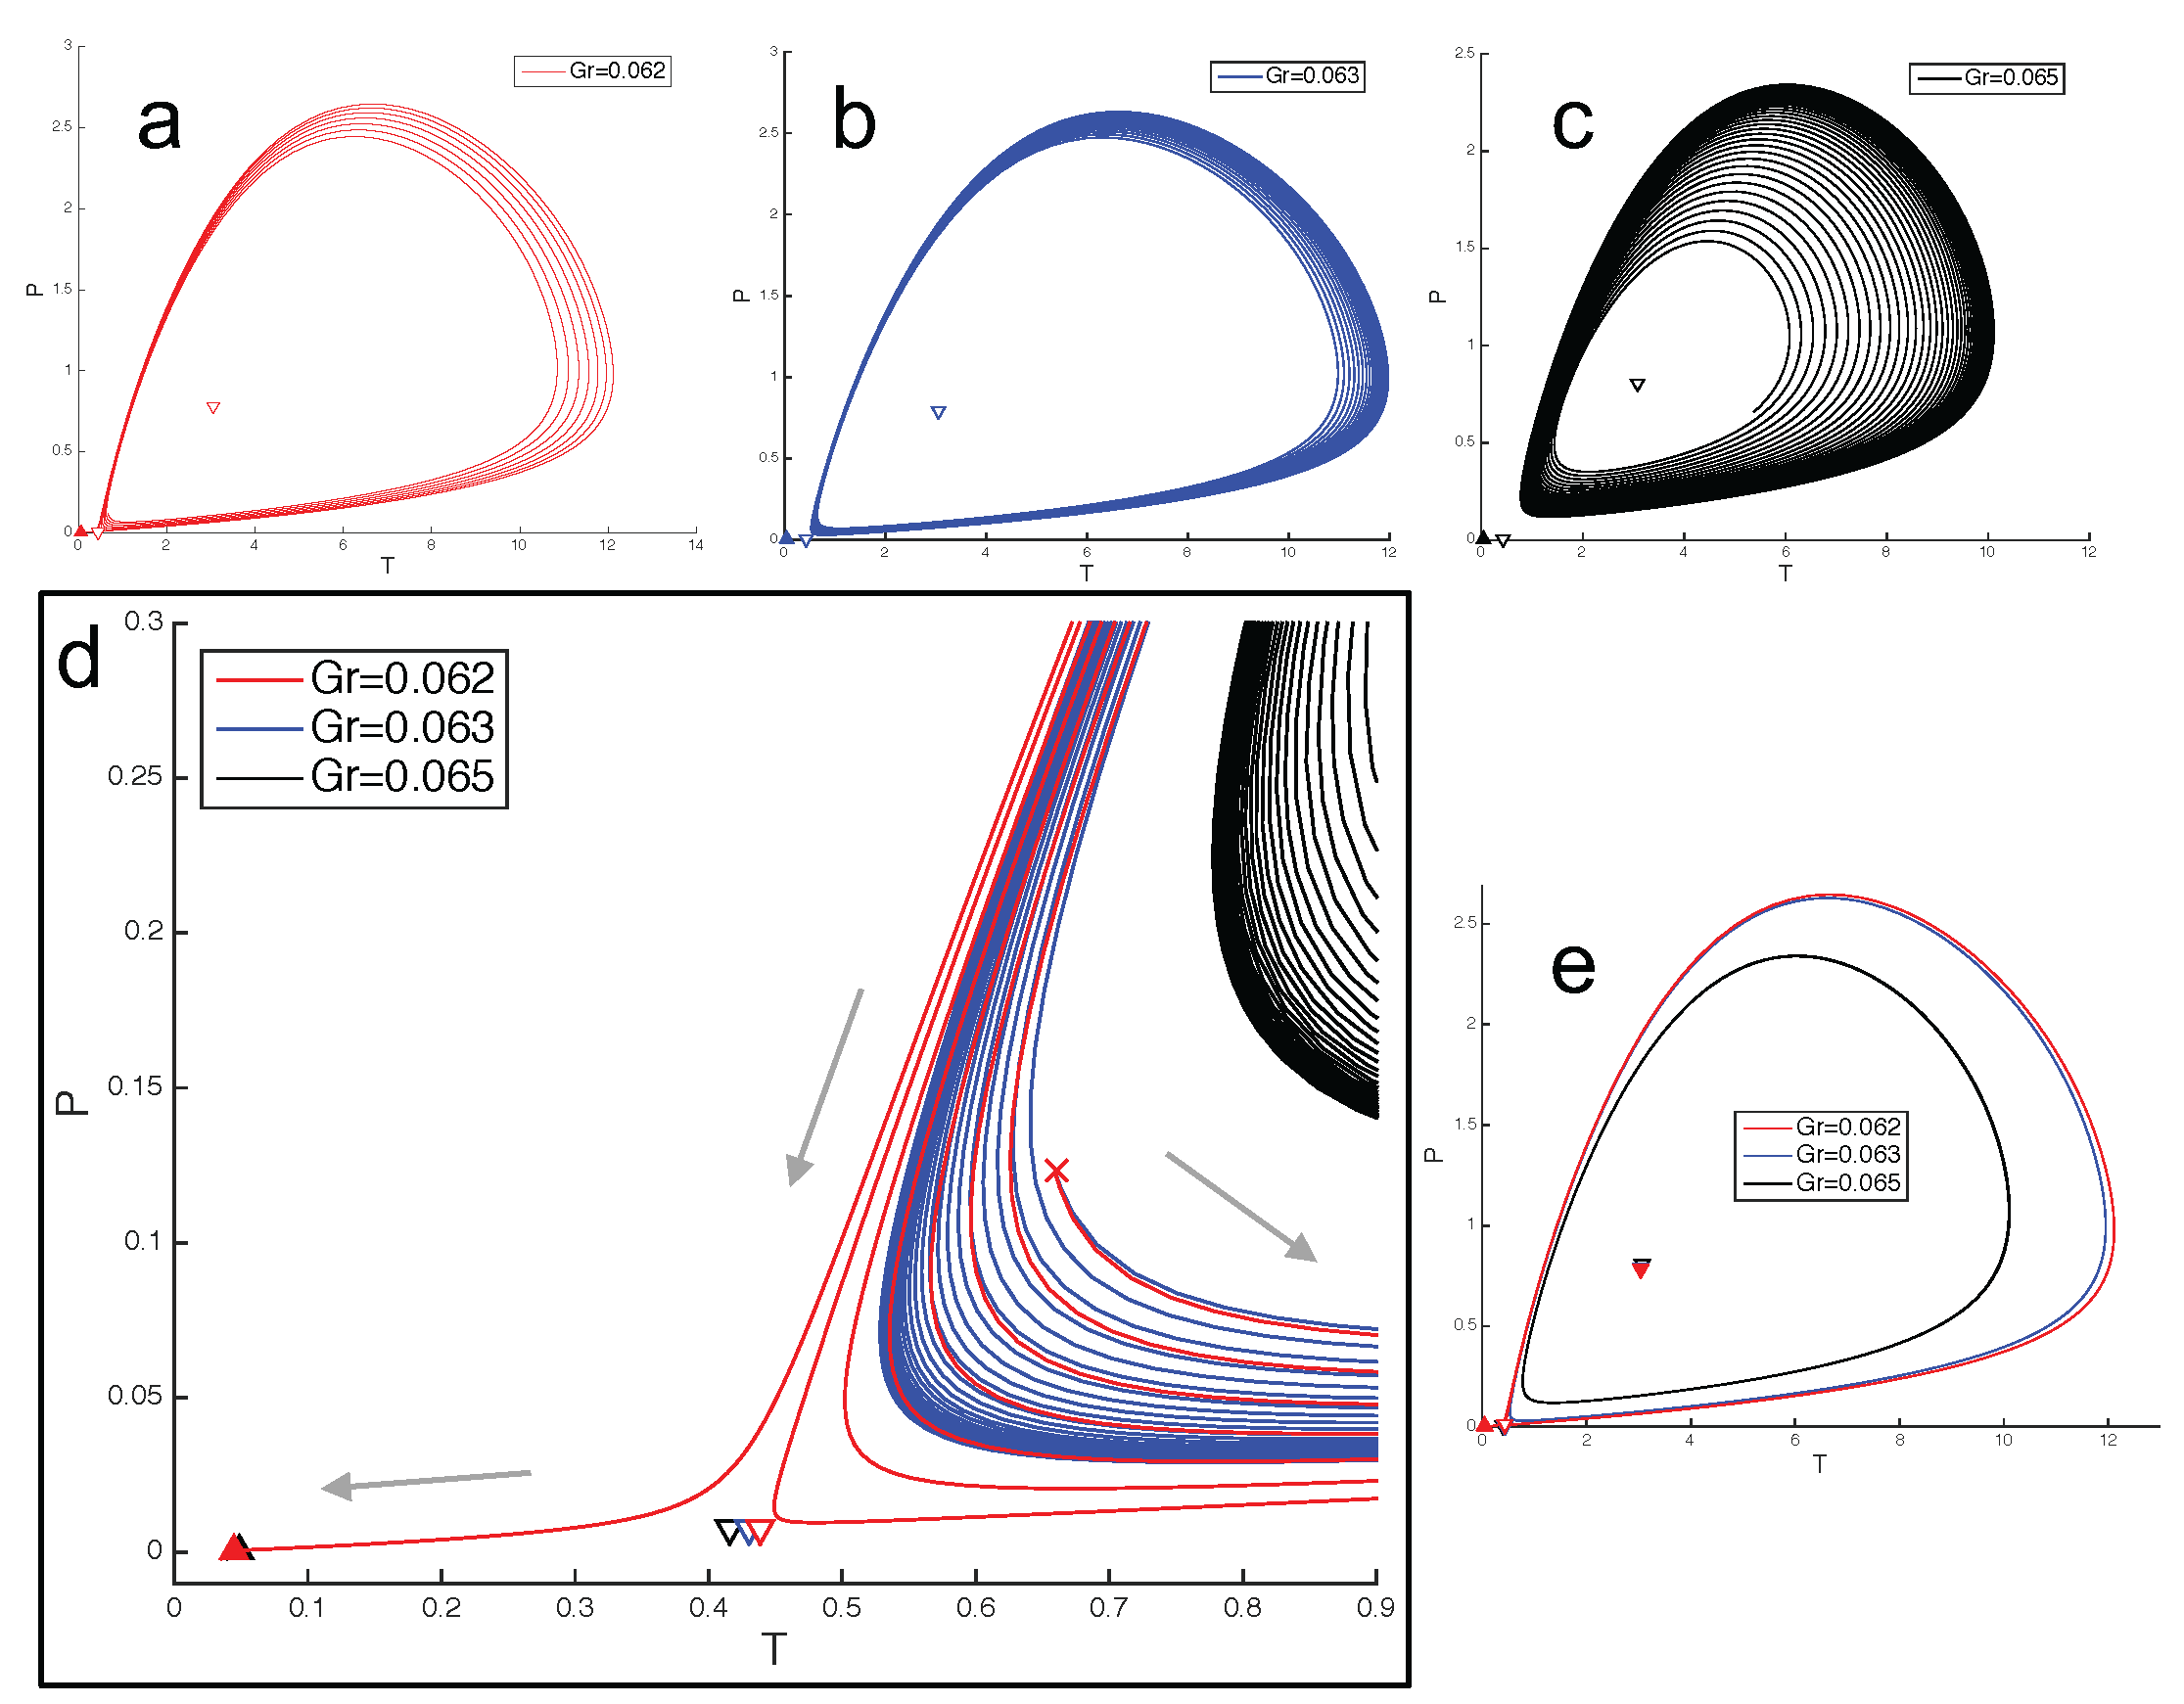
Upon further increase of the Lewis number, we observe that G r e s increases and G r H , l o w decreases up to a third critical value of Lewis, L e c r , h i g h 0.9 , 0.93 , for which G r e s becomes equal to G r H , l o w (point A in Figure 6, Figure 8 and Figure 10). At this point, the whole upper branch becomes unstable and gives rise to a curve of homoclinic points in the L e × G r space. Essentially, the limit cycle that exists for G r < G r H , h i g h “touches” the unstable node and becomes a homoclinic orbit (Figure 12). Note that, in terms of Gruntfest number, the homoclinic point appears for G r G r S , h i g h , G r S , l o w . However, as the Lewis number increases, so does the amplitude of the limit cycles for a given Gruntfest number. Thus, the homoclinic point tends to the lower saddle node. We have found that it reaches that point for a L e 1 , 1.3 . Past that Lewis number value and up to the one for which the S-curve becomes stretched, the system has stable oscillations for G r G r S , l o w , G r H , h i g h , which vanish for G r < G r S , l o w .
It should be noted that, for L e > 1.3 , the only critical points are the homoclinic ( G r S , l o w ) and the Hopf ( G r H , h i g h ) ones. This result matches the dynamics presented in [9,10], where, apart from the homoclinic bifurcation, it was stated that there exists a high valued Gruntfest number threshold, above which oscillations seize to exist. This threshold, denoted here as G r H , h i g h = G r H , h i g h ( L e ) , provides a maximum fault depth for slow earthquake activity.

4. Discussion

Our key findings are that the Gruntfest number controls initiation of instabilities and their respective energy levels. The Damköhler number is more important in combustion physics, as optimizing the chemical mixtures is the target of the operations, whereas, in the dynamics of faults, the chemistry is a given by the rock type and its pressure-temperature conditions. This paper investigated in a systematic manner the Lewis number, which was shown to control the dynamics of the system. A surprisingly rich domain map was found.
For low Lewis numbers, the system behaves similarly to the simple shear heating case; however, when increasing the number, only the lower stable creep branch stays unaffected. When raising the Lewis number, the upper branch shows an emergence of two Hopf points defining an area of oscillatory behaviour. In the physical application to the problem of faulting, this oscillatory behaviour appears as perfectly periodic oscillation between creeping flow and fast instabilities, which is the hallmark of the episodic tremor and slip sequence of large subduction zones [10] and continental megathrusts [23]. The periodic solutions cease to exist for high values of Gruntfest number, after the critical value G r H , h i g h . This value provides a depth limit for the faults to present periodic evolution.
For higher Lewis number (for fixed Damköhler lower permeability), the higher energy level of the system, appearing as an upper third branch in the bifurcation diagram, becomes completely unstable up to the aforementioned G r H , h i g h limit. This marks the onset of a homoclinic bifurcation in the system of equations. The corresponding homoclinic point, which first lies on the unstable branch of the S-curve, after a small increase in the Lewis number, from approximately 0.93 to approximately 1.3 coincides with the lower turning point of the bifurcation diagram, G r S , l o w . In turn, this signifies that, for a fault core with low permeability ( L e > 1.3 ) and should the Gruntfest number be allowed to vary, there exists a unique orbit that can connect the stable creep state with the stable oscillatory state of a fault.
The implications of these new findings are that high Lewis numbers are rendering the system unstable and are more prone to render the system into chaotic regime than lower Lewis numbers. In this contribution, we have only analysed a single fault with a single chemistry, and a similar transition to chaos is expected when multiple oscillating faults with different Lewis numbers are interacting in a geodynamic setting. We claim, however, that when the chemistry and pressure and temperature conditions are known, one can use the present study to decipher the chaotic signals via a physical model of the underpinning oscillators. This inference stems from the analogous situation of the Kolpitz electrical oscillator, where data assimilation methods have been used to reproduce and forecast the chaotic signal [24].
Before reaching such an elusive goal, a prerequisite would be to formulate a forward simulator of the geological application that can generate the observed time series of instabilities. In such a simulation, the presented method is a valuable tool for pre-analysis as the changing dynamic regimes are highly sensitive to the Lewis number. In a critical domain, a small change in Lewis number can display four different dynamic regimes and one stable regime. In such a system, a simple Monte Carlo Simulation to assess the dynamic regime is prone to overlook important elements of the dynamics of the system. If, however, the critical Gruntfest number, the homoclinic point and the Hopf Point are known a priori, the forward model can generate the transient time series needed for the data assimilation step. However, as it is expected, in order for the present model to predict proper chaotic behaviour, the equations for the evolution of the internal variables need to be included [2,6]. This will allow the variation of the Gruntfest and the Lewis number, which is necessary for the transition between the different oscillatory modes [10].
Another important step in order to deal with more realistic scenaria would be the incorporation of the full viscoplastic model [14] along with the momentum balance law for the mixture. This would allow the presented theory to be applied to real geological models, where the effect of the geometry along with the possible uncertainties is expected to lead to even more complex dynamics. For such a task, of course, the discretization scheme needs to be revisited since the Spectral Element Method is known to be better suited for simple domains.

5. Conclusions

In summary, the Gruntfest number determines the steady state defining the necessary energy input for instability. The Lewis number determines the dynamics, defining the ratio of energy diffusion over hydraulic mass diffusion. The Damköhler number describes the energy stored in the chemical reactions and can be used to define a modified Gruntfest number through forming the ratio of both numbers. In this sense, the Damköhler number modulates the required energy for instability. The Arrhenius number plays a similar role as it describes the thermal sensitivity of the reaction and the mechanics. Therefore, we conclude that instabilities are all about the interplay of the various forms of energy, their inputs, storage and flux. This interpretation is a physics based view of faults, contrasting starkly with the classical empirical view of faults described by classical fault mechanics. Our work shows that there is a much richer description of faults than the classical view of fault mechanics where elasticity, geometry and material constants are used to describe the phenomena.

Acknowledgments

This work was supported through the close collaboration between UNSW Australia and CSIRO under the auspices of the Unconventional Resources Research Initiative under UNSW’s SPF01 scheme.

Author Contributions

All the authors contributed equally in the derivation and the validation of the mathematical model. S.A., T.P. and M.V. developed the numerical scheme and derived as well as analysed the corresponding results. S.A. and K.R.-L. wrote the paper.

Conflicts of Interest

The authors declare no conflict of interest.

References

  1. Kostić, S.; Vasović, N.; Perc, M.; Toljić, M.; Nikolić, D. Stochastic nature of earthquake ground motion. Phys. A Stat. Mech. Its Appl. 2013, 392, 4134–4145. [Google Scholar] [CrossRef]
  2. Kostić, S.; Franović, I.; Perc, M.; Vasović, N.; Todorović, K. Triggered dynamics in a model of different fault creep regimes. Sci. Rep. 2014, 4, 5401. [Google Scholar] [CrossRef] [PubMed]
  3. Kostić, S.; Vasović, N.; Perc, M. Temporal distribution of recorded magnitudes in Serbia earthquake catalog. Appl. Math. Comp. 2014, 244, 917–924. [Google Scholar] [CrossRef]
  4. Dieterich, J. Time-dependent friction in rocks. J. Geophys. Res. 1972, 377, 3690–3697. [Google Scholar] [CrossRef]
  5. Ruina, A. Slip instability and state variable friction laws. J. Geophys. Res. 1983, 88, 10359–10370. [Google Scholar] [CrossRef]
  6. Gu, J.; Rice, J.R.; Ruina, A.L.; Tse, S.T. Slip Motion and Stability of a Single Degree of Freedom Elastic System with Rate and State Dependent Friction. J. Mech. Phys. Solids 1984, 32, 167–196. [Google Scholar] [CrossRef]
  7. Rundle, P.B.; Rundle, J.B.; Tiampo, K.F.; Martins, J.S.S.; McGinnis, S.; Klein, W. Nonlinear network dynamics on earthquake fault systems. Phys. Rev. Lett. 2001, 8714, 148501. [Google Scholar] [CrossRef] [PubMed]
  8. Alevizos, S.; Veveakis, M.; Poulet, T. Thermo-Poro-Mechanics of chemically active creeping faults: 1. Steady State. J. Geophys. Res. Solis Earth 2014, 119, 4558–4582. [Google Scholar] [CrossRef]
  9. Veveakis, E.; Poulet, T.; Alevizos, S. Thermo-Poro-Mechanics of chemically active creeping faults: 2. Transient considerations. J. Geophys. Res. Solis Earth 2014, 119, 4583–4605. [Google Scholar] [CrossRef]
  10. Poulet, T.; Veveakis, E.; Regenauer-Lieb, K.; Yuen, D. Thermo-Poro-Mechanics of chemically active creeping faults: 3. The role of serpentinite in episodic tremor and slip sequences, and transition to chaos. J. Geophys. Res. Solis Earth 2014, 119, 4606–4625. [Google Scholar] [CrossRef]
  11. Veveakis, E.; Alevizos, S.; Vardoulakis, I. Chemical reaction capping of thermal instabilities during shear of frictional faults. J. Mech. Phys. Solids 2010, 58, 1175–1194. [Google Scholar] [CrossRef]
  12. Sulem, J.; Famin, V. Thermal decomposition of carbonates in fault zones: Slip-weakening and temperature-limiting effects. J. Geophys. Res. 2009, 114. [Google Scholar] [CrossRef]
  13. Poulet, T.; Veveakis, M. A viscoplastic approach for pore collapse in saturated soft rocks using REDBACK: An open-source parallel simulator for Rock mEchanics with Dissipative feedBACKs. Comput. Geotech. 2016, 74, 211–221. [Google Scholar] [CrossRef]
  14. Poulet, T.; Paesold, M.; Veveakis, M. Multi-Physics Modelling of Fault Mechanics Using REDBACK: A Parallel Open-Source Simulator for Tightly Coupled Problems. Rock Mech. Rock Eng. 2016. [Google Scholar] [CrossRef]
  15. Law, C. Combustion Physics; Cambridge University Press: Cambridge, UK, 2006. [Google Scholar]
  16. Fowler, A. Mathematical Models in the Applied Sciences, 2nd ed.; Cambridge University Press: Cambridge, UK, 1997. [Google Scholar]
  17. Kelemen, P.; Hirth, G. A periodic shear-heating mechanism for intermediate-depth earthquakes in the mantle. Nature 2007, 446, 787–790. [Google Scholar] [CrossRef] [PubMed]
  18. Alevizos, S.; Poulet, T.; Sari, M.; Lesueur, M.; Regenauer-Lieb, K.; Veveakis, E. A framework for fracture network formation in overpressurized impermeable shale: Deformability vs diagenesis. Rock Mech. Rock Eng. 2016, in press. [Google Scholar] [CrossRef]
  19. Gottlieb, D.; Orszag, S. Numerical Analysis of Spectral Methods: Theory and Applications. In CBMS-NSF Regional Conference Series in Applied Mathematics; Society for Industrial and Applied Mathematics: Philadelphia, PA, USA, 1987. [Google Scholar]
  20. Trefethen, L.N. Spectral Methods in MatLab; Society for Industrial and Applied Mathematics: Philadelphia, PA, USA, 2000. [Google Scholar]
  21. Chan, T.; Keller, H. Arc-length Continuation and Multi-grid Techniques for Nonlinear Elliptic Eigenvalue Problems. SIAM J. Sci. Stat. Comput. 1991, 3, 173–194. [Google Scholar] [CrossRef]
  22. Gruntfest, I. Thermal feedback in liquid flow: Plane shear at constant stress. Trans. Soc. Rheol. 1963, 7, 95–207. [Google Scholar] [CrossRef]
  23. Poulet, T.; Veveakis, M.; Herwegh, M.; Buckingham, T.; Regenauer-Lieb, K. Modeling episodic fluid-release events in the ductile carbonates of the Glarus thrust. Geophys. Res. Lett. 2014, 41, 7121–7128. [Google Scholar] [CrossRef]
  24. Abarbanel, H.D.I.; Brown, R.; Sidorowich, J.J.; Tsimring, L.S. The analysis of observed chaotic data in physical systems. Rev. Mod. Phys. 1993, 65, 1331–1392. [Google Scholar] [CrossRef]
Figure 1. The physical model of the shear zone. The black dashed line represents centre of the shear zone, the blue dashed one a cross-section whereas the solid blue one depicts the expected temperature and excess pore pressure distribution across the zone.
Mathematics 04 00057 g001
Figure 2. Numerical bifurcation diagram of the normalised temperature at the centre of the shear zone with respect to the Gruntfest number for the shear heating case. The solid lines denote the stable branches whereas the dashed one the unstable middle branch. The Gruntfest number is a measure of the mechanical energy dissipated into heat through the shearing and is defined later in this subsection along with the normalisation of the various fields and variables.
Mathematics 04 00057 g002
Figure 3. Mesh sensitivity analysis. A steady-state simulation of an S-curve was run using N = 40 mesh points and used as a reference against other solutions for varying values of N. A numerical computation of the L2 norm of the difference between the solution for N and the reference curve is plotted against the number of mesh points used. Results clearly show the exponential convergence of the method after a critical number of 16 mesh points. We selected a conservative value of N = 30 for all numerical simulations presented in the rest of the study.
Mathematics 04 00057 g003
Figure 4. Numerical bifurcation diagram of the normalised temperature at the core of the shear zone versus the Gruntfest number for different boundary temperatures showing the transition from a folded to a stretched S-curve (indicated by the blue arrow). Note that the effect of boundary temperature on the upper branch of the solutions is minimal.
Mathematics 04 00057 g004
Figure 5. Numerical bifurcation diagram of the normalised temperature at the core of the shear zone versus the Gruntfest number for different values of the Lewis number showing the transition from a folded to a stretched S-curve. Note that the effect of Lewis number on the lower branch is minimal.
Mathematics 04 00057 g005
Figure 6. Three-dimensional diagram of the normalised temperature at the centre of the shear zone with versus G r and L e . The diagram presents the steady states (S-curves) for L e = 0.6 , 0.7 , 0.8 , 0.9 , 1 where stable areas are sketched with solid lines and unstable areas with dashed. The various critical points are denoted as follows: (1) square—saddle points; (2) full circle—higher Hopf point; (3) diamonds—lower Hopf point and (4) empty circle—point of exchanging stability on the upper branch. The diagram shows that for a value of the Lewis number L e c r , l o w 0.6 , 0.7 , point B marks the onset of supercritical Hopf bifurcations. This point splits for increasing values of L e defining an area of stable periodic solutions.
Mathematics 04 00057 g006
Figure 7. Phase diagram initial condition near the upper steady state for L e = 0.6 . The stable spirals presented here are representative of the dynamics near the upper branch for all L e 0 , 0.6 .
Mathematics 04 00057 g007
Figure 8. Projection of the upper branch of solutions on the G r × L e space for G r 0 , 1.6 and L e 0.6 , 1 . The left diagram is for the whole domain and the G r H , l o w ( L e ) , G r H , l o w ( L e ) curves along with the Hopf point B are depicted. The right diagram is a magnification of the low G r area. G r S , u p p e r ( L e ) , G r e s ( L e ) and G r H , l o w ( L e ) curves as well as the homoclinic point A are depicted. All curves in color and the points A and B are for demonstration purposes and no exact solutions were calculated in the present study.
Mathematics 04 00057 g008
Figure 9. Numerical bifurcation diagram of normalised temperature at the centre of the shear zone with respect to G r (a) and phase diagrams for various Gruntfest numbers; (b) G r = 0.035 . Unstable spirals leading to the lower branch of steady state solutions; (c) G r = 0.065 . Stable spirals leading to the higher branch of steady state solutions (yellow triangle). In this case, the system is bi-stable, and there exists a domain in the phase space that leads to the lower branch; (d) G r = 0.6 . Stable limit cycles; and (e) G r = 1.6 Stable spirals. Note that the choice of Gruntfest numbers was made such that all areas of stability and dynamics modes of the upper branch of equilibria are represented.
Mathematics 04 00057 g009
Figure 10. Steady state bifurcation diagrams for varying values of L e . In the diagram on the left, the G r H , l o w ( L e ) , G r H , l o w ( L e ) curves along with the Hopf point B are depicted. The right diagram is a magnification of the low G r area near the turning point (highlighted by a grey rectangle on the left diagram). G r S , u p p e r ( L e ) , G r e s ( L e ) and G r H , l o w ( L e ) curves as well as the homoclinic point A are depicted. All curves in colour and the points A and B are for demonstration purposes and no exact solutions were calculated in the present study.
Mathematics 04 00057 g010
Figure 11. Phase diagram in the bi-stable area of the system. (top) full diagram; (bottom) magnification of the area near the origin. All of the curves were produced using various initial conditions. Blue curves lead to the stable limit cycle, whereas the black ones lead to the lower stable steady state.
Mathematics 04 00057 g011
Figure 12. Phase diagram for L e = 0.93 near the homoclinic point. Based on our calculations, the first homoclinic point lies in (0.92, 0.93) × (0.062, 0.063) in the L e × G r space. The diagrams (ac) present the unstable spiral and the limit cycles for G r = 0.062 , 0.063 , 0.065 , respectively. In (d), a magnification of the trajectories near the origin is depicted. Note that trajectories for G r = 0.062 , 0.063 start from the same initial condition and reveal that starting from the right of the homoclinic point, the limit cycles increase in magnitude until they “touch” the unstable node of the middle branch and give rise to the homoclinic orbit. Finally, this transition from limit cycles to spirals through the homoclinic bifurcation is depicted in diagram (e).
Mathematics 04 00057 g012
Table 1. Values of the parameters used.
ParameterValue
A r c 20
A r m 10
α4
D a 10−4
μ r 3 × 10⁻³