Abstract
This study develops a mathematical optimization framework to determine optimal inspection policies for imperfect production systems subject to stochastic deterioration. System degradation is modeled using a Weibull power law process, which captures the increasing likelihood of transitions from in-control to out-of-control states over time. When deterioration occurs, a reverse-order inspection strategy based on negative binomial sampling is employed, wherein an inspection continues until a predefined number of conforming items is obtained. The proposed model integrates inspection decisions with production learning effects and Bayesian demand updating. Learning-by-doing is incorporated through an experience-dependent production cost function, while demand uncertainty is addressed using Bayesian posterior estimation. A comprehensive expected total cost function is formulated, including production, inspection, inventory holding, warranty, and rework costs. The analytical properties of the model are examined, demonstrating that the expected total cost function is strictly convex with respect to the inspection decision variable. This convexity guarantees the existence and uniqueness of the optimal solution. Numerical experiments and sensitivity analyses illustrate the effects of defect rates, learning parameters, warranty periods, and demand uncertainty on the optimal inspection policy. The results show that jointly optimizing inspection intensity, learning effects, and demand information leads to significant cost reductions and robust decision-making in deteriorating production systems.
Keywords:
inspection schema; Bayesian estimation; learning curve; warranty management; Weibull process; imperfect production system MSC:
62N05; 62C10; 65C20
1. Introduction
In modern manufacturing, imperfect production systems present significant challenges due to their inherent deterioration, which increases defect rates and impacts product quality and operational costs. These systems, often characterized by stochastic degradation processes, require robust inspection schemes to balance quality assurance with cost efficiency. Traditional approaches, such as full or random sampling inspections, frequently result in high costs or sampling errors, increasing the risk of defective products reaching customers and increasing warranty liabilities [1,2]. This research proposes an advanced inspection schema tailored for assemble-to-order (ATO) systems, which are common in industries demanding high customization. By integrating a learning curve to enhance production efficiency and Bayesian demand estimation to address market uncertainty, the proposed model aims to minimize the expected total cost while ensuring product reliability.
The proposed schema utilizes negative binomial sampling, wherein products are inspected in reverse order, starting from the last item in a production lot, until an optimal number of conforming items (denoted κ) is collected. This method employs the Weibull power law process to model system deterioration and product failure rates, effectively capturing the non-constant failure dynamics characteristic of real-world systems [3,4]. The cost model incorporates production, inspection, inventory holding, warranty, and rework costs, all adjusted to account for ATO dynamics. Bayesian posterior demand estimation guides inventory decisions, thereby reducing the risk of mismatches, while a learning curve effect decreases manufacturing costs as inspection experience accumulates [5,6]. Numerical optimization techniques are applied to minimize costs, with convexity verified to ensure a unique optimal solution. Sensitivity analyses examine the effects of defect rates and warranty periods, offering valuable insights for practical implementation.
Although this study situates its application within an assemble-to-order (ATO) context, the operational characteristics assumed in our model closely parallel those of modern make-to-order (MTO) manufacturing. In both settings, production begins only after customer requirements are confirmed, rather than being driven by speculative forecasts. Consequently, the production lot size is known in advance, enabling manufacturers to schedule inspection tasks and quality assurance activities with greater precision. The proposed algorithm is specifically developed for such environments, where confirmed demand allows inspection intensity to be optimized in relation to system deterioration, defect risks, and learning-driven production efficiency. Therefore, the framework naturally accommodates MTO operations, with the added benefit that, when demand is known, uncertainty-related components of the model are simplified without altering the core optimization logic.
This study builds upon prior research by extending the foundational inspection schema of Ho and Huang [7] to incorporate learning effects and demand uncertainty. It addresses limitations in traditional inspection models that rely on static processes or exponential failure distributions [8,9] by adopting a stochastic deterioration framework. By integrating recent advances in reliability modeling and Bayesian decision-making under uncertainty [10,11], this research develops a unified optimization model for inspection decisions.
This study aims to fill this gap and makes the following main contributions. First, we develop a unified optimization framework that jointly incorporates system-level stochastic deterioration, reverse-order inspection policies, learning-by-doing effects, and Bayesian demand updating. Second, inspection-driven learning is endogenously embedded into the cost structure, allowing inspection decisions to influence both quality performance and production costs. Third, the proposed model provides analytical insights into the structural properties of the optimal inspection policy and is supported by numerical experiments and Monte Carlo simulations that demonstrate robustness under demand and deterioration uncertainty.
This study focuses on the mathematical structure and optimization properties of inspection decisions under stochastic deterioration and demand uncertainty and establishes analytical results regarding convexity and optimality of the proposed model. Related applications in quality control systems have been discussed in the literature [12,13]. These contributions provide both theoretical insights and practical guidance for designing inspection policies in imperfect production systems operating under uncertainty.
2. Literature Review
The study of imperfect production systems and their inspection schemes has been a central focus in operations research and quality management, driven by the need to balance cost, quality, and reliability. Early research established foundational models of production system deterioration and its impact on product quality. Ben-Daya and Hariga addressed the economic lot scheduling problem (ELSP) for imperfect production processes, assuming exponential distributions for shifts from in-control to out-of-control states [1]. Their model highlighted the trade-offs between production lot sizes and quality-related costs, laying the groundwork for cost-driven inspection strategies. Similarly, Moon et al. extended the ELSP to incorporate setup times, emphasizing the importance of inspection to reduce defects in deteriorating systems [8]. However, these studies relied on simplified assumptions regarding failure distributions, limiting their applicability to systems with non-constant failure rates.
Hsu and Kuo proposed online sampling plans for maintenance policies, introducing full inspections triggered by defect thresholds [2]. Their approach reduced warranty costs but resulted in high inspection expenses, highlighting the need for more efficient sampling methods. To address this, negative binomial sampling emerged as a practical alternative, offering a balance between inspection effort and quality assurance [7]. This method, which terminates inspection upon collecting a specified number of conforming items, has been shown to reduce unnecessary inspections while controlling warranty risks—a concept further refined in this research.
Recent advancements have incorporated more realistic deterioration models. Park utilized the exponentiated Weibull family to model reliability in production systems, demonstrating its superiority in capturing nonlinear failure patterns compared to exponential models [3]. Wang et al. introduced degradation hidden Markov models with time-varying parameters, enhancing reliability assessments for partially monitored systems [4]. These studies align with the current research’s use of the Weibull power law process to model both system deterioration and product failure rates, providing a robust framework for capturing increasing defect rates over time.
The integration of maintenance and inspection strategies has garnered significant attention. Cheng et al. proposed an integrated model that combines production, quality control, and condition-based maintenance for imperfect systems [14]. Their approach optimizes maintenance schedules alongside inspections, thereby reducing downtime and costs. Similarly, Hajej et al. developed a joint production, maintenance, and dynamic inspection model for degrading systems, emphasizing real-time adjustments to inspection frequency [15]. These studies underscore the importance of coordinating inspection with maintenance, a principle incorporated in the current study’s correction cost for restoring in-control states.
Bayesian methods have significantly advanced decision-making in production systems under uncertainty. Insua et al. reviewed Bayesian decision-making in reliability, highlighting its capacity to incorporate prior knowledge and update beliefs with new data [10]. Fang et al. applied Bayesian statistical methods to optimize preventive maintenance for systems with hybrid failure modes, demonstrating enhanced decision-making accuracy [16]. Fang et al. further extended Bayesian analysis to sales and warranty strategies by considering deterioration modes, which informs the current study’s use of Bayesian demand estimation to address market uncertainty [6]. Macedo et al. utilized expert opinions to construct Bayesian prior distributions for equipment reliability, reinforcing the robustness of Bayesian approaches in production contexts [11].
Learning effects, which reduce costs as experience accumulates, have been increasingly incorporated into production models. Afrinaldi and Pratama evaluated quality inspection alternatives by considering learning-driven cost reductions, demonstrating significant savings in high-volume settings [5]. This concept is central to the present research, where a learning curve reduces manufacturing costs as inspection experience increases. Similarly, Fang applied Bayesian decision-making to optimize leased facility maintenance, incorporating learning effects to reduce costs over time, thereby reinforcing the importance of learning in cost optimization [17].
Inspection errors and imperfect quality control have been critical considerations in the recent literature. Sarkar et al. modeled inspection errors in imperfect production systems under warranty, demonstrating their impact on optimal production run times [9]. Kolus and Duffuaa examined optimal process means in multi-stage systems with 100% inspection, accounting for errors that increased warranty costs [18]. Zhang et al. developed a lot-sizing model incorporating inspection errors and imperfect processes, aligning with the current study’s focus on managing defect rates (ψ) in out-of-control states [19]. These studies underscore the need for robust sampling methods, such as negative binomial sampling, to mitigate the risks associated with inspection errors.
Multi-stage and supply chain perspectives have further enriched this field. Rezaei-Malek et al. proposed integrated planning for part quality inspection and maintenance in multi-stage systems, optimizing inspection frequency to minimize costs [20]. Rezaei-Malek et al. reviewed optimization techniques for inspection planning in multi-stage systems, emphasizing the need for coordinated strategies across production stages [13]. Ghosh et al. modeled an integrated supply chain with imperfect production and inspection errors, highlighting the impact of deterioration on supply chain performance [21]. These studies inform the current study’s ATO configuration, which extends inspection to demand-driven contexts.
Sustainability and environmental considerations have become critical factors in modern manufacturing. Sepehri et al. developed a sustainable production-inventory model that incorporates quality improvement investments to reduce defect rates and minimize environmental impact [22]. Similarly, Afrinaldi and Pratama integrated environmental considerations into quality inspection decisions, reflecting contemporary manufacturing priorities [5]. This research acknowledges these trends and proposes future extensions to include sustainability metrics, such as carbon emissions associated with rework processes.
Advanced statistical and computational methods have significantly improved the design of inspection schemes. Tripathi et al. proposed time-truncated life tests for attribute sampling plans, enhancing the efficiency of reliability testing [23]. Wang et al. developed a failure-censored sampling scheme based on Weibull distributions, enabling validation of lifetime performance while reducing inspection costs [24]. Yuan et al. employed a Bayesian gamma process model for maintenance program valuation, which supports the current study’s Bayesian approach to demand estimation [25]. Collectively, these methods provide a robust statistical foundation for the proposed model’s negative binomial sampling and optimization.
Supplier quality management and container inspection planning have also been extensively studied. Lee and Li examined supplier quality management by analyzing investment and inspection incentives to enhance upstream quality control [26]. Kovalyov et al. optimized container inspection and repair processes across multiple facilities, aiming to minimize costs in logistics-intensive systems [27]. These studies underscore the broader applicability of inspection frameworks, which the present research extends to ATO systems characterized by demand uncertainty.
Finally, automation and AI-driven approaches have revolutionized quality control. Abd Al Rahman and Mousavi reviewed automatic optical inspection methods in electronics, demonstrating their potential to reduce human errors and lower inspection costs [12]. Ho proposed a quality inspection plan for Assemble-to-Order (ATO) systems that integrates assembly configurations, directly informing the current study’s focus on ATO [28]. Salas-Navarro et al. modeled an economic production quantity (EPQ) system with probabilistic demand, aligning with the Bayesian demand estimation employed here [29]. Fang and Chen incorporated production reliability effects into inventory models, supporting the present study’s emphasis on reliability-driven inspection [30]. Salmasnia et al. optimized control charts and maintenance schedules for deteriorating systems, offering a complementary perspective to the proposed schema’s focus on inspection timing [31].
To better position the present study within the existing literature, Table 1 provides a feature-based comparison of representative related works. Rather than offering a detailed model-by-model comparison, the table summarizes prior studies according to key modeling dimensions relevant to this research, including inspection policies, deterioration modeling, learning effects, and Bayesian or demand uncertainty considerations. This comparison highlights that most existing studies focus on only one or two of these aspects, whereas the proposed framework integrates all of them into a unified optimization model.

Table 1.
Feature-based Comparison of Related Studies.
Despite the extensive literature on inspection policies, production system deterioration, and learning effects, these streams are typically studied in isolation. In particular, existing studies rarely integrate stochastic system-level deterioration, inspection-induced learning-by-doing, and Bayesian demand updating within a unified optimization framework. This gap limits our understanding of how inspection decisions should be jointly optimized when both system reliability and market demand evolve stochastically over time.
In summary, the literature offers a robust foundation for modeling imperfect production systems by integrating reliability, maintenance, Bayesian methods, learning effects, and sustainability. Building on these advancements, the current research proposes a novel inspection scheme that combines negative binomial sampling, learning-driven cost reductions, and Bayesian demand estimation, specifically tailored for ATO systems. This approach addresses gaps in traditional models by accommodating complex deterioration patterns, demand uncertainty, and contemporary manufacturing priorities, thereby providing a comprehensive framework for cost-effective quality control.
3. Model Development and Analysis
The primary research problem focuses on designing an effective inspection schema for imperfect production systems that experience gradual deterioration, leading to increased defect rates and potential quality failures. In such systems, production processes start in an in-control state, producing conforming items with low failure rates, but shift to an out-of-control state over time, generating defective products at a rate denoted by . This deterioration not only increases warranty and rework costs but also poses risks of customer dissatisfaction and reputational damage. The challenge is especially pronounced in ATO environments, where production is demand-driven and customized, introducing uncertainties in market demand and inventory management. The main objective is to minimize the expected total cost (TC) associated with production, inspection, inventory holding, warranty, and rework, while maintaining high product quality and operational efficiency.
To address this issue, the problem focuses on determining an optimal inspection strategy that carefully balances the trade-offs between over-inspection and under-inspection. Excessive inspection increases operational costs and delays without generating proportional improvements in product quality, while insufficient inspection allows defective items to propagate, leading to higher warranty and rework costs. To manage this trade-off, inspections are conducted periodically at the end of each production cycle with a fixed duration , reflecting common industrial practices in batch-based ATO and MTO manufacturing systems.
System deterioration is modeled at the system level rather than at the individual item level. Specifically, the transition from an in-control to an out-of-control state follows a Weibull power law process, which allows the failure intensity to increase over time and captures realistic aging and wear effects in production equipment. The probability that the system enters an out-of-control state during a production cycle is given by . Once an out-of-control state is detected, the inspection schema initiates a reverse-order negative binomial sampling procedure.
Under this inspection strategy, products are inspected sequentially, starting from the last item produced in the lot, moving backward until conforming items are identified, where serves as the decision variable controlling inspection intensity. This reverse-order approach is motivated by the assumption that items produced later in the cycle are more likely to be affected by system deterioration and therefore contain more quality-relevant information. The expected number of inspected items is denotes the defective rate in the out-of-control state. Inspection terminates once the stopping criterion is met, thereby avoiding unnecessary inspection of earlier items that are more likely to be conforming. This design improves inspection efficiency while maintaining effective quality control.
It should be noted that for a finite lot size, reverse negative binomial sampling is technically truncated. In this study, we adopt the standard (untruncated) expectation , which provides a reasonable approximation when is small relative to the lot size, as is typical in ATO/MTO environments. Explicitly incorporating truncation would substantially increase analytical complexity while offering limited additional insight into the optimal inspection policy.
In this study, the learning effect is modeled as a stochastic process driven by observed operational experience. The problem is further complicated by demand uncertainty in ATO systems, where market demand varies and may create mismatches between production and inventory. As operators gain experience from inspections, manufacturing efficiency improves and costs decrease through this stochastic learning effect. Therefore, the research question is how to optimally select to minimize the total cost (TC) under these combined dynamics.
This problem is transformed into mathematical analysis and modeling by formulating it as a cost minimization optimization under stochastic constraints. First, the deterioration process is quantified using the Weibull distribution, enabling probabilistic estimation of the out-of-control state and failure rates and for in-control and out-of-control products, respectively. Demand uncertainty is modeled via Bayesian estimation, yielding the posterior demand mean and variance , which inform inventory holding costs.
The total cost, , can be expressed as a function that aggregates all relevant components: (1) Production cost (PC) incorporates the learning curve, (2) Inspection and correction costs, (3) Inventory holding cost, (4) Warranty cost (WC), and (5) Reworking cost (RWC). The model uses a symbolic system to represent the production system, inspection process, and cost components. These notations and symbols are summarized in Table 2.
Table 2.
Notations and Symbols.
Moreover, Figure 1 illustrates the integrated framework for managing an imperfect production system, incorporating quality inspection, rework processes, and post-sale warranty services. The workflow is organized into three interconnected modules: (1) Production Module (Top): This module depicts the production phase, where unit costs decrease exponentially with accumulated inspection experience (κ), influenced by the learning factor (). The production system follows a Weibull distribution, and system inspection employs a Weibull Power Law model to determine whether the system is in-control or out-of-control states. Key parameters such as conforming items (κ), inspection settings, and Bayesian prior demand estimation () are initialized here. (2) Inspection & Rework Module (Center): This module illustrates the quality control process, where products are inspected and sorted into conforming inventory (non-defective) or defective inventory. Defective items () undergo rework, while conforming products () and remaining uninspected items () are consolidated for further processing. (3) Product Sale & Warranty Module (Bottom): This module depicts the sales phase, incorporating Bayesian posterior demand estimation () to optimize inventory and sales strategies. The process concludes with product warranty provisioning (post-sale service) and estimation of inventory holding costs, thereby closing the loop between production output and customer-facing services.
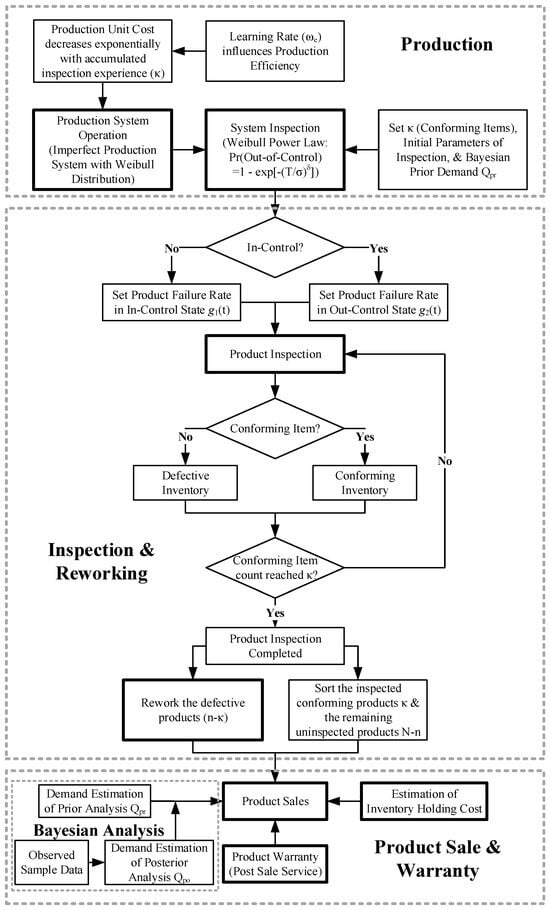
Figure 1.
Production System Operation with Inspection, Rework, and Warranty Framework.
It should be noted that in Figure 1, the decision node labeled “In-Control?” specifically refers to the operational state of the production system, rather than the failure behavior of individual products. When the system remains in an in-control condition, items produced during this period follow the lower failure rate, . If deterioration causes the system to shift into an out-of-control state, items manufactured thereafter follow the higher failure rate, . Thus, the branching logic in the figure reflects transitions in the system’s condition, while the corresponding product-level failure rates are assigned based on the state under which each item is produced. This clarification ensures that readers understand the diagram illustrates system-state evolution and its implications for quality outcomes, rather than suggesting reversed or conflicting routing between the decision node and the associated failure-rate functions.
3.1. Production Cost (PC)
Production unit cost decreases exponentially with accumulated inspection experience (). This relationship emphasizes that inspection goes beyond immediate quality control; it fosters long-term process improvements, which progressively reduce per-unit costs over time. It can be expressed as follows:
Here, represents the basic manufacturing cost per unit; denotes the first-unit manufacturing cost, which serves as the baseline for the learning curve; is the learning factor parameter that controls the speed of cost reduction; is the shrinkage constant that modulates the nonlinear decay; is the optimal number of conforming items collected during inspection; and is the market demand for the posterior analysis, estimated using Bayesian methods.
This formulation extends traditional fixed production costs by incorporating a learning curve that models efficiency gains from accumulated inspection and production experience. The exponential decay term represents how costs decrease as increases, since higher inspection efforts provide feedback that enhances operator skills and process improvements. The exponent normalizes the learning effect by demand scale, ensuring the model appropriately adjusts for varying production volumes in ATO systems. Without the learning curve, the production cost would be a constant ; however, this dynamic term aligns with empirical observations showing that repeated tasks lead to cost reductions.
In classical log-linear (or power-law) learning curves, learning is often driven by cumulative production. In our setting, however, learning mainly arises from inspection-driven feedback rather than from production quantity itself. When the system is detected to be out-of-control, a reverse negative-binomial inspection is conducted until conforming items are obtained, generating direct quality information and process adjustments. Therefore, serves as a proxy for an effective learning experience within a production cycle.
Proposition 1.
The
production
cost
is strictly decreasing and convex in
for
, under the assumptions
> 0,
> 0,
> 0, 0 <
< 1, and
> 0.
Proof.
. The first derivative , showing strict decrease due to learning effects. The second derivative is positive as derived in Proposition 2, confirming convexity. This reflects that marginal cost reductions from learning diminish as κ increases, promoting balanced inspection levels. □
3.2. Inspection and Correction Cost (ICC)
Inspection and correction cost consists of fixed and variable components. It can be expressed as follows:
The fixed component, , covers routine system checks conducted at the end of each cycle, while the term accounts for restoration costs incurred only when deterioration occurs, which is modeled probabilistically using the Weibull cumulative distribution function. The variable component, , scales the per-product inspection cost by the expected inspection volume and is triggered exclusively in out-of-control scenarios. This structure reflects the need to distinguish between system-level (preventive) and product-level (reactive) inspections, ensuring that costs are incurred proportionally to the risk of deterioration and the sampling effort.
3.3. Inventory Holding Cost (IHC)
Inventory holding cost quantifies the cost of maintaining inventory over a cycle, assuming a short production run during which inventory accumulates linearly. It can be expressed as follows:
where is the unit inventory holding cost, is the Bayesian posterior mean demand, is the production rate, and is the production cycle time. The posterior mean can be calculated as:
Please note that the posterior mean is derived from Bayesian demand estimation, assuming a normal conjugate model for demand. Assume the demand follows a normal distribution with prior mean and prior variance , i.e., . The observed sample data consists of observations with sample mean and sample variance . In a normal conjugate setting, the sample mean is assumed to follow , where is the variance of the sample mean. The posterior distribution for is normal, with mean and variance . The posterior precision (inverse variance) is the sum of the prior precision and the data precision will be . Therefore, the posterior variance is as follows:
The term estimates the time required to produce the expected demand, from which (the average holding time) is subtracted to account for mismatches between the planned cycle and the demand-driven production time. When multiplied by and scaled by , this expression penalizes deviations: positive values indicate excess inventory, while negative values (though typically bounded in practice) suggest underproduction. The Bayesian incorporates uncertainty by updating prior distributions with observed data, based on conjugate normal assumptions for the demand distribution.
Please note that in this study, market demand is modeled using a normal distribution to facilitate analytical Bayesian updating and maintain the tractability of the optimization framework. Although demand in ATO/MTO environments is often discreet and may involve small batch sizes, the normal distribution can reasonably approximate aggregated demand observed over a production cycle or planning horizon. This assumption enables closed-form posterior updating and provides clear analytical insights. Alternative discrete demand models, such as Poisson distributions, could be considered for future extensions but would require more complex numerical updating procedures.
IHC bridges production planning and market dynamics in ATO systems, penalizing mismatches to encourage demand-aligned scheduling. High relative to increases costs due to overstocking, tying up capital and risking obsolescence in deteriorating systems. The Bayesian element adds robustness, reducing variance in estimates as sample size grows, leading to more stable costs.
3.4. Warranty Cost (WC)
Warranty cost represents post-sale liabilities, incentivizing rigorous inspections to reduce out-of-control failures. Warranty cost splits into in-control (low failures) and out-of-control (high failures) based on Weibull hazards, with integrals computing expected repairs over the warranty period . It can be expressed as follows:
where is the unit repair cost within warranty, is the warranty period, and are Weibull failure rates, is the expected failures (cumulative hazard), is the proportion of unchecked items from in-control, and the exponential terms are survival and failure probabilities. Here, both and denote expected unit counts over the same production cycle, so is a dimensionless ratio that represents the proportion of demand that is covered by inspection. scales by in-control probability, assuming all items are reliable. weights unchecked, inspected conforming, and reworked items by , assuming unchecked items mix states and inspected ones are from out-of-control. Multiplied by , it ensures that costs accurately reflect the risk of deterioration.
Lemma 1.
The warranty cost
is decreasing in
for
> 0, assuming
> 0, the out-of-control failure rate function
is larger than the in-control failure rate function
, and the Weibull parameters are positive.
Proof.
, where is independent of . However, decreases as
increases, because more inspections identify and rework defective items, reducing the proportion of high-failure products (). Hence, . This balances the rising inspection costs with reduced warranty liabilities. □
Lemma 2.
The out-of-control probability is strictly increasing in
for
when
.
Proof.
The first derivative , showing increase. The second derivative is positive for > 1. As it captures accelerating deterioration: when δ > 1 and large. This property justifies reverse-order inspection because later items in longer runs (T) have higher defect risks, which affect the multipliers in IC, WC, and RC. □
3.5. Reworking Cost (RWC)
Reworking cost targets non-conforming items identified during sampling, which are reworked before sale. derives from the properties of the negative binomial distribution, where defects follow the defect rate . Scaled by , it applies only in deteriorated states, ensuring proportionality to risk. It can be expressed as follows:
Reworking cost penalizes high defect rates, thereby encouraging preventive measures to minimize out-of-control shifts. A high value of increases , which can potentially raise RWC if is large; however, improved detection reduces long-term waste costs. Practically, this implies that investing in rework capabilities lowers overall costs in high-defect industries, such as manufacturing with variable materials. In the model, reworking cost ensures convexity by counteracting excessive , interacting with the in-control cost and waste costs to achieve balanced optimization. This approach promotes sustainable practices, as reworked items reduce waste, aligning with modern quality management principles.
The Negative Binomial Sampling Model serves as a fundamental mechanism in this research for designing an efficient product inspection schema within imperfect production systems. Its primary purpose is to provide a structured, probabilistic approach to inspecting products when the system is detected to be in an out-of-control state, thereby identifying the transition point from in-control to out-of-control production without requiring exhaustive full inspections. Specifically, the model initiates a reverse inspection starting from the last product in the production lot, continuing until an optimal number of conforming items, denoted as κ, is collected. This stopping rule is based on the negative binomial distribution, where the sampling process focuses on accumulating a fixed number of “successes” (conforming items) while accounting for “failures” (non-conforming items) along the way. The probability mass function is given by:
Here, is the total number of inspected products (a random variable), represents the defect rate in the out-of-control state, and the expected value estimates the average inspection effort required. By assuming is small and is not too close to the lot size , truncation effects are ignored for analytical simplicity, allowing for efficient computation. This approach also aims to estimate the deterioration threshold, as a higher implies a more thorough examination of the production lot to identify where defects originated, thereby restoring system reliability for future cycles.
Lemma 3.
The expected number of inspected items
is strictly increasing and linear in
for
, assuming the defect rate
is constant.
Proof.
From the negative binomial distribution, , where is the conformance probability. The first derivative , indicating strict monotonicity, and the second derivative is zero, confirming linearity. This property implies that increasing proportionally raises inspection and reworking effort, impacting and . □
3.6. Expected Total Cost (TC)
In this research, the expected total cost per unit serves as the primary objective for optimizing the inspection schema within imperfect production systems operating in an assemble-to-order environment. The total cost integrates five key components. These components collectively account for the dynamic interactions of system deterioration (modeled by a Weibull power law process), negative binomial sampling, learning effects in production, and Bayesian demand estimation to address market uncertainty. The mathematical formulation of the total cost is as follows:
By deriving the first derivative and setting it to zero, the model identifies numerically, with convexity ensured by a positive second derivative. This mathematical approach provides analytical insights, such as sensitivity to (where higher defect rates reduce the optimal ) and (where longer warranties increase to ensure quality), thereby facilitating practical decision-making in production systems.
Proposition 2.
The expected total cost per unit function
is convex in
for
, under the assumptions that all cost parameters (,
,
,
,
,
,
,
) are positive, the learning parameters satisfy
and
, the defect rate
, the proportion
(typical for partial inspections), and other parameters (e.g., ,
,
,
,
) are positive with
for increasing failure rates.
Proof.
To establish convexity, we demonstrate that the second derivative for . The total cost comprises PC, ICC, IHC, WC, and RWC. We analyze the second derivative of each component, noting that IHC is independent of (thus the second derivative = 0), and ICC and RWC are linear in via (a constant multiplier), yielding second derivatives of 0 for these terms. Convexity thus arises from the positive second derivatives of PC and WC. Since > 0, > 0, and the second derivatives of ICC, IHC, and RWC are 0 (linear or constant in κ), the total > 0. Thus, is strictly convex in , guaranteeing a unique global minimum at where . □
In conclusion, the developed model provides a comprehensive mathematical framework for optimizing inspection schemes in imperfect production systems under ATO configurations. By integrating the Weibull power law process to model deterioration, negative binomial sampling for efficient quality checks, Bayesian posterior estimation for handling demand uncertainty, and a learning curve for cost reductions, the approach addresses the multifaceted challenges of balancing operational efficiency, product reliability, and financial viability. The total cost function , which aggregates production costs adjusted for learning effects, inspection and correction expenses, inventory holding based on posterior demand , warranty liabilities derived from failure rates and , and reworking costs for non-conforming items, serves as the core optimization objective. The convexity of this function ensures the existence of a unique optimal , facilitating numerical solutions that minimize expected costs while mitigating risks associated with defect propagation and market variability. This model extends beyond traditional static approaches by incorporating dynamic elements such as time-dependent failure rates and experiential learning, thereby providing a more realistic representation of modern manufacturing environments.
4. Application and Numerical Analysis
To demonstrate the practical applicability of the proposed inspection schema, we present a hypothetical case study involving a manufacturer in the electronics industry operating within an ATO environment. This manufacturer specializes in producing customized consumer gadgets, such as smart home devices, where demand is highly variable and driven by individual customer orders. The production system is imperfect, subject to gradual deterioration over time, which can shift the process from an in-control state—where products are generally conforming with low defect rates—to an out-of-control state, resulting in a higher incidence of non-conforming items. This deterioration is influenced by factors such as machine wear, material variability, and operator fatigue, necessitating a robust quality control strategy to maintain product reliability while managing costs.
In this scenario, the manufacturer prepares a production lot to fulfill anticipated orders, but inevitable defects arise during the manufacturing process due to the system’s inherent imperfections. To mitigate the risk of shipping faulty products, the firm implements a targeted inspection protocol at the end of each production cycle. Specifically, if the system is detected as out-of-control—based on probabilistic indicators of deterioration—the inspection begins in reverse order from the last produced item, employing negative binomial sampling. This method continues until a predetermined number of conforming items are identified, enabling the manufacturer to efficiently pinpoint the onset of defects without inspecting the entire lot. Items identified as conforming proceed directly to inventory or shipment, while those deemed non-conforming are segregated for further evaluation.
Given the presence of defects in the process, non-conforming items must undergo rework to restore them to acceptable quality standards before they can be sold. This rework involves corrective actions such as component replacement, recalibration, or minor repairs, which incur additional costs but prevent outright waste and enable the recovery of otherwise lost value. The reworked products are then reintegrated into the conforming inventory, ensuring that the manufacturer maximizes output from each production run. This step is particularly critical in an ATO setting, where overproduction is minimized to align with demand, and any defects could lead to delays in fulfilling custom orders, potentially harming customer satisfaction and the company’s reputation.
Furthermore, once the gadgets are sold, the manufacturer provides a warranty obligation to cover potential failures during a specified period. This warranty serves as a commitment to product quality but also introduces post-sale liabilities. The failure rates of sold products are directly influenced by the production state’s conditions: items produced during the in-control state exhibit lower failure rates, reflecting stable processes and reliable outputs, whereas those from the out-of-control state are prone to higher failure rates due to embedded defects. Even reworked items, while improved, may carry residual risks if they originate from deteriorated phases. To manage these risks, the inspection scheme helps reduce the proportion of out-of-control products reaching customers, thereby lowering expected warranty claims and associated repair costs.
Incorporating learning effects, the manufacturer benefits from accumulated experience in inspections, which gradually enhances production efficiency and reduces unit manufacturing costs over successive cycles. Operators learn by identifying and correcting defects, leading to process improvements that prevent future deterioration. Additionally, Bayesian demand estimation is employed to update inventory decisions based on prior market data and recent observations, minimizing mismatches between production output and actual orders. This adaptive approach helps avoid excess inventory holding in cases of overestimated demand, as well as shortages that could necessitate rushed, error-prone production.
Through this application, the manufacturer achieves a balance between quality assurance and cost efficiency. For instance, in scenarios with elevated defect rates—perhaps due to supply chain disruptions affecting material quality—increasing the intensity of sampling inspections ensures that fewer defective items reach the market, although it raises short-term inspection and rework expenses. Conversely, extending warranty periods incentivizes more rigorous upfront controls to mitigate potential long-term liabilities. Overall, the model demonstrates robustness in handling uncertainties, promoting sustainable operations by reducing waste through rework and aligning production with demand-driven realities. This hypothetical example underscores the model’s value in real-world manufacturing, where integrating inspection, rework, and warranty management can significantly enhance operational performance and customer trust. The related parameter values for the hypothetical case can be seen in Table 3.
Table 3.
Parameter Values for the Case.
After performing the calculations for the case, Table 4 compares the results from the prior analysis, based on expert estimates without market sampling, and the posterior analysis, which updates these estimates with collected data. In both analyses, the probability of the production system being out-of-control is estimated at 0.297811, while the probabilities associated with in-control and out-of-control products are 0.0791602 and 0.632121, respectively. These probabilities remain consistent, reflecting the underlying Weibull deterioration process that is not directly updated by demand data. The prior analysis uses an expert-estimated mean market demand of = 2100 units per production cycle, yielding an optimal number of conforming items = 463.6 and a minimum total cost per unit = $41.16. However, if decision-makers seek greater confidence by incorporating market sampling data, the posterior analysis refines the demand estimate to = 1952.39. This adjustment increases the optimal to 495.5, indicating a need for more rigorous inspection to better align with the revised, lower demand forecast, while reducing to $40.57. The cost reduction demonstrates the value of Bayesian updating in mitigating demand uncertainty, leading to more efficient inventory management and lower overall expenses despite the increased sampling effort. In addition, Figure 2 illustrates the total cost per unit TC as a function of under the base parameters for the prior analysis, displaying a convex U-shaped curve with a minimum at ≈ 464. The initial decline in TC reflects the benefits of learning-driven production cost reductions and decreased warranty liabilities from improved quality detection, while the subsequent rise is attributed to escalating inspection and reworking costs as κ grows excessively.
Table 4.
Comparison of Prior and Posterior Analysis Results in Bayesian Analysis.
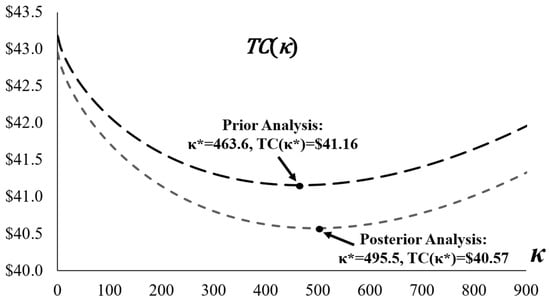
Figure 2.
Comparison of Prior Analysis versus Posterior Analysis.
Figure 3 presents a sensitivity analysis of the total cost per unit, TC(κ), curves under varying defect rates, , in the out-of-control state of the production system. The values are set at 0.03, 0.04, 0.05, 0.06, 0.07, and 0.08. The figure demonstrates that all curves maintain convexity, exhibiting a U-shaped pattern where TC initially decreases as increases—due to improved quality detection and learning-driven cost reductions—before rising again because of escalating inspection and rework expenses. As increases, the entire TC curve shifts upward, indicating higher overall costs attributable to increased defect probabilities that elevate warranty and rework liabilities. Concurrently, the optimal (the point of minimum TC) shifts leftward, decreasing from higher values at low (e.g., around 800–900 for = 0.03) to lower values at high (e.g., around 200 for = 0.08). This shift reflects the model’s recommendation for reduced sampling effort to avoid disproportionate cost inflation in more defective environments. In addition, please note that the parameter ranges used in the numerical analysis are selected to reflect industry-standard operating conditions typically observed in well-managed production systems, rather than extreme or atypical scenarios.
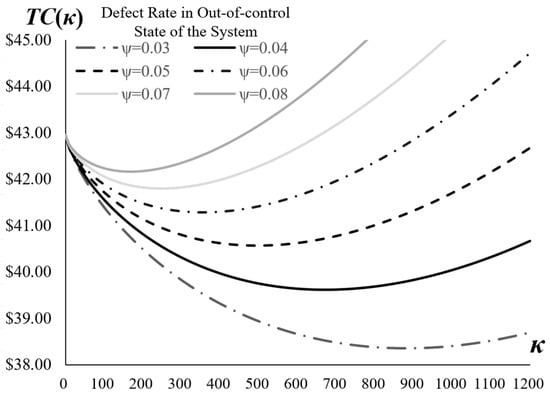
Figure 3.
Comparison of the TC(κ) Curves at Different Defect Rates ψ.
Figure 4 illustrates the sensitivity of the optimal total cost, TC(κ*), to variations in five key production-related parameters: basic manufacturing cost (), first-unit manufacturing cost under the learning curve (), learning factor (), shrinkage constant in the learning curve (), and unit inventory holding cost (). Each parameter is perturbed from −30% to +30% relative to its base value. The analysis reveals distinct impacts: increases in lead to substantial reductions in TC*, as a higher shrinkage constant enhances the learning effect, accelerating cost efficiencies in production and offsetting other expenses. Conversely, increases in result in pronounced rises in TC*, reflecting the amplified baseline for learning-adjusted manufacturing costs that propagate through the system. Parameters such as and show moderate positive sensitivities, with higher values driving up TC* due to elevated direct production and storage costs, while exhibits a negative slope, indicating that stronger learning rates contribute to cost savings but with diminishing marginal returns. Notably, fluctuations in (reworking cost per non-conforming item), though not directly plotted here, interact with these parameters in the broader model; decision-makers should monitor such cost items closely to maintain effective control over total expenses and operational stability.
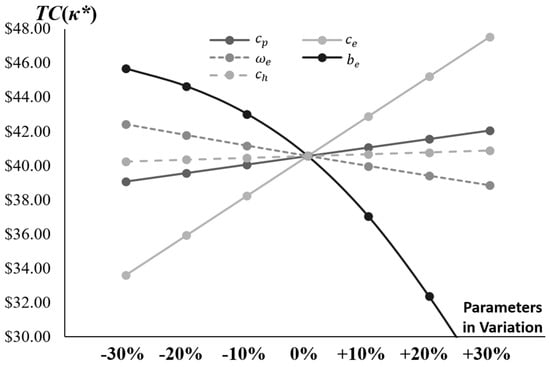
Figure 4.
Comparison of TC(κ*) Across Different Parameter Variations (, , , , ).
Figure 5 illustrates the sensitivity of TC(κ*) to variations in five inspection and maintenance-related parameters: system inspection cost (), system correction cost (), unit product inspection cost (), unit failure repair cost (), and reworking cost per non-conforming item (), each perturbed from −30% to +30%. The results indicate that increases in and cause the most significant rises in TC*, as these costs directly increase warranty and rework liabilities in deteriorating systems, highlighting their critical role in post-production risk management. Parameters such as , , and exhibit positive but less pronounced sensitivities, with higher values raising TC* through greater upfront quality assurance expenses. Therefore, decision-makers must closely monitor fluctuations in these cost components, especially and , to ensure proactive cost control and alignment with the model’s objective of minimizing overall expenses amid uncertainty.
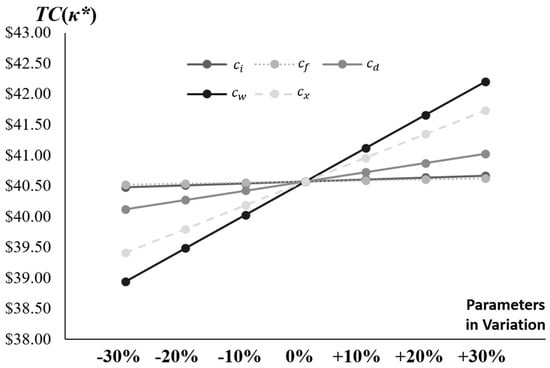
Figure 5.
Comparison of TC(κ*) Across Different Parameter Variations (, , , , ).
Figure 6 presents a contour plot of the optimal total cost, TC(κ*), across different production cycle times (T) and production rates (P), providing a visual representation of cost variations under varying operational conditions. The plot reveals that the lowest TC values, falling below $35 per unit, occur in the upper-left region where T is short and P is high. This aligns with intuitive expectations, as shorter cycles and higher production rates enhance efficiency by reducing idle time and spreading fixed costs over more units. The contour lines, indicating constant cost levels (e.g., $35, $37.5, $42.5, $47.5, $52.5, and $55), offer valuable insights for decision-makers by delineating trade-offs between T and P at equivalent costs. For instance, a decision-maker can maintain a TC of approximately $42.5 by either operating at T = 4 and P = 800 or at T = 6 and P = 600, highlighting the substitutability of these parameters to achieve cost stability.
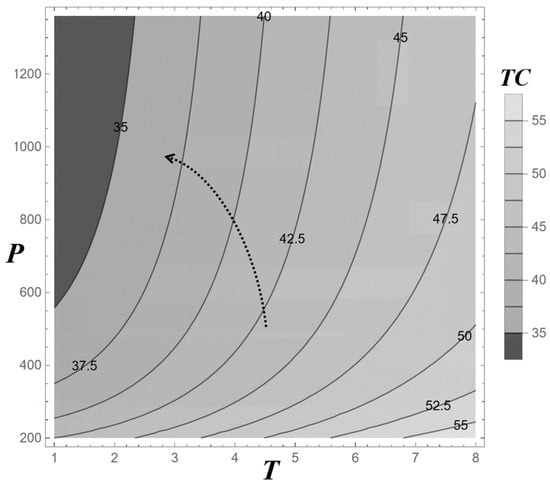
Figure 6.
Contour Plot of TC(κ*) at Different Production Cycle Times (T) and Production Rates (P).
Figure 7 presents a contour plot of the optimal total cost, TC(κ*), across different shape (δ) and scale (σ) parameter values of the Weibull distribution modeling production system degradation. The lowest TC values, approximately $35, are observed in the upper-right region where both δ and σ are relatively high. This suggests that higher shape and scale parameters, indicative of accelerated deterioration and increased failure intensity, can lead to a cost minimum when the model adjusts sampling strategies accordingly, likely by optimizing κ* to mitigate intensified defect risks. The contour lines (e.g., $40, $45, $50, $55, and $60) demonstrate a positive correlation between TC and these parameters in this region, with costs increasing as δ and σ decrease toward the lower-left. However, the relationship is not strictly linear; the left half of the plot exhibits a steeper cost gradient compared to the right, reflecting the nonlinear and complex dynamics of the degradation function. Decision-makers must leverage data analysis to discern the varying trade-offs between δ and σ across different value ranges, ensuring cost optimization through precise parameter tuning.
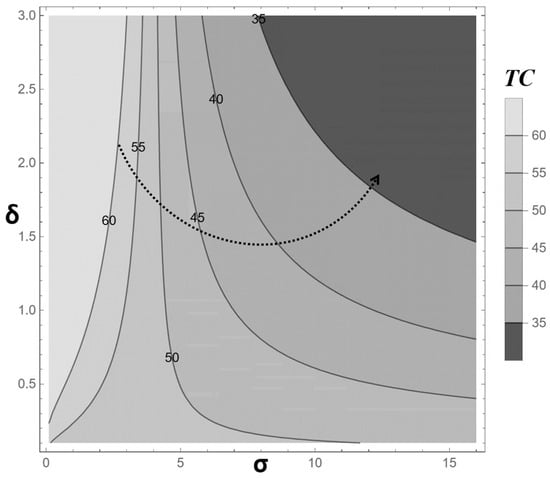
Figure 7.
Contour Plot of TC(κ*) at Different Shape and Scale Parameter Values (σ, δ) of the Production System Degradation.
Figure 8 presents two contour plots that examine the impact of defect rates (ψ) in conjunction with product warranty terms (ν) and production learning factors () on the optimal total cost, TC(κ*). The left plot explores the relationship between ψ and ν, revealing a trade-off dynamic. Lower TC values, approximately $35, are concentrated in the lower-left region where ψ is low (e.g., 0.05) and ν is short (e.g., 5). This indicates that maintaining a low defect rate allows for longer warranty periods without significantly increasing costs. As ψ increases, the contours shift upward (e.g., to $50–$65), suggesting that to sustain the same cost level, a higher defect rate requires a reduction in warranty duration. This trade-off presents a strategic challenge for decision-makers, as shortening warranties to offset defect-related costs may reduce product demand and sales volume, potentially eroding profit margins. Therefore, this substitution effect demands careful consideration in operational planning.
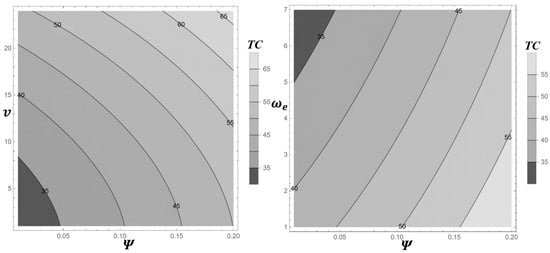
Figure 8.
Contour Plot of TC(κ*) at Different Defect Rates (ψ), Product Warranty Terms (ν), and Production Learning Factors ().
The right plot analyzes the interaction between ψ and , with TC ranging from $35 to $55. The lowest costs are observed in the upper-left region, where is high (e.g., 6) and ψ is low (e.g., 0.04). This indicates that a strong learning effect mitigates cost pressures from defects by reducing production expenses. As ψ increases, the cost contours rise; however, higher values (e.g., 4–6) moderate this increase, demonstrating that enhanced learning can buffer the financial impact of rising defect rates. These findings suggest that investing in operator training and process improvements can be a cost-effective strategy for managing quality risks in deteriorating systems.
Figure 9 presents two contour plots illustrating the effects of the number of conforming items (κ) and production learning factors () on total cost (TC) and production cost (PC). The left plot shows TC varying from $36 to $48, with the lowest values (e.g., $36) located in the lower-left region where κ is low (e.g., 200) and is high (e.g., 6). However, the lower-right region (e.g., κ = 600–1000, = 2) deviates from a simple trade-off, as increasing both κ and simultaneously does not consistently reduce TC—values such as $44, $46, and $48 persist—indicating that TC is influenced by additional factors beyond production costs, including inspection and warranty expenses.
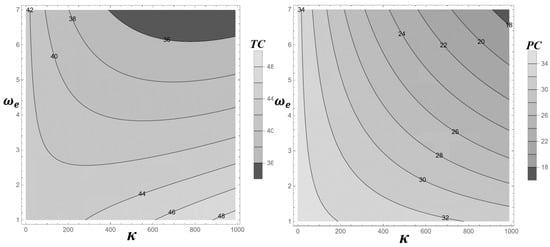
Figure 9.
Contour Plot of TC(κ) and PC(κ) at Different Number of Conforming Items (κ) and Production Learning Factors ().
The right plot focuses on PC, which ranges from 18 to 34, revealing a clear substitution effect. Lower PC values (e.g., $18) occur when κ is high (e.g., 1000) and is low (e.g., 2), or vice versa (e.g., κ = 200, = 6). This suggests that a higher number of conforming items can compensate for a weaker learning effect, and vice versa, to maintain production cost stability. This monotonic relationship in PC contrasts with the complexity of TC, underscoring the need for a comprehensive cost model that incorporates all operational components in decision-making.
5. Conclusions
This research addresses the persistent challenges in managing imperfect production systems, where deterioration processes—modeled using the Weibull power law—create ongoing tensions between maintaining product quality and controlling operational costs. By introducing an innovative inspection scheme specifically designed for assemble-to-order environments, this study integrates a learning curve to enhance production efficiency through accumulated experience and employs Bayesian demand estimation to manage market uncertainties. The scheme utilizes negative binomial sampling, conducting inspections in reverse order from the end of a production lot until an optimal number of conforming items is identified, thereby minimizing the expected total cost across components such as production, inspection, inventory holding, warranty, and rework.
Numerical validation using the data of a hypothetical case from a representative scenario demonstrates the model’s practicality. The comparison between prior and posterior analyses highlights the strength of Bayesian methods: starting with expert-based demand estimates, the prior analysis determines an optimal sampling level and the associated total cost per unit. Incorporating actual market sampling data in the posterior analysis refines these estimates, resulting in a slightly higher optimal sampling effort and a noticeable reduction in total cost. This refinement illustrates how data-informed updates improve the alignment between production decisions and actual demand patterns, promoting better inventory control and resource allocation. The consistent probabilities for system and product states across both analyses confirm the robustness of the Weibull framework in modeling degradation, regardless of demand fluctuations.
Sensitivity analyses further demonstrate the model’s responsiveness to key parameters. For example, variations in defect rates preserve the convexity of cost curves, with higher defect rates increasing overall costs and shifting the optimal sampling point toward reduced effort. This adjustment helps mitigate escalating rework and warranty burdens in more error-prone environments. Cost sensitivities highlight the critical role of learning-related factors: strengthening the shrinkage constant in the learning curve significantly lowers total costs by accelerating efficiency gains, whereas increases in initial manufacturing or failure repair costs most prominently drive up expenses. This underscores the importance of vigilant oversight of rework and post-sale liabilities. Contour visualizations offer nuanced insights into parameter interactions. When examining production cycle times and rates, the plots reveal that minimal costs occur when cycles are short and rates are high. The contour lines illustrate practical trade-offs, enabling managers to maintain equivalent cost levels by adjusting one parameter to compensate for changes in the other, for instance, extending cycle times while increasing rates.
Similarly, degradation parameters exhibit complex, nonlinear dynamics, with the lowest costs occurring when both shape and scale values are relatively high. This prompts adaptive sampling to mitigate intensified failure risks. Interactions between defect rates and warranty terms reveal critical trade-offs: low-defect environments allow for longer warranties without significant cost increases, whereas higher defect rates necessitate shorter warranty terms to maintain cost balance—although this may reduce customer appeal and sales. Learning factors provide a buffer in this context, as stronger learning effects can alleviate pressures from rising defects by reducing production costs. Finally, contrasts between production-specific costs and total costs highlight substitution possibilities: while production costs demonstrate straightforward trade-offs between sampling intensity and learning strength (where a higher value in one offsets a lower value in the other), total costs introduce additional complexity. In this case, increasing both simultaneously does not always lead to cost reductions due to interactions with inspection and warranty components.
These insights provide actionable guidance for managers seeking to optimize imperfect systems. Primarily, prioritizing investments in learning mechanisms—such as training programs or process feedback—can yield significant efficiency improvements, especially in defect-prone environments, by mitigating broader cost pressures. Adopting Bayesian demand updates encourages the routine collection of market data to refine forecasts, thereby preventing mismatches that increase inventory or shortage risks. Close monitoring of defect rates and warranty policies is crucial: elevated defect levels require streamlined sampling to limit liabilities, while warranty extensions demand upfront quality investments to protect long-term financial health, all while considering their effects on customer loyalty and revenue. In assemble-to-order operations, favoring shorter cycles and higher throughput reduces costs, but managers must balance these factors against demand variability to maintain flexibility. The nonlinear patterns observed in contour analyses caution against simplistic assumptions, instead advocating for simulation-based tools to enable tailored parameter adjustments.
The proposed framework effectively bridges theoretical inspection models with practical operational needs in imperfect production systems, demonstrating key strengths in integrating learning effects and Bayesian demand estimation to enhance decision-making. By leveraging simulated scenarios to explore a wide range of parameters and sensitivities, the approach showcases its flexibility and robustness, laying a solid foundation for real-world applications while emphasizing the value of data-driven refinements in cost optimization.
In this study, inspection is assumed to be perfect, with no false positives or false negatives. This assumption enables analytical tractability and provides clear structural insights into the optimal inspection policy. However, incorporating inspection misclassification errors into the proposed framework represents a significant avenue for future research, as it would enhance the model’s realism and applicability in practical settings. Beyond this limitation, several additional research directions warrant consideration. Future studies could employ Bayesian analysis or expectation–maximization (EM) algorithms to estimate parameters in reliability modeling of production systems, allowing for a more accurate characterization of deterioration dynamics. The framework could also be extended to multi-tier supply chains to account for supplier-side uncertainties and improve coordination across the broader production ecosystem. Moreover, integrating sustainability considerations—such as the environmental impacts associated with rework, scrap, and reverse logistics—would increase the model’s relevance in environmentally conscious manufacturing contexts. Finally, extending the framework to multi-product co-line systems, where capacity sharing, setup changes, and sequencing decisions interact with inspection planning, would enable inspection optimization to be coordinated with production scheduling in more complex operational environments.
Author Contributions
Conceptualization, M.-N.C. and C.-C.F.; Data Curation, M.-N.C. and C.-C.F.; Formal Analysis, M.-N.C. and C.-C.F.; Funding Acquisition, M.-N.C.; Investigation, C.-C.F.; Methodology, M.-N.C. and C.-C.F.; Project Administration, M.-N.C. and C.-C.F.; Resources, M.-N.C. and C.-C.F.; Supervision, M.-N.C.; Writing—Review and Editing, M.-N.C. and C.-C.F. All authors have read and agreed to the published version of the manuscript.
Funding
This work was supported by the Guangdong Basic and Applied Basic Research Foundation and the Guangdong Soft Science Foundation, China [grant number 2024A0505050043].
Data Availability Statement
The original contributions presented in this study are included in the article. Further inquiries can be directed to the corresponding author.
Conflicts of Interest
The funders had no role in the design of the study; in the collection, analyses, or interpretation of data; in the writing of the manuscript; or in the decision to publish the results.
References
- Ben-Daya, M.; Hariga, M. Economic lot scheduling problem with imperfect production processes. J. Oper. Res. Soc. 2000, 51, 875–881. [Google Scholar] [CrossRef]
- Hsu, L.F.; Kuo, S. Design of optimal maintenance policies based on on-line sampling plans. Eur. J. Oper. Res. 1995, 86, 345–357. [Google Scholar] [CrossRef]
- Park, M. Combined class of distributions with an exponentiated Weibull family for reliability application. Qual. Technol. Quant. Manag. 2023, 20, 671–687. [Google Scholar] [CrossRef]
- Wang, L.; Zhao, W.; Liu, B.; Li, Y.F. Reliability assessment for partially monitored systems based on degradation hidden Markov models with time-varying parameters. IEEE Trans. Reliab. 2025, 74, 5272–5286. [Google Scholar] [CrossRef]
- Afrinaldi, F.; Pratama, H.B. Selecting the best quality inspection alternative based on the quality, economic and environmental considerations. Qual. Manag. J. 2020, 28, 2–16. [Google Scholar] [CrossRef]
- Fang, C.C.; Ma, L.; Kuo, W. Bayesian analysis enhances sales and warranty strategies for repairable industrial products by considering hybrid deterioration modes. IEEE Access 2025, 13, 72169–72188. [Google Scholar] [CrossRef]
- Ho, J.W.; Huang, Y.S. Cost allocation with learning and forgetting considerations in a monopolistically competitive market. Int. J. Syst. Sci. 2010, 41, 1133–1144. [Google Scholar] [CrossRef]
- Moon, I.; Giri, B.C.; Choi, K. Economic lot scheduling problem with imperfect production processes and setup times. J. Oper. Res. Soc. 2002, 53, 620–629. [Google Scholar] [CrossRef]
- Sarkar, B.; Sett, B.K.; Sarkar, S. Optimal production run time and inspection errors in an imperfect production system with warranty. J. Ind. Manag. Optim. 2018, 14, 267–282. [Google Scholar] [CrossRef]
- Insua, D.R.; Ruggeri, F.; Soyer, R.; Wilson, S. Advances in Bayesian decision making in reliability. Eur. J. Oper. Res. 2020, 282, 1–18. [Google Scholar] [CrossRef]
- Macedo, J.B.; Maior, C.S.; Lins, I.D.; Azevedo, R.; das Chagas Moura, M.; da Silva, M.F.; da Silva Nóbrega, M.V.; Vitale, G.; Vasques, R.R. Using experts’ opinion for Bayesian prior reliability distribution of on-demand equipment: A case study of a novel sliding sleeve valve for open-hole wells. Reliab. Eng. Syst. Saf. 2023, 238, 109430. [Google Scholar] [CrossRef]
- Abd Al Rahman, M.; Mousavi, A. A review and analysis of automatic optical inspection and quality monitoring methods in electronics industry. IEEE Access 2020, 8, 183192–183271. [Google Scholar] [CrossRef]
- Rezaei-Malek, M.; Mohammadi, M.; Dantan, J.-Y.; Siadat, A.; Tavakkoli-Moghaddam, R. A review on optimisation of part quality inspection planning in a multi-stage manufacturing system. Int. J. Prod. Res. 2019, 57, 4880–4897. [Google Scholar] [CrossRef]
- Cheng, G.Q.; Zhou, B.H.; Li, L. Integrated production, quality control and condition-based maintenance for imperfect production systems. Reliab. Eng. Syst. Saf. 2018, 175, 251–264. [Google Scholar] [CrossRef]
- Hajej, Z.; Rezg, N.; Gharbi, A. Joint production preventive maintenance and dynamic inspection for a degrading manufacturing system. Int. J. Adv. Manuf. Technol. 2021, 112, 221–239. [Google Scholar] [CrossRef]
- Fang, C.C.; Hsu, C.C.; Liu, J.H. Bayesian statistical method enhances the decision-making for imperfect preventive maintenance with a hybrid competing failure mode. Axioms 2022, 11, 734. [Google Scholar] [CrossRef]
- Fang, C.C. Bayesian decision making in determining optimal leased term and preventive maintenance scheme for leased facilities. J. Ind. Manag. Optim. 2020, 17, 3445–3473. [Google Scholar] [CrossRef]
- Kolus, A.; Duffuaa, S. Determining optimal process means in a multi-stage production system with inspection errors in 100% inspection. Qual. Technol. Quant. Manag. 2025, 22, 105–130. [Google Scholar] [CrossRef]
- Zhang, N.; Tian, S.; Xu, J.; Deng, Y.; Cai, K. Optimal production lot-sizing and condition-based maintenance policy considering imperfect manufacturing process and inspection errors. Comput. Ind. Eng. 2023, 177, 108929. [Google Scholar] [CrossRef]
- Rezaei-Malek, M.; Tavakkoli-Moghaddam, R.; Siadat, A.; Dantan, J.-Y. A novel model for the integrated planning of part quality inspection and preventive maintenance in a linear-deteriorating serial multi-stage manufacturing system. Int. J. Adv. Manuf. Technol. 2018, 96, 3633–3650. [Google Scholar] [CrossRef]
- Ghosh, D.; Rout, C.; Goswami, A. A model of an integrated supply chain with imperfect production, product deterioration, and quality inspection errors. Sādhanā 2024, 49, 187. [Google Scholar] [CrossRef]
- Sepehri, A.; Mishra, U.; Sarkar, B. A sustainable production-inventory model with imperfect quality under preservation technology and quality improvement investment. J. Clean. Prod. 2021, 310, 127332. [Google Scholar] [CrossRef]
- Tripathi, H.; Al-Omari, A.I.; Saha, M.; Mali, A. Time truncated life tests for new attribute sampling inspection plan and its applications. J. Ind. Prod. Eng. 2022, 39, 293–305. [Google Scholar] [CrossRef]
- Wang, T.C.; Wu, C.W.; Hsu, B.M.; Shu, M.H. An integrated failure-censored sampling scheme for lifetime-performance verification and validation under a Weibull distribution. Qual. Eng. 2022, 34, 82–95. [Google Scholar] [CrossRef]
- Yuan, X.X.; Higo, E.; Pandey, M.D. Estimation of the value of an inspection and maintenance program: A Bayesian gamma process model. Reliab. Eng. Syst. Saf. 2021, 216, 107912. [Google Scholar] [CrossRef]
- Lee, H.H.; Li, C. Supplier quality management: Investment, inspection, and incentives. Prod. Oper. Manag. 2018, 27, 304–322. [Google Scholar] [CrossRef]
- Kovalyov, M.Y.; Lukashevich, M.N.; Pesch, E. Cost minimizing planning of container inspection and repair in multiple facilities. OR Spectr. 2023, 45, 181–204. [Google Scholar] [CrossRef]
- Ho, J.W. Quality inspection plan for imperfect production system with assembly configuration. Processes 2020, 8, 1545. [Google Scholar] [CrossRef]
- Salas-Navarro, K.; Acevedo-Chedid, J.; Árquez, G.M.; Florez, W.F.; Ospina-Mateus, H.; Sana, S.S.; Cárdenas-Barrón, L.E. An EPQ inventory model considering an imperfect production system with probabilistic demand and collaborative approach. J. Adv. Manag. Res. 2020, 17, 282–304. [Google Scholar] [CrossRef]
- Fang, C.C.; Chen, M.N. Integrated Quality Inspection and Production Run Optimization for Imperfect Production Systems with Zero-Inflated Non-Homogeneous Poisson Deterioration. Mathematics 2025, 13, 3901. [Google Scholar] [CrossRef]
- Salmasnia, A.; Hajihosseini, Z.; Maleki, M.R. Joint design of control chart, production cycle length, and maintenance schedule for imperfect manufacturing systems with deteriorating products under stochastic shift size. J. Adv. Manuf. Syst. 2022, 21, 639–669. [Google Scholar] [CrossRef]


Disclaimer/Publisher’s Note: The statements, opinions and data contained in all publications are solely those of the individual author(s) and contributor(s) and not of MDPI and/or the editor(s). MDPI and/or the editor(s) disclaim responsibility for any injury to people or property resulting from any ideas, methods, instructions or products referred to in the content. |
© 2026 by the authors. Licensee MDPI, Basel, Switzerland. This article is an open access article distributed under the terms and conditions of the Creative Commons Attribution (CC BY) license.