Abstract
Overdispersion is a major problem in the context of count data analysis, and the classical Poisson regression estimators are, in general, unreliable since they imply that the mean equals its variance. In this article, an event-driven class of average estimators, which is based on the Poisson–inverse Gaussian (P-IG) regression model, is formulated to overcome this shortcoming. P-IG regression is a mixture of Poisson and inverse Gaussian regression that is modeled to deal with the overdispersion that is often found in real data. It approximates such count data by a compound distribution with a heavy-tailed inverse Gaussian component. Suggested estimators are more effective in estimating the population means in situations of overdispersion using auxiliary data in the form of covariates. The design-based framework specifies the statistical properties of proposed estimators with respect to their bias and mean squared error (MSE). To confirm the effectiveness and the strength of the suggested methodology, a reasonable amount of simulations and real-data applications are carried out, contrasting it with customary Poisson-based estimators. The results indicate that the P-IG-based estimators are superior over their counterparts. The study provides a statistically valid and practically useful breakthrough in survey sampling and count data regression that can provide researchers and practitioners with a strong alternative to classical Poisson-regression-based mean estimator procedures.
MSC:
62D05
1. Introduction
At every stage of a typical research process, conducting a sample survey is the initial step because it is a fundamental method for gathering data. Interviews may be conducted virtually or in person; arranged by individuals or groups; and conducted via mail, telephone, or in person methods. A questionnaire is one of the research instruments used across various disciplines, including education, medicine, economics, labor studies, industry studies, business studies, animal studies, and environmental studies. Personal, telephone, postal, and web-based surveys are the most common methods for conducting a survey. Surveys may be ineffective if flawed data collection methods are used. For this reason, the methods of data collection should be accurate to yield valid conclusions. As a result, developing an action plan based on strategic data collection approaches can significantly increase the quality of research and enhance the accuracy of results. Utilizing auxiliary technical variables closely related to the primary research variable can enhance the model and yield more valid and stable results [,,].
Sampling theory is distinct from other statistical theories in that it is based on supplementary information to maximize estimation accuracy. Auxiliary information is typically featured during different stages of a sampling study, including stratification and determination of selection probabilities, to maximize the effectiveness of population parameter estimation. Generally, the objective of surveys is to estimate the population total or mean. There are several techniques that have been suggested by researchers in using auxiliary information and improving the accuracy of population average estimation; see [,,,]. In the case of a direct relationship between supplementary and primary variables, regression and ratio estimators are particularly notable for estimating the population mean.
Nevertheless, classical techniques tend to become less accurate when extreme values or outliers in the data set come into play. To solve these shortcomings, effective ratio and regression-based techniques have been suggested in the estimation of means. Moreover, many sophisticated methods that specifically account for extreme values in augmented datasets have been designed. For example, Oral and Oral [] treat the deficiencies of the classical ratio estimator and propose a new one constructed on the modified maximum likelihood (MML) and order statistics. Their estimator is very robust and efficient in non-normal cases. Abid et al. [] explored estimating the population mean by employing unconventional location parameters. Zaman [,] and Bulut and Zaman [] introduced a category of robust ratio estimators by synthesizing the existing ratio estimators. Ref. [] and Ibrahim et al. [] consider the problem of outliers in ratio estimators and employ robust regressions such as LTS, LMS, and Huber estimations. Under data contamination, their results indicate that estimation accuracy has been boosted by a substantial margin compared to the conventional approaches. In addition, the new double-sampling estimator, implied by robust regression methods, was proposed by Zaman and Bulut []. Ref. [] suggested ratio-based estimators employing quantile regression as a replacement for conventional regression estimators. Ali et al. [] obtained estimators through a robust regression technique, which is specifically appropriate in sensitive surveys that can be conducted in simple random samples. More recently, Koc [] came up with the new idea of using the Poisson regression coefficient to estimate means in a specific situation, namely, in the context of count data. Their study is unique because they are concerned with count data and the utilization of Poisson regression in the estimation of ratio-based average estimators.
The basic principle of a useful statistical analysis has been count data modeling and estimation of mean. It can be directly applied in such domains as epidemiology, ecology, economics, and industrial engineering. The Poisson regression model of count outcomes has historically been the statistical workhorse because it is simple in both mathematics and analysis, and because it has a straightforward expression linking the mean of the response variable with its variance (Cameron and Trivedi []). That is one of the reasons that Koc [] came up with the new idea of using the Poisson regression coefficient in mean estimation. After that, many studies extended their work by defining average estimators using the regression coefficient of Poisson. For example, Koc et al. [] extend this work to double sampling. Ref. [] developed a Poisson regression-based estimator of the mean that aims to suit the simple random sampling scenario to count data. Their approach is an indication of the significance of matching estimation methods with the distribution of underlying data. Wani et al. [] proposed an enhanced version of the Koc [] estimator by incorporating power components from Shahzad et al. []. Raghav et al. [] and Alomair and Shahzad [] also extended this idea to Poisson and Tweedie–Poisson regression-based average estimators under probability sampling designed to improve the accuracy of count data.
However, the assumptions of the Poisson distribution do not always hold in the real world due to overdispersion in a data set. This violation may cause an underestimation of the standard errors and lead to inaccurate inference. To overcome these weaknesses, it is necessary to apply a more appropriate regression model that can accommodate dispersion. The P-IG regression model is another useful alternative, and it is a mixture of Poisson and inverse Gaussian. The model retains the simplicity of interpretation of the classical Poisson model and introduces a dispersion parameter to account for extra-Poisson variability; hence, it is particularly effective in fitting overdispersed counts (Sellers and Shmueli []; Farghali et al. []). The principal goal of the current research is to formulate mean estimators on the basis of the P-IG regression coefficient, which is more convenient than the classical Poisson estimators under conditions of overdispersion.
As far as we are aware, no prior research has investigated the problem of mean estimation in sampling theory using the P-IG regression coefficient. This gap is addressed in the present paper, where mean estimators based on the P-IG regression have been derived and tested, and their performance is compared with Poisson regression-based mean estimators. These estimators are based on auxiliary information, i.e., extra covariates or known quantities that enhance the efficiency and accuracy of statistical estimators (Sarndal et al. []; Rao []). The strategic application of auxiliary variables is a well-established procedure in survey sampling and small-area estimation; however, the incorporation of auxiliary variables into more sophisticated regression models involving count data has received relatively little attention. This aspect is also explored in the current research article.
The subsequent parts of the paper are arranged into four parts to discuss how the development and application of robust mean estimators concerning the P-IG regression coefficient are carried out. In Section 2, the background of count regression is reviewed, and the existing estimators developed by Koc [] based on Poisson regression coefficients are explained. Section 3 contains the theory of the P-IG regression, its superiority over the classical equivalents, and the construction of the new family of average estimators, which are more efficient by utilizing auxiliary variable information. Section 4 presents a critical comparison of the developed and classical ones in both simulation and empirical settings using three real-world populations of mussel data and three artificial ones generated using the P-IG distribution. Section 4.3 summarizes the findings, and excellent results of the proposed estimators are indicated. Section 5 offers the conclusion of the study.
2. Poisson Regression for Count Data
It is necessary to understand the context of the main principles of count data regression to appreciate the usefulness of traditional models and the strategic importance of more adaptive ones. Count data are non-negative integer observations that appear in a wide variety of applied situations, such as counting the number of hospital visits, insurance claims, and ecological events that are recorded. The Poisson regression model has traditionally been the preferred choice for modelling such data because it is simple and has a clear interpretive framework. It presupposes that the response variable is Poisson distributed, the average of which is linked with explanatory variables in a log-linear fashion [,].
One of the most popular statistical methods of the count-type data analysis is the Poisson regression model. The method can be used when the dependent variable for represents the frequency of events observed within a fixed duration or spatial domain. considers Poisson distribution with
where
The respective log-likelihood of the set of observations is developed in the following way:
Suppose that X is a predictor matrix of dimension , and is the ith row of . The model relates with the predictors by use of the logarithmic link function:
where signifies regression coefficients.
The log-likelihood is differentiated with respect to the coefficient vector and equated to zero in order to estimate . The maximization of the likelihood leads to the following:
Such a set of nonlinear equations is usually solved using an iterative numerical solution algorithm like the Newton–Raphson or the Fisher scoring algorithm [,].
Mean Estimators Using Poisson Regression
The use of linear regression models to analyze count data is generally inappropriate because negative values of predicted results can occur, and these models do not satisfy the assumptions of constant variance. Such issues can also adversely affect mean estimation. Koc [] attempted to address this problem by proposing ratio estimators for mean estimation that incorporate Poisson regression coefficients.
The ratio-type methods of estimation are beneficial in a survey sampling context where a strong positive correlation exists between the supplementary variable and the research variable. The method was initially introduced by Cochran in the middle of the 1900s, and since then, it has developed to form an essential part of statistical inference. Although it was initially used extensively in agricultural research, it has since been found helpful in a variety of other scientific fields. Interested readers can consult [,,] to know more about ratio estimators and their different variations. Koc’s [] class of ratio-type mean estimators is given below:
where
where
The class has an MSE in Equation (3) that depends on finite population correction (fpc) factor containing population and sample sizes , population averages , sample averages , variances , CV , kurtosis , and co-variance .
3. Formulation of P-IG Regression and Associated Estimators
3.1. P-IG Regression
Poisson regression is widely used; however, in some cases, real data may exhibit repeated failures under the condition that the variance is significantly greater than the mean, which is known as overdispersion. In such situations, the Poisson model, which assumes equality of the mean and variance, performs poorly; the parameters are estimated with bias; the standard errors are underestimated; and, consequently, inference tends to be unreliable (Hilbe []). Although adjustments such as quasi-Poisson and negative binomial models partially account for overdispersion, they often do so at the expense of interpretability. They are also limited in modelling data with both continuous and discrete components. This challenge led us to consider the P-IG regression for mean estimation. It is a mixture of Poisson and inverse Gaussian distributions. The P-IG regression preserves the count data structure while allowing for overdispersion and mixed distributions, which are essential feature for robust mean estimation in complex data sets. It has a probability mass function (PMF) defined as follows:
The foregoing is indeed the mixed-Poisson formulation of the P-IG distribution [,,]. There are also closed-form representations based on the modified Bessel function of the second kind, , and recursive probability formulae that can be expressed in a computational form [,]. The P-IG family extends the Poisson model by introducing a dispersion parameter that inflates the variance , making it suitable for overdispersed count data. When
the mean will be and variance
where is parameter of dispersion. The mean is expressed as a log-linear model of the explanatory variables :
is the regression coefficients vector. The fact that the mean response is always positive, as ensured by the use of the log-link, is also consistent with the count data setting.
Maximum likelihood estimation (MLE) is used to determine the and parameters. The log-likelihood has the following form:
Replacing the PMF, the log-likelihood gets to
The optimization over and is performed numerically through the application of various numerical optimization algorithms such as the Newton–Raphson or BFGS. The optimum value of is then estimated and the final estimates of and are obtained. This estimation step enables the P-IG model to be adaptable and to accommodate a wide range of dispersion and information structures, which is beneficial in particular when the Poisson model assumptions are overly constraining.
3.2. Proposed PIG Regression-Based Estimators
Utilization of auxiliary information in statistical models is a well-known mechanism to improve both the accuracy and effectiveness of parameter estimation processes and is essential in the context of mean estimation in count data analysis. In P-IG regression-based mean estimation, supplementary variables are linked with the research variable, which can greatly reduce the MSE of the estimators. Such variables can be included in the regression model directly, or they can be used during post-estimation calibration processes. They enhance the accuracy of the predicted means , especially in overdispersed or structurally heterogeneous data, whereby the standard Poisson regression is usually inadequate. The P-IG model, , offers a flexible of variance structure that allows the maximum use of the informational worthiness of nuisance variables and could possibly fit with complex data structure. The theoretical and practical importance of the strategic use of supplementary information in the P-IG architecture lies in guaranteeing the robustness of mean estimation based on the foundations of model-assisted estimation and small-area inference (Sarndal et al. []; Rao []). We suggest the following mean estimators based on P-IG-regression with the help of auxiliary information and following Alomair and Shahzad []:
Under the assumption of , where , the expectations are
The simplification of Equation (5), along with its extension in terms of Equation (6), is obtained as
Approximated to :
The bias of , after eliminating and taking expectation, is obtained up to order as
where
From Equation (8), after subtracting , squaring and applying the expectation operator, the MSE of is obtained up to as given below:
where
Table 1 outlines the family members associated with the suggested class . MSE of estimator in the set of j = 1, 2, 3, 4, and 5, is

Table 1.
Variants within the proposed class .
4. Numerical Illustration
This section carries out the comparative performance assessment of the average estimators based on the P-IG and Poisson regression coefficients using three empirical and three simulated datasets.
4.1. Application to Mussel Dataset
We employed the well-known mussel dataset that was initially used by Ref. [] and later by Ref. [] to briefly discuss the empirical performance of the suggested mean estimators derived through the P-IG regression coefficient. This dataset contains N = 44 observations and only one response variable, which is a count-based variable representing the number of species of mussels (y), along with several explanatory variables that depend on the geographical, ecological, and chemical parameters of river environments. As complementary variables among these explanatory variables, we used the river system indicators, i.e., the Alabama–Coosa (AC), Savannah (SV), and Apalachicola (AP) systems. Due to the count nature of the response, the P-IG regression coefficient is especially appropriate because it allows for the overdispersion that appears so often in ecological count data.
There are a number of reasons why this dataset as an empirical platform is suitable for our study: First, the assumptions used in the P-IG framework are satisfied by the discrete and overdispersed response (study) variable. Second, the data contains a variety of auxiliary covariates, which allow us to evaluate how extra information influences the accuracy of mean estimation.
To analyze the estimators, three populations was assumed from mussel data:
- Population 1: the number of mussel species and Alabama–Coosa river system (AC).
- Population 2: the number of mussel species and Savannah river system (SV).
- Population 3: the number of mussel species and Apalachicola river system (AP).
4.2. Simulation Design
In order to evaluate the behavior of in diverse scenarios, we systematically generated datasets according to the P-IG distribution that represents a flexible family of models adapted for overdispersed counts and possesses the properties of both a discrete and continuous part. The generated data contain 100 observations of (). The covariate x, which was supposed to approximate environmental or spatial gradients (e.g., distance to a source, pollution index), was produced by an integer-valued uniform random variable over the range and ordered in descending order to reflect the monotonic decreasing trend observed in actual ecological field studies. The response variable y for three artificial populations were then modeled to depend inversely on x via a linear mean functions with added stochastic noises:
In the above expression, indicates conditional mean of response variable given covariate , and the stochastic error component is given by . It was intended to make it positive, so values were truncated at 0.5 below. The P-IG distribution was then used to generate the outcome variable of each population:
- First simulated population (Population 4):
- Second simulated population (Population 5):
- Third simulated population (Population 6):where () are the dispersion parameters, corresponding to . It is an arrangement that reads count-like properties and overdispersion, which are common in environmental and biological data. The final values of the were rounded to the nearest integer to approximate them as count data, which is typically obtained during field research. In addition to yielding a simulation framework with all the essential statistical properties of real-life ecological data, (P-IG)-based simulation frameworks enable the robust testing of mean estimation procedures in complex, non-Gaussian environments.
Based on reviewer’s suggestion, we have also generated another population using negative binomial distribution (NBD). The response variable y for fourth artificial population was modeled to depend inversely on x as defined earlier via a linear mean function with added stochastic noise:
The NBD was then used to generate the outcome variable of artificial population:
- Fourth simulated population (Population 7):
Note that the results of real-life Populations 1–3, and artificial Populations 4–7 with replications 1000, are available in Table 2, Table 3, Table 4, Table 5, Table 6, Table 7, Table 8, Table 9 and Table 10.
Table 2.
MSE computation with mussel data.
Table 3.
PRE analysis with mussel data from Population 1.
Table 4.
PRE analysis with mussel data from Population 2.
Table 5.
PRE analysis with mussel data from Population 3.
Table 6.
MSE using simulation study.
Table 7.
PRE analysis with simulated data from Population 4.
Table 8.
PRE analysis with simulated data from Population 5.
Table 9.
PRE analysis with simulated data from Population 6.
Table 10.
PRE analysis with simulated data from Population 7.
4.3. Interpretation
As illustrated across Table 2, Table 3, Table 4, Table 5, Table 6, Table 7, Table 8, Table 9 and Table 10, the simulation-based findings and empirical-based findings of the proposed P-IG regression-based mean estimators, which are identified as , show that compared to the traditional Poisson regression-based estimators, which are represented by , the former has a clear advantage in not only the overall MSE but also the PRE.
Table 2 displays the computed MSE values for three real-world populations based on the mussel dataset. The suggested estimators have much smaller MSEs compared to the traditional ones in all three populations. It is worth noting that in all the populations, has the minimal MSE, thus proving to be stronger under overdispersion and the presence of possible outliers. As an example in Population 3, where mussel species are estimated by taking AP as auxiliary variable, leads to an MSE of 8.467741 as opposed to 19.66512 with , emphasizing the practical benefit of using the P-IG-based approach. The PRE of each estimator based on the three populations considered is further expounded in Table 3, Table 4 and Table 5. In Population 1 (Table 3), attains the highest PRE (306.2856) which surpasses all of the conventional estimators. The same efficiency level can be seen in Populations 2 and 3, where was equal to PRE of 236.9314 and 258.0296, respectively (Table 4 and Table 5). These results indicate the increased efficiency of estimation that can be obtained by employing the P-IG regression framework.
Additional evidence can be found in Table 6, which gives the results of the simulation where the MSE values were calculated using three synthetic populations. Once again, the proposed estimators are better, and again has the smallest MSE. In Population 6, the MSE of is 25.53984, and it is much lower than the 36.38091 as obtained by . This advantage is also proved by PRE metrics in Table 7, Table 8, Table 9 and Table 10.
For summarizing all the results, visual comparisons are also provided in Figure 1, Figure 2, Figure 3, Figure 4, Figure 5, Figure 6 and Figure 7. These findings, therefore, confirm the assertion that the suggested P-IG-based averaging estimators are not only conceptually sound but also empirically better. They offer an effective technique for calculating the mean, especially in environments that are overdispersed and contain misdirected values. The consistency of MSE and PRE measures favors the practical use of these estimators in survey sampling and count data analysis.
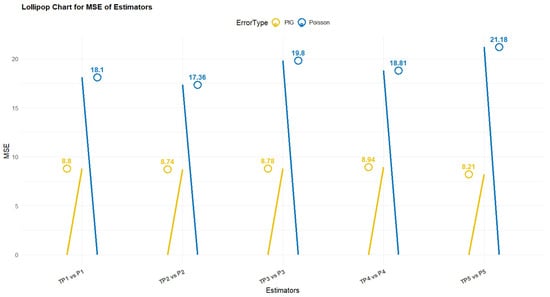
Figure 1.
Performance evaluation based on Population 1.
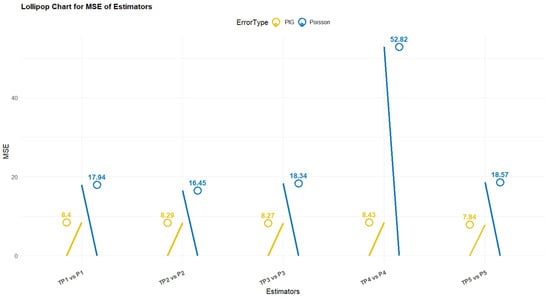
Figure 2.
Performance evaluation based on Population 2.
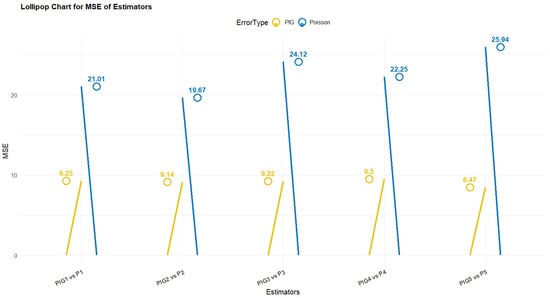
Figure 3.
Performance evaluation based on Population 3.
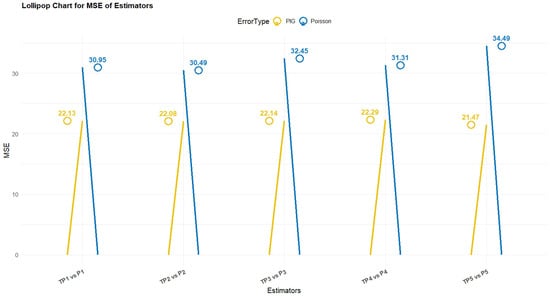
Figure 4.
Performance evaluation based on Population 4.
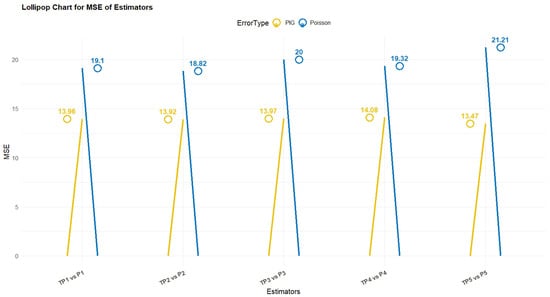
Figure 5.
Performance evaluation based on Population 5.
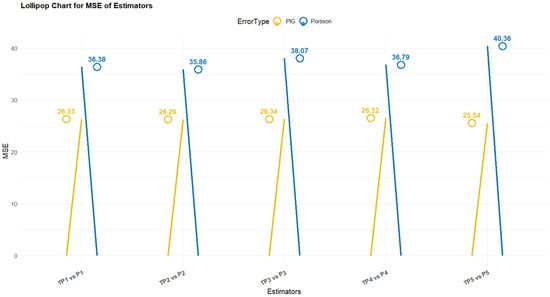
Figure 6.
Performance evaluation based on Population 6.
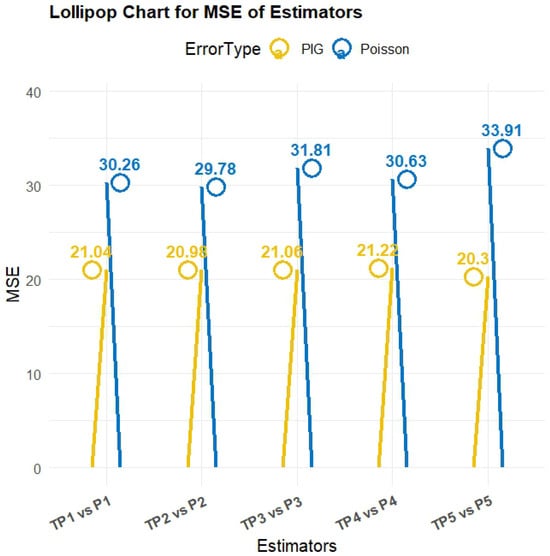
Figure 7.
Performance evaluation based on Population 7.
5. Conclusions
The current article introduces an event-driven family of mean estimators that utilize the P-IG regression coefficient rather than relying on traditional Poisson regression-based estimators. The proposed family is empirically better and theoretically sound due to some crucial limitations of the Poisson model, which is incapable of dealing with overdispersed and heterogeneous count data. The theoretical derivations have revealed that the use of the supplementary variable that is implicit in the P-IG architecture can provide more efficient estimation in light of both MSE and PRE. Intensive tests on real-life data and synthesized data were used to support this theoretical contribution. To be precise, it was demonstrated in both the mussel dataset and in the simulated populations that the P-IG-based estimators of the characteristic of the member of a population, namely the P-IG-based estimator , were superior to the P-IG-based estimators by any of the utilized measures of estimator performance, i.e., smaller MSE and higher PRE value. The simulation studies also found these findings by applying the adaptability and robustness of the proposed estimators in complex data environments. These results reinforce the view that the mixed-type P-IG regression model offers a highly general and resilient framework for mean estimation under diverse dispersion and nonlinearity. Consequently, the integration of P-IG regression principles into the sampling theory represents a significant methodological contribution to statistical estimation.
Author Contributions
Conceptualization, A.F.H., A.B., I.A. and M.R.; methodology, A.B., I.A. and M.R.; software, A.F.H.; formal analysis, A.S.A.-M.; investigation, I.A.; resources, A.S.A.-M.; data curation, A.S.A.-M.; writing—original draft, A.F.H., A.S.A.-M., A.B., I.A. and M.R.; writing—review and editing, A.F.H., A.S.A.-M., A.B., I.A. and M.R.; project administration, I.A.; funding acquisition, A.F.H. and A.S.A.-M. All authors have read and agreed to the published version of the manuscript.
Funding
This work was supported and funded by the Deanship of Scientific Research at Imam Mohammad Ibn Saud Islamic University (IMSIU) (grant number IMSIU-DDRSP-RP25).
Data Availability Statement
The original contributions presented in this study are included in the article. Further inquiries can be directed to the corresponding author.
Conflicts of Interest
The authors declare no conflicts of interest.
References
- Diana, G.; Giordan, M.; Perri, P.F. An improved class of estimators for the population mean. Stat. Methods Appl. 2011, 20, 123–140. [Google Scholar] [CrossRef]
- Diana, G.; Perri, P.F. A class of estimators in two-phase sampling with subsampling the non-respondents. Appl. Math. Comput. 2013, 219, 10033–10043. [Google Scholar] [CrossRef]
- Ekpenyong, E.J.; Enang, E.I. Efficient exponential ratio estimator for estimating the population mean in simple random sampling. Hacet. J. Math. Stat. 2015, 44, 689–705. [Google Scholar] [CrossRef]
- Singh, H.P.; Solanki, R.S. Improved estimation of population mean in simple random sampling using information on auxiliary attribute. Appl. Math. Comput. 2012, 218, 7798–7812. [Google Scholar] [CrossRef]
- Riaz, S.; Darda, M.A. Some classes of estimators in the presence of non-response using auxiliary attribute. SpringerPlus 2016, 5, 1271. [Google Scholar] [CrossRef]
- Subzar, M.; Maqbool, S.; Raja, T.A.; Pal, S.K.; Sharma, P. Efficient estimators of population mean using auxiliary information under simple random sampling. Stat. Transit. New Ser. 2018, 19, 219–238. [Google Scholar] [CrossRef]
- Kumar, S.; Chhaparwal, P. Ratio- and product-based estimators using known coefficient of variation of the auxiliary variable via modified maximum likelihood. Life Cycle Reliab. Saf. Eng. 2019, 8, 99–116. [Google Scholar] [CrossRef]
- Oral, E.; Oral, E. A robust alternative to the ratio estimator under non-normality. Stat. Probab. Lett. 2011, 81, 930–936. [Google Scholar] [CrossRef]
- Abid, M.; Abbas, N.; Nazir, H.Z.; Lin, Z. Enhancing the mean ratio estimators for estimating population mean using non-conventional location parameters. Rev. Colomb. Estad. 2016, 39, 63–79. [Google Scholar] [CrossRef]
- Zaman, T. Improvement of modified ratio estimators using robust regression methods. Appl. Math. Comput. 2019, 348, 627–631. [Google Scholar] [CrossRef]
- Zaman, T. An efficient exponential estimator of the mean under stratified random sampling. Math. Popul. Stud. 2021, 28, 104–121. [Google Scholar] [CrossRef]
- Bulut, H.; Zaman, T. An improved class of robust ratio estimators by using the minimum covariance determinant estimation. Commun. Stat. Simul. Comput. 2022, 51, 2457–2463. [Google Scholar] [CrossRef]
- Subzar, M.; Bouza, C.N.; Al-Omari, A.I. Utilization of different robust regression techniques for estimation of finite population mean in SRSWOR in case of presence of outliers through ratio method of estimation. Investig. Oper. 2019, 40, 600–609. [Google Scholar]
- Ibrahim, M.A.; Amer, I.A.; Emmanuel, J.E.M.S. Generalized Class of Mean Estimators with Known Measures for Outliers Treatment. Comput. Syst. Sci. Eng. 2021, 38, 1–15. [Google Scholar] [CrossRef]
- Zaman, T.; Bulut, H. A simulation study: Robust ratio double sampling estimator of finite population mean in the presence of outliers. Sci. Iran. 2024, 31, 1330–1341. [Google Scholar] [CrossRef]
- Shahzad, U.; Ahmad, I.; Al-Noor, N.H.; Hanif, M.; Almanjahie, I. Robust estimation of the population mean using quantile regression under systematic sampling. Math. Popul. Stud. 2023, 30, 195–207. [Google Scholar] [CrossRef]
- Ali, N.; Ahmad, I.; Hanif, M.; Shahzad, U. Robust-regression-type estimators for improving mean estimation of sensitive variables by using auxiliary information. Commun. Stat. Theory Methods 2021, 50, 979–992. [Google Scholar] [CrossRef]
- Koc, H. Ratio-type estimators for improving mean estimation using Poisson regression method. Commun. Stat. Theory Methods 2021, 50, 4685–4691. [Google Scholar] [CrossRef]
- Cameron, A.C.; Trivedi, P.K. Regression Analysis of Count Data; Cambridge University Press: Cambridge, UK, 1998. [Google Scholar]
- Koc, H.; Tanis, C.; Zaman, T. Poisson regression-ratio estimators of the population mean under double sampling, with application to COVID-19. Math. Popul. Stud. 2022, 29, 226–240. [Google Scholar] [CrossRef]
- Shahzad, U.; Shahzadi, S.; Afshan, N.; Al-Noor, N.H.; Alilah, D.A.; Hanif, M.; Anas, M.M. Poisson Regression-Based Mean Estimator. Math. Probl. Eng. 2021, 2021, 9769029. [Google Scholar] [CrossRef]
- Wani, Z.H.; Rizvi, S.E.H.; Sharma, M.; Jeelani, M.I.; Mushtaq, S. Modified Regression Estimators for Improving Mean Estimation-Poisson Regression Approach. Pak. J. Stat. Oper. Res. 2022, 18, 985–994. [Google Scholar]
- Raghav, Y.S.; Ahmadini, A.A.H.; Mahnashi, A.M.; Rather, K.U.I. Enhancing estimation efficiency with proposed estimator: A comparative analysis of Poisson regression-based mean estimators. Kuwait J. Sci. 2025, 52, 100282. [Google Scholar] [CrossRef]
- Alomair, A.M.; Shahzad, U. Tweedie-Poisson regression-based mean estimation of dose equivalence rates using gamma count auxiliary information. J. Radiat. Res. Appl. Sci. 2025, 18, 101929. [Google Scholar] [CrossRef]
- Sellers, K.F.; Shmueli, G. A flexible regression model for count data. Ann. Appl. Stat. 2010, 4, 943–961. [Google Scholar] [CrossRef]
- Farghali, R.A.; Lukman, A.F.; Algamal, Z.; Genc, M.; Attia, H. An Alternative Estimator for Poisson–Inverse-Gaussian Regression: The Modified Kibria–Lukman Estimator. Algorithms 2025, 18, 169. [Google Scholar] [CrossRef]
- Sarndal, C.E.; Swensson, B.; Wretman, J. Model Assisted Survey Sampling; Springer: Berlin/Heidelberg, Germany, 1992. [Google Scholar]
- Rao, J.N.K. Small Area Estimation; John Wiley and Sons: Hoboken, NJ, USA, 2003. [Google Scholar]
- Saha, D.; Alluri, P.; Dumbaugh, E.; Gan, A. Application of the Poisson-Tweedie distribution in analyzing crash frequency data. Accid. Anal. Prev. 2020, 137, 105456. [Google Scholar] [CrossRef] [PubMed]
- Chutiman, N.; Nathomthong, A.; Wichitchan, S.; Guayjarernpanishk, P. Improved Estimator Using Auxiliary Information in Adaptive Cluster Sampling with Networks Selected Without Replacement. Symmetry 2025, 17, 375. [Google Scholar] [CrossRef]
- Koc, T.; Koc, H. A new class of quantile regression ratio-type estimators for finite population mean in stratified random sampling. Axioms 2023, 12, 713. [Google Scholar] [CrossRef]
- Wichitchan, S.; Nathomthong, A.; Guayjarernpanishk, P.; Chutiman, N. Enhanced Ratio-Type Estimators in Adaptive Cluster Sampling Using Jackknife Method. Mathematics 2025, 13, 2020. [Google Scholar] [CrossRef]
- Hilbe, J.M. Negative Binomial Regression, 2nd ed.; Cambridge University Press: Cambridge, UK, 2011. [Google Scholar]
- Holla, M.S. On a Poisson–inverse Gaussian distribution. Metrika 1967, 11, 115–121. [Google Scholar] [CrossRef]
- Sankaran, M. Mixtures by the inverse Gaussian distribution. Sankhya B 1968, 30, 455–458. [Google Scholar]
- Ord, J.K.; Whitmore, G.A. The Poisson-inverse Gaussian distribution as a model for species abundance. Commun. Stat. Theory Methods 1986, 15, 853–871. [Google Scholar] [CrossRef]
- Shaban, S.A. Computation of the Poisson-inverse Gaussian distribution. Commun. Stat. Theory Methods 1981, 10, 1389–1399. [Google Scholar] [CrossRef]
- Ong, S.H. A note on the mixed Poisson formulation of the Poisson-inverse Gaussian distribution. Commun. Stat. Simul. Comput. 1998, 27, 67–78. [Google Scholar] [CrossRef]
- Sepkoski, J.J., Jr.; Rex, M.A. Distribution of freshwater mussels: Coastal rivers as biogeographic islands. Syst. Biol. 1974, 23, 165–188. [Google Scholar] [CrossRef]
- Batool, A.; Amin, M.; Elhassanein, A. On the performance of some new ridge parameter estimators in the Poisson-inverse Gaussian ridge regression. Alex. Eng. J. 2023, 70, 231–245. [Google Scholar] [CrossRef]
Disclaimer/Publisher’s Note: The statements, opinions and data contained in all publications are solely those of the individual author(s) and contributor(s) and not of MDPI and/or the editor(s). MDPI and/or the editor(s) disclaim responsibility for any injury to people or property resulting from any ideas, methods, instructions or products referred to in the content. |
© 2025 by the authors. Licensee MDPI, Basel, Switzerland. This article is an open access article distributed under the terms and conditions of the Creative Commons Attribution (CC BY) license (https://creativecommons.org/licenses/by/4.0/).