Abstract
Multi-exposure image fusion (MEF) aims to generate a well-exposed image by combining multiple photographs captured at different exposure levels. However, deep learning-based approaches are often highly dependent on the quality of the training data, which can lead to inconsistent color reproduction and loss of fine details. To address this issue, this study proposes a variance-driven hybrid MEF framework based on a U-Net architecture, which adaptively balances structural and chromatic information. In the proposed method, the variance of randomly cropped patches is used as a training weight, allowing the model to emphasize structurally informative regions and thereby preserve local details during the fusion process. Furthermore, a fusion strategy based on the geometric color distance, referred to as the Chroma scale, in the LAB color space is applied to preserve the original chroma characteristics of the input images and improve color fidelity. Visual gamma compensation is also employed to maintain perceptual luminance consistency and synthesize a natural fine image with balanced tone and smooth contrast transitions. Experiments conducted on 86 exposure pairs demonstrate that the proposed model achieves superior fusion quality compared with conventional and deep-learning-based methods, obtaining high JNBM (17.91) and HyperIQA (70.37) scores. Overall, the proposed variance-driven U-Net effectively mitigates dataset dependency and color distortion, providing a reliable and computationally efficient solution for robust MEF applications.
MSC:
68T45
1. Introduction
A natural digital image should be able to represent the wide dynamic range perceived by the human visual system. Dynamic range refers to the span of brightness values, from the brightest to the darkest regions of a scene. For output devices such as displays, dynamic range has been improved either by increasing the maximum luminance or by utilizing the “true black” capability of organic light-emitting diode (OLED) panels to maximize contrast ratios. For input devices such as cameras, recent advances include back-illuminated sensors and stacked sensor structures, both designed to expand the dynamic range that can be captured. The systematic study of high dynamic range (HDR) technology, which aims to extend the dynamic range of cameras and displays, was first introduced by Debevec et al. [1].
Despite hardware advancements, cameras still struggle to replicate the capabilities of the human visual system fully. Selecting an appropriate exposure is therefore crucial to ensure that both subjects and scenes are recorded with maximal detail. Exposure is a measure of how much light reaches the camera sensor: increasing exposure (high exposure) captures details in dark regions. Still, it saturates bright regions, while decreasing exposure (low exposure) preserves bright details but loses information in dark areas. When a scene’s dynamic range exceeds the camera’s capacity, both detail and chroma are inevitably lost. Although HDR cameras can extend dynamic range through specialized hardware, such solutions are expensive and require considerable research investment. Consequently, software-based methods have become a primary focus of active research. Examples include the tone-mapping techniques proposed by Reinhard et al. [2] and multi-exposure image fusion (MEF) introduced by Mertens et al. [3]
The MEF method proposed by Mertens et al. extends the dynamic range of captured scenes that exceed a camera‘s capability by fusing two or more low-dynamic-range (LDR) images taken at different exposure levels. Traditional algorithm-based fusion methods often require complex image registration and post-processing to generate natural-looking results, which considerably increases computational cost and limits their applicability in real-time scenarios. To address these challenges, recent studies have increasingly adopted deep learning-based fusion techniques, which combine high-quality output with faster processing speeds. However, such methods demand large, high-quality datasets for training. Even with careful validation, large-scale datasets often contain mislabeled data, and insufficient data availability can lead to weight imbalance during training. Consequently, the generated images may exhibit artifacts, such as color distortion, which hinders the preservation of fine details and chroma relative to the source.
Recently, studies have also explored robust feature representation and fusion stability in complex visual domains, where Liu et al. investigated robust feature learning in complex visual scenes and Wang et al. proposed techniques for preserving structural and chromatic consistency under distortions, contributing to improved fusion robustness [4,5].
This study addresses the limitations of existing tone-mapping approaches. While the mutual image translation module (MITM) achieves strong performance in detail preservation and tone mapping, it suffers from long processing times, color distortion, and chroma loss [6]. To mitigate these drawbacks, the output of the MITM was used as a training label for a U-Net, enabling the network to retain the MITM’s detail-preservation capability while substantially reducing processing time. Building on this foundation, three major improvements were introduced to overcome weight imbalance in deep learning and the color degradation associated with the MITM, thereby enhancing both fine detail and color in fused images.
The proposed improvements are as follows. First, a meta-learning-based weight reallocation strategy was implemented by exploiting the property that patches created using the common random crop augmentation method display higher variance when containing richer details. Training weights were therefore dynamically adjusted based on patch variance, encouraging the network to focus on informative regions while reducing sensitivity to noise-prone, homogeneous areas. This adjustment enhanced robustness to dataset imbalance. Second, to preserve the original colors and reduce chroma loss, color reconstruction was performed using the ab chroma scale (geometric chroma distance) derived from the CIE-LAB channels of the input images [7]. Third, a visual gamma compensation technique was applied to improve contrast and reduce chroma degradation in high-luminance regions. Collectively, these modifications retained the inherent speed advantage of deep learning-based MEF while effectively suppressing weight imbalance and color distortion.
Qualitative evaluations confirmed that the proposed method improved both color fidelity to the source images and fine detail preservation compared with conventional approaches. The quantitative results further demonstrated reduced halo artifacts and chroma loss, yielding higher scores in objective image quality metrics, including HyperIQA, JNBM, and CEIQ [8,9,10]. Currently, the method supports the fusion of two LDR images; future work will focus on developing hardware capable of simultaneously capturing three images, including a near-infrared (NIR) image, for real-time fusion. This advancement highlights the potential for commercial applications in real-time HDR imaging and NIR fusion modules.
In summary, this work develops a variance-driven hybrid MEF framework based on a U-Net architecture that adaptively balances structural and chromatic information. The proposed method employs the variance of randomly cropped patches as a training weight to enhance local detail preservation and stability during fusion. In addition, a fusion strategy based on the geometric color distance (chroma scale) in the LAB color space is introduced to maintain the original chroma fidelity of input images, and visual gamma compensation is applied to achieve perceptual luminance consistency and natural tone balance. These combined strategies enable the preservation of fine details and chroma fidelity with low computational complexity and demonstrate robustness against dataset imbalance.
2. Related Work
2.1. Multi-Exposure Image Fusion
MEF is a technique that simultaneously preserves fine details in both bright and dark regions by combining LDR images captured at different exposure levels. As highlighted by the red frame in Figure 1, a high-exposure (HE) image effectively captures details in darker areas but suffers from saturation in bright regions. In contrast, a low-exposure (LE) image maintains details in bright regions but fails to capture sufficient information in darker areas. By appropriately fusing images taken at different exposure values, it is possible to generate an HDR image with a broader representational range than any single image. However, practical applications of MEF face several challenges:
- Loss of fine details in regions affected by highlight saturation and shadow erosion.
- Ghosting artifacts are caused by misalignment between input images.
- Halo effects introduced by enhanced edge contrast during fusion.
- Color distortion and chroma loss due to imbalances across the red, green, and blue (RGB) channels.

Figure 1.
Dynamic range coverage of two LDR images at different exposures (HE, LE) and their fusion into an HDR image.
2.1.1. Algorithm-Based Fusion Method
To address the challenges above, various algorithm-based fusion methods have been proposed. Rahman et al. introduced the multi-scale retinex (MSR) approach, which fuses multiple single-scale retinex (SSR) outputs through weighted summation. This method achieves dynamic range compression at smaller scales while improving color and tone reproduction at larger scales [11]. Although effective, MSR often increases global brightness, resulting in issues such as chroma loss and noise amplification.
Liu et al. proposed a method based on dense scale-invariant feature transform (SIFT). Their approach first aligns the input images and then performs fusion through weighted summation or selective combination [12]. Designed to suppress ghosting artifacts, this method applies both pixel- and region-level fusion via weighted averaging or single-image selection. However, suppressing ghosting in sequentially captured multi-exposure images incurs high computational cost and often results in frequent halo artifacts.
Wang et al. introduced a pyramid fusion method that utilizes weight maps in the YUV color space to mitigate color distortion resulting from imbalances in the RGB channel values [13]. This pyramid-structured approach maintained low computational cost through approximate optimization at the highest level, while fine details were enhanced by incorporating a vector-based detail layer. However, the method remains limited by the intrinsic drawback of pyramid structures, namely, the loss of fine details.
Lee et al. proposed a method that performs local tone mapping in the discrete cosine transform (DCT) domain to preserve details with low computational cost [14]. By comparing frequency coefficients from two input images, the method achieves rapid fusion; nevertheless, it often produces unnatural results due to block noise.
Zhang et al. proposed a multi-exposure image fusion method based on perception enhanced structural patch decomposition (PESPD-MEF) to improve the perceptual realism of fused results under extreme exposure conditions [15]. In this approach, each image patch is decomposed into four components—perceptual gain, signal strength, signal structure, and mean intensity—and these components are fused independently with exposure-adaptive weighting. The perceptual gain is estimated through logarithmic stretching to recover information hidden in under-exposed regions, while a multi-scale framework is adopted to suppress halo and ghosting artifacts. Although the method preserves structural consistency, it may amplify noise, and the fused results tend to exhibit insufficient local contrast and sharpness.
Overall, algorithm-based methods face a trade-off between image quality and processing speed, as additional computations are required to address issues in multi-exposure fusion, including the loss of fine details, chroma degradation, halo artifacts, and color distortion. To overcome these challenges, recent research has increasingly shifted toward deep learning-based approaches.
2.1.2. Deep Learning-Based Method
MEF is particularly well-suited to deep learning because the relationship between inputs and outputs is explicitly defined. Recent studies have applied generative adversarial networks (GANs), which consist of a generator and a discriminator in an adversarial training setup, to produce realistic, high-quality results [16,17]. A prominent example is the cycle-consistent generative adversarial network (CycleGAN), an unsupervised framework for domain-to-domain translation using unpaired datasets [18,19]. Although primarily designed for image style transfer, CycleGAN has been successfully applied to MEF research.
Figure 2 depicts the CycleGAN architecture and its core component, the cycle-consistency loss. In this framework, X and Y denote two domains, while G and F are generators that transform images between them. DX and DY act as discriminators to verify whether inputs belong to domains X or Y. The cycle-consistent loss, Lcyc, measures the similarity between the original image X and its reconstruction F(G(X)). By enforcing reconstructed images to retain the content of the originals, CycleGAN learns effective transformations even with unpaired datasets. Applied to MEF, this ability allows for the generation of exposure levels not present in the captured images, thereby producing more natural fusion results.
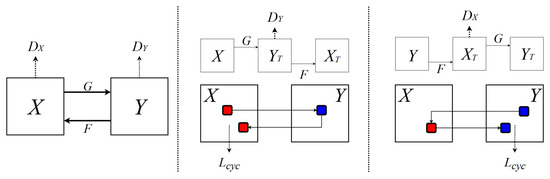
Figure 2.
Components of the GAN and CycleGAN.
As illustrated in Figure 3, Go et al. leveraged this property through their MITM [6]. First, CycleGAN generates intermediate exposure images between high- and low-exposure inputs. These synthetic images are then fused using a conventional algorithm-based process, specifically MSR. This hybrid method combines deep learning-based exposure generation with algorithm-based fusion.
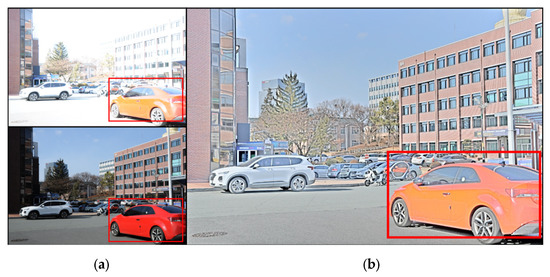
Figure 3.
Input images and output of the MITM: (a) input images, (b) MITM result.
The approach demonstrates strong performance in both local and global tone mapping as well as in detail preservation. However, as highlighted by the red frame in Figure 3, MSR-based fusion struggles in regions with considerable exposure differences, resulting in chroma loss, color distortion, and noise. Moreover, the hybrid design increases algorithmic complexity, resulting in slower processing speeds. The characteristics of the mentioned methods are summarized in Table 1.

Table 1.
Comparative characteristics of existing MEF methods.
2.2. U-Net Training for Multi-Exposure Image Fusion
Conventional convolutional neural network (CNN) architectures face two major challenges in image fusion tasks: (1) Alignment often deteriorates during downsampling, and (2) fine details are frequently lost during upsampling [20,21]. U-Net [22], introduced initially for medical image processing, provides several structural advantages:
- Unlike traditional CNNs, U-Net employs an encoder–decoder design with skip connections (Figure 4). This structure integrates global contextual information with local fine details, thereby maintaining input–output alignment while preserving resolution and fine details.
- Its end-to-end training framework facilitates optimization through appropriately designed loss functions and network architecture.
These characteristics enable U-Net to achieve spatially consistent input-output mapping and generate precise pixel-level predictions. Consequently, U-Net is well-suited for multi-exposure image fusion and offers structural benefits over previously used architectures, such as CycleGAN.

Figure 4.
U-Net architecture.

Figure 5.
Checkerboard artifact of U-Net.
In this study, the output of the MITM served as the training label for the U-Net, allowing the network to replicate MITM’s local tone-mapping and detail-preservation abilities while delivering faster processing.
However, applying the original U-Net structure without modification introduces noise artifacts in the output. Odena et al. demonstrated that imbalances between stride and kernel size in deconvolution layers can cause checkerboard artifacts (Figure 5) [23]. To mitigate this problem, they proposed replacing the conventional crop-and-concatenate approach in the upsampling stage with bilinear interpolation followed by concatenation. Accordingly, this study adopts Odena et al.’s strategy, which effectively suppresses artifacts, enhances spatial alignment between input and output images, and reduces post-processing complexity.
2.3. Batch-Wise Training Weight Adjustment for Individual Datasets
Like other deep learning architectures, the U-Net is highly susceptible to dataset imbalance during training. In large-scale datasets, noise is often unavoidable, even after manual validation, which can substantially impair both computational efficiency and generalization performance. Ren et al. investigated the effect of two data categories on model training: (1) samples with high learning importance but low occurrence and (ii) samples with low learning importance but high frequency [24]. Their analysis revealed that dataset imbalance causes training to be biased toward frequently occurring samples, despite their limited learning value.
To address this problem, Ren et al. proposed the approach illustrated in Figure 6, where a small, high-quality subset of data (termed the Metaset) is selected. During each training step, the learning importance of each sample within a mini-batch is assessed based on its contribution, and the training weights are adjusted accordingly. The blue arrows illustrate backward propagation and gradient update steps. This strategy mitigates dataset imbalance and noise while eliminating the need for additional hyperparameter tuning.
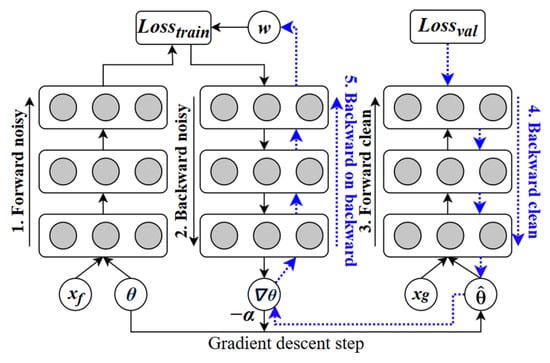
Figure 6.
Ren et al. ’s methods.
This study also acknowledges, as highlighted by Ren et al., that training outcomes depend heavily on the quality of the dataset. However, their method requires extensive computation and preprocessing throughout the training, making it inefficient for streamlined learning pipelines. To overcome this limitation, we adopted an extended approach inspired by meta-learning-based weighted training.
Most existing MEF modules tend to lose fine details and chroma fidelity during fusion. This work addresses these issues by introducing a variance-driven weighting strategy and a Chroma scale-based fusion approach that preserve both structural details and color consistency.
3. Proposed Method
As illustrated in Figure 7, this study introduces a multi-exposure fusion approach designed to preserve fine details and chroma through four key processes: (1) RandomCrop and Weight Calculating, (2) Variance-driven U-Net weighted learning, (3) Luminance information extraction, and (4) Chroma scale-based color extraction and HDR image fusion.
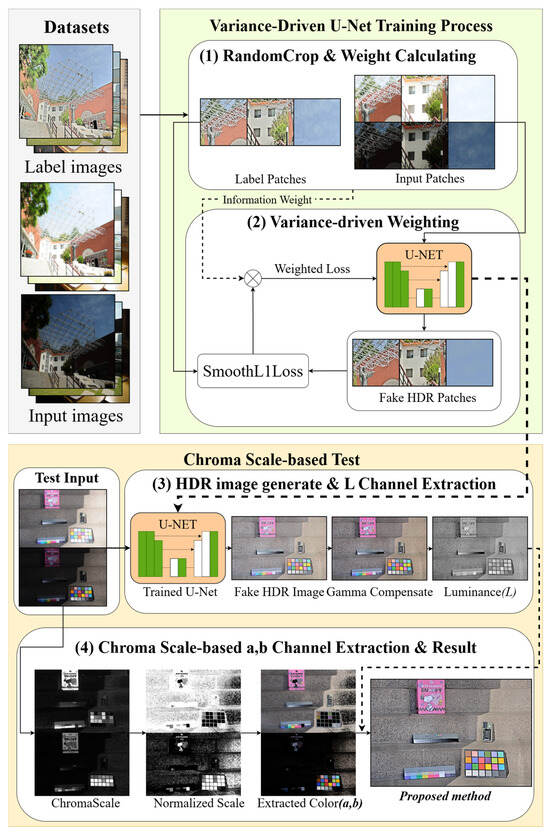
Figure 7.
Proposed method’s block diagram.
In submodule (1), random cropping is applied during data augmentation to extract multiple 256 × 256 patches from each pair of input images with different exposures. For every cropped patch, the variance is calculated and used to estimate its learning importance (Wᵢ), which reflects the amount of structural detail contained within the patch. This variance-driven weighting allows the model to focus training on detail-rich regions while reducing the effect of low-variance, homogeneous areas.
Submodule (2) performs variance-weighted training based on the learning importance values computed in (1). During backpropagation, patches with higher variance contribute more significantly to the network update, allowing the U-Net to emphasize informative structures and preserve local details across varying exposure conditions.
In submodule (3), the trained U-Net generates a fused HDR image from the paired low- and high-exposure input images. To separate luminance information from chromatic components, the output is converted from the RGB to LAB color space, and the L channel is extracted as a luminance map. This process ensures that the structural and luminance information derived from U-Net training is preserved during tone mapping, and it forms the foundation for subsequent HDR image fusion.
Finally, submodule (4) performs chroma mapping and fusion. Color information is extracted from the input images by calculating the geometric color distance (Chroma scale) in the LAB color space. This chroma mapping maintains the fidelity of the original color characteristics while the luminance component (L channel) obtained from the U-Net is combined with the fused chromatic components to produce the final HDR image.
Through these four processes, the proposed framework effectively quantifies structural detail, performs robust weighted learning, maintains luminance consistency, and corrects chroma distortion, thereby achieving balanced preservation of fine details and color fidelity in the fused HDR image.
3.1. Variance-Driven U-Net Weighted Training
The U-Net employed in this study is trained with a Smooth L1 Loss function to generate a three-channel RGB image that closely approximates the HDR image produced by the MITM. The network receives six input channels, consisting of the R, G, and B channels from paired high- and low-exposure datasets.
Random cropping during training offers two key benefits:
- It enables the use of images with varying resolutions without additional resizing, thereby preserving fine details in the training data.
- It mitigates the reduction in batch size typically associated with high-resolution images.
However, not all cropped patches contain useful training information (e.g., object or color variations). Figure 8 illustrates this issue. A patch containing only background elements (Figure 8a) contributes little to learning, often causing distortion in the training results and increasing the effort required for the model to learn object representations properly. In contrast, a patch with fine details (Figure 8b) provides moderate importance, while a patch dominated by one of the inputs (Figure 8c) has the highest importance.
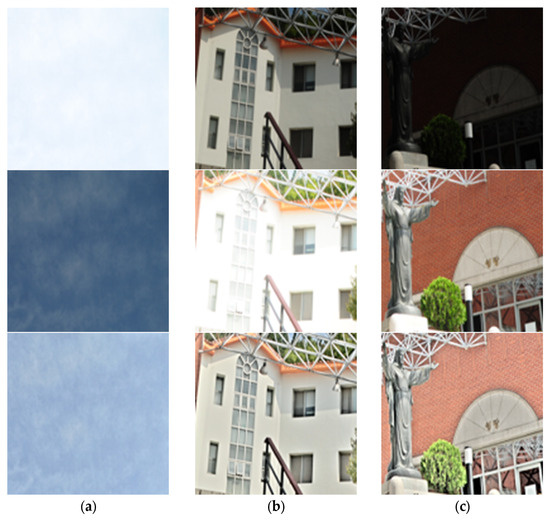
Figure 8.
Examples of cropped patches (upper: LE, middle: HE, lower: label): (a) Patch without variance, (b) patch with details, and (c) patch with details and saturation.
In this study, we address dataset imbalance by leveraging the variance of cropped patches. Patches with high learning importance are characterized by both large variance in the label and substantial variance differences between input patches. Accordingly, as defined in Equations (1) and (2), samples exhibiting high label variance and pronounced input-patch variance differences are assigned greater weights during the training:
where W denotes the weight of a patch, represents the variance of the high-exposure input patch, represents the variance of the low-exposure input patch and represents the variance of the label patch. The parameter controls the contribution of the label variance. Because the contributions of the label and the input patches differ, the label contribution is specified independently and was set to 0.5 in this study.
The patch-wise weight W obtained in this manner is processed within each batch, as defined in Equation (2), and applied as the training weight.
where B denotes the batch size, represents the average patch weight in the batch, while denotes the variance-based training weight assigned to the i-th patch, and refers to the pixel-wise error between the predicted patch and its corresponding label, computed using the Smooth L1 loss function. Dividing each by normalizes the weights such that their total sum remains equal to 1. This normalization emphasizes patches with higher learning importance during training. The resulting is then multiplied by and used as the training weight. With this adjustment, U-Net learns images of different exposures more effectively by focusing on informative details in both bright and dark regions, while simultaneously reinforcing the training of primary objects straightforwardly and efficiently.
Through this approach, the learning rate assigned to patches that do not contain details (e.g., Figure 8a) can be redistributed to other patches within the batch, thereby increasing the learning rate for detail-rich patches (e.g., Figure 8b,c) and enabling training that enhances detail preservation.
3.2. Chroma Map-Based Color Correction in the Evaluation Stage
The U-Net proposed in this study is trained in an RGB-to-RGB image correspondence framework. However, if this correspondence is maintained during evaluation, color distortion may occur. To address this issue, the L-channel information used in the final image synthesis is extracted by converting the U-Net output from RGB to LAB color space. Meanwhile, the a and b-channel information is obtained using the geometric chroma distance between the two input images (hereafter referred to as the chroma map). This chroma map is then used for color correction and final image synthesis, leading to improved visual quality. The calculation of the chroma map is expressed as follows (6)–(8):
where and represent the chromatic distances of each pixel in the a, b plane of the CIE-LAB color space. Since the chromatic plane of LAB is centered at the neutral gray point (128, 128), subtracting 128 measures the distance of each color component from this origin. denotes the chroma scale, which quantifies the chroma distance from the origin of the ab plane. A larger indicates richer color information, enabling more effective rearrangement of color content through fusion or selection in the output image.
When transferring ab-channel values, chroma weights derived from the chroma scale of each exposure are applied as masks to the input images to extract color information. Because the magnitude of these weights depends on both the local chroma content and the chroma intensity of each region, normalization is required to ensure that the sum of chroma weights from the two input images equals 1 at every pixel location. The normalization process is defined in Equations (9)–(13).
where represent the chroma scale ( of the high- and low-exposure images; denotes the total chroma scale used as the normalization denominator to ensure that the sum of chroma weights from both exposures equals 1 at each pixel, respectively; and denotes their corresponding a and b values. The normalized chroma weights, and , are employed as masks for extracting the fused chromatic components, and .
Figure 9 visualizes the chroma scale and normalized chroma weights. As highlighted by the red frames in the high- and low-exposure images, regions rich in color exhibit higher chroma scale values (). Compared with the other input image, the regions with larger chroma scale values close to 1 in the normalized chroma weights (), which, as defined in Equations (12) and (13), serve as masks to extract dominant chromatic information from each image.
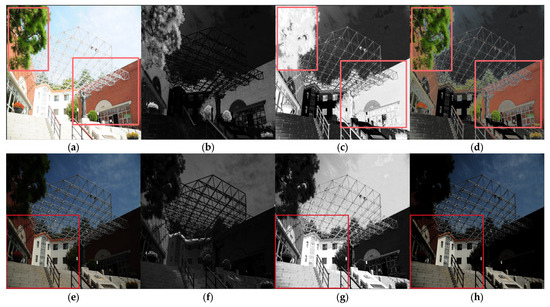
Figure 9.
Process of Chroma map: (a) High exposed (HE), (b) Chroma scale of HE (), (c) Normalized , (d) Extracted color (, (e) Low exposed (LE), (f) Chroma scale of LE (), (g) Normalized , and (h) Extracted color .
To enhance the chroma of the fused output and better preserve the original color information, the chroma weights were refined using a thresholding process (red dash line, 0.55 in this study), as shown in Figure 10. Outside this threshold, the weights are fixed at 0 or 1; within the range, they are linearly transformed to values between 0 and 1. Specifically, when the raw linear weights (, fall within the threshold range, the a- and b- channel information from both images is blended linearly to achieve natural chroma fusion. In contrast, when the weight falls outside the range, the color information from the image with the higher chroma scale is directly selected, ensuring faithful preservation of the subject’s chromatic detail.
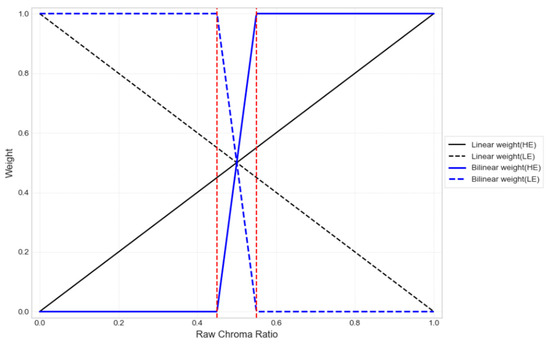
Figure 10.
Weight conversion of thresholding.
Regarding the choice of the threshold value (0.55), we set it to trigger thresholding when the two chroma scales deviate by more than 10% from the equality point at 0.5. This value is kept as a tunable hyperparameter, but in our experiments 0.55 provided a robust trade-off between fidelity and smoothness across scenes.
We also note that placing the threshold too close to 0.5 can induce color separation in regions where chroma magnitudes are similar while the hues differ (i.e., different directions in the a–b plane), which may lead to perceptually unnatural results; setting it to 0.55 mitigates this risk by allowing for a narrow linear blending band around 0.5 and enforcing hard selection only beyond a meaningful deviation.
Figure 11 visually demonstrates how the bilinear weight fusion operates in input image pairs with similar chroma scales, illustrating its effect on color generation. When the chroma scales of the inputs are similar, colors tend to become distorted under linear fusion; however, with bilinear fusion, the original color information is preserved, and only the brightness variation is reflected in the luminance channel.
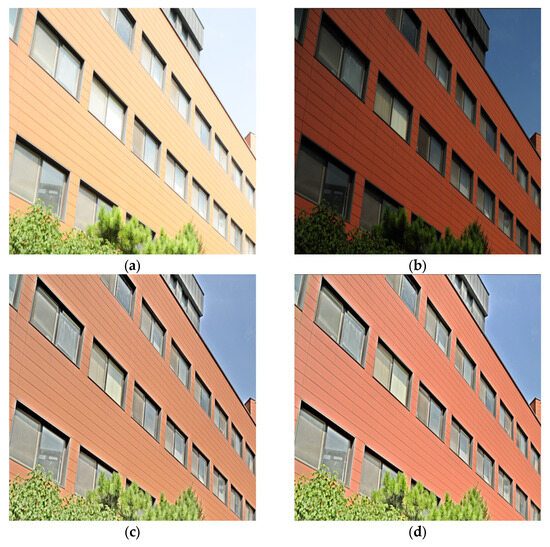
Figure 11.
Comparison of thresholding: (a) high-exposed, (b) low-exposed, (c) linear blended, and (d) bilinear blended.
This adjustment enables smooth blending in regions with small chroma differences, while maintaining strong color contrast in areas with large chroma differences. Consequently, the proposed method enhances chroma fidelity and color accuracy in HDR fusion outcomes while preserving natural, linear transitions.
3.3. Visual Gamma Compensation
In this study, contrast and chroma are enhanced during HDR image generation using visual gamma compensation. This method dynamically adjusts the gamma exponent according to the image’s adaptation luminance, thereby modeling the nonlinear response of human vision. Lee et al. (2006) demonstrated that visual gamma varies with luminance, as expressed in Equation (14), and recommended its use for gamma compensation in tone mapping [25].
where denotes visual gamma, and is the adapting luminance. The adapting luminance of an HDR image is defined using Equation (15):
where and represent the average luminance of the low- and high-exposed input images, respectively. To ensure consistent compensation, Lee et al. (2007) suggested defining the indoor reference adaptation luminance as 50 (cd/m2) calculated in Equation (16) [26].
In their formulation, a background reflectance of 20% and a display white level of 250(cd/m2) were assumed. The reference gamma and compensation gamma are then calculated as follows Equations (17) and (18).
Applying visual gamma compensation improves both contrast and chroma while maintaining the dynamic range of HDR images, as illustrated in Figure 12.
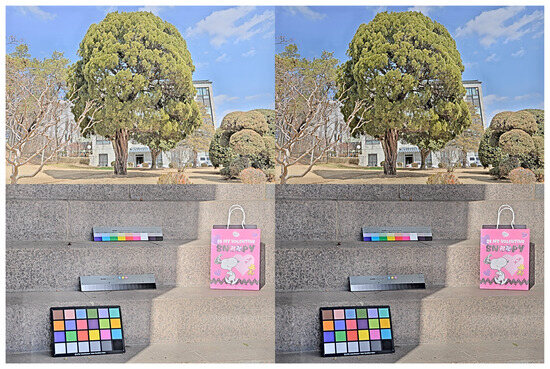
Figure 12.
Comparison of visual gamma compensation: (left: before, right: after compensation).
3.4. Results High Dynamic Range Image Fusion
Figure 13 presents the proposed HDR image fusion pipeline, which comprises three main stages: (1) extraction of luminance information, (2) extraction of chroma information, and (3) generation of the final HDR image through the integration of these results.
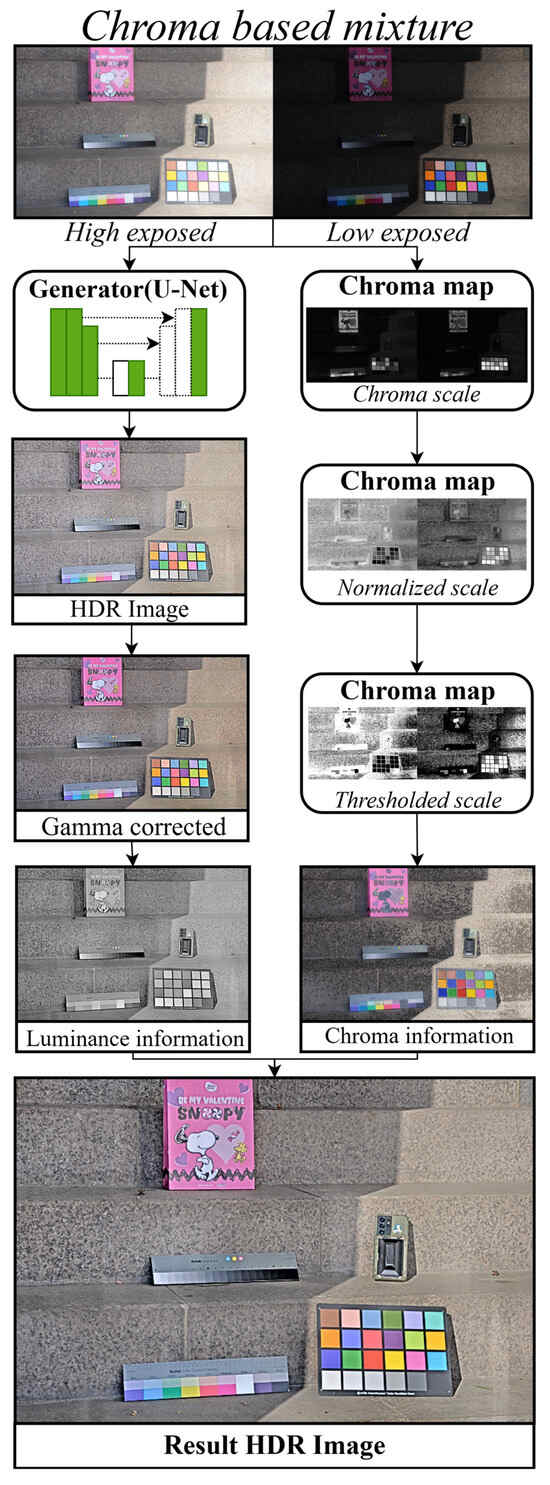
Figure 13.
Test process of proposed method.
Luminance information is first obtained by generating an initial HDR image using the trained U-Net with multi-exposure inputs. During this process, visual gamma compensation is applied to enhance local contrast in both bright and dark regions and to prevent chroma degradation in high-luminance areas. The resulting image is then converted from RGB to LAB color space, and the L channel is extracted. This channel is employed for global tone mapping and for preserving structural details across varying illumination levels.
Chroma information is derived from the chroma map, which defines the color characteristics of the input images through a geometry-based scale. This scale quantitatively assesses the degree of color preservation between multi-exposure images of the same scene. The chroma scale is normalized and used as a weight to represent relative color consistency between image pairs. The final chroma information is obtained by multiplying the original images by the weight masks. When regional differences in color preservation exceed a set of thresholds, selective thresholding is applied to adopt the a and b channels of one image. This step enhances the preservation of original color characteristics. The resulting a and b channels thus ensure robust regional color consistency.
The previously extracted L channel from the U-Net is combined with the chroma map-based a and b channels to generate the final HDR image. This integration preserves fine structural details in dark areas, enhances local contrast, and improves global tone mapping through gamma compensation. Furthermore, the chroma comparison process increases the ability to retain original colors, thereby reducing chroma loss and mitigating color distortions commonly observed in conventional methods.
Through these processes, the proposed method effectively preserves the color information of the original input images. In addition, the application of gamma compensation to the L channel suppresses the chroma attenuation and color distortion that typically occur in the Lab fusion process due to high L values, thereby enhancing both chroma fidelity and color accuracy in HDR rendering.
4. Simulation Results
Training was conducted using 851 paired datasets, including bracketed image pairs captured by the authors with a Nikon D80 and multi-exposure images obtained from prior studies by Jang, Lee, Zhang, Ma, and Zeng [27,28,29,30,31]. An RTX 3090 GPU was used for all experiments. For the proposed method’s reference checkpoint, paired multi-exposure images of size 1024 × 1024 or 2144 × 1424 (Nikon D80) were employed, with eight sets per batch. From each image, 12 random patches of size 256 × 256 were cropped, yielding 96 patches per batch, and eight batches were processed per epoch. The learning rate was set to 1 × e−4, and the final checkpoint was obtained after 245 epochs.
4.1. Qualitative Evaluation
For performance evaluation, the proposed method was compared with six MEF models that process two input images: MSR, DSIFT_EF, DEM, DBM, PESPD, and MITM) [6,11,12,13,14]. Figure 14 presents the multi-exposure test inputs, which contain saturated and eroded regions, making them suitable for evaluating the fusion capabilities of the proposed module. To visually compare MEF performance factors, color fidelity, noise suppression, halo suppression, dynamic range, local contrast, and global tone mapping, test images were carefully selected to include high-chroma scenes rich in detail, strong luminance contrast, and a color checkerboard for calibration.
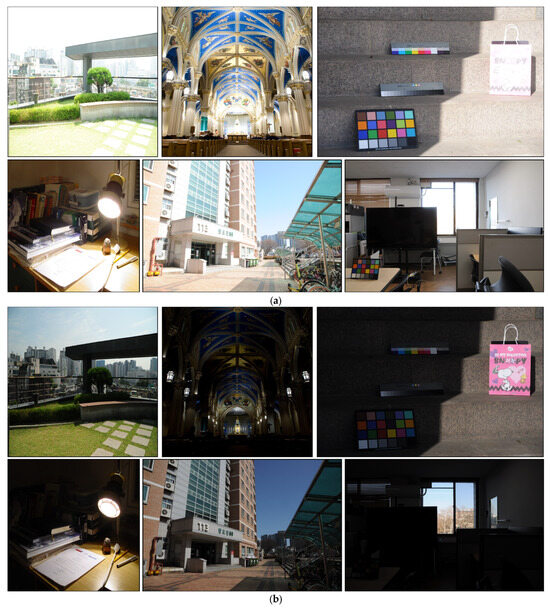
Figure 14.
Test input images: (a) Test input images (HE), (b) Test input images (LE); The Korean text “향토관” in the image refers to the name of the building.
Figure 15, Figure 16, Figure 17, Figure 18, Figure 19 and Figure 20 compare the output images generated by each module using the inputs shown in Figure 14. The proposed method demonstrates clear improvements in visual quality, including enhanced detail and chroma preservation, higher dynamic range and contrast, reduced noise and halo artifacts, improved global tone mapping, and stronger local contrast. Collectively, these enhancements yield higher contrast, sharper edges, more accurate gradation, and a natural depiction of objects and boundaries.
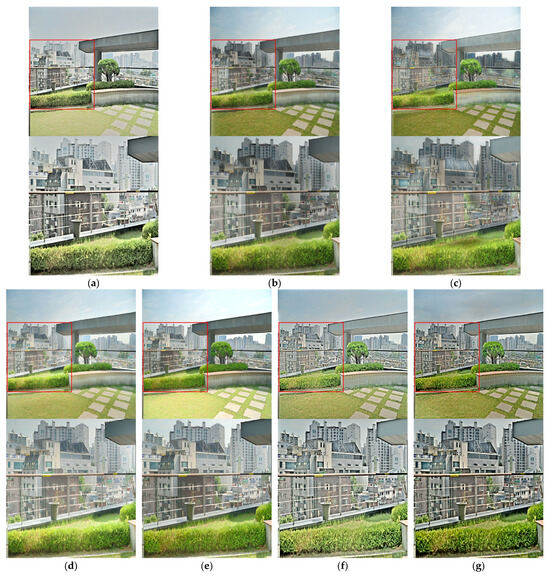
Figure 15.
Comparison of result images 1: (a) MSR, (b) DSIFT_EF, (c) DEM, (d) DBM, (e) PESPD, (f) MITM, (g) proposed method.
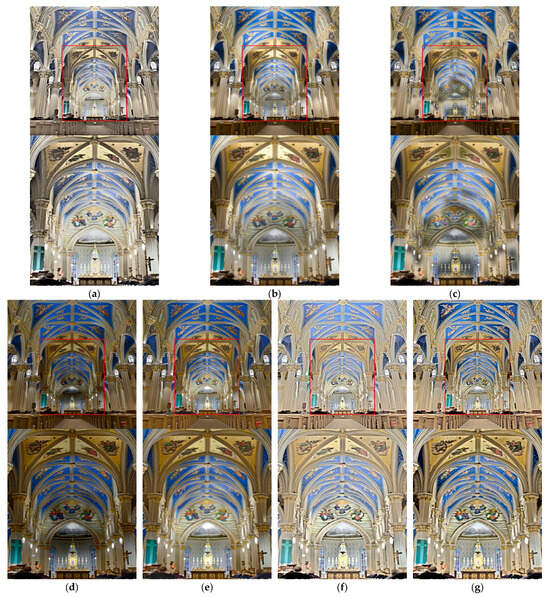
Figure 16.
Comparison of result images 2: (a) MSR, (b) DSIFT_EF, (c) DEM, (d) DBM, (e) PESPD, (f) MITM, (g) proposed method.
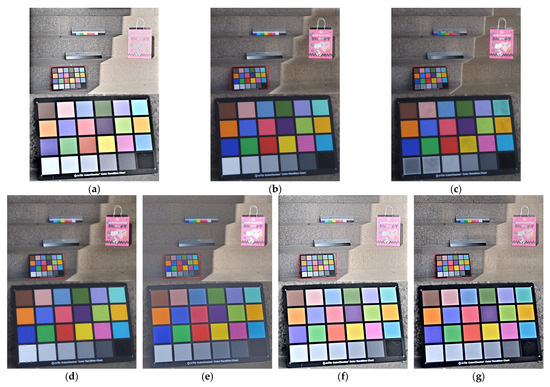
Figure 17.
Comparison of result images 3: (a) MSR, (b) DSIFT_EF, (c) DEM, (d) DBM, (e) PESPD, (f) MITM, (g) proposed method.
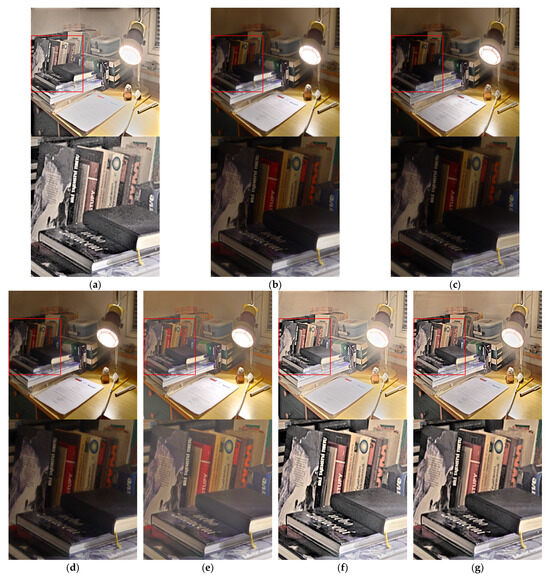
Figure 18.
Comparison of result images 4: (a) MSR, (b) DSIFT_EF, (c) DEM, (d) DBM, (e) PESPD, (f) MITM, (g) proposed method.
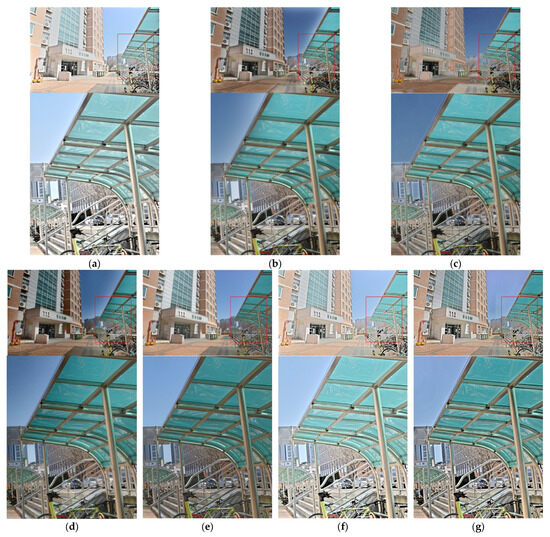
Figure 19.
Comparison of result images 5: (a) MSR, (b) DSIFT_EF, (c) DEM, (d) DBM, (e) PESPD, (f) MITM, (g) proposed method.
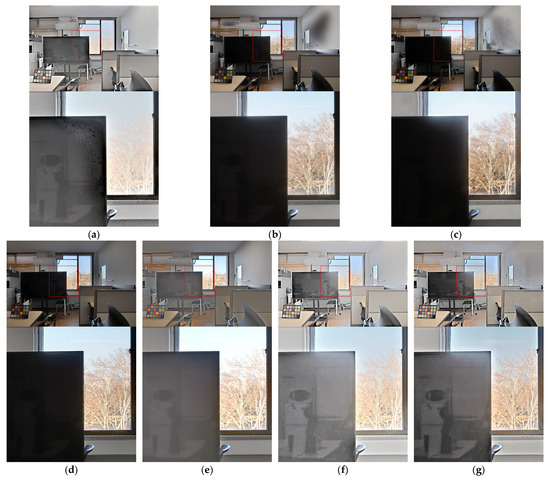
Figure 20.
Comparison of result images 6: (a) MSR, (b) DSIFT_EF, (c) DEM, (d) DBM, (e) PESPD, (f) MITM, (g) proposed method.
Figure 15 illustrates superior chroma preservation and local contrast, particularly in the highlighted region, where foliage–shadow contrast and foliage color reproduction outperform other modules. Figure 16 demonstrate chroma preservation and global tone mapping. Figure 17 illustrates local contrast and chroma fidelity. Figure 18 shows better global tone mapping and texture representation by noise reduction. Figure 19 presents the halo suppression results. Finally, Figure 20 demonstrates realistic image generation by noise suppression, also including recovery of details in saturated regions and preservation performance of fine structures in dark areas. The red frames highlight the regions of interest (ROIs) for detailed visual comparison among the methods.
Figure 17 illustrates an example of reduced color distortion and local contrast. The sharpened edges of the color checkerboard, outlined by black borders, demonstrate enhanced local contrast and improved HDR representation. Specifically, the borders exhibit lower black levels (closer to 0), signifying stronger local contrast and greater dynamic range. Compared with the MITM used as the label, the results show higher chroma and more accurate color representation. In addition, relative to other modules, the proposed method effectively suppresses halo artifacts at the boundaries between bright and dark regions.
Figure 21 shows the input images, and Figure 22 presents the line profile of the luminance gradation region of the color checkerboard, derived from the output images generated by each comparison module. Compared with other modules, the proposed method exhibits stronger edge enhancement, a broader dynamic range, improved gradation representation, and lower noise, achieved through superior local contrast performance.
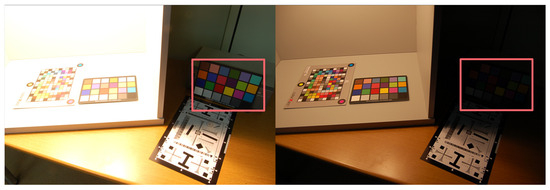
Figure 21.
Input images with color board; The red frames indicate the Color Checker regions used for evaluating luminance gradation.
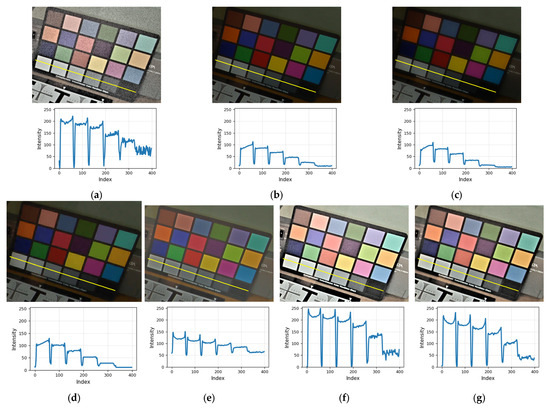
Figure 22.
Comparison of Line profile: (a) MSR, (b) DSIFT_EF, (c) DEM, (d) DBM, (e) PESPD, (f) MITM, and (g) proposed method.
4.2. Quantitative Evaluation
The proposed method was quantitatively evaluated using 86 test sets across six metrics: HyperIQA, Just noticeable blur metric (JNBM), average gradient (AG), contrast enhancement-based contrast-changed image quality measure (CEIQ), and convolutional neural network image quality assessment (CNNIQA) [8,9,10,32,33]. The function of these metrics is summarized as follows.
HyperIQA: Produce quality scores by adaptively analyzing fine details of distorted images in real-world conditions through a self-adaptive hypernetwork.
JNBM: A no-reference sharpness index that models the minimum blur level detectable by the human visual system.
AG: Calculates the average gradient of an image to estimate contrast and sharpness.
CEIQ: Evaluates the quality of contrast-distorted images by combining similarity between the original and a histogram-equalized version with entropy- and cross-entropy-based measures.
CNNIQA: A CNN-based, no-reference assessment method that extracts image features and predicts perceptual quality scores through regression.
The results obtained from MSR, DSIFT_EF, DEM, DBM, PESPD, MITM, and the proposed method were summarized in Table 2 using the six metrics above. As illustrated in Figure 23, the proposed method consistently outperformed the comparison methods. It achieved the highest average scores in HyperIQA, which evaluate detail preservation, and ranked first or second in the contrast-related metrics JNBM, AG, CEIQ, and CNNIQA. These findings demonstrate that the proposed approach effectively preserves details and enhances both local and global tone-mapping performance in fused images.
Table 2.
Comparisons with metric scores.
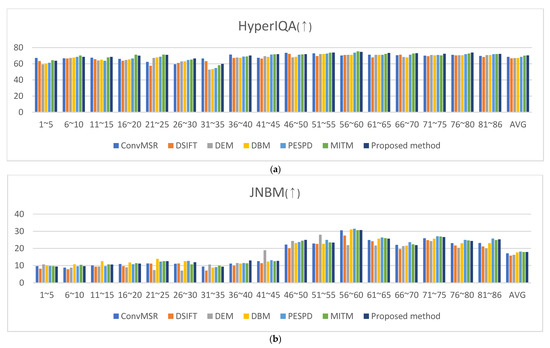
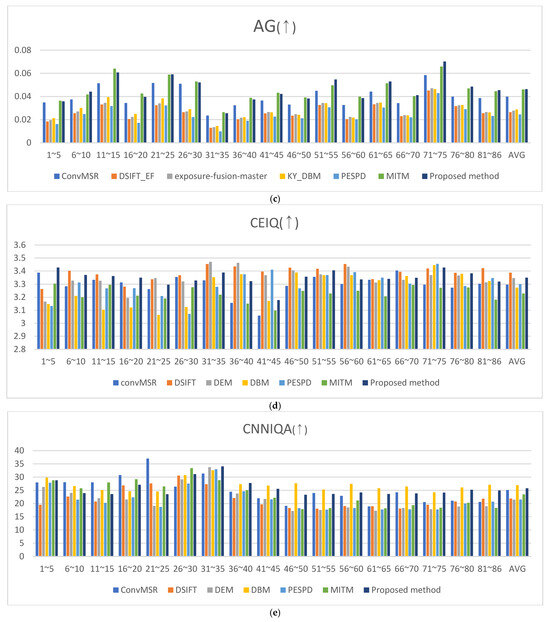
Figure 23.
Metric score: (a) HyperIQA score, (b) JNBM score, (c) AG score, (d) CEIQ score, and (e) CNNIQA score. (↑) higher scores are preferable.
4.3. Computational Efficiency Evaluation
In addition to quantitative quality metrics, computational efficiency was also evaluated by measuring the average, standard deviation, and per-pixel processing time for each resolution. The evaluation was conducted using 20 image pairs with a resolution of 1024 × 1024 and 20 pairs with a resolution of 2144 × 1424. The results obtained from MSR, DSIFT_EF, DEM, DBM, PESPD, MITM, and the proposed method are summarized in Table 3. Compared with other equation-based models, the proposed method produced higher-quality fused images while maintaining faster processing speed.
Table 3.
Comparisons with computational efficiency.
The results demonstrate that the proposed variance-driven and chroma-scale-based fusion framework effectively achieved its intended objectives. The variance-driven weighting successfully enhanced the preservation of fine structural details and suppressed noise, while the chroma-scale-based fusion preserved high-chroma regions and mitigated color distortion. In addition, the method maintained computational efficiency with significantly reduced processing time compared with algorithm-based approaches. These outcomes confirm that the proposed model met its primary design goals in both quantitative performance and perceptual quality.
5. Discussions
The proposed training method employed two input images captured at different exposures and used the output of the MITM, known for preserving details in dark regions, as the label. This design enabled the training process to adjust learning weights for detail-rich areas dynamically. The experimental results demonstrated improved detail preservation, along with notable enhancements in edge sharpness, texture clarity, and overall image representation.
Furthermore, the chroma scale-based color correction method effectively preserved high-chroma regions in each input image. Regions with similar chroma levels were improved through a smooth linear transformation, which reduced chroma loss and minimized color distortion. Thus, the combination of variance-based training-weight adjustment and chroma-scale-based color correction addresses key shortcomings of conventional multi-exposure fusion: the variance-driven weighting reduces detail loss and halo artifacts and mitigates weight imbalance and training noise, whereas the chroma-mapping-based color correction suppresses color distortion by preserving chroma fidelity.
In the qualitative evaluation, comparisons with MSR, DSIFT_EF, DEM, DBM, PSEPD, and MITM confirmed that the proposed method achieved superior color preservation, higher chroma levels, improved global and local tone mapping, reduced noise, enhanced contrast, better dark-region detail, improved texture representation, fewer halo artifacts, and a broader dynamic range.
In the quantitative evaluation, the method ranked first in detail-preservation metrics (HyperIQA, AG), second in contrast and visual quality metrics (JNBM, CEIQ, CNNIQA), demonstrating competitive results overall.
However, the U-Net–based fusion may occasionally introduce minor errors in scenes where large uniform backgrounds abut object boundaries. To alleviate this issue, we mitigate this by introducing a softmax-based reweighting so that the training weights for low-variance patches do not become excessively small, effectively maintaining a practical lower bound and stabilizing fusion near flat–to–textured transitions. In addition, the current supervision depends on MITM outputs as pseudo-labels, which can imprint label bias when the MITM is sub-optimal, and because the model is defined for two input exposures, dynamic ranges that require more than two shots cannot be fully covered within the present formulation.
Looking ahead, we will extend the framework beyond two LDR inputs to a VIS–NIR pipeline based on synchronized acquisition. Specifically, we plan to capture HE, LE, and NIR simultaneously; perform MEF on the HE/LE pair to obtain an HDR-VIS image; and then fuse this HDR-VIS with the NIR image. Our long-term goal is to have a unified hardware platform that enables simultaneous multi-exposure and NIR capture with real-time, on-device fusion for HDR imaging.
6. Conclusions
This study introduced three techniques to address weight imbalance and noise in deep learning, as well as the common challenges of detail loss and color distortion in multi-exposure image fusion. The effectiveness of these techniques was validated through both qualitative and quantitative results which demonstrated that the method effectively enhanced chroma preservation and detail retention in both dark and bright regions. Notable improvements included the suppression of halo effects, improved local contrast, and reduced noise, thereby increasing the applicability of HDR in capturing high dynamic ranges.
First, the variance-based weight readjustment strategy dynamically adjusted the importance of training patches by using patch variance, estimated through random crop, as a measure of detail content. This mechanism automatically reduced the influence of patches with insufficient or overly repetitive information, which typically caused imbalance during training, while assigning higher weights to detail-rich patches. Consequently, the fused images demonstrated improved preservation of fine structures, particularly in dark regions, while suppressing noise. The enhanced tone-mapping performance further enabled the use of a higher dynamic range, yielding stronger contrast, reduced halo artifacts, and more natural HDR images.
Second, to mitigate color distortion in the MSR-based MITM used as the label, a chroma-scale-based color correction process was applied. Chroma information was derived from the a and b channels in the CIE LAB color space. For regions with similar chroma levels, the color information from the two input images was linearly blended to ensure smooth transitions. In high-chroma regions where one channel exceeded a threshold, the original chroma was preserved, effectively resolving the distortion problem.
Third, visual gamma compensation was introduced to enhance overall contrast and alleviate chroma loss in high-luminance regions. Together, these improvements ensured that the fused images preserved details across large exposure differences while achieving superior contrast and color fidelity.
The proposed method was compared with five representative MEF approaches: MSR, DSIFT_EF, DEM, DBM, PSEPD, and MITM. In conclusion, the variance-based weight readjustment method effectively addressed dataset imbalance in deep learning at low computational cost. Combined with chroma-scale-based color correction and visual gamma compensation, it substantially improved contrast, color accuracy, and detailed preservation while reducing halo artifacts and noise. Quantitative evaluations demonstrated that the proposed method achieved the highest HyperIQA score of 70.38, indicating superior perceptual quality and detail preservation, and ranked within the top two across all remaining metrics. In particular, the method effectively maintained chroma fidelity and enhanced local contrast, as reflected by competitive CEIQ (3.35) and CNNIQA (25.75) scores compared to existing approaches. Future work will extend this approach beyond the fusion of two LDR images with different exposures to include NIR fusion, aiming to capture a broader dynamic range and richer detail. The development of real-time capture and fusion hardware is also planned to expand practical applications.
Author Contributions
Conceptualization, S.-H.L. (Sung-Hak Lee); methodology, C.-W.S. and S.-H.L. (Sung-Hak Lee); software, C.-W.S.; validation, C.-W.S., Y.-H.G., S.-H.L. (Seung-Hwan Lee) and S.-H.L. (Sung-Hak Lee); formal analysis, C.-W.S. and S.-H.L. (Sung-Hak Lee); investigation, C.-W.S. and S.-H.L. (Sung-Hak Lee); resources, C.-W.S. and S.-H.L. (Sung-Hak Lee); data curation, C.-W.S., Y.-H.G., S.-H.L. (Seung-Hwan Lee) and S.-H.L. (Sung-Hak Lee); writing—original draft preparation, C.-W.S.; writing—review and editing, S.-H.L. (Sung-Hak Lee); visualization, C.-W.S.; supervision, S.-H.L. (Sung-Hak Lee); project administration, S.-H.L. (Sung-Hak Lee); funding acquisition, S.-H.L. (Sung Hak Lee). All authors have read and agreed to the published version of the manuscript.
Funding
This research was supported by Korea Creative Content Agency (KOCCA) grant funded by the Ministry of Culture, Sports and Tourism (MCST) in 2024 (Project Name: Development of optical technology and sharing platform technology to acquire digital cultural heritage for high quality restoration of composite materials cultural heritage, Project Number: RS-2024-00442410, Contribution Rate: 50%) and the Institute of Information & Communications Technology Planning & Evaluation (IITP)-Innovative Human Resource Development for Local Intellectualization program grant funded by the Korea government (MSIT) (IITP-2025-RS-2022-00156389, 50%).
Data Availability Statement
The data presented in this study are openly available in: https://drive.google.com/file/d/1OA07dlOHinhS_eO5mbYQ18YULHD4PgGp/view?usp=drive_link. Jang, H [24] Dataset: https://github.com/HanbyolJang/LDR-HDR-pair_Dataset, Lee, S [25] Dataset: https://drive.google.com/file/d/1t9jmy4IbesieE5r6D6IXuR-t98xOi9oY/edit, Zhang, X [26] Dataset: https://github.com/xingchenzhang/MEFB?tab=readme-ov-file, Ma, K, Zeng, K [27,28] Dataset: https://ivc.uwaterloo.ca/database/MEF/MEFDatabase.rar (all web accessed on 1 April 2025). The data presented in this study is freely available to academic and non-academic entities for non-commercial purposes.
Conflicts of Interest
The authors declare no conflicts of interest.
References
- Debevec, P.E.; Malik, J. Recovering High Dynamic Range Radiance Maps from Photographs. In Proceedings of the 24th Annual Conference on Computer Graphics and Interactive Techniques—SIGGRAPH ’97, Los Angeles, CA, USA, 3 August–8 August 1997; ACM Press: New York, NY, USA, 1997; pp. 369–378. [Google Scholar] [CrossRef]
- Reinhard, E.; Stark, M.; Shirley, P.; Ferwerda, J. Photographic Tone Reproduction for Digital Images. ACM Trans. Graph. 2002, 21, 267–276. [Google Scholar] [CrossRef]
- Mertens, T.; Kautz, J.; Van Reeth, F. Exposure Fusion. In Proceedings of the 15th Pacific Conference on Computer Graphics and Applications (PG’07), Maui, HI, USA, 29 October–2 November 2007; IEEE: New York, NY, USA, 2007; pp. 382–390. [Google Scholar] [CrossRef]
- Liu, Y.; Wang, C.; Lu, M.; Yang, J.; Gui, J.; Zhang, S. From Simple to Complex Scenes: Learning Robust Feature Representations for Accurate Human Parsing. IEEE Trans. Pattern Anal. Mach. Intell. 2024, 46, 5449–5462. [Google Scholar] [CrossRef] [PubMed]
- Wang, C.; Zhang, Q.; Wang, X.; Zhou, L.; Li, Q.; Xia, Z.; Ma, B.; Shi, Y.Q. Light-Field Image Multiple Reversible Robust Watermarking Against Geometric Attacks. IEEE Trans. Dependable Secure Comput. 2025, 1–15. [Google Scholar] [CrossRef]
- Go, Y.-H.; Lee, S.-H.; Lee, S.-H. Multi-Exposed Image Fusion Using Multiscale-Surround Switching Map. J. Korean Inst. Inf. Technol. 2024, 22, 139–150. [Google Scholar] [CrossRef]
- Kuehni, R.G. Color-Tolerance Data and the Tentative CIE 1976 L*a*b* Formula. J. Opt. Soc. Am. 1976, 66, 497. [Google Scholar] [CrossRef]
- Su, S.; Yan, Q.; Zhu, Y.; Zhang, C.; Ge, X.; Sun, J.; Zhang, Y. Blindly Assess Image Quality in the Wild Guided by a Self-Adaptive Hyper Network. In Proceedings of the 2020 IEEE/CVF Conference on Computer Vision and Pattern Recognition (CVPR), Seattle, WA, USA, 13–19 June 2020; IEEE: New York, NY, USA, 2020; pp. 3664–3673. [Google Scholar] [CrossRef]
- Ferzli, R.; Karam, L.J. A No-Reference Objective Image Sharpness Metric Based on the Notion of Just Noticeable Blur (JNB). IEEE Trans. Image Process. 2009, 18, 717–728. [Google Scholar] [CrossRef]
- Yan, J.; Li, J.; Fu, X. No-Reference Quality Assessment of Contrast-Distorted Images Using Contrast Enhancement. arXiv 2019, arXiv:1904.08879. [Google Scholar]
- Rahman, Z.; Jobson, D.J.; Woodell, G.A. Multi-Scale Retinex for Color Image Enhancement. In Proceedings of the 3rd IEEE International Conference on Image Processing, Lausanne, Switzerland, 19 September 1996; IEEE: New York, NY, USA; pp. 1003–1006. [Google Scholar] [CrossRef]
- Liu, Y.; Wang, Z. Dense SIFT for Ghost-Free Multi-Exposure Fusion. J. Vis. Commun. Image Represent. 2015, 31, 208–224. [Google Scholar] [CrossRef]
- Wang, Q.; Chen, W.; Wu, X.; Li, Z. Detail-Enhanced Multi-Scale Exposure Fusion in YUV Color Space. IEEE Trans. Circuits Syst. Video Technol. 2020, 30, 2418–2429. [Google Scholar] [CrossRef]
- Lee, G.-Y.; Lee, S.-H.; Kwon, H.-J. DCT-Based HDR Exposure Fusion Using Multiexposed Image Sensors. J. Sens. 2017, 2017, 1–14. [Google Scholar] [CrossRef]
- Zhang, J.; Luo, Y.; Huang, J.; Liu, Y.; Ma, J. Multi-Exposure Image Fusion via Perception Enhanced Structural Patch Decomposition. Inf. Fusion 2023, 99, 101895. [Google Scholar] [CrossRef]
- Goodfellow, I.; Pouget-Abadie, J.; Mirza, M.; Xu, B.; Warde-Farley, D.; Ozair, S.; Courville, A.; Bengio, Y. Generative Adversarial Networks. Commun. ACM 2020, 63, 139–144. [Google Scholar] [CrossRef]
- Goodfellow, I.J.; Pouget-Abadie, J.; Mirza, M.; Xu, B.; Warde-Farley, D.; Ozair, S.; Courville, A.; Bengio, Y. Generative Adversarial Nets. arXiv 2014, arXiv:1406.2661. [Google Scholar] [CrossRef]
- Zhu, J.-Y.; Park, T.; Isola, P.; Efros, A.A.; Research, B.A. Unpaired Image-to-Image Translation Using Cycle-Consistent Adversarial Networks Monet Photos. arXiv 2017, arXiv:1703.10593. [Google Scholar]
- Zhu, J.-Y.; Park, T.; Isola, P.; Efros, A.A. Unpaired Image-to-Image Translation Using Cycle-Consistent Adversarial Networks. In Proceedings of the 2017 IEEE International Conference on Computer Vision (ICCV), Venice, Italy, 22–29 October 2017; IEEE: New York, NY, USA, 2017; pp. 2242–2251. [Google Scholar]
- Lecun, Y.; Bottou, L.; Bengio, Y.; Haffner, P. Gradient-Based Learning Applied to Document Recognition. Proc. IEEE 1998, 86, 2278–2324. [Google Scholar] [CrossRef]
- Albawi, S.; Mohammed, T.A.; Al-Zawi, S. Understanding of a Convolutional Neural Network. In Proceedings of the 2017 International Conference on Engineering and Technology (ICET), Antalya, Turkey, 21–23 August 2017; IEEE: New York, NY, USA, 2017; pp. 1–6. [Google Scholar] [CrossRef]
- Ronneberger, O.; Fischer, P.; Brox, T. U-Net: Convolutional Networks for Biomedical Image Segmentation. In Proceedings of the Medical Image Computing and Computer-Assisted Intervention—MICCAI 2015, Munich, Germany, 5–9 October 2015; pp. 234–241. [Google Scholar] [CrossRef]
- Odena, A.; Dumoulin, V.; Olah, C. Deconvolution and Checkerboard Artifacts. Distill 2016, 00003. [Google Scholar] [CrossRef]
- Ren, M.; Zeng, W.; Yang, B.; Urtasun, R. Learning to Reweight Examples for Robust Deep Learning. arXiv 2018, arXiv:1803.09050. [Google Scholar]
- Lee, S.-H. The Quantitative Model for Optimal Threshold and Gamma of Display Using Brightness Function. IEICE Trans. Fundam. Electron. Commun. Comput. Sci. 2006, E89-A, 1720–1723. [Google Scholar] [CrossRef]
- Lee, S.-H.; Song, I.-H.; Sohng, K.-I. Color Reproduction Model for Varying Illumination Conditions. IEICE Trans. Electron. 2007, E90-C, 2119–2125. [Google Scholar] [CrossRef]
- Jang, H.; Bang, K.; Jang, J.; Hwang, D. Dynamic Range Expansion Using Cumulative Histogram Learning for High Dynamic Range Image Generation. IEEE Access 2020, 8, 38554–38567. [Google Scholar] [CrossRef]
- Lee, S.; An, G.H.; Kang, S.-J. Deep Chain HDRI: Reconstructing a High Dynamic Range Image from a Single Low Dynamic Range Image. IEEE Access 2018, 6, 49913–49924. [Google Scholar] [CrossRef]
- Zhang, X. Benchmarking and Comparing Multi-Exposure Image Fusion Algorithms. Inf. Fusion 2021, 74, 111–131. [Google Scholar] [CrossRef]
- Ma, K.; Zeng, K.; Wang, Z. Perceptual Quality Assessment for Multi-Exposure Image Fusion. IEEE Trans. Image Process. 2015, 24, 3345–3356. [Google Scholar] [CrossRef]
- Zeng, K.; Ma, K.; Hassen, R.; Wang, Z. Perceptual Evaluation of Multi-Exposure Image Fusion Algorithms. In Proceedings of the 2014 6th International Workshop on Quality of Multimedia Experience, QoMEX 2014, Singapore, 18–20 September 2014; pp. 7–12. [Google Scholar] [CrossRef]
- Cui, G.; Feng, H.; Xu, Z.; Li, Q.; Chen, Y. Detail Preserved Fusion of Visible and Infrared Images Using Regional Saliency Extraction and Multi-Scale Image Decomposition. Opt. Commun. 2015, 341, 199–209. [Google Scholar] [CrossRef]
- Kang, L.; Ye, P.; Li, Y.; Doermann, D. Convolutional Neural Networks for No-Reference Image Quality Assessment. In Proceedings of the 2014 IEEE Conference on Computer Vision and Pattern Recognition, Columbus, OH, USA, 23–28 June 2014; IEEE: New York, NY, USA, 2014; pp. 1733–1740. [Google Scholar] [CrossRef]
Disclaimer/Publisher’s Note: The statements, opinions and data contained in all publications are solely those of the individual author(s) and contributor(s) and not of MDPI and/or the editor(s). MDPI and/or the editor(s) disclaim responsibility for any injury to people or property resulting from any ideas, methods, instructions or products referred to in the content. |
© 2025 by the authors. Licensee MDPI, Basel, Switzerland. This article is an open access article distributed under the terms and conditions of the Creative Commons Attribution (CC BY) license (https://creativecommons.org/licenses/by/4.0/).