Abstract
Aiming to address the problem of accuracy degradation in Delta robots caused by machining accuracy, assembly precision, etc., this paper corrects the robot’s driving angles to achieve error compensation and designs a compensation algorithm based on particle swarm optimization (PSO) and BP neural network. In terms of algorithm improvement, the inertia weight and learning factors of the PSO algorithm are optimized to effectively enhance the global search ability and convergence performance of the algorithm. Additionally, the core mechanisms of genetic algorithms, including selection, crossover, and mutation operations, are introduced to improve algorithm diversity, ultimately proposing an improved PSO-GA-BP error compensation algorithm. This algorithm uses the improved PSO-GA algorithm to optimize the optimal correction angles and trains the BP network with the optimized dataset to achieve predictive compensation for other points. The simulation results show that the comprehensive error of the robot after compensation by this algorithm is reduced by 83.8%, verifying its effectiveness in positioning accuracy compensation and providing a new method for the accuracy optimization of parallel robots.
Keywords:
Delta robots; error compensation; particle swarm optimization; genetic algorithms; neural network MSC:
68T20
1. Introduction
In recent years, robots have gradually emerged in production lines across various industries, providing significant impetus for intelligent development in these sectors. The Delta parallel robot [1,2], with its superior kinematic and dynamic performance, has been widely applied in material sorting and packaging, electronic product processing and assembly, and related fields [3,4]. Robot positioning accuracy constitutes a primary factor affecting the performance of manufactured products [5]. Most parallel robots consist of stationary and moving platforms connected by intermediate limbs. This complex configuration enhances the load-bearing capacity and improves precision to some extent, yet its highly coupled structure poses challenges for further accuracy enhancement [6,7]. This study focuses on the Delta parallel robot as the research subject.
To enhance robot positioning accuracy, conducting error compensation research on robots is essential. Current mainstream compensation methods can be categorized into two primary types [8]: online error compensation and offline error compensation. Online error compensation [9] requires continuous monitoring of the robot end-effector’s positional status using precision measurement equipment, with real-time dynamic corrections implemented for robot trajectories based on detection data. Cheng et al. [10] introduced a feedforward compensation algorithm based on PID control. Zhang et al. [11] proposed a control strategy characterized by high precision and strong robustness, significantly improving the positional control accuracy and anti-interference capability of industrial robots during online compensation processes. Zhu et al. [12] employed a BP neural network to predict target point errors, concluding that positioning errors exhibit fundamentally continuous variations. Shu et al. [13] utilized a binocular vision system to monitor the end-effector pose in real time and implemented instantaneous corrections, elevating the robot’s positioning accuracy to ±0.2 mm.
Offline error compensation methods can generally be classified into two categories: model-based methods [14] and non-model-based methods [15]. Chen Lifeng et al. [16] proposed a joint angle error compensation strategy using Chebyshev polynomial fitting based on the robot kinematic model, achieving a 68.7% reduction in robot positioning errors. The effectiveness of model-based methods fundamentally relies on establishing precise models, yet the modeling process remains relatively complex, and such methods demonstrate limited efficacy in compensating for certain non-geometric errors. Consequently, the research focus has shifted toward non-model-based compensation approaches that eliminate model dependency while offering enhanced accuracy and adaptability. Among these, neural network-based compensation methods have emerged as predominant solutions. Wang et al. [17] implemented posture error compensation through neural networks, resulting in an 83.99% error reduction for KUKA KR500-3 robots. Li et al. [18] developed a precision enhancement algorithm combining the GPSO algorithm with neural networks, applying this methodology to achieve error prediction and compensation for KUKA drilling robots. The experimental results demonstrate an 87.9% improvement in drilling accuracy through this approach.
In summary, this study conducts error compensation research targeting Delta robots, with actuator angles as the compensation objective. We propose a hybrid intelligent error compensation algorithm integrating the particle swarm optimization (PSO), genetic algorithm (GA), and BP neural network methodologies to enhance robot positioning accuracy.
2. Structure and Parameters of the Delta Robot
The structure of the Delta parallel robot is shown in Figure 1. Three identical kinematic chains are uniformly distributed at 120° intervals to connect the stationary and moving platforms. In each kinematic chain, the active arm is connected to the stationary platform through a revolute joint. The passive arm adopts a parallelogram structure, with all four vertices of this structure configured as spherical joints. This design ensures that the passive arm connects both the active arm and the moving platform through pairs of spherical joints. By driving the three revolute joints of the active arms, the robot achieves high-speed motion in three-dimensional space. The symbols and parameter definitions in Figure 1 are listed in Table 1.
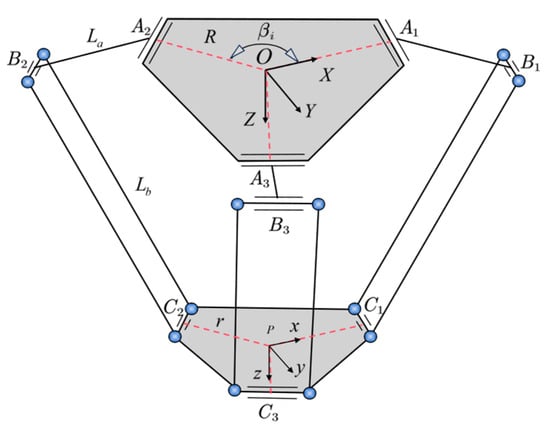
Figure 1.
Structural diagram of Delta robot.

Table 1.
Delta robot model parameters.
According to the simplified model of the Delta robot, the angle of the connection between the hinge points of the static (dynamic) platform and the origin relative to the X(x) axis is as follows:
The kinematics equation of the Delta robot is as follows:
It can be seen from Equation (2) that the kinematics equation of the robot contains a number of parameters, and the errors of these parameters will affect the positioning accuracy of the robot. In order to analyze the specific influence of each parameter error on the positioning accuracy of the robot, Shang et al. [19] modeled the error and analyzed various error sources. The simulation concluded that the driving angle error is the main factor affecting the position error of the mechanism.
3. Improvement of PSO Algorithm and Error Compensation
3.1. Improvement of PSO Algorithm
For position errors in parallel robots, a static error analysis can be employed to establish the models, with intelligent algorithms such as ant colony optimization (ACO), particle swarm optimization (PSO), and BP neural networks applied for error compensation. Among these, the ant colony algorithm exhibits relatively higher complexity, requiring extensive experimental validation. Conversely, the particle swarm optimization algorithm is more prone to becoming trapped in local optima. Consequently, targeted improvements addressing this limitation are necessary to enhance its global convergence capability.
The particle swarm optimization (PSO) algorithm is inspired by observations of bird flock foraging behavior. In this framework, the optimization target is defined as a D-dimensional vector, and a population of n particles, denoted as , is initialized. Each particle represents a D-dimensional vector corresponding to a potential solution. A fitness function evaluates the quality of each particle’s current position by calculating its fitness value. For each particle, its individual historical best position is recorded as , while the global best position discovered by the entire swarm is denoted as . Additionally, each particle possesses a velocity vector , which governs its movement direction and magnitude during the iterative search process. Through continuous updates of particle positions and velocities—guided by both individual experience () and collective intelligence ()—the algorithm dynamically balances exploration of new regions and exploitation of known optimal solutions, ultimately converging toward globally optimal results.
The specific process of the standard PSO algorithm is as follows:
First, define a fitness function to quantify errors. For the i-th particle, the fitness function can be expressed as follows:
where represent the coordinates before compensation and denotes the optimal values identified by the i-th particle, i.e., the coordinate value after compensation.
Then, define the maximum iteration count , swarm size , particle dimension , maximum position , and maximum velocity . Due to practical considerations in problem-solving, to reduce ineffective searches lacking physical significance, save computation time, and enhance search efficiency, constraints are typically applied to particle positions and velocities by limiting their respective ranges to and . Subsequently, set the maximum iteration count . Thereafter, initialize particle velocities and initialize particle positions .
Finally, begin iteration. In each iteration, update the particle’s position and velocity using the following update formulas:
where represents the velocity of the i-th particle; k denotes the current iteration count; is the inertia weight; and are the learning factors for the population; and and are random numbers within the interval (0,1), i.e., generated by the random function .
Based on the particle’s position, the individual best value and global best value are updated by comparing the fitness values obtained in each iteration. The individual best value is determined as follows:
where represents the historical best fitness value of the i-th particle and denotes the position where the i-th particle achieved this optimal fitness value.
The flowchart of the standard particle swarm optimization (PSO) algorithm is shown in Figure 2.
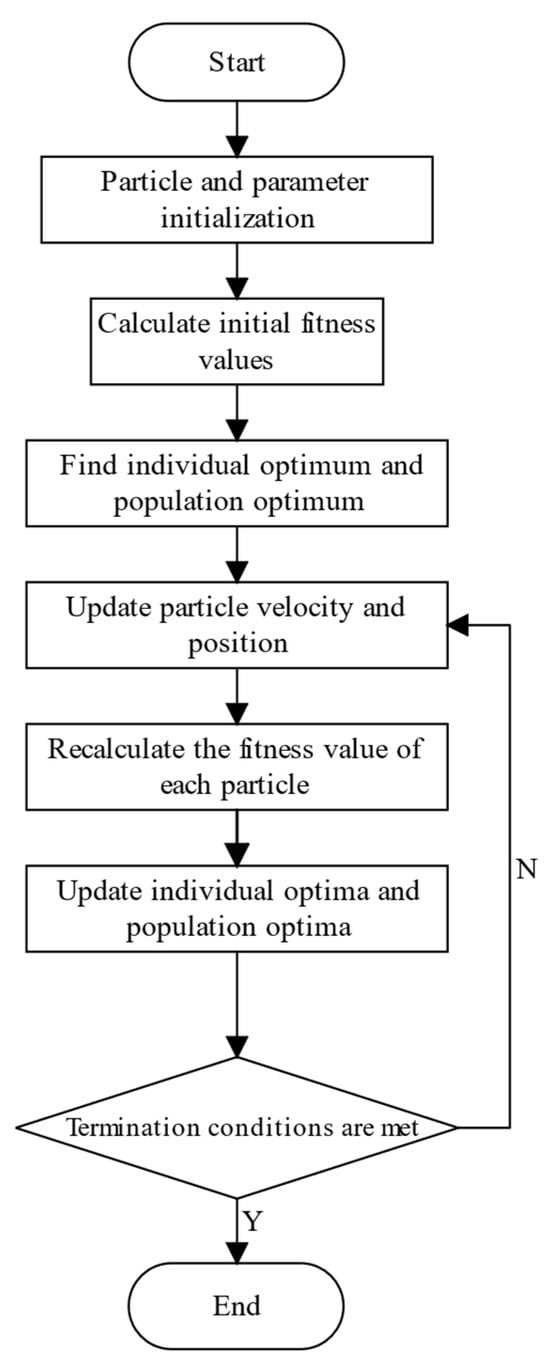
Figure 2.
Flowchart of standard particle swarm optimization algorithm.
The inertia weight factor governs the particle’s retention of its previous velocity, playing a critical role in balancing global exploration (search space coverage) and local exploitation (neighborhood refinement). A larger enhances global search capability by encouraging broader exploration, while a smaller strengthens local searches by focusing on refined exploitation. To achieve an optimal balance, is typically designed as a dynamically varying function throughout iterations. Below, we analyze four representative dynamic adjustment strategies and their performance implications:
The inertia weight minimum value is denoted as , which also represents the initial value of the inertia weight. The current iteration count is , the maximum iteration count is , and the inertia weight maximum value is denoted as , which corresponds to the inertia weight value at the maximum iteration. A constant is introduced to parameterize specific adjustment strategies. The variation curves of the four improved inertia weight factors are illustrated in Figure 3.
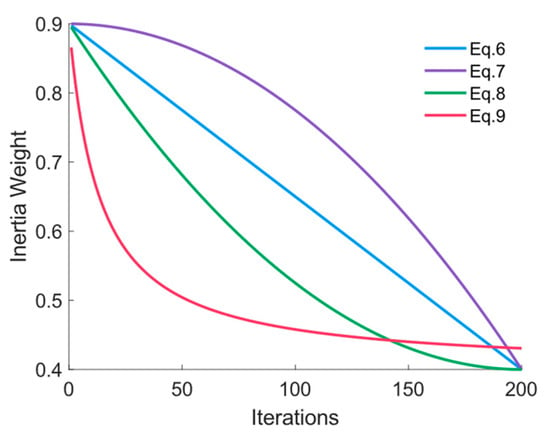
Figure 3.
Trend diagram of the strategy change of the inertia weight factor.
The cognitive learning factor and social learning factor critically influence the adjustment of particle trajectories, representing the particle’s emphasis on individual experiential knowledge and collective swarm experience, respectively. When is assigned a larger value, particles exhibit a stronger tendency to search near their own known optimal positions. Conversely, a larger drives particles to converge toward optimal positions identified by other particles in the swarm.
The enhanced learning factors are designed as follows:
where and represent the predefined maximum and minimum values of the cognitive learning factor, respectively; and denote the predefined maximum and minimum values of the social learning factor, respectively; indicates the current iteration count; and signifies the maximum iteration count.
To assess the efficacy of the enhanced PSO algorithm, the widely adopted Rastrigin function from benchmark test functions is selected. This function is characterized by its highly multimodal nature and abundance of local minima, posing a significant challenge to optimization algorithms: the search process is highly prone to trapping the algorithm in local optima. The mathematical expression of the Rastrigin function is as follows:
where ; .
Both the standard PSO algorithm and the improved PSO algorithm were applied to search for the minimum value of the Rastrigin function, with serving as the fitness function. The computational results are shown in Figure 4.
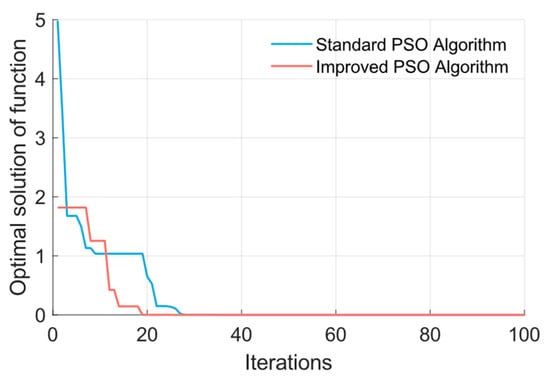
Figure 4.
Optimization process of the Rastrigin function under two optimization algorithms.
As shown in Figure 4, both the improved PSO algorithm and the standard PSO algorithm successfully find the minimum value of the Rastrigin function. However, it can be observed that between 0 and 10 iterations, the fitness function values of both algorithms exhibit a rapid decreasing trend, but the improved PSO algorithm demonstrates a significantly faster descent rate. Furthermore, the improved PSO algorithm reaches a stable state (i.e., finds the optimal solution) at 20 iterations, while the standard PSO algorithm exhibits trapping in local optima between 10 and 20 iterations, leading to gradual stabilization only after 30 iterations. In conclusion, the improved PSO algorithm exhibits significant superior performance compared to the standard PSO algorithm, not only achieving faster convergence but also greater stability and more effective avoidance of local optima.
3.2. Error Compensation Based on Improved PSO Algorithm
Based on the aforementioned improved PSO algorithm, a simulation experiment for Delta robot error compensation is conducted. Forty randomly selected points in the workspace serve as compensation targets. First, the ideal position coordinates of these 40 points are input into the robot’s inverse kinematics program to obtain 40 sets of ideal actuation angles. Using the error model, combined with the robot’s structural parameters and error source magnitudes, 40 sets of actual position coordinates are calculated. To ensure the effectiveness of compensation, parameters including , , , , and spherical joint clearance are randomly varied within [0, 0.100] mm, while , , and are randomly varied within [0, 0.100°].
Given that actuation angle errors exert the most significant impact on robot positioning accuracy among all error sources, the compensation strategy primarily focuses on compensating for the three actuation angle errors of the robot, that is, D = 3. Using the proposed improved PSO algorithm, the optimal actuation angle errors are sought to minimize the comprehensive end-effector error Δe. The parameters of the improved PSO algorithm are configured as follows: swarm size ; maximum iterations ; cognitive learning factor maximum ; cognitive learning factor minimum ; social learning factor maximum ; social learning factor minimum ; inertia weight minimum ; inertia weight maximum ; maximum particle velocity ; and minimum particle velocity .
First, the first set of data was selected and the improved particle swarm optimization (PSO) algorithm was utilized to optimize the robot’s actuation angle errors, with the fitness function defined as follows:
The iteration curve of its fitness function is shown in Figure 5. After 10 iterations, the results stabilized.
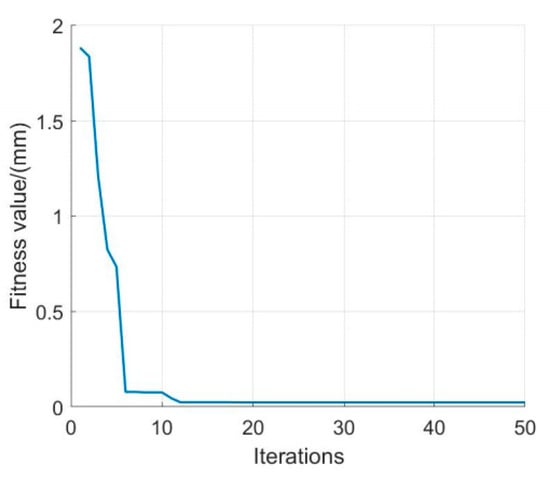
Figure 5.
Error compensation curve based on the improved PSO algorithm.
The 40 groups of data records before and after compensation are shown in Table 2. The results before and after compensation are presented in Figure 6. The average comprehensive error values of the 40 datasets before and after compensation are recorded, denoted as , along with the average error values in the , , and directions, denoted as ,,, as shown in Table 3.

Table 2.
Data coordinates and error values compensated by the improved PSO algorithm.
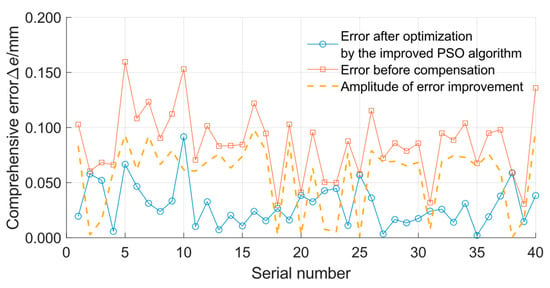
Figure 6.
Effect diagram of error compensation based on the improved PSO algorithm.

Table 3.
Error data before and after compensation by the improved PSO algorithm.
As shown in Figure 6 and Table 3, after applying the improved PSO algorithm for optimization compensation, the errors of most data points are reduced to below 0.050 mm. The average comprehensive error decreases from 0.086 mm before compensation to 0.022 mm after compensation, representing a 74.4% reduction. These results demonstrate the algorithm’s effectiveness in reducing the robot’s overall comprehensive error. However, it is observed that the compensation effect is negligible or even approaches zero for certain data points, as in the bolded sets of data in Table 2, indicating instability in the improvement. Additionally, the average errors in the and directions (, ) are reduced by 36.3% and 10.7%, respectively. However, in the Z direction, the average error increases due to error accumulation along the Z-axis. Therefore, further algorithm optimization is required to enhance stability.
4. Improved PSO-GA Algorithm and Error Compensation
4.1. Improved PSO-GA Algorithm
Among various intelligent algorithms, the genetic algorithm (GA) demonstrates superior capabilities in maintaining population diversity and conducting global search. Unlike the PSO algorithm, its core advantages stem from competitive selection based on fitness values, chromosomal crossover, and chromosomal mutation. These operations facilitate the population’s convergence toward the global optimum while preserving diversity [20]. Inspired by the performance enhancement potential of algorithm hybridization, this study integrates GA’s selection, mutation, and crossover operators into the PSO framework. This integration aims to further improve the algorithm’s global search capability and prevent entrapment in local optima.
When introducing the genetic algorithm’s crossover mechanism into the PSO algorithm, the crossover probability is appropriately increased during the initial iteration phase to enhance population diversity by promoting information recombination among different individuals. In the later iteration phases, as individuals become more similar, maintaining a high crossover rate may lead to increased distance between newly generated individuals and the optimal solution, thereby reducing the proportion of high-fitness individuals in the population. Therefore, the crossover probability should be reduced during the later search stages. The improved crossover probability formula is defined as:
where denotes the initial crossover probability; represents the current iteration count; and indicates the maximum iteration count.
When introducing the mutation operator into the particle swarm optimization algorithm, a higher mutation probability is typically applied during the initial phase to facilitate rapid global search. As the iteration progresses and approaches the optimal solution, the mutation probability gradually decreases to maintain the stability of high-quality solutions and accelerate convergence. Therefore, the following adaptive mutation rate is adopted:
where and denote the maximum mutation probability and minimum mutation probability, respectively; represents the fitness value of the current individual; and and indicate the average fitness value and minimum fitness value of the current population, respectively.
Based on the aforementioned research, a PSO-GA hybrid optimization algorithm is designed. By incorporating the selection, crossover, and mutation mechanisms of the genetic algorithm, it achieves rapid convergence and enhanced global search capabilities. The flowchart is shown in Figure 7.
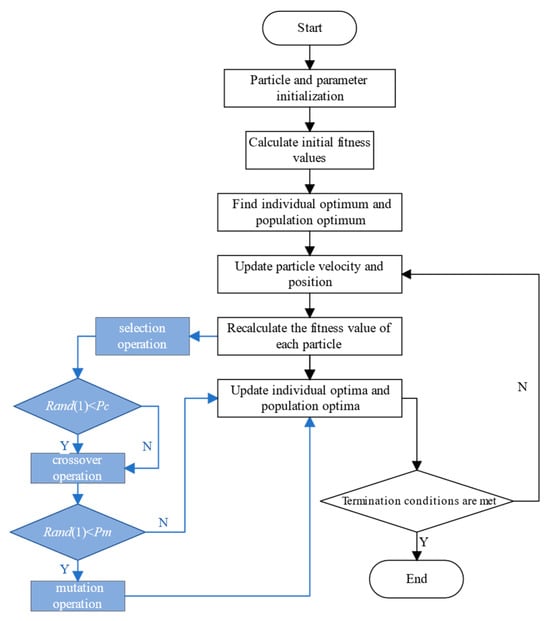
Figure 7.
Flowchart of the improved PSO-GA algorithm.
To validate the effectiveness of the proposed improved PSO-GA algorithm, the Rastrigin function defined in Equation (11) is similarly adopted as the test function, with the fitness function remaining . The computational results obtained using both the improved PSO algorithm and the improved PSO-GA algorithm are shown in Figure 8.
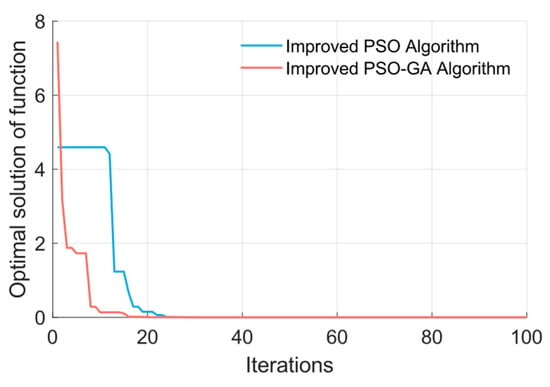
Figure 8.
Calculation result diagram of the improved PSO algorithm and the improved PSO-GA algorithm.
As shown in Figure 8, the improved PSO-GA algorithm exhibits significant performance advantages compared to the improved PSO algorithm: its fitness curve demonstrates rapid decay characteristics during the initial iteration phase, entering a stable state after 20 iterations; in contrast, although the improved PSO algorithm eventually achieves convergence, its descent process is relatively slower, requiring more iterations to stabilize. By comprehensively considering the algorithm’s convergence rate, convergence accuracy, and output stability, the improvements are confirmed to be effective.
4.2. Error Compensation Based on Improved PSO-GA Algorithm
The improved PSO-GA algorithm is applied to perform error compensation on 40 randomly selected datasets, with parameters configured as follows: swarm size ; maximum iterations ; cognitive learning factor maximum ; cognitive learning factor minimum ; social learning factor maximum ; social learning factor minimum ; inertia weight minimum ; inertia weight maximum ; maximum particle velocity ; minimum particle velocity ; initial crossover probability ; minimum crossover probability ; maximum probabilities of variation ; and minimum probabilities of variation .
The 40 groups of data records before and after compensation are shown in Table 4. The results before and after compensation are presented in Figure 9. The average comprehensive error values of the 40 datasets before and after compensation are recorded, denoted as , along with the average error values in the , , and directions, denoted as , , , as shown in Table 5.

Table 4.
Data coordinates and error values compensated by the improved PSO-GA algorithm.
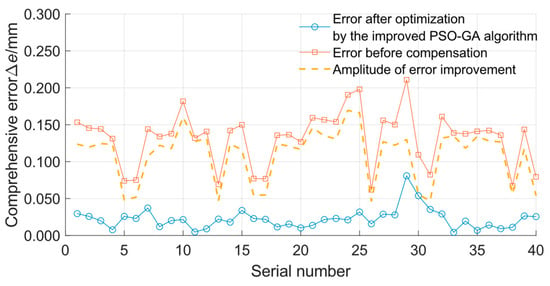
Figure 9.
Effect diagram of error compensation based on the improved PSO-GA algorithm.

Table 5.
Error data before and after compensation by the improved PSO-GA algorithm.
As shown in Figure 9 and Table 5., the improved PSO-GA algorithm demonstrates significant advantages in error compensation. The uncompensated comprehensive error exhibits large fluctuations, with a maximum value approaching 0.200 mm. After applying the improved PSO-GA algorithm, the comprehensive error is substantially reduced, with most data points achieving errors below 0.050 mm. Compared to the previous improved PSO algorithm, the improved PSO-GA algorithm not only further reduces the comprehensive error—average comprehensive error decreases from 0.132 mm to 0.022 mm (an 83.3% reduction)—but also shows that the error improvement magnitude closely aligns with the initial error values, indicating more pronounced compensation effects. Furthermore, the standard deviation of the post-compensation comprehensive error decreases from 0.0193 to 0.0135, demonstrating enhanced compensation stability. These results conclusively show that the improved PSO-GA algorithm outperforms the improved PSO algorithm in robotic error compensation, delivering stronger performance and stability to effectively enhance robot positioning accuracy.
Although the aforementioned improved PSO-GA algorithm exhibits excellent performance in single-point error compensation, robotic motion requires compensation across the entire workspace rather than isolated points. To enhance the global compensation capability, this study proposes a hybrid compensation framework integrating particle swarm optimization with neural networks. The approach leverages PSO’s optimization capability for single-point compensation and then employs neural networks to learn the compensation patterns from these single-point results, ultimately enabling compensation prediction for unknown points.
5. Error Compensation Based on Improved PSO-GA-BP Algorithm
The BP (Back Propagation) neural network is a type of multi-layer feedforward neural network model. In neural network design, the number of hidden layers and node quantity are critical factors influencing the network’s performance. This section adopts a three-layer BP neural network architecture with one hidden layer. The number of hidden layer nodes is determined using the following empirical formula:
where represents the number of hidden layer nodes; and denote the number of input layer nodes and output layer nodes, respectively; and is an adjustment parameter, taking an integer value between 5 and 10. For the error compensation problem addressed in this study, the input parameters include actual coordinate points; thus, the number of input layer nodes is 3. The output quantities are actuation angle compensation values, so the number of output layer nodes is also 3. According to the empirical formula, the number of hidden layer nodes should fall within the range of 8 to 13.
The flowchart is shown in Figure 10.
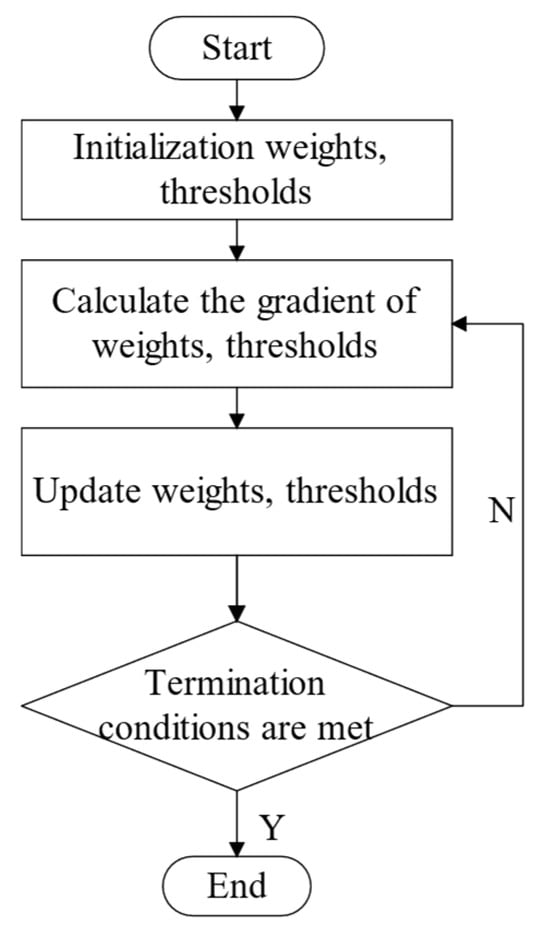
Figure 10.
BP network training flowchart.
To enable the BP neural network to compensate for robot errors, a dataset must be collected and the neural network trained. First, 5000 sets of coordinate values are randomly generated within the workspace and input into the error model, where all error sources are randomly selected within defined ranges following uniform distributions to ensure dataset diversity and generality. Positional errors are then calculated for each dataset. Subsequently, the improved PSO-GA algorithm is applied to optimize these 5000 datasets, deriving optimal actuation angle compensation values. The original coordinates and optimal compensation values are combined to form a 6-dimensional dataset (3D coordinates + 3D compensation angles). This dataset is split into a training set and a test set at a 4:1 ratio. The neural network is trained using the training set, with the comprehensive error as the objective function, and validated through predictions on the test set. To demonstrate compensation effectiveness, 40 predicted datasets are analyzed. The neural network parameters are configured as detailed in Table 6.

Table 6.
Parameters of BP neural network.
After configuring the neural network parameters, the neural network is trained using the training set, with the training effect illustrated in Figure 11. During the initial training phase (iterations 0–200), the mean squared error (MSE) decreases rapidly. Since the training met the precision requirement of 0.0025, the process was terminated early at iteration 3744.
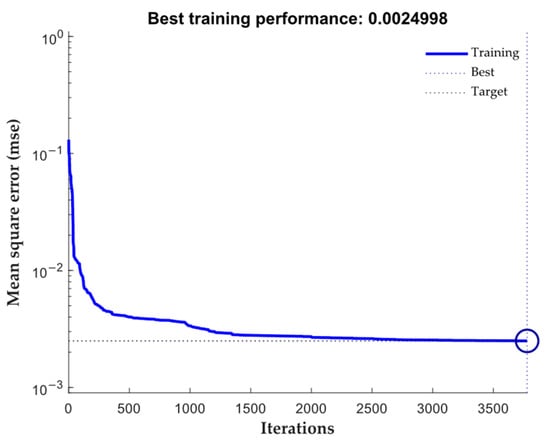
Figure 11.
Neural network training performance.
The trained network is used for prediction on the test set. To visually demonstrate the network’s prediction performance, 40 datasets from the test set are selected to record their uncompensated errors, errors after compensation by the improved PSO-GA algorithm, and errors after compensation predicted by the BP network, as shown in Figure 12 and Table 7.
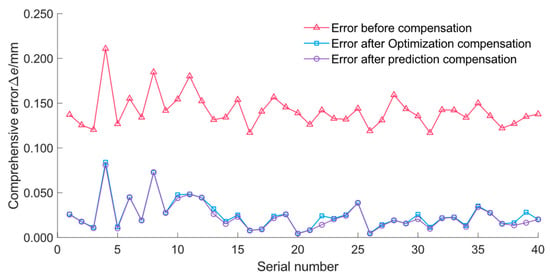
Figure 12.
Error compensation result diagram based on the PSO-GA-BP algorithm.

Table 7.
Error data before and after compensation by the improved PSO-GA-BP algorithm.
As shown in Figure 12 and Table 7, the errors after predicted compensation closely match the errors after optimized compensation by the improved PSO-GA algorithm (i.e., the prediction targets). In most datasets, the predicted compensation even achieves smaller errors. Among the 40 random datasets, the predicted compensation reduces errors by 83.8% compared to the uncompensated errors, outperforming the 81.7% reduction from optimized compensation alone. Additionally, the standard deviation of the predicted compensation errors is slightly lower than that of the optimized compensation errors. These results demonstrate that the improved PSO-GA-BP error compensation algorithm—combining optimized compensation via the improved PSO-GA algorithm with BP neural network predictions—effectively reduces robotic end-effector errors and enhances positioning accuracy.
6. Conclusions
Given the significant impact of actuation angle errors on positioning accuracy, an improved PSO-GA-BP error compensation algorithm targeting actuation angle compensation is proposed. This algorithm enhances the global search capability and convergence performance by modifying the inertia weight and learning factors of the particle swarm optimization algorithm. Additionally, it improves population diversity through the introduction of selection, crossover, and mutation mechanisms from the genetic algorithm. Finally, the predictive capability of the BP neural network is utilized to achieve global error prediction and compensation. The simulation results demonstrate that the algorithm reduces the robot’s comprehensive error by 83.8%, significantly improving the positioning accuracy, thereby validating its effectiveness and applicability. This approach provides a novel solution for error compensation in parallel robots.
Author Contributions
K.Y. data curation, software, writing—original draft, methodology; Z.P. data curation, software, writing—original draft, methodology; L.Z. editing and methodology; Q.L. writing—review and editing, supervision; D.S. writing—review and editing, supervision. All authors have read and agreed to the published version of the manuscript.
Funding
This work was supported by the National Natural Science Foundation of China (52174154).
Institutional Review Board Statement
Not applicable.
Data Availability Statement
Data are contained within the article.
Conflicts of Interest
The authors declare they have no conflicts of interest to report regarding the present study.
References
- Gündoğdu, F.K.; Kahraman, C. A novel spherical fuzzy QFD method and its application to the linear delta robot technology development. Eng. Appl. Artif. Intell. 2020, 87, 103348. [Google Scholar] [CrossRef]
- Carabin, G.; Scalera, L.; Wongratanaphisan, T.; Vidoni, R. An energy-efficient approach for 3D printing with a Linear Delta Robot equipped with optimal springs. Robot. Comput.-Integr. Manuf. 2021, 67, 102045. [Google Scholar] [CrossRef]
- Yang, H.L.; Chen, L.; Ma, Z.B.; Chen, M.; Zhong, Y.; Deng, F.; Li, M. Computer vision-based high-quality tea automatic plucking robot using Delta parallel manipulator. Comput. Electron. Agric. 2021, 181, 105946. [Google Scholar] [CrossRef]
- Wang, K.; Li, J.; Shen, H.P.; You, J.; Yang, T. Inverse dynamics of A 3-DOF parallel mechanism based on analytical forward kinematics. Chin. J. Mech. Eng. 2022, 35, 119. [Google Scholar] [CrossRef]
- Yang, Y.B.; Wang, M.X. Modeling and analysis of position accuracy reliability of R(RPS&RP)& 2-UPS parallel mechanism. Chin. J. Mech. Eng. 2023, 59, 62–72. [Google Scholar]
- Wang, M.H.; Wang, M.X. Dynamic Modeling and Performance Evaluation of a New Five-DOF Hybrid Robot. Chin. J. Mech. Eng. 2023, 59, 63–75. [Google Scholar]
- Huang, Z. The parallel robot manipulator and its mechanism theory. J. Yanshan Univ. 1998, 22, 13–27. [Google Scholar]
- Zhang, T.; Sun, H.; Peng, F.; Tang, X.; Yan, R.; Deng, R. An online prediction and compensation method for robot position errors embedded with error-motion correlation. Measurement 2024, 234, 114866. [Google Scholar] [CrossRef]
- Zhang, J.; Jiang, S.J.; Chi, C.C. Kinematic calibration of a 2UPR&2RPS redundantly actuated parallel robot. J. Mech. Eng. 2021, 57, 62–70. [Google Scholar]
- Cheng, X.; Tu, X.; Zhou, Y.; Zhou, R. Active disturbance rejection control of multi-joint industrial robots based on dynamic feedforward. Electronics 2019, 8, 591. [Google Scholar] [CrossRef]
- Zhang, Z.; Guo, K.; Sun, J. High-precision Closed-loop Robust Control of Industrial Robots Based on Disturbance Observer. J. Mech. Eng. 2022, 58, 62–70. [Google Scholar]
- Zhu, W.; Li, G.; Dong, H.; Ke, Y. Positioning error compensation on two-dimensional manifold for robotic machining. Robot. Comput.-Integr. Manuf. 2019, 59, 394–405. [Google Scholar] [CrossRef]
- Shu, T.T.; Gharaaty, S.; Xie, W.F.; Joubair, A.; Bonev, I.A. Dynamic path tracking of industrial robots with high accuracy using photogrammetry sensor. IEEE/ASME Trans. Mechatron. 2018, 23, 1159–1170. [Google Scholar] [CrossRef]
- Wang, Y.; Liu, L.; Chen, J.; Ju, F.; Chen, B.; Wu, H. Practical robust control of cable-driven robots with feedforward compensation. Adv. Eng. Softw. 2020, 145, 102801. [Google Scholar] [CrossRef]
- Zhang, C.; Ding, S. A stochastic configuration network based on chaotic sparrow search algorithm. Knowl.-Based Syst. 2021, 220, 106924. [Google Scholar] [CrossRef]
- Chen, L.F.; Lin, J.Y.; Wang, L.; Lin, J.; Qina, J.; Wang, B. Joint Angle Error Compensation and Kinematic Calibration of Six-axis Serial Robots. Acta Metrol. Sin. 2024, 45, 1753–1761. [Google Scholar] [CrossRef]
- Wang, W.; Tian, W.; Liao, W.; Li, B.; Hu, J. Error compensation of industrial robot based on deep belief network and error similarity. Robot. Comput.-Integr. Manuf. 2022, 73, 102220. [Google Scholar] [CrossRef]
- Bo Li Wei, T.; Zhang, C.; Hua, F.; Cui, G.; Li, Y. Positioning error compensation of an industrial robot using neural networks and experimental study. Chin. J. Aeronaut. 2022, 35, 346–360. [Google Scholar]
- Shang, D.; Li, Y.; Liu, Y.; Cui, S. Research on the motion error analysis and compensation strategy of the delta robot. Mathematics 2019, 7, 411. [Google Scholar] [CrossRef]
- El-Shafiey, M.G.; Hagag, A.; El-Dahshan, E.S.A.; Ismail, M.A. A hybrid GA and PSO optimized approach for heart-disease prediction based on random forest. Multimed. Tools Appl. 2022, 81, 18155–18179. [Google Scholar] [CrossRef]
Disclaimer/Publisher’s Note: The statements, opinions and data contained in all publications are solely those of the individual author(s) and contributor(s) and not of MDPI and/or the editor(s). MDPI and/or the editor(s) disclaim responsibility for any injury to people or property resulting from any ideas, methods, instructions or products referred to in the content. |
© 2025 by the authors. Licensee MDPI, Basel, Switzerland. This article is an open access article distributed under the terms and conditions of the Creative Commons Attribution (CC BY) license (https://creativecommons.org/licenses/by/4.0/).