Abstract
Predicting diseases in the early stages is extremely important. By taking advantage of advances in deep learning and fuzzy logic techniques, a new model is proposed in this paper for disease evaluation depending on the adaptive neuro-fuzzy inference system (ANFIS) with a genetic algorithm (GA) for classification, and the pre-trained DenseNet-201 model for feature extraction, in addition to the whale optimization algorithm (WOA) for feature selection. Two medical databases (chest X-ray and MRI brain tumor) for the diagnosis of two disease types were used as input in the suggested model. The optimization of ANFIS parameters was performed by GA to achieve the optimum prediction capability. DenseNet-201 for feature extraction was employed to obtain better classification accuracy. Having more features sometimes leads to lower accuracy, and this issue can be rectified using a feature selection strategy WOA which gave good results. The proposed model was evaluated utilizing statistical metrics root mean square error (RMSE), mean square error (MSE), standard deviation (STD), and coefficient of determination (), and it was compared with the conventional ANFIS model, with the proposed model (ANFIS-GA) showing a superior prediction capability over the ANFIS model. As a result, it can be concluded that the proposed ANFIS-GA model is efficient and has the potential for a robust diseases evaluation with good accuracy. Also, we conclude from this work that integrating optimization algorithms with ANFIS boosts its performance, resulting in a more accurate and reliable model.
Keywords:
medical images datasets; DenseNet-201; whale optimization algorithm; ANFIS; genetic algorithm MSC:
68U10
1. Introduction
In recent years, the application of machine learning algorithms in medicine has grown in popularity. Using frameworks based on machine learning, physicians can use medical imaging to diagnose any kind of diseases []. Deep neural networks (DNN) and adaptive neuro-fuzzy inference systems (ANFIS) are two well-known methods for handling a variety of real-world issues, such as education, medicine, economic systems, and many more. Diseases can be accurately predicted using ANFIS-based predicting models that use expert knowledge and experience []. ANFIS is a modern hybrid artificial intelligence (AI) system that is important in prediction, modeling, and inference []. It is a fuzzy inference system (FIS) constructed in an adaptive network framework that combines the benefits of neural networks and fuzzy logic []. It is based on the Takagi–Sugeno FIS, which was created in the early 1990s []. This model can learn new values on its own and may be used to construct membership functions and IF-THEN rules from the data. This indicates that the ANFIS model preserves both the learning ability derived from neural networks and the transparency of the fuzzy system [].
In this paper, a new model is proposed for diseases evaluation depending on the ANFIS with a genetic algorithm (GA) for classification, and the pre-trained DenseNet-201 model for feature extraction, in addition to the whale optimization algorithm (WOA) for feature selection.
Important features extracted from medical images are of uppermost importance. The utilization of deep learning (DL) models, specifically convolutional neural networks (CNN), proved their ability to extract valuable features in image classification tasks, where the hand-crafted features used in image analysis are incapable of providing many meaningful features []. The feature extraction technique necessitates transfer learning approaches, in which pre-trained CNN models learn general features on large-scale datasets such as ImageNet and then transfer them to the desired job. The availability of pre-trained CNN models such as AlexNet, VGGNet, Xception, ResNet, and DenseNet greatly facilitates the important feature extraction operation, which helps in obtaining a good classification []. After the series of experiments, we used the DenseNet-201 model in this work to extract features from medical images. When importing extracted features, the accuracy may be reduced if there are a lot of irrelevant features. In such circumstances, a feature selection approach can be used to lower the number of features by removing irrelevant features and selecting just the most important features for classification. As a result, feature selection improves prediction accuracy while simultaneously decreasing computation time []. There are numerous feature selection algorithms. In this work, the WOA was used to choose a subset of the best features that reflect the important and meaningful features extracted from the pre-trained CNN model (DenseNet-201) of the medical datasets.
For classification, this work proposes a model depending on the ANFIS for diagnosing diseases. The suggested ANFIS model was trained by using the GA to obtain an optimal structure with good accuracy and by optimizing the parameters of the ANFIS membership functions, which facilitated the building of new model with high levels of accuracy and flexibility, and low execution time requirements. The main goal of integrating GA and ANFIS is to reduce complications by optimizing the parameters of the ANFIS membership functions. In terms of the clustering method, fuzzy c-means clustering (FCM) is selected for the suggested model, which is a popular clustering technique for automatically arranging and categorizing a wide range of information. FCM is favored over other clustering techniques because it processes data quickly and lets items belong to multiple groups instead of just one. Furthermore, the FCM is resistant to ambiguity and may preserve substantially more data than any other clustering approach [].
The major objective of this paper is to have a better and optimized ANFIS approach to classify medical databases.
To evaluate the proposed system, it was applied to two different medical datasets, chest X-ray and MRI brain, to diagnose two types of dangerous diseases spread in the world, which are lung diseases and brain tumors []. Lung diseases are widespread worldwide, so it is crucial to diagnose lung disease as soon as possible because it carries a high risk []. Over 4 million premature deaths are estimated to be caused by lung diseases, such as COVID-19 and pneumonia []. Therefore, it is now more crucial than ever to detect lung diseases early []. Brain tumors are the tenth most common cause of mortality []. Every year, around 250,000 people are affected with brain tumors, with 2% of those cases being verified as malignancies []. Early detection of these diseases and adequate treatment may reduce mortality [].
The efficacy of the proposed approach (ANFIS-GA) was assessed utilizing various statistical metrics such as mean square error (MSE), root mean square error (RMSE), standard deviation (STD), and coefficient of determination (). Finally, the outcomes were compared with the conventional ANFIS model and modern related work that used the ANFIS system in the diagnosis of diseases. The proposed system showed good performance.
The major contributions of this paper are summarized as follows:
- We analyzed more than one medical image database (chest X-ray, MRI brain) and applying the proposed system to these datasets in binary classification (classify the brain images into tumor and non-tumor) and multi-classification (classify the lung images into normal, pneumonia and COVID-19) to increase generalizable the proposed system.
- We extracted a deep robust set of features from medical images (lung and brain images) using the DenseNet-201 model to help in achieving satisfactory results in the classification.
- We employed a WOA method to select optimal features extracted from the Dense-Net-201 model to improve the classification accuracy.
- We employed a GA to optimize the parameters of the ANFIS model to obtain a model more accurate than the conventional ANFIS model.
- We used the combination of deep learning (DenseNet-201) and GA optimizer with ANFIS classifier to build a new hybrid model (ANFIS-GA) for diagnosing diseases.
- We evaluated the proposed system ANFIS-GA based on performance metrics and compared with the conventional ANFIS model and other systems in modern studies that used ANFIS to prove the performance and effectiveness of the system in diagnosing diseases.
- We contributed by proposing a new diagnostic system based on medical images with good predictive accuracy in the diagnosis of diseases in early stages.
- The proposed system in this paper contributes to the expanding field of utilizing optimization algorithms in the prediction of diseases in the early stages.
The structure of this paper is organized as follows: Section 2 contains a description of some related studies presented in recent years. The concepts of the used methods are described in Section 3. Section 4 presents the model performance evaluation. In Section 5, the experimental results for the proposed model are shown. Discussion and future direction are included in Section 6. Finally, Section 7 introduces the conclusions of the paper.
2. Related Works
Nowadays, new models based on ANFIS are employed as good disease prediction classifiers. ANFIS has been used in a variety of current research in the medical field. For instance, the authors in [,,,] used the ANFIS system to diagnose COVID-19, and the ANFIS model had good accuracy for predicting and diagnosing COVID-19. In [], the authors proposed an ANFIS model for the prediction of diabetes, and the proposed model attained good results in classification. In [], the authors used the ANFIS model for breast cancer diagnosis, the suggested approach obtained 86.2% classification accuracy for the breast cancer diagnosis. In [], ANFIS model has been employed for diagnosing prostate disorders, and evaluation findings from the proposed system showed that the system achieved accurate diagnosis results. The intelligent decision-making and medical imaging features of ANFIS improve classification performance. Nonetheless, estimating ANFIS parameters is a tough task that must be addressed. In recent years, some researchers have focused on increasing the ANFIS approach’s learning capabilities by merging the model with intelligent optimization algorithms. Modern studies utilized various optimization strategies for ANFIS parameters to improve their performance, which has a significant impact on ANFIS performance.
Some studies utilized optimization algorithms to increase the performance of the ANFIS model to predict diseases in medical images. The optimization algorithms allow for the optimization of the results in an ANFIS system of classification of diseases. Thus, using optimization algorithms encouraged the presentation of an alternative hybridization-based forecasting method by using the algorithm as an optimizer with ANFIS to create a new hybrid classifier. In [], the impacts of different climate-related parameters and population density on the spread of COVID-19 were examined through the application of the viral optimization algorithm (VOA) in conjunction with ANFIS, the findings demonstrated that the population density variable had the greatest influence on the created models’ performance, highlighting the role that social distancing has in lowering COVID-19 infection and transmission rates. The authors of [] proposed a model for diagnosing neurodegenerative illnesses such as Parkinson’s disease, the proposed method aimed to improve ANFIS efficiency by utilizing a modified glowworm swarm optimization algorithm (M-GSO), and the differential evolution (DE) technique was employed to improve glowworm behavior. Using the DE-GSO method, the proposed (DE-GSO-ANFIS) technique determined appropriate ANFIS prediction parameters, and the outcomes of the experiments demonstrate that the DE-GSO-ANFIS performs better than comparable methods in forecasting medical disease. In [], a GA-trained ANFIS model for the diagnosis of cardiac disease is presented. ANFIS membership function parameters were optimized using the GA, the experiment was run on the open datasets for cardiac disease at UCI, the experimental results indicated that the proposed system attained satisfactory results with an accuracy of 91.25% on the testing set. In [], the particle swarm optimization (PSO) algorithm was employed by the authors to train inputs and optimize ANFIS to enhance the efficacy of the ANFIS in HIV (human immunodeficiency virus) diagnosis, the results demonstrated that PSO implementation can significantly integrate with other advancement optimization techniques and overcome the conventional deduction framework. The hybrid method described in [] ANFIS-GWO, combined the ANFIS with grey wolf optimization (GWO) for the diagnosis of liver problems, the experimental results showed that the ANFIS-GWO technique outperforms classic FIS and ANFIS models in terms of performance, this implies that incorporating GWO optimization enhances the ANFIS model’s diagnostic accuracy for liver disease diagnosis significantly. We concluded through searching previous studies that a sizeable number of studies were carried out for the assessment and prediction of diseases utilizing the ANFIS approach. However, few research works are accessible that utilize the optimization algorithms and ANFIS model for the diagnosis of diseases.
To our knowledge, no research has been found to conduct studies on the combination of CNN-based features extraction and ANFIS, ANFIS-GA classifiers for the evaluation of diseases. Regarding this research goal, we have developed a model structure for detecting lung and brain tumor diseases from chest X-ray and MRI brain images with the utilization of the DenseNet-201 model as feature extractors and ANFIS, and ANFIS-GA as classifiers. In addition, no research has been conducted to forecast and analyze the two medical databases used in this work by utilizing a combination of ANFIS and an evolutionary algorithm (GA).
3. Materials and Methods
The suggested framework is described in this section, which consists of six stages: in the first stage, the selected medical datasets are entered to be analyzed in the next stages; in the second stage, the medical datasets are preprocessed; in the third stage, features are extracted that help in classification; in the fourth stage, features are selected and reduced using feature selection method. In the fifth stage, the important selected features are classified using the proposed model (ANFIS-GA), and finally evaluate the proposed model by evaluation performance measures. Figure 1 depicts the proposed framework’s whole workflow. The developed model objects to improve the capacity of the ANFIS model to diagnose medical images by utilizing the behavior of the GA algorithm to identify the ideal ANFIS parameters.
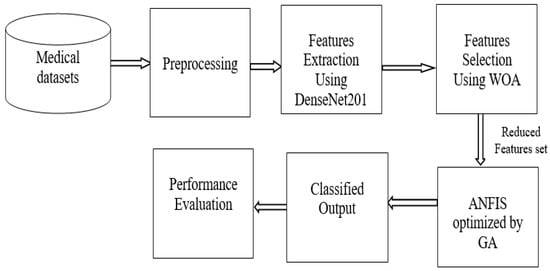
Figure 1.
Workflow of the proposed model.
3.1. Medical Images Datasets
In this paper, two groups of medical databases have been utilized, the first dataset (DB1) included images of chest X-rays obtained from Kaggle []. The second dataset (DB2) included MRI images for brain images obtained from Kaggle []. The databases approved in this paper were split into 70% for the training and 30% for the testing. Table 1 shows the distribution of the dataset images that were used in classification (classify the chest X-ray dataset into normal, pneumonia, COVID-19, and the MRI brain dataset into tumor, and non-tumor).

Table 1.
The distribution of the medical datasets used in the proposed system.
Images were captured in the JPG format, with different resolution sizes, the sizes were standardized to 224 × 224 pixels. Figure 2 shows a random selection of images from DB1 and DB2.
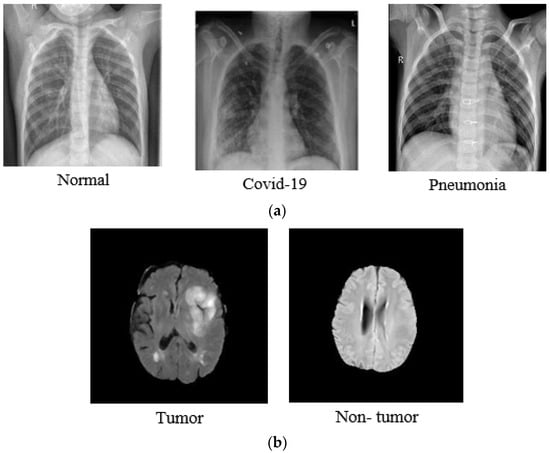
Figure 2.
Random images from DB1 and DB2 (a) Sample images from chest X-ray dataset; (b) sample images from MRI brain dataset [,].
3.2. Datasets Preprocessing
Preprocessing is an important step in achieving better results. Before entering the images of the dataset into the DenseNet-201 model to extract the features, some pre-processing processes are performed on them. Image preprocessing involves resizing images and normalization. Because the original images collected from the datasets varied in size and format, all images were changed the size to 224 × 224; this size was selected to fit the DenseNet-201 input. All images of the databases are in JPG format.
Normalization is a critical method for deep neural network training. It normalizes input data and eliminates undesirable traits and data redundancies []. The dataset is normalized between 0 and 1. Every image pixel is multiplied by a factor of 1/255. This has been performed to achieve pixel intensity consistency throughout the dataset [].
3.3. DenesNet-201 Model
CNNs can automatically learn and represent complicated features, in contrast to typical machine learning techniques that depend on handcrafted feature extraction []. Meanwhile, CNN-based models might differ in terms of convolution layer kind and number, size of kernel, pooling operation, and fully linked layers []. The features can be extracted from different models of pre-trained CNN models like VGG, SqueezeNet, EfficientNet, Inception, ResNet, and DenseNet and using the deep features in classification medical images to diagnose some diseases such as lung diseases and brain tumors [,,,,,].
In general, deep convolutional neural networks (DCNNs) are the most successful image recognition frameworks because of the unique sorts of convolutional and pooling layers they contain. DCNNs are an architecture that focuses on making the deep learning networks go even deeper, but at the same time making them more efficient to train, by using shorter connections between the layers. However, as the network becomes deeper, the input information or gradient flowing through most of the levels dissipates by the time the last layer is reached. DenseNets solve the gradient vanishing problem by connecting all the layers with equal feature sizes directly with each other [,].
This paper suggested employing DenseNet-201 as the ideal model for the features extraction phase after a series of experiments were conducted. Therefore, this section deals with the description of the DenseNet-201 model structure and its contribution to features extraction from databases (chest X-ray, MRI brain) that were selected in this work.
DenseNet-201 is a CNN with 201 layers. It loads a pre-trained network that has been trained on more than a million images by using the ImageNet database. The network categorizes images into 1000 different object groups of various kinds of images. Consequently, the network has learned a variety of feature representations for various image kinds. The image input size of the network is 224 × 224. The main reason for employing the DenseNet-201 structure as a feature extractor is that the deeper the network, the more generic features may be collected [,]. The fundamental principle of the DenseNet design is the ability to concatenate the feature maps generated by each layer to provide the input for the subsequent layer. This indicates that there are connections between each layer and all other layers []. This provides a benefit to solving the vanishing-gradient problem resulting from dissipating the input information via the majority of the levels down to the last layer, with its densely connected layers, DenseNet-201 can extract significant features, being appropriate for tasks that need fine-grained discrimination [].
This work’s DenseNet-201 design contains 708 layers and approximately 20 million parameters. A representation of DenseNet-201 architecture is given in Figure 3. The structure includes the following: an input layer, the image dimensions of which are set at 224 × 224; four dense blocks which are implemented by a 1 × 1 convolution before the 3 × 3 convolution layer, decreasing the feature maps and lowering calculation cost; between the dense blocks, there are three transition layers that consist of a batch normalization layer, a 1 × 1 convolution layer, and a 2 × 2 average pooling layer with a stride of 2; global average pooling layer is similar to traditional pooling approaches except it reduces the feature maps, having a dropout layer with a 0.2 dropout rate, meaning that 20% of the neurons will produce zero at the end of the layer, and this is performed to prevent overfitting; the last layers are fully connected layer (FCL) and Softmax. Nonlinear transformations such as convolution (Conv), pooling, rectified linear units (ReLU), and batch normalization (BN) are implemented in each layer of the DenseNet-201 model. The DenseNet-201 model utilizes transfer learning to automatically extract features and uses the weights it has learned from the ImageNet dataset to minimize computation workload, it permits the creation of simple and uncomplicated models, and features can be reused over layers, boosting the architecture’s parameters efficiency, and permitting for more diversity and higher performance in later layers. The structure employs a feed-forward approach to connect each layer [,].
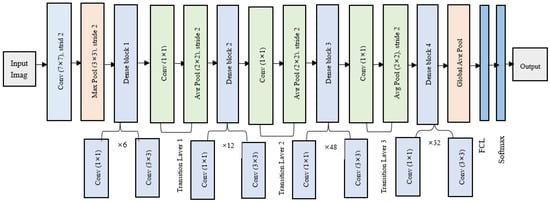
Figure 3.
DenseNet-201 architecture.
The task of feature extraction from the model illustrated in Figure 3 applies to all the layers of the model aside from the final classification layer. The final feature representation was translated as a 1 × 1000 dimension vector, which was then fed as input into the ANFIS and ANFIS-GA classifiers after reduced features.
Figure 4 illustrates the detailed architecture of the first part of Matlab implementation for the DenseNet-201 model (layers number, and the model parameters).
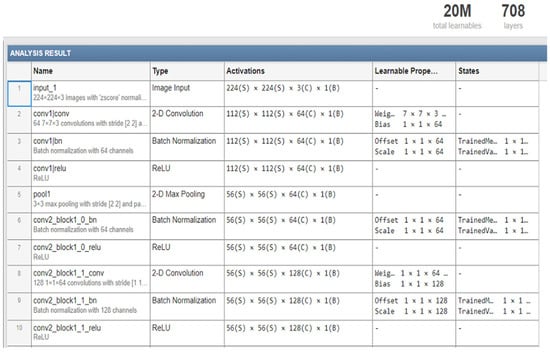
Figure 4.
The detailed structure of part of DenseNet-201 model.
Details of the information on the main layers in the pre-trained DenseNet-201 architecture are given in Table 2.
Table 2.
Layers in pretrained DenseNet-201 architecture.
3.4. Whale Optimization Algorithm (WOA)
The WOA feature selection method filters the extracted features utilizing the DenseNet-201 model by choosing the most significant features that optimize classification accuracy. WOA is a sophisticated optimization method that is dependent on whale hunting behavior. It is practiced by employing a unique strategy for successful hunting for prey. This approach is divided into three stages: circling hunting, bubble-net attacking, and prey hunting []. In the circling phase, the whales set the trap by circling the prey. Because the position of the optimal design in the search space is unidentified at the beginning, the WOA method supposes that the target prey, or near to it, is the current best candidate solution. When the best search agent is found, the remaining search agents will attempt to adjust their positions to match the top search agent. This can be represented mathematically in (1). The whales then utilize the spiral around and spiral update ways to participate in the bubble-net attacking technique. Based on the search agent, the whales spiral toward their target. Equation (2) can be used to find the current position of the remaining search agents as they come closer to the best agent [].
is the current position; is the local optimal position; t is the current iteration. It is worth noting that must be updated in every iteration if a more suitable option exists. The coefficient vectors and are computed using Equations (3) and (4).
where is a random vector between 0 and 1; is reduced linearly from 2 to 0 during iterations.
To improve the exploration in WOA, a solution selected at random is employed to update the position by the location of the best solution identified thus far, rather than forcing the solutions to search at random depending on that position. Thus, to drive a solution to deviate significantly from the most well-known search agent, a vector A with random values higher than 1 or less than −1 is employed, and the search agent’s random position is computed by (5) and (6) [].
where is a random position vector choice from the current population, and {, } are coefficient vectors as illustrated in Equations (3) and (4).
Whales can select between either the shrink encircling or the spiral model to update the position of whales to approach the prey. The chance of choosing the path is represented by Equation (7).
where = Updated means the updated position of the whales; is the local optimal position; refers to the distance of the whale to the prey; refers to the coefficient vector as illustrated in Equation (4); b is a constant that represents the shape of the logarithmic spiral; is the random number between −1 and +1; and p is a number that is randomly chosen between 0 and 1.
After the whale arrives at the prey, hunting begins.
The flowchart of the WOA algorithm is represented in Figure 5.
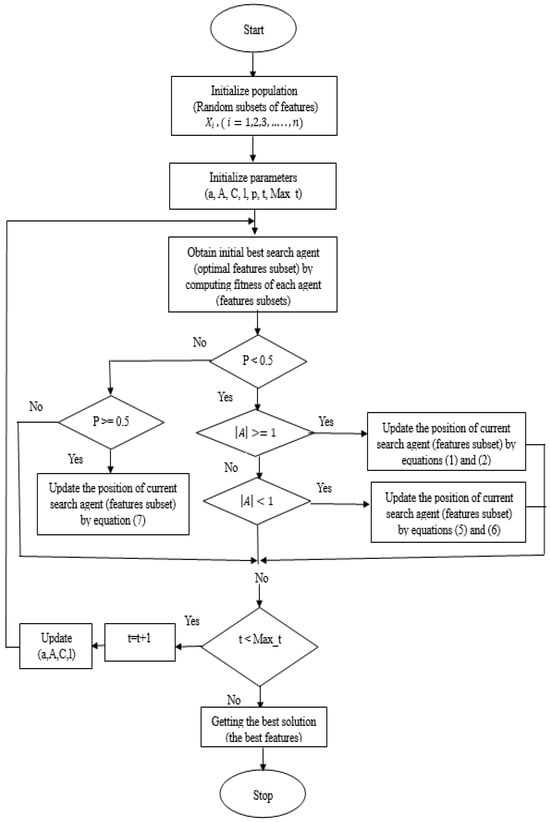
Figure 5.
Flowchart of WOA algorithm.
In the WOA-based feature selection, we need to initialize the whale population (the randomly chosen features were utilized as the positions of whales). Next, we assess the fitness value to specify the fitness of every search agent), a search agent represents the feature subset that possesses the optimal solution. The number of iterations is then set to 1. Then, we look for prey (an optimal solution that refers to the best features subset). After we have found the prey, we encircle it. After that, the bubble-net attacking approach is used to update the other feature subsets; that is, the placements of the whales depend on the strongest feature subset. The updated positions are utilized as the placements of the whales for the later iteration. Then, we change the values of (a, A, C, l) with the new position. After that, we check the equality and inequality constraints of {A} and {p} for each new position and then increase the iteration number. Finally, if we reach the maximum number of iterations, we will stop and preserve the best solution (optimal subset features); otherwise, this process is continued until the subset of features with the highest level of information is found.
The chosen features were utilized as the input to the ANFIS and ANFIS-GA classifiers that were used in this paper to diagnose diseases in medical databases (chest X-ray, MRI brain). The experiments of the WOA on the datasets showed that 100 iterations as seen in Figure 6 were adequate for the algorithm to obtain the best features for datasets. We can describe the steps of the algorithm WOA for features selection as follows (Algorithm 1):
| Algorithm 1. The WOA algorithm |
| Input: All the features extracted from the DenseNet-201 model (1000 features) Output: Selected optimal features Step1: Initializing the subsets of features that were randomly selected Step2: Initializing the iteration counter t = 1 Step3: Initializing the value of a = 2 (it is reduced from 2 to 0) (A, C) utilizing a random value (according to Equations (3) and (4)) Step4: Computing fitness function of each subset features to find a set of features with high accuracy represents the best subset of features selected Step5: Updating the position of the current features subset depend on |A| and p: For each feature subset In the case (p < 0.5) If (|A| ≥ 1) Update current features subset by Equations (1) and (2) If (|A| < 1) Select a random agent Update current features subset by Equations (5) and (6) In the case (p ≥ 0.5) Update current features subset by Equation (7) Step6: If t < Max_t (Max_t refers to the Maximum number of iterations and is set to 100) Update values (a, A, C, l) Repeat the steps (4 and 5) Step7: If t ≥ Max_t Return the best solution |
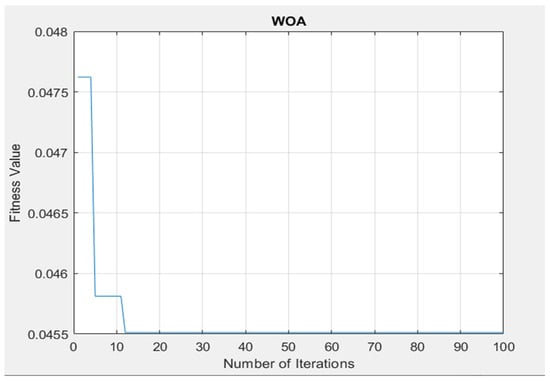
Figure 6.
The performance of applied WOA to tune the fitness value and the maximum number of iterations.
The steps (4 and 5) were repeated until the best features subset was obtained after 100 iterations with an accuracy of up to 95.8%.
For DB1 (chest X-ray dataset), the best features subset contained 143 features.
For DB2 (brain tumor dataset), the best features subset contained 96 features.
3.5. Adaptive Nero-Fuzzy Inference System (ANFIS)
ANFIS is a hybrid model that integrates FIS and ANN []. The ANFIS model is dependent on the Takagi–Sugeno inference system guided by the IF-THEN rule and stimulated as a five-layered neural network utilizing the FIS concept []. The number of membership functions and fuzzy rules play an important role in the design of ANFIS []. In comparison to Mamdani FIS, the Sugeno membership parameters are automatically selected []. Adjusting the parameters is critical for the system. Frequently, conventional ANFIS models use the LSE-GD hybrid learning approach to adjust the parameters, which is a hybrid algorithm that combines the least-squares method, gradient descent, and a mean square error method [].
The task of each layer in ANFIS will be described as follows [,]:
Layer 1: The input layer applies a fuzzification process that indicates the membership functions (MFs) to each input, all nodes of this layer are adaptive (the parameters are modified through the training). The output of this layer, as shown in Equation (8):
where refers to the membership function (we use Gaussian function as a membership function), acts the membership values of , is the input to node i, and act as the premise parameter set, and these parameters are modified to achieve an optimal ANFIS model.
Layer 2: This layer’s role is to compute each rule’s firing strength (). The output of nodes represents the firing strength of the rule and is denoted by (П). Each node’s output can be described mathematically by Equation (9):
where refers to the Gaussian membership function, acts the membership values of , are the inputs.
Layer 3: The nodes in the third layer are fixed and denoted by (N). This layer’s job is to perform the normalized computation for each rule’s firing strength; the output of this layer is computed by Equation (10):
where acts the ith output from layer 2.
Layer 4: This layer is the defuzzification layer. This layer’s nodes are adaptive. The nodes multiply each fuzzy rule’s normalized firing strength by the output membership function. The output of this layer is created by Equation (11):
where is the output of layer 3, refers to the output membership function (we use linear function as output membership function) that utilizes the input and parameters of the model as inputs, represent the inputs, and () is the consequence parameters set of node i; these parameters are also modified to achieve an ideal ANFIS model.
Layer 5: This layer contains one fixed node, represented by (∑). The final output of this layer represents a summation of all signals of the firing strengths and output membership functions, the total output is calculated:
Figure 7 shows the ANFIS model architecture for two medical datasets (DB1, DB2) diagnosis.
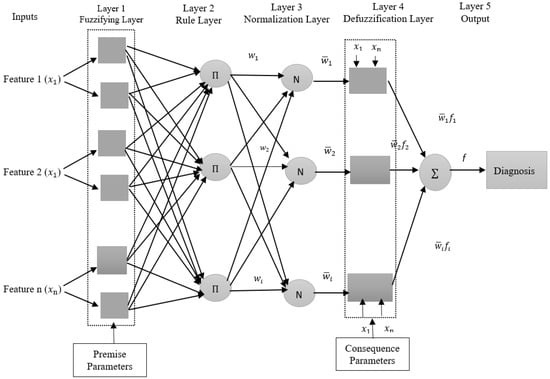
Figure 7.
The ANFIS structure for two medical datasets (DB1, DB2) diagnosis.
In Figure 7, the inputs refer to the features (Feature 1, Feature 2, …, Feature n) that were extracted from the DenseNet-201 model and reduced by the WOA algorithm which is represented by , where n refers to the number of features (143 features for DB1 and 96 features for DB2).
3.6. Fuzzy C-Mean Clustering (FCM)
FCM works by splitting data into clusters iteratively based on their resemblance to one another. Each object’s degree of membership in every cluster is expressed by a fuzzy membership value which ranges from 0 to 1. The approach begins by determining cluster centers at random, which are then iteratively adjusted based on the relative membership of the objects in each cluster. After all the membership of object values have stabilized, a complete clustering solution is achieved. There are various advantages to using FCM for ANFIS, FCM can assist in determining the basic parameters for the ANFIS model. The FCM clustering procedure can contribute initial membership degrees and centroid values to the ANFIS model’s fuzzy sets, yielding increased learning accuracy and speed. Furthermore, FCM’s capacity to clarify the relationship between input and output variables may improve the ANFIS model’s interpretability. FCM separates the input space into fuzzy areas, making it easier to identify the input variables that are most relevant to the expected output of the models []. FCM is utilized to obtain a smaller number of fuzzy rules [].
The mathematical expression in Equations (13) and (14) is utilized to define the ideal distance center to every datum for each fuzzy set n and vector xi, where I = 1, 2, …, n [].
where m refers to the weighting exponent in the range of (), the membership degree is illustrated by ϵ (0, 1), the data point is described as , the centroid of clusters is represented as , and the of the data point in the j cluster at any iteration is illustrated as:
where C represents the number of clusters, represents the centroid of the cluster, represents the data point, and m represents the weighting exponent.
3.7. Genetic Algorithm (GA)
GA is a popular evolutionary algorithm used to simulate natural evolution and find the optimal solution []. A GA represents the problem to be solved in genetic space as a chromosome or individual []. To provide an ideal solution with a lower local minimum convergence, the GA employs three operators: selection, crossover, and mutation. In this work, a GA was used in training ANFIS to optimize the parameters of ANFIS and attain a better performance resulting in higher prediction accuracy and lower error rates. The flowchart of a basic GA is shown in Figure 8.
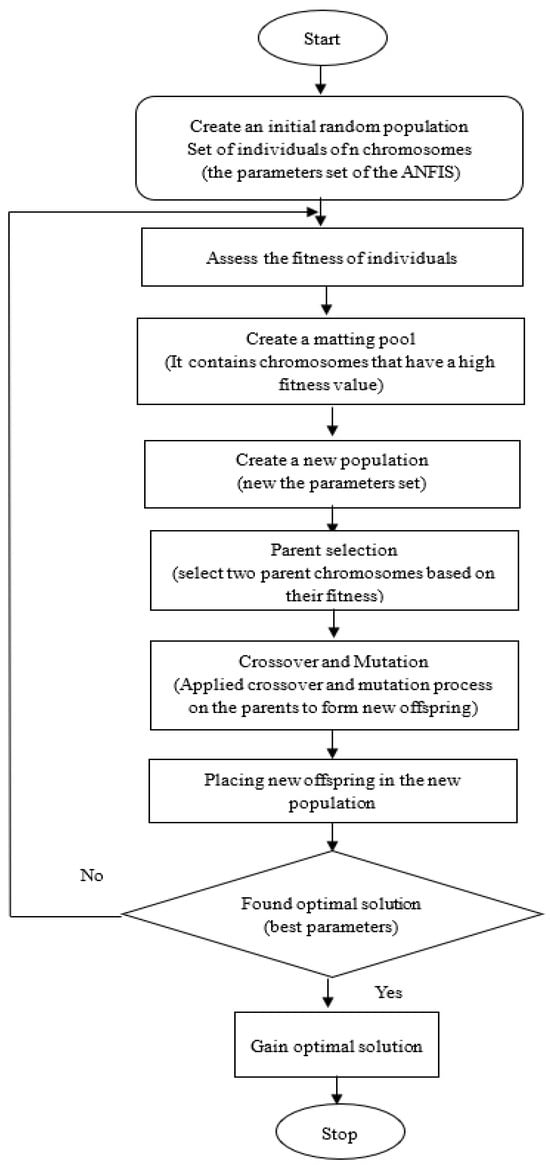
Figure 8.
Flowchart of GA.
The description of GA operators that are important for the optimization process is provided below:
Population
GA operates on a population consisting of some solutions where the population size refers to the number of solutions. Every solution in the population is called an individual, and each individual has a chromosome which is represented as a set of parameters that defines the individual. Each chromosome has a set of genes. ANFIS requires training for two sorts of parameters: premise and consequence parameters which are the changeable parameters set that are modified by the GA.
Fitness Function
It is used to assess the quality of the population’s chromosomes in an individual. Each individual has a fitness value. The quality of the solution is represented by the fitness value, which is the outcome of the fitness function. RMSE is used in this suggested model to compute the fitness of an individual chromosome.
Selection
The selection is used to choose superior individuals from a population with a high probability of success (selecting the best parameters). The model in this work employs a roulette wheel selection function that considers a specific probability as well as each individual’s fitness. The best individuals are chosen to create a mating pool, in which the higher quality individual has a better chance of being chosen in the mating pool. The individuals in the mating pool are known as parents. Every two parents chosen from the mating pool produces two offspring (children). It is assumed that by simply mating high-quality individuals, the offspring will be of higher quality than their parents. This will prevent negative individuals from reproducing themselves. By continuing to choose and generate high-quality individuals, there is a better chance of retaining only the individuals’ positive characteristics (parameters) and excluding the negative ones. Finally, this will result in the desired optimal or acceptable solution (the best parameters).
Crossover
Crossover is the process of interchanging chromosomal segments in relative positions between two parents. For every two parents, crossover occurs by selecting a random point on the chromosome and swapping genes from both parents before and after that point. The resulting chromosomes are offspring. Thus, the operator is referred to as a single-point crossover. Without the crossover, the offspring will be identical to the parent, and therefore the crossover is very crucial.
Mutation
After the crossover process is finished, there should be a certain likelihood of gene mutation to enhance the population variety. The mutation probability () is set to a very low value, often ( ≤ 0.05). Mutation is the process of changing a gene’s original value to a random number that falls into the gene’s uniform distribution within a specific range for that gene. A random integer is chosen from the value range for that gene with probability to exchange the original gene value. The mutation is employed to add new features to offspring to enhance it.
3.8. ANFIS Optimized by GA (ANFIS-GA)
In this paper, a GA was combined with the ANFIS model to boost the efficiency of the ANFIS predictive model, improve the ANFIS model’s performance, tune the ANFIS parameters, and determine the ideal values of ANFIS parameters to predict the diseases with improved accuracy.
The selection of ANFIS’s premise parameters and consequent parameters is challenging since the majority of these parameters are chosen by user expertise or trial-and-error methodology. To solve this problem in ANFIS, the effective optimization algorithm GA is used to automate the process, which can help increase the learning rate by lowering the error of prediction.
The modifiable parameters of ANFIS are mostly centered in layer 1 and layer 4. The first layer’s parameters are membership function parameters, sometimes referred to as premise parameters, whereas the fourth layer’s parameters are consequence parameters. These parameters play an essential role in determining the performance of the ANFIS.
Conventional ANFIS models frequently use LSE-GD hybrid learning algorithms, in LSE approach is used to train consequence parameters, and GD is used to train premise parameters. However, a vast number of experiments have revealed that these derivative-based optimization methods pose a danger to local minimum []. So, GA was utilized to train ANFIS to improve performance. The flowchart of the hybrid ANFIS-GA model is shown in Figure 9.
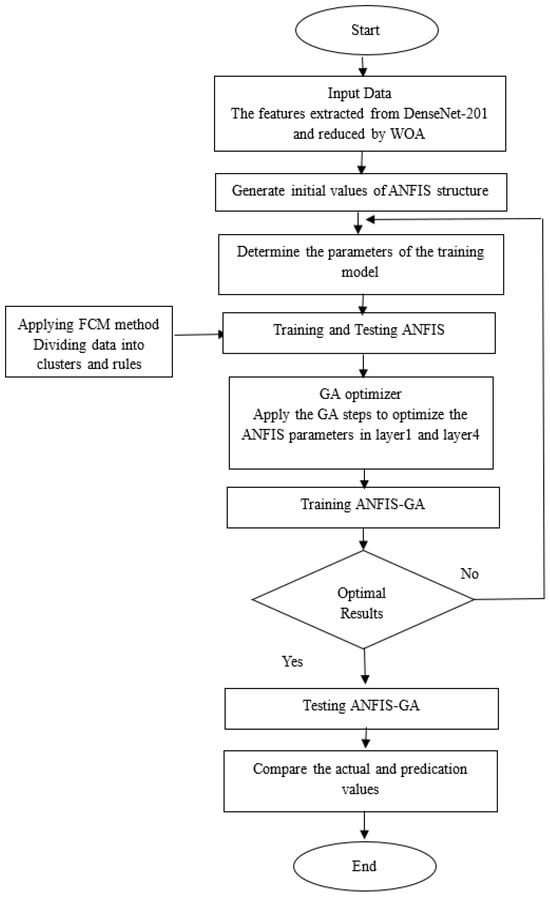
Figure 9.
ANFIS-GA model.
As seen in Figure 9, the first step is to enter the data represented by the features extracted from the DenseNet-201 model and reduced by the WQA method. Then, the initial values are generated to create the ANFIS model, then specify the training parameters and options. FCM clustering approach was applied to divide the data (features) into clusters and rules. The ANFIS model is then trained and tested.
To improve the test result of the ANFIS model, we apply GA to improve the parameters of the ANFIS model, GA improves the parameters of the first layer (premise parameters) and the fourth layer (the consequent parameters), after obtaining the best solution (the best parameters of the ANFIS model) by GA optimizer, we train and test the model to obtain a better accuracy of the proposed system (ANFIS-GA) than the accuracy of the conventional ANFIS model in diseases predication.
In this work, we assessed how the genetic algorithm’s initialization of parameters was performed. These include crossover, population size, proportion of mutation, and total number of iterations. It is crucial to know that selecting these parameters plays a significant role in the model design. Table 3 illustrates the ANFIS-GA’s tuning parameter range.
Table 3.
GA parameters for optimizing ANFIS model.
The parameters were determined depending on several trial-and-error rounds to find the best values for enhancing the model.
Table 4 shows the parameters used in the training and testing of the ANFIS model.
Table 4.
The parameters of the ANFIS model.
The number of clusters used in the model can have a wide range of implications on the model’s performance, computational complexity, and interpretability. The fewer the rules and the fewer the input variables, an ANFIS model is easy to interpret. Also, it is critical to select a suitable number of clusters depending on the data properties to achieve optimal model performance. As a result, in this work, we conducted a series of experiments in which the number of clusters was adjusted to determine the optimum number that is adequate for the suggested model. In this work, FCM is employed as a partitioning procedure to minimize the complexity and quantity of rules and parameters. FCM works by splitting data into clusters iteratively based on their resemblance to one another. By using FCM, the inputs were split into clusters and rules (three clusters in multi-classification and two clusters in binary classification) each cluster including inputs and their matching outputs. Each cluster generates one rule, for a total of three rules for multiclassification and two rules for binary classification, each rule takes a number of features as inputs in each cluster, passes the input to the GA training algorithm, and gives a class as the output. The training process was performed for 1000 iterations. The target was to obtain the best values for performance metrics MSE, RMSE, STD, and .
4. Model Evaluation
MSE, RMSE, STD, and are statistical metrics that were used to assess the forecasting ability and performance of ANFIS and ANFIS-GA models. We will describe these metrics briefly [,].
MSE: a metric established by measuring the dispersion of data around zero. It is computed by Equation (15):
RMSE: is a typical statistical indicator used to assess model performance. The lower the RSME, the better the performance outcomes. It is computed by the following equation:
where N is the total training set, is the value of the predicted data, and is the value of actual data.
STD: The standard deviation examines whether data is clustered around the mean, and the closer the data is to zero, the closer the data is to the mean []. It is computed by the following equation:
: A measure of the relationship between the data value that was acquired and the value that was predicted. The following equation defines it:
where , where N is the total training set, is the value of the predicted data, and is the value of actual data.
5. Experimental Results
This section introduces the experimental results and performance analysis for the proposed system, as well as a comparison of the results. All algorithms that were applied to selected medical datasets in this work were implemented using the Matlab 2023 programming language.
Table 5 illustrates the results obtained by using the proposed ANFIS-GA model architecture and conventional ANFIS model applied to the two medical datasets that were selected in this work to measure the performance.
Table 5.
Performance metrics results of the proposed model for two medical datasets in a testing stage.
MSE, RMSE, STD, and values were computed for the proposed ANFIS-GA model for the two datasets (DB1, DB2) for classification in the testing stage. The model with higher accuracy will have a lower RMSE value and a higher values.
Comparing the suggested ANFIS-GA model to the conventional ANFIS model, the MSE, RMSE, STD, Mean, and values show a significant improvement.
The target is to obtain the best (lowest value of RMSE and highest value of ). From Table 5, ANFIS-GA gives better values for both RMSE and than the ANFIS model. The prediction accuracy of a model is a popular parameter that is used to define how good or bad a prediction model is. This parameter is commonly measured as a percentage. In this work, we use to measure the percentage error in the prediction, and hence, multiplying this value by one hundred gives the prediction accuracy of the model.
As shown in Table 5, for DB1, the ANFIS-GA model gives a prediction accuracy of 92.581% compared to 89.964% for ANFIS, and for DB2 ANFIS-GA model gives a prediction accuracy of 93.693% compared to 85.457% for ANFIS. We can say that the optimized ANFIS (ANFIS-GA) is a better prediction model than the ANFIS model.
ANFIS and ANFIS-GA models for medical datasets diagnosis are modeled and built on the Sugeno fuzzy inference system. It takes the features which extracted by the DenseNet-201 model and reduced by WOA method as inputs and the output is classes of diseases.
Figure 10 and Figure 11 illustrated the structure of the ANFIS and ANFIS-GA models for the first dataset (chest X-ray).
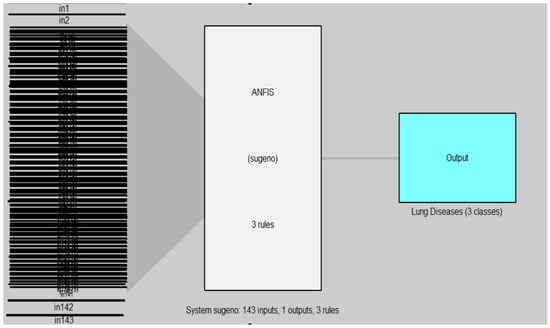
Figure 10.
ANFIS model for chest X-ray dataset.
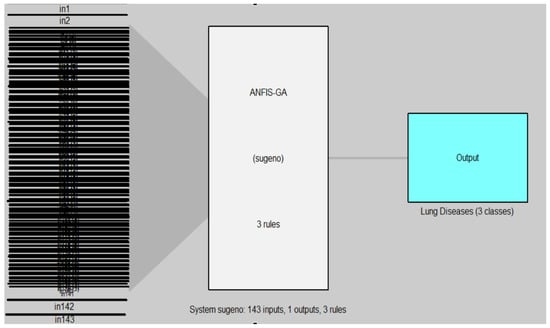
Figure 11.
ANFIS-GA model for chest X-ray dataset.
In Figure 10 and Figure 11, the left side refers to the inputs (in1, in2, …, in143) which are represented by the features of DB1 which are extracted from the DenseNet-201 model and reduced by the WOA method, while the right side refers to the output of the model (AN-FIS, ANFIS-GA) which represent the classes of lung diseases (three classes). The models are based on the Sugeno fuzzy inference system with three rules for classifying chest X-ray data into three classes (normal, COVID-19, pneumonia).
Figure 12 and Figure 13 illustrate the structure of the ANFIS and ANFIS-GA models for the second dataset (brain tumor).
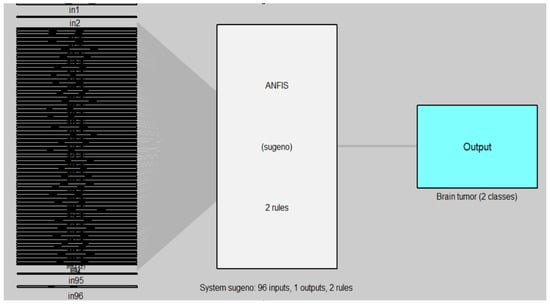
Figure 12.
ANFIS model for MRI brain dataset.
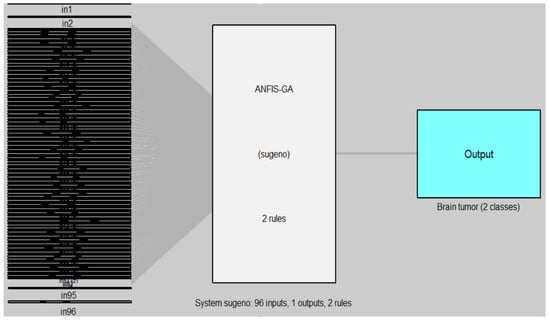
Figure 13.
ANFIS-GA model for MRI brain dataset.
In Figure 12 and Figure 13, the left side refers to the inputs (in1, in2, …, in96) which are represented by the features of DB2 that are extracted from the DenseNet-201 model and reduced by the WOA method, while the right side refers to the output of the model (ANFIS, ANFIS-GA) which represent the classes of brain tumor (two classes). The models are based on the Sugeno fuzzy inference system with two rules for classifying the brain tumor data into two classes (tumor, non-tumor).
The performance of the training and testing for ANFIS-GA was dependent on the population size (n = 25), iterations number (n = 1000), crossovers percentage, mutation rate, and the selection function. The ANFIS-GA hybrid model generated a strong relationship between the parameters and the responses. Figure 14 and Figure 15 illustrate the ANFIS-GA results with histograms of the errors of training and testing data of actual and predicted values for the chest X-ray dataset.
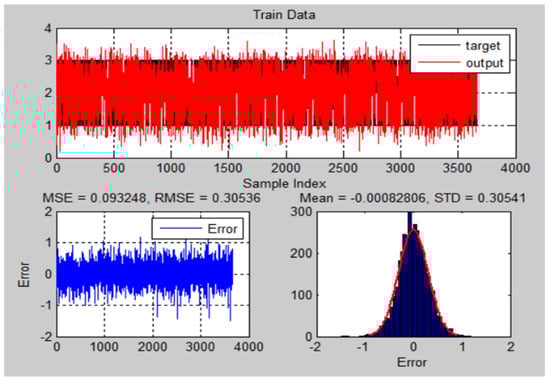
Figure 14.
The training results and error of ANFIS-GA model for chest X-ray dataset.
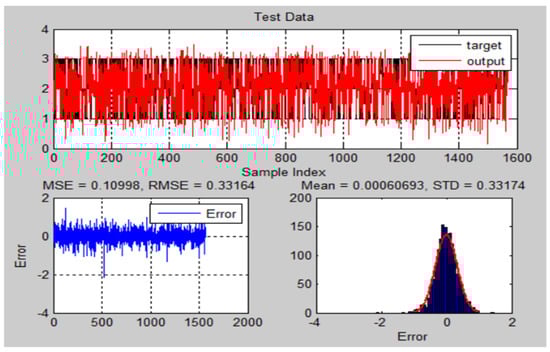
Figure 15.
The testing results and error of ANFIS-GA model for chest X-ray dataset.
Figure 16 and Figure 17 illustrate the ANFIS-GA results with histograms of the errors of training and testing data of actual and predicted values for MRI brain dataset.
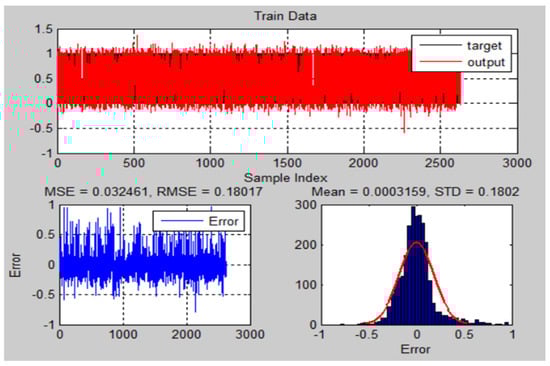
Figure 16.
The training results and error of ANFIS-GA model for MRI brain dataset.
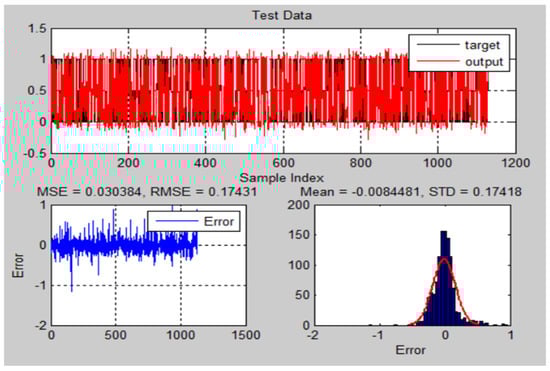
Figure 17.
The testing results and error of ANFIS-GA model for MRI brain dataset.
Figure 18 and Figure 19 illustrate the ANFIS results with histograms of the errors of training and testing data of actual and predicted values for the chest X-ray dataset.
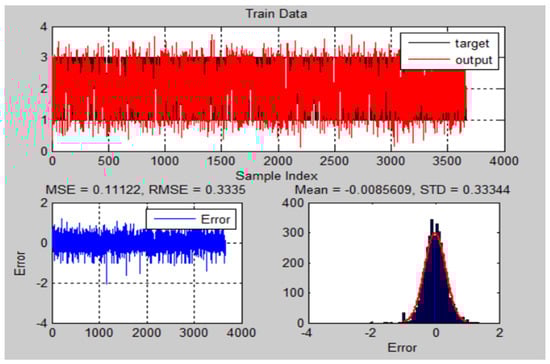
Figure 18.
The training results and error of ANFIS model for chest X-ray dataset.
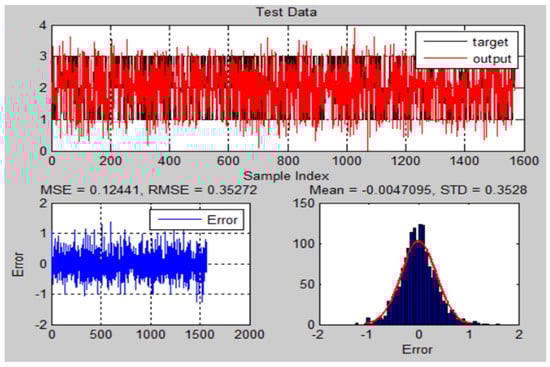
Figure 19.
The testing results and error of ANFIS model for chest X-ray dataset.
Figure 20 and Figure 21 illustrate the ANFIS results with histograms of the errors of training and testing data of actual and predicted values for the MRI brain dataset.
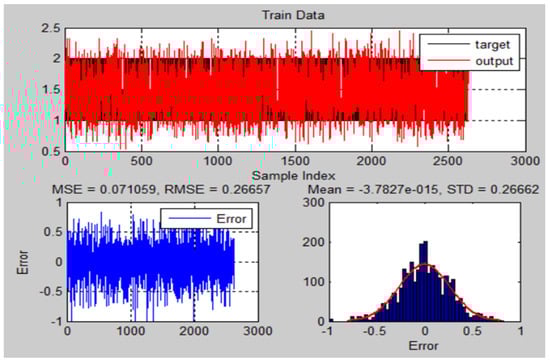
Figure 20.
The training results and error of ANFIS model for MRI brain dataset.
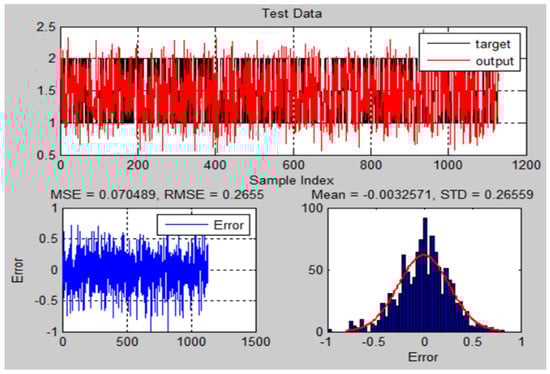
Figure 21.
The testing results and error of ANFIS model for MRI brain dataset.
The testing accuracy of the ANFIS and ANFIS-GA models for chest X-ray was determined by comparing the actual and predicted output as seen in Figure 22 and Figure 23.
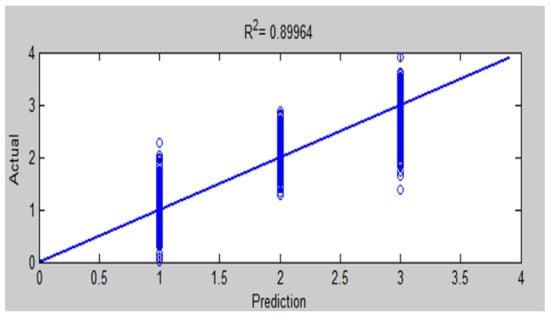
Figure 22.
Comparison of actual and predicted values by ANFIS for testing accuracy of chest X-ray diagnosis.
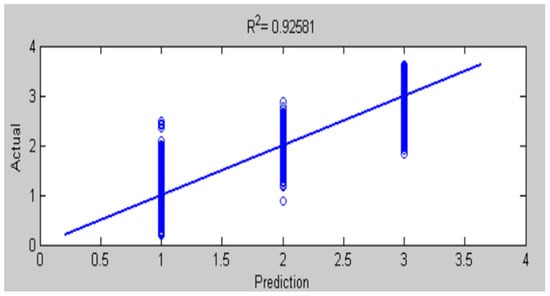
Figure 23.
Comparison of actual and predicted values by ANFIS-GA for testing accuracy of chest X-ray diagnosis.
The testing accuracy of the ANFIS and ANFIS-GA models for MRI brain was determined by comparing the actual and predicted output, as seen in Figure 24 and Figure 25.
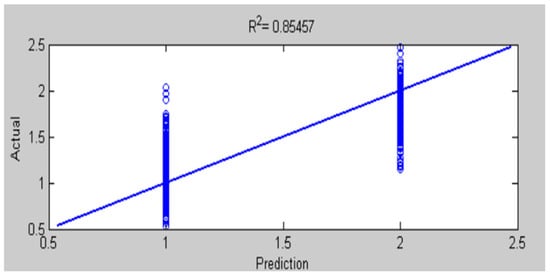
Figure 24.
Comparison of actual and predicted values by ANFIS for testing accuracy of MRI brain diagnosis.
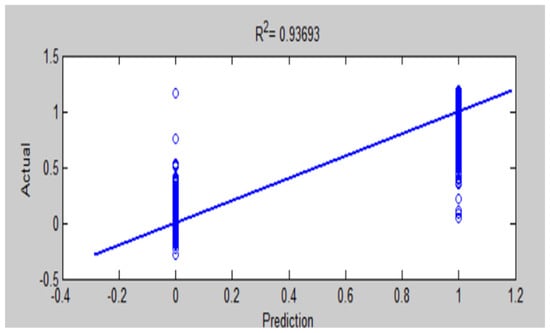
Figure 25.
Comparison of actual and predicted values by ANFIS-GA for testing accuracy of MRI brain diagnosis.
The results of this work have seen that ANFIS-GA gave better model performance for DB1 and DB2 diagnosis; this is shown by the values in the testing of the ANFIS-GA model in Figure 23, which gives 0.92581 as compared to the testing of the ANFIS model, which gives = 0.89964 in Figure 22 for DB1. For DB2, the values in the testing of the ANFIS-GA model in Figure 25, show 0.93693 as compared to the testing of the ANFIS model, which shows = 0.85457 in Figure 24.
Table 6 describes the results of the comparison between the proposed model (ANFIS-GA) and others close to this work that used ANFIS with optimization techniques to diagnose the diseases.
Table 6.
Comparison of ANFIS-GA model with related work research.
From Table 6, it may be inferred that the proposed model (ANFIS-GA) had a better performance than other models. For instance, by examining , ANFIS-GA notably obtains the maximum value for among other comparison algorithms that used the optimizer with ANFIS, indicating the good performance of the proposed model (ANFIS-GA).
We also note from Table 6 that the proposed system was applied to two different sets of medical data to classify and diagnose diseases to increase the generalizability of the system, while the other systems were applied to one medical dataset. In the features extraction stage, we note that most of the systems used medical data containing features, while the proposed system extracted automated features from medical images used the DenseNet-201 model.
6. Discussion and Future Direction
In this paper, an optimized Neuro-Fuzzy Inference System (ANFIS-GA) is developed for the diagnosis of two medical datasets (chest X-ray, and MRI brain), this improves the model’s ability to generalize and enhances its diagnostic precision. The data were divided into 70% to train the model, and 30% to test its accuracy and efficiency. The proposed ANFIS-GA is the combination of the DenseNet-201 model for feature extraction, the WOA method for feature selection, the GA algorithm as an optimizer, and the ANFIS classifier. WOA method was utilized for feature selection that was extracted using the DenseNet201 model for pre-trained CNN models. The WOA method achieved a good result in features selection. The DenseNet-201 model is a deep-learning model that can provide the best outcomes for features extraction from medical databases. GA algorithm proves its worth as an optimizer to improve the ANFIS parameters. Lastly, fuzzy logic was applied by utilizing an ANFIS. The performance of the proposed ANFIS-GA was analyzed and evaluated using performance statistical metrics MSE, RMSE, STD, and .
The proposed ANFIS-GA was also compared with the conventional ANFIS model, and it is observed that ANFIS-GA outperforms the conventional ANFIS model:
For DB1: MSE (0.10998), RMSE (0.33164), STD (0.33174), and (0.92581) for ANFIS-GA; and MSE (0.12441), RMSE (0.35272), STD (0.3528), and (0.89964) for ANFIS. For DB2: MSE (0.03038), RMSE (0.17431), STD (0.17418), and (0.93693) for ANFIS-GA; and MSE (0.07048), RMSE (0.2655), STD (0.26559), and (0.85457) for ANFIS.
The experimental results showed that the ANFIS-GA model exhibits a satisfactory improvement in precision as compared to the ANFIS model.
Although the proposed approach works well on medical image datasets for diagnosis evaluation, it does have some limitations. This proposed strategy, while having good classification accuracy in the selected medical datasets, may have lower classification accuracy in other datasets. Because the scan images in various datasets differ due to labeling, noise, and other factors. To address this problem, the proposed system should be trained utilizing scan images taken at various times and locations.
In the future, we plan to work on a larger set of medical image databases to prove the effectiveness of the proposed classifier and employ new methods to extract features from medical images.
The future work also involves applying ANFIS systems to diagnose more diseases, and other hybrid algorithms can be utilized to train the model parameters to attain more ideal outcomes. The current work focused only on the GA algorithm in optimizing the ANFIS system. Hybridization can also be implemented utilizing other modern algorithms like the dragon optimization algorithm, chimp optimization algorithms, and cuckoo search algorithm to optimize the ANFIS model.
7. Conclusions
Medical imaging has played a vital role in diagnosing human diseases. The analysis of medical images is critical in the diagnosis and detection of diseases. The major objective of this paper is to suggest and develop a new system to diagnose diseases based on medical databases by using the ANFIS model combined with the GA algorithm in classification and the DenseNet-201 model in feature extraction with the WOA approach to features selection. The proposed system was applied on two various medical datasets (chest X-ray and MRI brain tumors). The following conclusions can be made according to the experimental results:
- The analysis of more than one medical image database in binary classification (classifying the brain images into tumor and non-tumor) and multi-classification (classifying the lung images into normal, pneumonia, and COVID-19) to increase the generalizable of the proposed system.
- Using the DenseNet-201 model to extract robust features has a major role in increasing the accuracy in the classification of medical images.
- Employing a WOA method to choose features achieved a good result in the selection of optimal features and reducing them to improve the classification accuracy of the medical images.
- Using the GA for optimizing the ANFIS parameters and model’s membership functions helped in increasing the ANFIS model’s prediction efficiency.
- The performance metrics such as MSE, RMSE, STD, and R2 showed that the ANFIS and ANFIS-GA models gave good results but the ANFIS-GA model outperformed in performance compared with ANFIS, as it gave a higher classification accuracy; for DB1, the ANFIS-GA model gives a prediction accuracy of 92.581% compared to 89.964% for ANFIS, and for DB2, ANFIS-GA model gave a prediction accuracy of 93.693% compared to 85.457% for ANFIS.
- The outcomes revealed that the ANFIS-GA model has good accuracy through comparing it to other hybrid models.
The work findings showed that the proposed system performed good and effective results to categorize lung diseases and brain tumors making the proposed system more reliable and trustworthy.
The proposed system is used in the accurate and early detection of diseases that can cause deadly complications, especially in seniors and children. It can also help rookie radiologists make the appropriate decision in distant places where professional radiologists are few.
Training data quality is a significant consideration when building diagnosis systems. For this, although this work performs well in the diagnosis of medical databases that are used in this work, it may provide lower classification accuracy in another different dataset. This is because the scan images in various datasets differ from one another due to labels, noise, and other factors. To address this issue, the suggested system should be trained by utilizing scan images obtained at various times and locations, in addition to improving the medical data’s diversity to detect as many diseases as possible. In the future, the proposed system will be applied to more medical datasets to diagnose more diseases, such as various cancer types to enable early detection and treatment.
Author Contributions
The concept of the article is proposed by N.P., the data resources and validation have been contributed by B.M.R., and the formal analysis, investigation, and draft preparation are performed by B.M.R. The supervision and review of the study are headed by N.P. The final writing was critically revised by N.P. and finally approved by the authors. All authors have read and agreed to the published version of the manuscript.
Funding
This research received no external funding.
Data Availability Statement
The data presented in this study are openly available in [Kaggle] at [https://www.kaggle.com/datasets/sachinkumar413/covid-pneumonia-normal-chest-xray-images] [], [https://www.kaggle.com/datasets/jakeshbohaju/brain-tumor] [].
Conflicts of Interest
The authors declare no conflicts of interest.
Abbreviations
ANFIS—adaptive neuro-fuzzy inference system; GA—genetic algorithm; CNN—convolutional neural network; WOA—whale optimization algorithm; RMSE—root mean square error; MSE—mean square error; STD—standard deviation; R2—coefficient of determination; FCM—fuzzy c-means clustering; DCNNs—deep convolutional neural networks; FCL—fully connected layer; Conv—convolution; ReLU—rectified linear units; BN—batch normalization; LSE—least squares estimation; GD—gradient descent.
References
- Rezaei, M.; Molani, S.; Firoozeh, N.; Abbasi, H.; Vahedifard, F.; Orouskhani, M. Evolving Tsukamoto Neuro Fuzzy Model for Multiclass COVID 19 Classification with Chest X-ray Images. arXiv 2023, arXiv:2305.10421. [Google Scholar]
- Talpur, N.; Abdulkadir, S.J.; Hasan, M.H. A deep learning based neuro-fuzzy approach for solving classification problems. In Proceedings of the 2020 International Conference on Computational Intelligence (ICCI), Bandar Seri Iskandar, Malaysia, 8–9 October 2020; pp. 167–172. [Google Scholar]
- Siva Kumar, M.; Rajamani, D.; Abouel Nasr, E.; Balasubramanian, E.; Mohamed, H.; Astarita, A. A Hybrid Approach of ANFIS—Artificial Bee Colony Algorithm for Intelligent Modeling and Optimization of Plasma Arc Cutting on Monel™ 400 Alloy. Materials 2021, 14, 6373. [Google Scholar] [CrossRef]
- Vidhya, K.; Shanmugalakshmi, R. Modified adaptive neuro-fuzzy inference system (M-ANFIS) based multi-disease analysis of healthcare Big Data. J. Supercomput. 2020, 76, 8657–8678. [Google Scholar] [CrossRef]
- Ukaoha, K.C.; Ademiluyi, O.; Ndunagu, J.; Daodu, S.S.; Osang, F. Adaptive neuro fuzzy inference system for diagnosing coronavirus disease 2019 (COVID-19). Int. J. Intell. Comput. Inf. Sci. 2020, 20, 1–31. [Google Scholar] [CrossRef]
- Varshni, D.; Thakral, K.; Agarwal, L.; Nijhawan, R.; Mittal, A. Pneumonia detection using CNN based feature extraction. In Proceedings of the 2019 IEEE International Conference on Electrical, Computer and Communication Technologies (ICECCT), Coimbatore, India, 20–22 February 2019; pp. 1–7. [Google Scholar]
- Suresh, D.A.; Devakanth, J.J.M.A.; Balasubramanian, R. An Evolutionary Modified Dragonfly Neuro-Fuzzy Inference System for Classification of Tuberculosis. Eur. Chem. Bull. 2023, 12, 5117–5138. [Google Scholar]
- Sulla-Torres, J.; Luna-Luza, G.; Ccama-Yana, D.; Gallegos-Valdivia, J.; Cossio-Bolaños, M.A. Neuro-fuzzy system with particle swarm optimization for classification of physical fitness in school children. Int. J. Adv. Comput. Sci. Appl. 2020, 11, 505–512. [Google Scholar] [CrossRef]
- Alshmrani, G.M.M.; Ni, Q.; Jiang, R.; Pervaiz, H.; Elshennawy, N.M. A deep learning architecture for multi-class lung diseases classification using chest X-ray (CXR) images. Alex. Eng. J. 2023, 64, 923–935. [Google Scholar] [CrossRef]
- Bharati, S.; Podder, P.; Mondal, M.R.H. Hybrid deep learning for detecting lung diseases from X-ray images. Inform. Med. Unlocked 2020, 20, 100391. [Google Scholar] [CrossRef]
- Mondal, M.R.H.; Bharati, S.; Podder, P.; Podder, P. Data analytics for novel coronavirus disease. Inform. Med. Unlocked 2020, 20, 100374. [Google Scholar] [CrossRef]
- Mahmud, M.I.; Mamun, M.; Abdelgawad, A. A deep analysis of brain tumor detection from mr images using deep learning networks. Algorithms 2023, 16, 176. [Google Scholar] [CrossRef]
- Tiwari, P.; Pant, B.; Elarabawy, M.M.; Abd-Elnaby, M.; Mohd, N.; Dhiman, G.; Sharma, S. CNN Based Multiclass Brain Tumor Detection Using Medical Imaging. Comput. Intell. Neurosci. 2022, 2022, 1830010. [Google Scholar] [CrossRef]
- Xie, Y.; Zaccagna, F.; Rundo, L.; Testa, C.; Agati, R.; Lodi, R.; Manners, D.N.; Tonon, C. Convolutional neural network techniques for brain tumor classification (from 2015 to 2022): Review, challenges, and future perspectives. Diagnostics 2022, 12, 1850. [Google Scholar] [CrossRef]
- Iwendi, C.; Mahboob, K.; Khalid, Z.; Javed, A.R.; Rizwan, M.; Ghosh, U. Classification of COVID-19 individuals using adaptive neuro-fuzzy inference system. Multimed. Syst. 2021, 28, 1223–1237. [Google Scholar] [CrossRef]
- Kumar, R.; Al-Turjman, F.; Srinivas, L.; Braveen, M.; Ramakrishnan, J. ANFIS for prediction of epidemic peak and infected cases for COVID-19 in India. Neural Comput. Appl. 2021, 35, 7207–7220. [Google Scholar] [CrossRef] [PubMed]
- Chowdhury, A.A.; Hasan, K.T.; Hoque, K.K.S. Analysis and prediction of COVID-19 pandemic in Bangladesh by using ANFIS and LSTM network. Cogn. Comput. 2021, 13, 761–770. [Google Scholar] [CrossRef]
- Thandra, J.; Basha, S.S. Artificial Intelligence (AI) Model: Adaptive Neuro-Fuzzy Inference System (ANFIS) for Diagnosis of COVID-19 Influenza. Comput. Inform. 2022, 41, 1114–1135. [Google Scholar] [CrossRef]
- Priyadarshini, L.; Shrinivasan, L. Design of an ANFIS based decision support system for diabetes diagnosis. In Proceedings of the 2020 International Conference on Communication and Signal Processing (ICCSP), Chennai, India, 28–30 July 2020; pp. 1486–1489. [Google Scholar]
- Chidambaram, S.; Ganesh, S.S.; Karthick, A.; Jayagopal, P.; Balachander, B.; Manoharan, S. Diagnosing Breast Cancer Based on the Adaptive Neuro-Fuzzy Inference System. Comput. Math. Methods Med. 2022, 2022, 9166873. [Google Scholar] [CrossRef]
- Cobbinah, M.; Abdulrahman, U.F.I.; Emmanuel, A.K. Adaptive Neuro-Fuzzy Inferential Approach for the Diagnosis of Prostate Diseases. Int. J. Intell. Syst. Appl. 2022, 14, 32–41. [Google Scholar] [CrossRef]
- Behnood, A.; Mohammadi Golafshani, E.; Hosseini, S. Determinants of the infection rate of the COVID-19 in the US using ANFIS and virus optimization algorithm (VOA) Chaos, Solit. Fractals 2020, 139, 110051. [Google Scholar] [CrossRef]
- Balasubramanian, K.; Ananthamoorthy, N. Improved adaptive neuro-fuzzy inference system based on modified glowworm swarm and differential evolution optimization algorithm for medical diagnosis. Neural Comput. Appl. 2021, 33, 7649–7660. [Google Scholar] [CrossRef]
- Feng, J.; Wang, Q.; Li, N. An intelligent system for heart disease prediction using adaptive neuro-fuzzy inference systems and genetic algorithm. J. Phys. Conf. Ser. 2021, 2010, 012172. [Google Scholar] [CrossRef]
- Elias, M.M.; Gambo, Y.; Sarjiyus, O. Diagnosis of Human Immunodeficiency Virus (HIV/AIDS) Using Optimized ANFIS with Particle Swarm Optimization (PSO) Algorithm. Int. Res. J. Adv. Eng. Sci. 2021, 6, 116–124. [Google Scholar]
- Molamasoumi, A.; Sadeghizadeh, H.; Rajabi, M.; Hajam, M.A.; Khanday, A.M.U.D. Neuro Fuzzy GreyWolf Optimisation Method for Diagnosing the Liver Disorders. Preprints 2023, 2023091704. [Google Scholar] [CrossRef]
- Data Availability: Data Available for Free at the Kaggle Repository. Available online: https://www.kaggle.com/datasets/sachinkumar413/covid-pneumonia-normal-chest-xray-images (accessed on 8 August 2023).
- Data Availability: Data Available for Free at the Kaggle Repository. Available online: https://www.kaggle.com/datasets/jakeshbohaju/brain-tumor (accessed on 8 August 2023).
- Islam, M.K.; Ali, M.S.; Ali, M.M.; Haque, M.F.; Das, A.A.; Hossain, M.M.; Duranta, D.; Rahman, M.A. Melanoma skin lesions classification using deep convolutional neural network with transfer learning. In Proceedings of the 2021 1st International Conference on Artificial Intelligence and Data Analytics (CAIDA), Riyadh, Saudi Arabia, 6–7 April 2021; pp. 48–53. [Google Scholar]
- Khan, E.; Rehman, M.Z.U.; Ahmed, F.; Alfouzan, F.A.; Alzahrani, N.M.; Ahmad, J. Chest X-ray classification for the detection of COVID-19 using deep learning techniques. Sensors 2022, 22, 1211. [Google Scholar] [CrossRef] [PubMed]
- Bansode, B.N.; Bakwad, K.M.; Dildar, A.S.; Sable, G.S. Deep CNN-based feature extraction with optimised LSTM for enhanced diabetic retinopathy detection. Comput. Methods Biomech. Biomed. Eng. Imaging Vis. 2023, 11, 960–975. [Google Scholar] [CrossRef]
- Tayal, A.; Gupta, J.; Solanki, A.; Bisht, K.; Nayyar, A.; Masud, M. DL-CNN-based approach with image processing techniques for diagnosis of retinal diseases. Multimed. Syst. 2022, 28, 1417–1438. [Google Scholar] [CrossRef]
- Kaya, M.; Eris, M. D3SENet: A hybrid deep feature extraction network for Covid-19 classification using chest X-ray images. Biomed. Signal Process. Control 2023, 82, 104559. [Google Scholar] [CrossRef]
- Vieira, P.; Sousa, O.; Magalhães, D.; Rabêlo, R.; Silva, R. Detecting pulmonary diseases using deep features in X-ray images. Pattern Recognit. 2021, 119, 108081. [Google Scholar] [CrossRef] [PubMed]
- Nahiduzzaman, M.; Faruq Goni, M.O.; Robiul Islam, M.; Sayeed, A.; Shamim Anower, M.; Ahsan, M.; Haider, J.; Kowalski, M. Detection of various lung diseases including COVID-19 using extreme learning machine algorithm based on the features extracted from a lightweight CNN architecture. Biocybern. Biomed. Eng. 2023, 43, 528–550. [Google Scholar] [CrossRef]
- Aamir, M.; Rahman, Z.; Ahmed Abro, W.; Aslam Bhatti, U.; Ahmed Dayo, Z.; Ishfaq, M. Brain tumor classification utilizing deep features derived from high-quality regions in MRI images. Biomed. Signal Process. Control 2023, 85, 104988. [Google Scholar] [CrossRef]
- Sarkar, A.; Maniruzzaman, M.; Alahe, M.A.; Ahmad, M. An Effective and Novel Approach for Brain Tumor Classification Using AlexNet CNN Feature Extractor and Multiple Eminent Machine Learning Classifiers in MRIs. J. Sens. 2023, 2023, 1224619. [Google Scholar] [CrossRef]
- Muezzinoglu, T.; Baygin, N.; Tuncer, I.; Barua, P.D.; Baygin, M.; Dogan, S.; Tuncer, T.; Palmer, E.E.; Cheong, K.H.; Acharya, U.R. PatchResNet: Multiple Patch Division–Based Deep Feature Fusion Framework for Brain Tumor Classification Using MRI Images. J. Digit. Imaging 2023, 36, 973–987. [Google Scholar] [CrossRef]
- Abut, S.; Okut, H.; Kallail, K.J. Paradigm Shift from Artificial Neural Networks (ANNs) to Deep Convolutional Neural Networks (DCNNs) in the Field of Medical Image Processing. Expert Syst. Appl. 2024, 244, 122983. [Google Scholar] [CrossRef]
- Gaur, L.; Bhatia, U.; Jhanjhi, N.; Muhammad, G.; Masud, M. Medical image-based detection of COVID-19 using deep convolution neural networks. Multimed. Syst. 2023, 29, 1729–1738. [Google Scholar] [CrossRef] [PubMed]
- Özyurt, F.; Sert, E.; Avcı, D. An expert system for brain tumor detection: Fuzzy C-means with super resolution and convolutional neural network with extreme learning machine. Med. Hypotheses 2020, 134, 109433. [Google Scholar] [CrossRef] [PubMed]
- Salim, F.; Saeed, F.; Basurra, S.; Qasem, S.N.; Al-Hadhrami, T. DenseNet-201 and Xception Pre-Trained Deep Learning Models for Fruit Recognition. Electronics 2023, 12, 3132. [Google Scholar] [CrossRef]
- Li, G.; Zhang, M.; Li, J.; Lv, F.; Tong, G. Efficient densely connected convolutional neural networks. Pattern Recognit. 2021, 109, 107610. [Google Scholar] [CrossRef]
- Bakr, M.; Abdel-Gaber, S.; Nasr, M.; Hazman, M. DenseNet Based Model for Plant Diseases Diagnosis. Eur. J. Electr. Eng. Comput. Sci. 2022, 6, 1–9. [Google Scholar] [CrossRef]
- Adhinata, F.D.; Rakhmadani, D.P.; Wibowo, M.; Jayadi, A. A deep learning using DenseNet201 to detect masked or non-masked face. JUITA J. Inform. 2021, 9, 115–121. [Google Scholar] [CrossRef]
- Nadimi-Shahraki, M.H.; Zamani, H.; Mirjalili, S. Enhanced whale optimization algorithm for medical feature selection: A COVID-19 case study. Comput. Biol. Med. 2022, 148, 105858. [Google Scholar] [CrossRef]
- Vijayanand, R.; Devaraj, D. A novel feature selection method using whale optimization algorithm and genetic operators for intrusion detection system in wireless mesh network. IEEE Access 2020, 8, 56847–56854. [Google Scholar] [CrossRef]
- Ike, I.S.; Asadu, C.O.; Ezema, C.A.; Onah, T.O.; Ogbodo, N.O.; Godwin-Nwakwasi, E.U.; Onu, C.E. ANN-GA, ANFIS-GA and Thermodynamics base modeling of crude oil removal from surface water using organic acid grafted banana pseudo stem fiber. Appl. Surf. Sci. Adv. 2022, 9, 100259. [Google Scholar] [CrossRef]
- Kasule, A.; Ayan, K. Using PSO and Genetic Algorithms to Optimize ANFIS Model for Forecasting Uganda’s Net Electricity Consumption. Sak. Univ. J. Sci. 2020, 24, 324–337. [Google Scholar] [CrossRef]
- Oladipo, S.; Sun, Y. Enhanced adaptive neuro-fuzzy inference system using genetic algorithm: A case study in predicting electricity consumption. SN Appl. Sci. 2023, 5, 186. [Google Scholar] [CrossRef]
- Elshaboury, N.; Al-Sakkaf, A.; Alfalah, G.; Abdelkader, E.M. Improved Adaptive Neuro-Fuzzy Inference System Based on Particle Swarm Optimization Algorithm for Predicting Labor Productivity. In Proceedings of the 2nd International Conference on Civil Engineering Fundamentals and Applications (ICCEFA’21), Virtual, 21–23 November 2021. [Google Scholar]
- Olayode, I.O.; Tartibu, L.K.; Alex, F.J. Comparative Study Analysis of ANFIS and ANFIS-GA Models on Flow of Vehicles at Road Intersections. Appl. Sci. 2023, 13, 744. [Google Scholar] [CrossRef]
Disclaimer/Publisher’s Note: The statements, opinions and data contained in all publications are solely those of the individual author(s) and contributor(s) and not of MDPI and/or the editor(s). MDPI and/or the editor(s) disclaim responsibility for any injury to people or property resulting from any ideas, methods, instructions or products referred to in the content. |
© 2024 by the authors. Licensee MDPI, Basel, Switzerland. This article is an open access article distributed under the terms and conditions of the Creative Commons Attribution (CC BY) license (https://creativecommons.org/licenses/by/4.0/).