


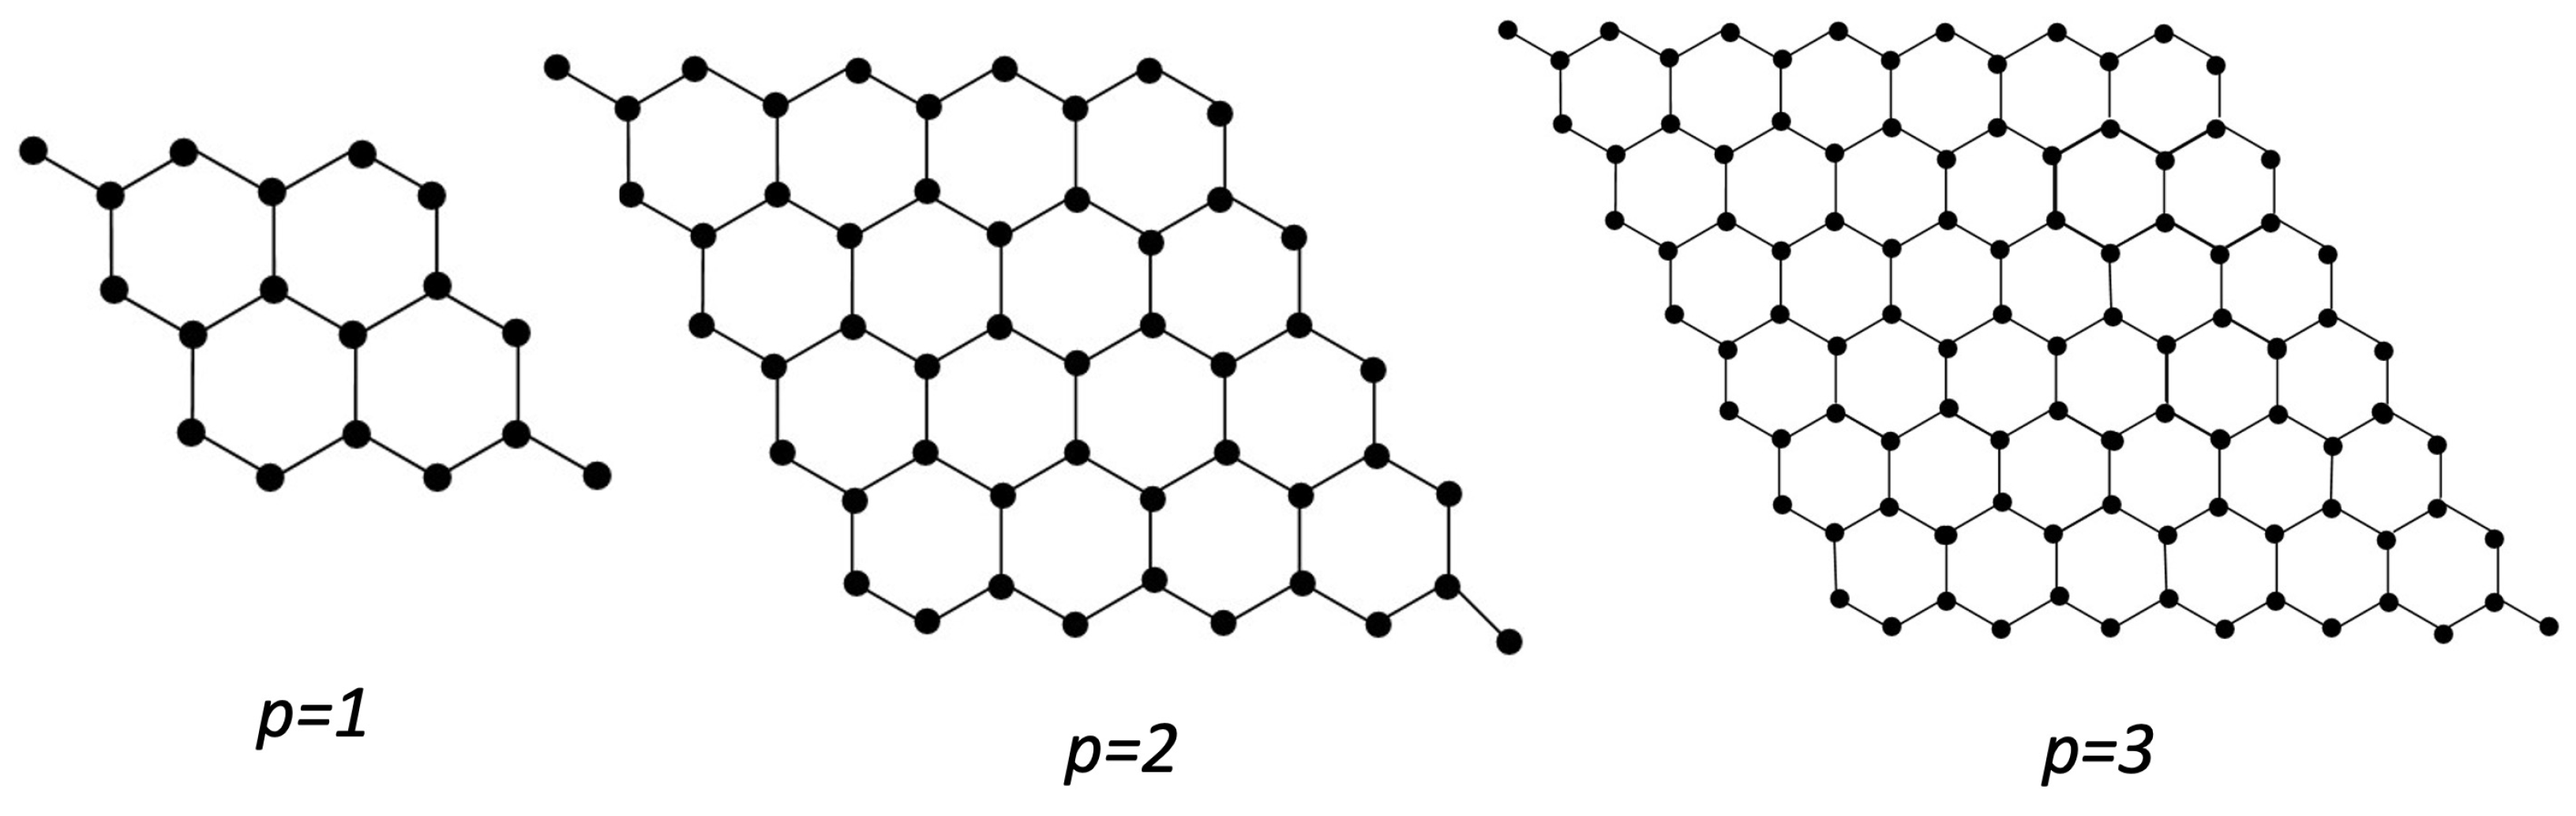
On K-Banhatti, Revan Indices and Entropy Measures of MgO(111) Nanosheets via Linear Regression


Abstract
1. Introduction
2. Preliminaries and Mathematical Framework
3. Results and Discussion
- The first K-Banhatti Index
- The second K-Banhatti Index
- The first hyper K-Banhatti Index
- The second hyper K-Banhatti Index
- The K-Banhatti harmonic Index
- The first hyper Revan Index
- The second hyper Revan Index
- The third Revan Index
- The first Revan Vertex Index
4. K-Banhatti Entropy and Linear Regression Analysis
- The first K-Banhatti entropy
- The second K-Banhatti entropy
- The first hyper K-Banhatti entropy
- The second hyper K-Banhatti entropy
- The K-Banhatti harmonic entropy
- The first hyper Revan entropy
- The second hyper Revan entropy
- The third Revan entropy
- The first Revan vertex entropy
5. Conclusions
Author Contributions
Funding
Institutional Review Board Statement
Informed Consent Statement
Data Availability Statement
Conflicts of Interest
References
- Acharjee, M.; Bora, B.; Dunbar, R.I.M. On M-Polynomials of Dunbar Graphs in Social Networks. Symmetry 2020, 12, 932. [Google Scholar] [CrossRef]
- Baig, A.Q.; Imran, M.; Khalid, W.; Naeem, W. Molecular description of carbon graphite and crystal cubic carbon structures. Can. J. Chem. 2017, 95, 831–837. [Google Scholar] [CrossRef]
- Chu, D.; Ali, H.; Ali, D.A.; Nadeem, M.; Kirmani, S.A.K.; Ali, P. Comparative Study of Planar Octahedron Molecular Structure via Eccentric Invariants. Molecules 2023, 28, 556. [Google Scholar] [CrossRef]
- Mu, A.R.; Lobanov, L.; Karelson, V.S.M. Correlation of boiling points with molecular structure. 1. A training set of 298 diverse organics and a test set of 9 simple inorganics. J. Phys. Chem. 1996, 100, 10400–10407. [Google Scholar]
- Jain, A.R.; Lomaka, R.; Petrukhin, A.; Maran, R.; Karelson, U. Perspective on the relationship between melting points and chemical structure. Cryst. Growth Des. 2001, 1, 261–265. [Google Scholar]
- Wiener, H. Structural determination of paraffin boiling points. J. Am. Chem. Soc. 1947, 69, 17–20. [Google Scholar] [CrossRef]
- Perigidad, S.; Jamagoud, D.; Maled, S.; Gavade, Y. QSPR analysis of certain degree based topological indices. J. Stat. Appl. Probab. 2017, 6, 361–371. [Google Scholar]
- Ahmad, I.; Chaudhry, M.A.; Hussain, M.; Mahmood, T. Topological Descriptors on Some Families of Graphs. J. Chem. 2021, 2021, 6018893. [Google Scholar] [CrossRef]
- Kirmani, S.A.K.; Ali, P.; Azam, F. Topological indices and QSPR/QSAR analysis of some antiviral drugs being investigated for the treatment of COVID-19 patients. Int. J. Quantum Chem. 2021, 121, e26594. [Google Scholar] [CrossRef]
- Hosseini, H.; Shafiei, F. Quantitative structure-property relationship models for the prediction of gas heat capacity of benzene derivatives using topological indices. Match Commun. Math. Comput. Chem. 2016, 75, 583–592. [Google Scholar]
- Manzoor, S.; Siddiqui, M.K.; Ahmad, S.; Fufa, S.A. On computation of entropy measures and molecular descriptors for isomeric natural polymers. J. Math. 2022, 2022, 5219139. [Google Scholar] [CrossRef]
- Ghani, M.U.; Campena, F.J.H.; Maqbool, M.K.; Liu, J.B.; Dehraj, S.; Cancan, M.; Alharbi, F.M. Entropy Related to K-Banhatti Indices via Valency Based on the Presence of C6H6 in Various Molecules. Molecules 2023, 28, 452. [Google Scholar] [CrossRef]
- Kulli, V.R. New K-Banhatti Topological Indices. Int. J. Fuzzy Math. Arch. 2017, 12, 29–37. [Google Scholar] [CrossRef]
- Kulli, V. On K Banhatti indices of graphs. J. Comput. Math. Sci. 2016, 19, 1–6. [Google Scholar]
- Kulli, V.; Chaluvaraju, B. Zagreb-k-banhatti index of a graph. J. Ultra Sci. Phys. Sci. Sect. A 2020, 32, 29–36. [Google Scholar] [CrossRef]
- Naz, K.; Ahmad, S.; Siddiqui, M.K.; Bilal, H.M.; Imran, M. On Some Bounds of Multiplicative K Banhatti Indices for Polycyclic Random Chains. Polycycl. Aromat. Compd. 2023, 1–22. [Google Scholar] [CrossRef]
- Hussain, M.; Siddiqui, M.K.; Hanif, M.F.; Mahmood, H.; Saddique, Z.; Fufa, S.A. On K-Banhatti indices and entropy measure for rhodium (III) chloride via linear regression models. Heliyon 2023, 9, e20935. [Google Scholar] [CrossRef]
- Nasir, S.; Farooq, F.B.; Idrees, N.; Saif, M.J.; Saeed, F. Topological characterization of nanosheet covered by C3 and C6. Processes 2019, 7, 462. [Google Scholar] [CrossRef]
- Zhao, Q.; Li, F.; Huang, C. Phosphorescent heavy-metal complexes for organic light-emitting diodes. Chem. Soc. Rev. 2010, 39, 3007–3030. [Google Scholar] [CrossRef]
- Zhu, K.; Hu, J.; Kuebel, C.; Richards, R. Efficient preparation and catalytic activity of MgO (111) nanosheets. Angew. Chem. Int. Ed. 2006, 45, 7277–7281. [Google Scholar] [CrossRef]
- Goniakowski, J.; Noguera, C.; Giordano, L. Using polarity for engineering oxide nanostructures: Structural phase diagram in free and supported MgO (111) ultrathin films. Phys. Rev. Lett. 2004, 93, 215702. [Google Scholar] [CrossRef] [PubMed]
- Jahanbani, A. On topological indices of carbon nanocones and nanotori. Int. J. Quantum Chem. 2019, 119, e26082. [Google Scholar] [CrossRef]
- Selvamani, T.; Sinhamahapatra, A.; Bhattacharjya, D.; Mukhopadhyay, I. Rectangular MgO microsheets with strong catalytic activity. Mater. Chem. Phys. 2011, 129, 853–861. [Google Scholar] [CrossRef]
- Imran, M.; Siddiqui, M.K.; Abunamous, A.A.E.; Adi, D.; Rafique, S.H.; Baig, A.Q. Eccentricity-Based Topological Indices of an Oxide Network. Mathematics 2018, 6, 126. [Google Scholar] [CrossRef]
- Kulli, V.R. On K hyper-Banhatti indices and coindices of graphs. Int. Res. Pure Algebr. 2016, 6, 300–304. [Google Scholar]
- Kulli, V.R. Harmonic Zagreb-K-Banhatti index of a graph. Int. J. Math. Trends Technol. 2020, 66, 123–132. [Google Scholar]

| Indices | Notations- | Formula |
|---|---|---|
| The first K-Banhatti Index [14] | - | |
| The second K-Banhatti Index [14] | - | |
| The first K hyper-Banhatti Index [25] | - | |
| The second K hyper-Banhatti Index [25] | - | |
| The K-Banhatti harmonic Index [26] | - | |
| The first hyper Revan Index [25] | - | |
| The second hyper Revan Index [25] | - | |
| The third Revan Index [26] | - | |
| The first Revan vertex Index [26] | - |
| Cardinality- | ||
|---|---|---|
| 2- | 3 | |
| - | 2 | |
| - | 1 |
| Edges | Frequency | ||||
|---|---|---|---|---|---|
| (1,3) | 2 | 2 | 3 | 1 | |
| (2,2) | 2 | 2 | 2 | 2 | |
| (2,3) | 3 | 2 | 1 | ||
| (3,3) | 4 | 1 | 1 |
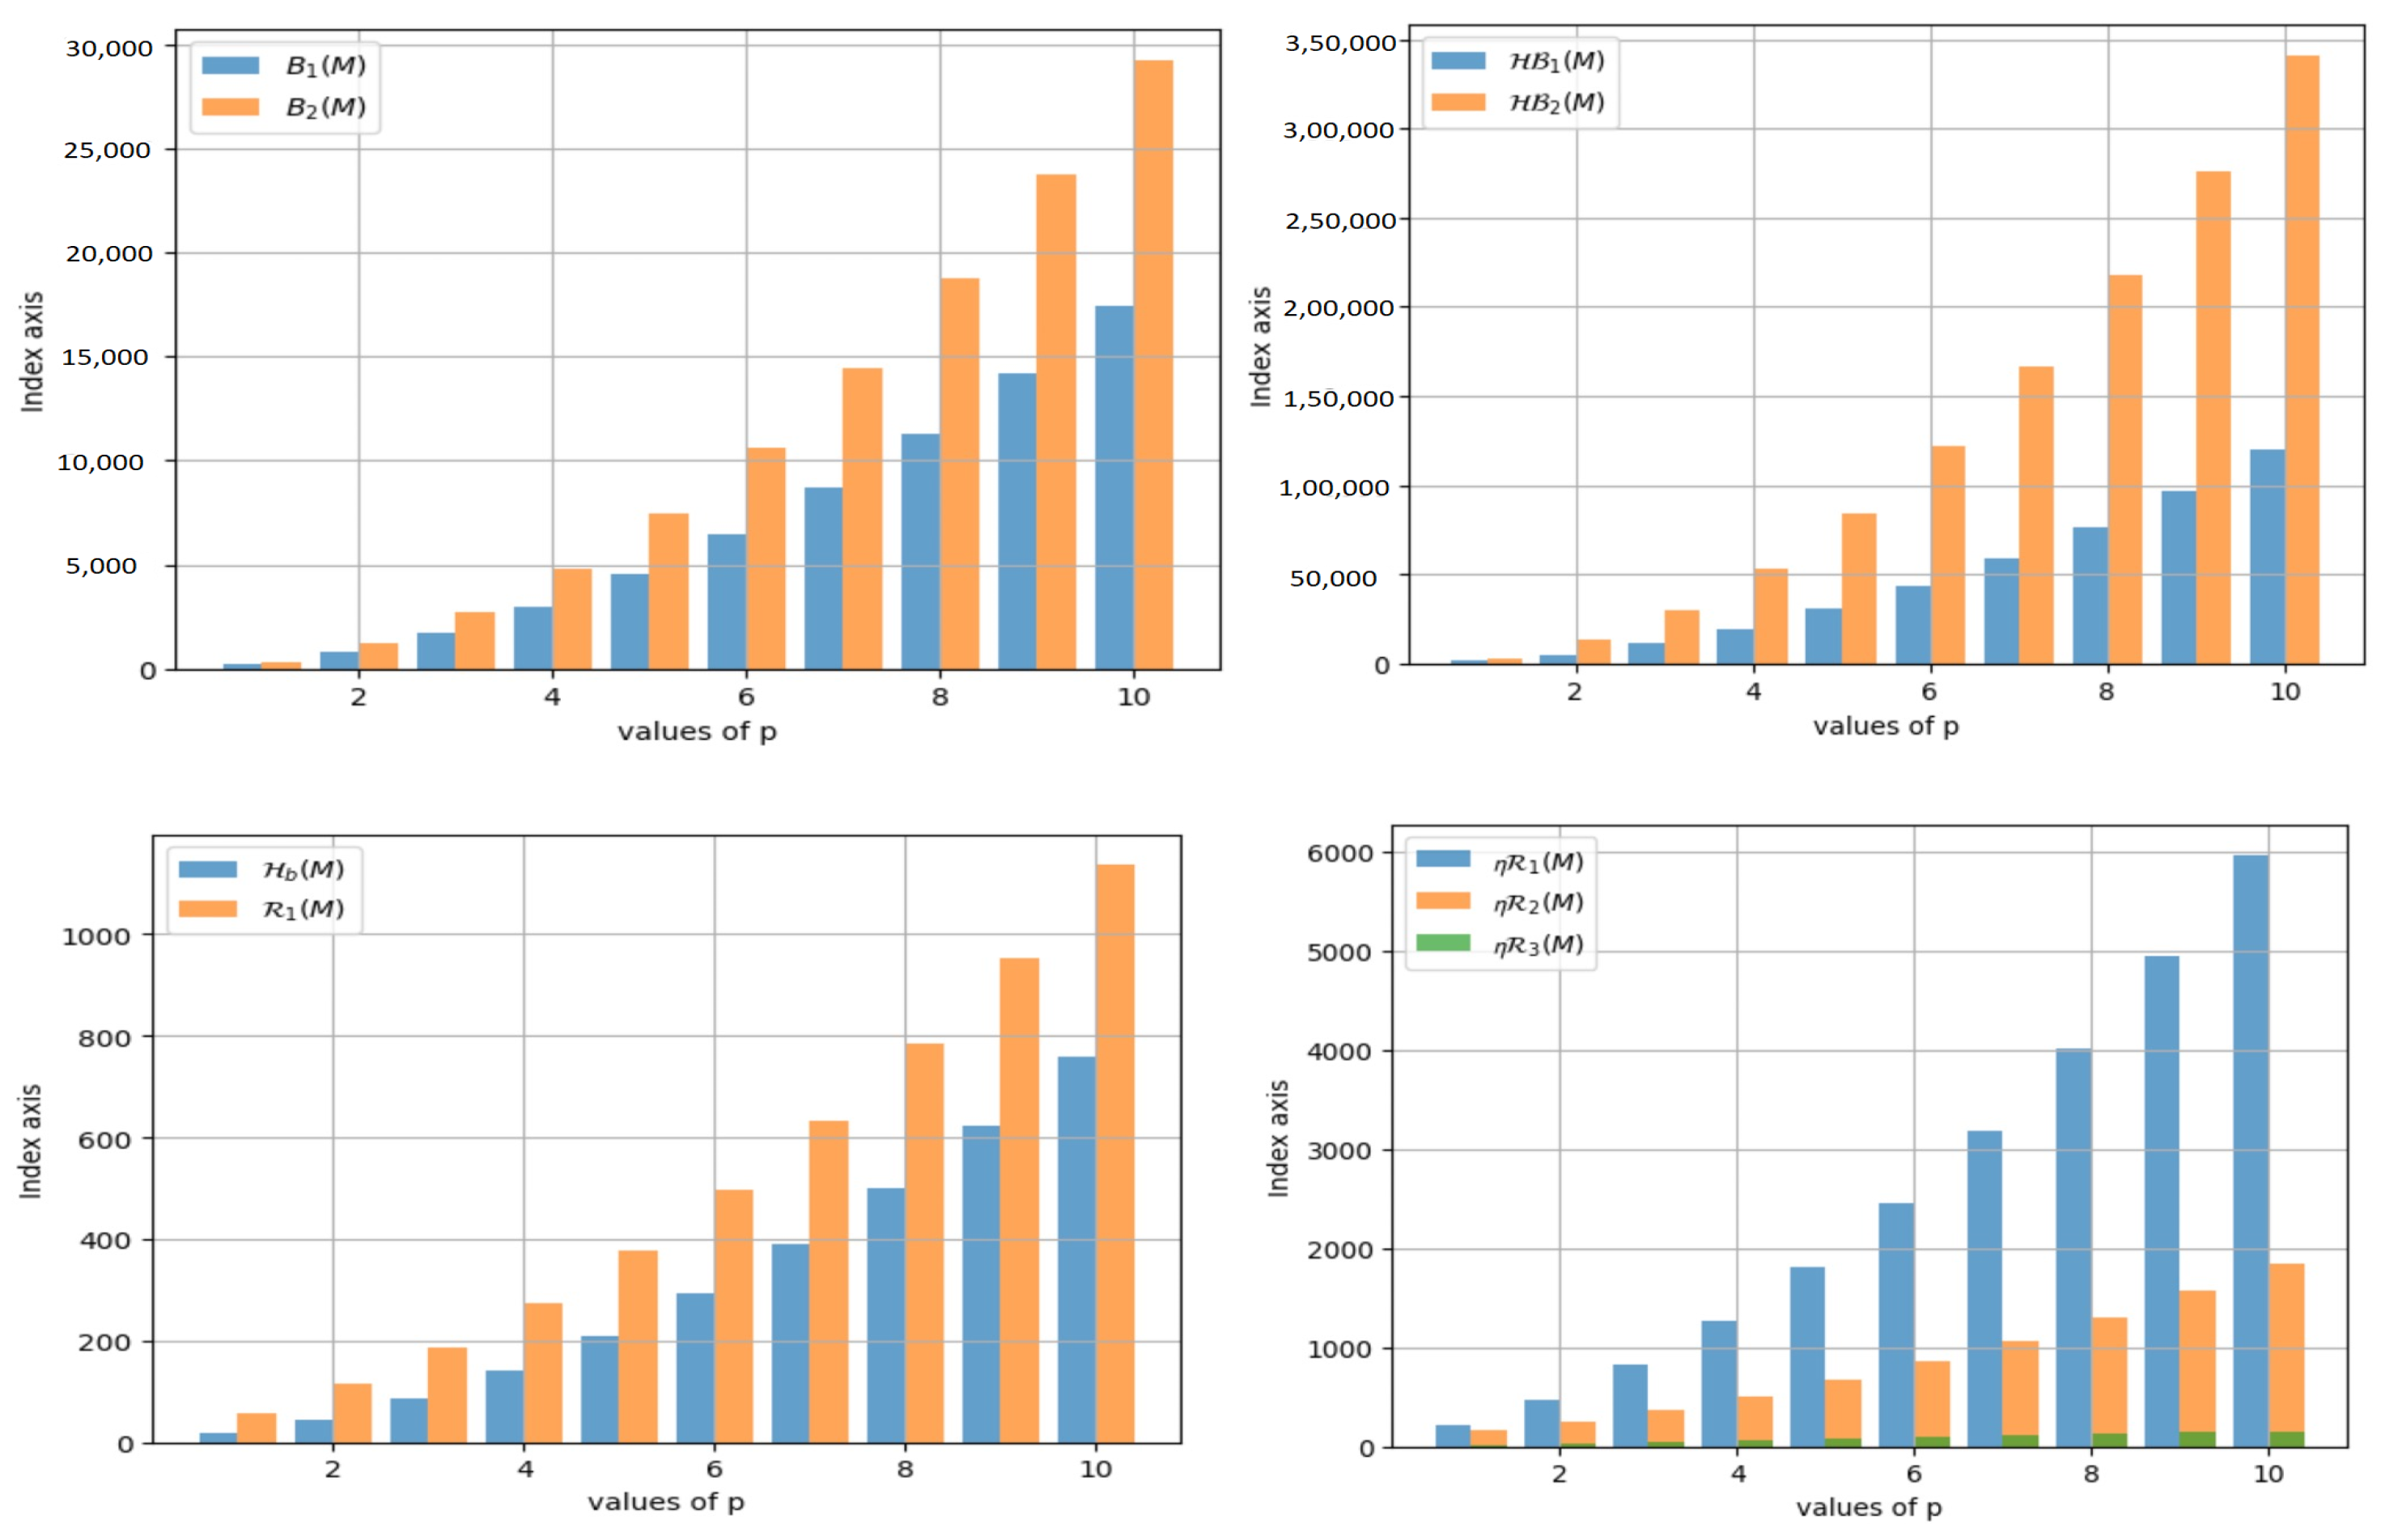
| p | |||||||||
|---|---|---|---|---|---|---|---|---|---|
| 1 | 234 | 404 | 1354 | 2988 | 15.790 | 192 | 103 | 16 | 58 |
| 2 | 802 | 1316 | 5074 | 12,924 | 43.523 | 448 | 195 | 32 | 114 |
| 3 | 1706 | 2804 | 11,146 | 29,772 | 84.971 | 800 | 311 | 48 | 186 |
| 4 | 2946 | 4868 | 19,570 | 53,532 | 140.133 | 1248 | 451 | 64 | 274 |
| 5 | 4522 | 7508 | 30,346 | 84,204 | 209.00 | 1792 | 615 | 80 | 378 |
| 6 | 6434 | 10,724 | 43,474 | 121,788 | 291.6 | 2432 | 803 | 96 | 498 |
| 7 | 8682 | 14,516 | 58,954 | 166,284 | 387.90 | 3168 | 1015 | 112 | 634 |
| 8 | 11,266 | 18,884 | 76,786 | 217,692 | 497.92 | 4000 | 1251 | 128 | 786 |
| 9 | 14,186 | 23,828 | 96,970 | 276,012 | 621.65 | 4928 | 1511 | 144 | 954 |
| 10 | 17,442 | 29,348 | 119,506 | 341,244 | 759.10 | 5952 | 1795 | 160 | 1138 |
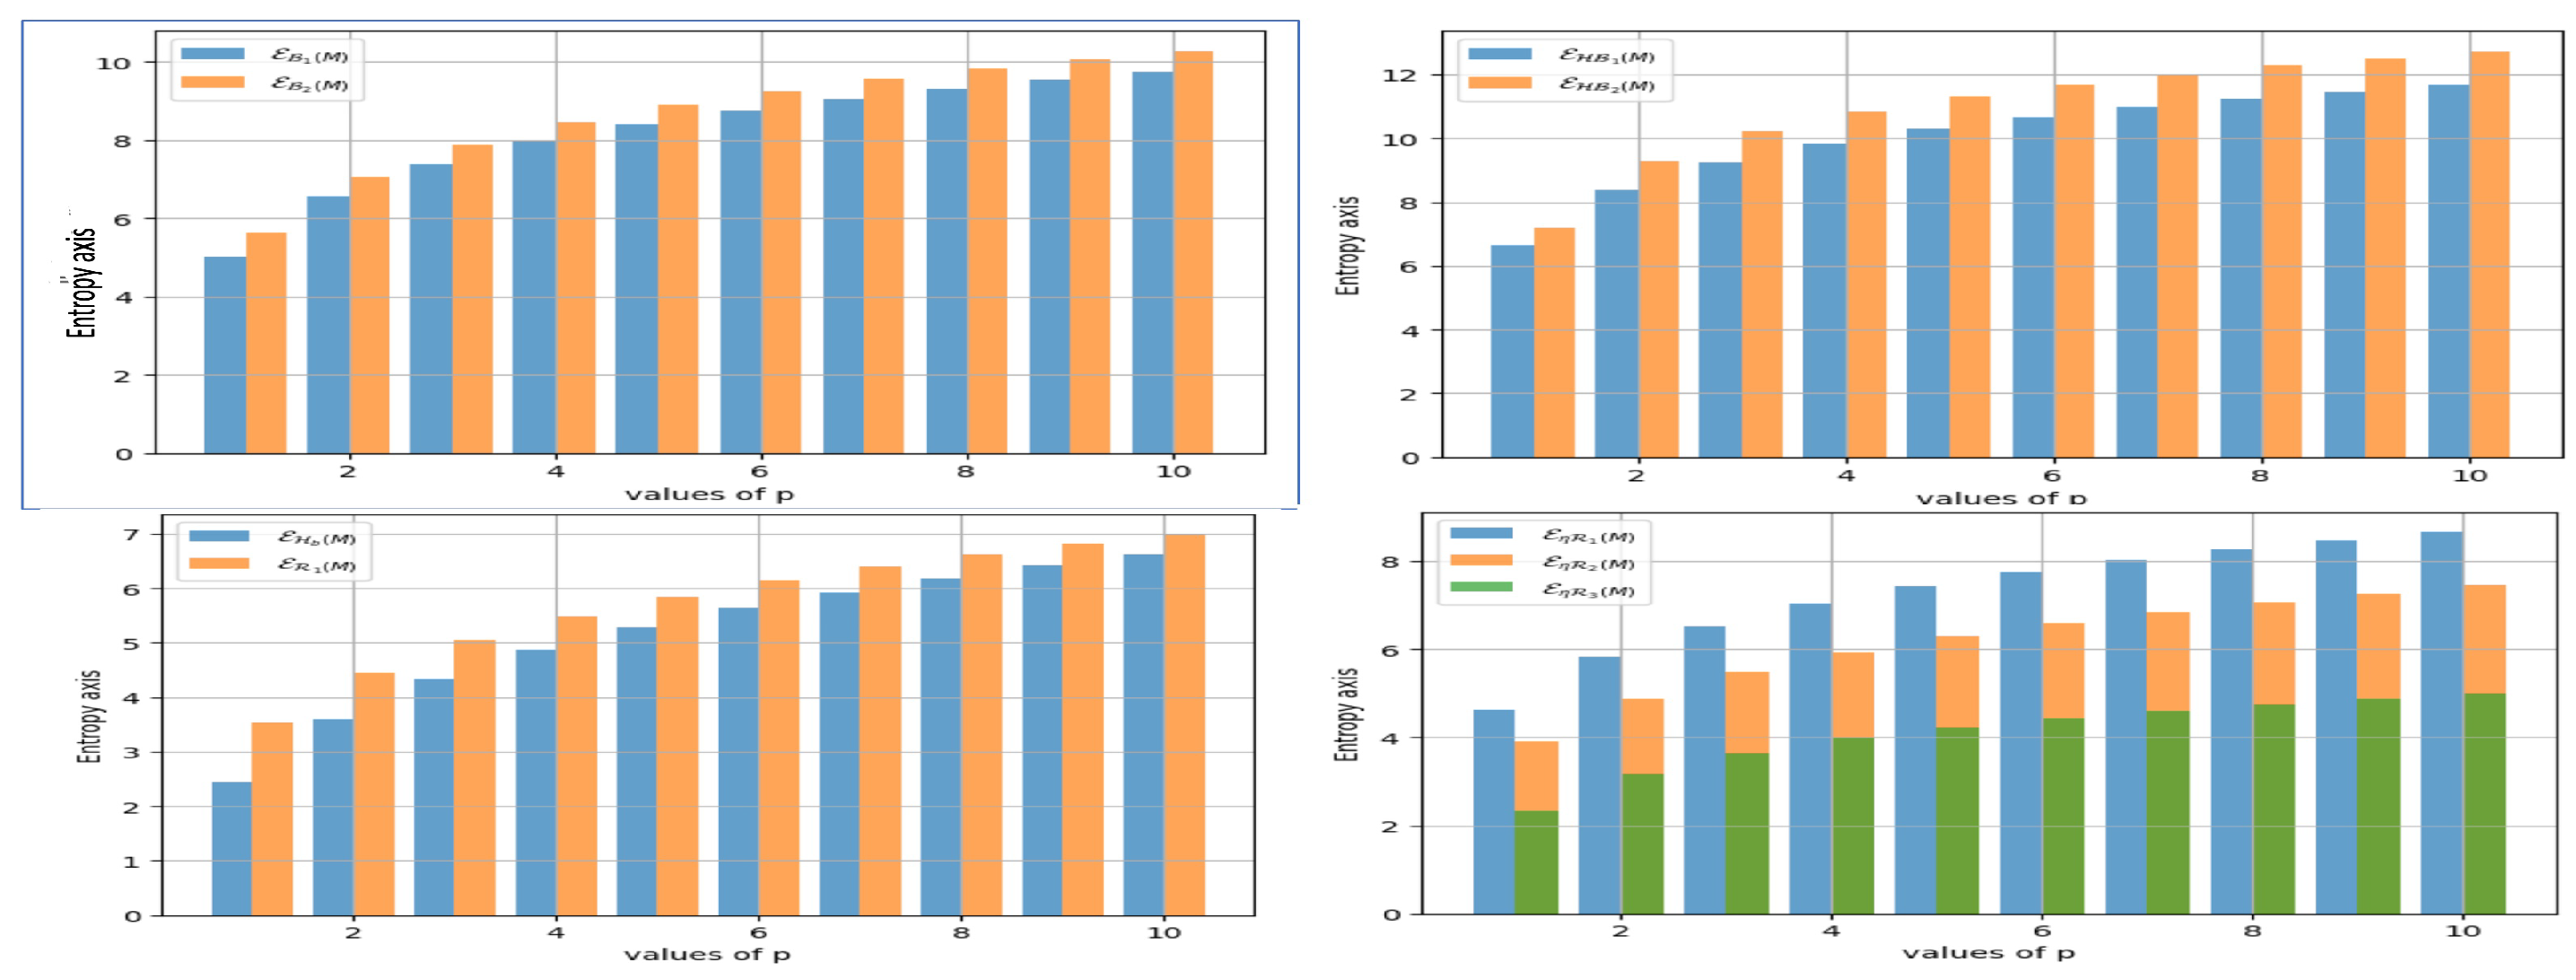
| p | |||||||||
|---|---|---|---|---|---|---|---|---|---|
| 1 | 5.019 | 5.616 | 6.655 | 7.181 | 2.442 | 4.634 | 3.904 | 2.343 | 3.540 |
| 2 | 6.556 | 7.062 | 8.383 | 9.276 | 3.595 | 5.831 | 4.873 | 3.165 | 4.453 |
| 3 | 7.379 | 7.881 | 9.251 | 10.218 | 4.334 | 6.530 | 5.484 | 3.642 | 5.045 |
| 4 | 7.951 | 8.457 | 9.843 | 10.842 | 4.870 | 7.02 | 5.933 | 3.972 | 5.487 |
| 5 | 8.392 | 8.902 | 10.295 | 11.311 | 5.290 | 7.42 | 6.289 | 4.223 | 5.842 |
| 6 | 8.752 | 9.265 | 10.662 | 11.689 | 5.636 | 7.744 | 6.586 | 4.426 | 6.139 |
| 7 | 9.056 | 9.571 | 10.971 | 12.006 | 5.930 | 8.020 | 6.841 | 4.595 | 6.395 |
| 8 | 9.319 | 9.837 | 11.238 | 12.279 | 6.185 | 8.262 | 7.065 | 4.741 | 6.620 |
| 9 | 9.552 | 10.071 | 11.474 | 12.519 | 6.412 | 8.476 | 7.265 | 4.868 | 6.822 |
| 10 | 9.760 | 10.281 | 11.684 | 12.733 | 6.615 | 8.670 | 7.446 | 4.982 | 7.004 |
| a | b | ||
|---|---|---|---|
| 1.43 | 12.40 | 1.11 | |
| 1.43 | 12.94 | 1.11 | |
| 1.44 | 14.34 | 1.12 | |
| 1.45 | 15.40 | 1.15 | |
| 1.41 | 9.24 | 1.07 | |
| 1.38 | 11.23 | 1.03 | |
| 1.34 | 9.92 | 0.96 | |
| 0.86 | 6.36 | 0.443 | |
| 1.34 | 9.50 | 0.97 |
Disclaimer/Publisher’s Note: The statements, opinions and data contained in all publications are solely those of the individual author(s) and contributor(s) and not of MDPI and/or the editor(s). MDPI and/or the editor(s) disclaim responsibility for any injury to people or property resulting from any ideas, methods, instructions or products referred to in the content. |
© 2024 by the authors. Licensee MDPI, Basel, Switzerland. This article is an open access article distributed under the terms and conditions of the Creative Commons Attribution (CC BY) license (https://creativecommons.org/licenses/by/4.0/).
Share and Cite
Almalki, N.; Tabassum, H. On K-Banhatti, Revan Indices and Entropy Measures of MgO(111) Nanosheets via Linear Regression. Mathematics 2024, 12, 561. https://doi.org/10.3390/math12040561
Almalki N, Tabassum H. On K-Banhatti, Revan Indices and Entropy Measures of MgO(111) Nanosheets via Linear Regression. Mathematics. 2024; 12(4):561. https://doi.org/10.3390/math12040561
Chicago/Turabian StyleAlmalki, Norah, and Hafsah Tabassum. 2024. "On K-Banhatti, Revan Indices and Entropy Measures of MgO(111) Nanosheets via Linear Regression" Mathematics 12, no. 4: 561. https://doi.org/10.3390/math12040561
APA StyleAlmalki, N., & Tabassum, H. (2024). On K-Banhatti, Revan Indices and Entropy Measures of MgO(111) Nanosheets via Linear Regression. Mathematics, 12(4), 561. https://doi.org/10.3390/math12040561