Abstract
In mine planning, uncertainty assessment is essential to properly value a mining project. Geological, operational, and economical risks have to be considered to find the variable values that maximize the profit of the project. In this research, geological uncertainties are taken into account to assess the economic value of an underground gold mine. The scenarios considered are the tonnage-grade curves which are simulated by the Monte Carlo method. The decision variables are the cutoff grade (CoG), the Life of Mine (LoM), and operational variables, namely the mining and the processing capacity. In order to assess the economic value, we maximize the Net Present Value (NPV), which is carried out by a Genetic Algorithm (GA). This optimization, so-called implicit optimization, generates results of the probabilistic model which are compared with the deterministic one; the results found for a real underground gold mine show that, in the probabilistic case, the Net Present Value is higher and the time horizon is shorter than the results of the deterministic case, and the mining and the processing capacity are higher for the probabilistic case than the deterministic one.
MSC:
90B06
1. Introduction
In mining operations, investments of millions of dollars and time horizons of many years are involved. For these reasons, the mining projects are expensive and risky [1], but they are attractive given the auspicious outlook for mineral prices, especially those that are essential for the energy transition, whose demand is rising spectacularly [2]. Thus, mine planning is essential for diminishing the risks and for guaranteeing attractive returns for the investors. One of the critical problems in mining business is to determine the CoG, that is, the minimum grade required for a mineral or metal to be economically extracted or processed [3]. In other words, this problem consists of discriminating between mineral and waste, which must be resolved rigorously to guarantee the success of the mining business. In a seminal paper [4], Lane proposed an algorithm to determine the optimal CoG in order to maximize the NPV of a mine subject to mining, milling, and refining capacities. This approach considers deterministic operational and geological parameters generating a constant CoG along the LoM. Although Lane’s work implied an important advance to reduce risks in the mining business, Lane’s primitive model, due to its deterministic formulation, does not consider economic, operational, technical or geological uncertainties, which are the main uncertainties that the mining operations face [5]. Later research proposes extensions of the Lane model incorporating uncertainties and additional parameters for creating more realistic models [6,7,8,9]. Consequently, in the literature, we find approaches considering the optimal cutoff for a polymetallic deposit [5], dynamic CoG for underground mining [6], probabilistic CoG considering tonnage-grade curve and prices as uncertain parameters [7], the influence of the pre-concentration on the reduction in the CoG and the sustainability in mining operations for an underground mine [8], etc. Also, some parameters considered fixed in the Lane setting, such as capacities for the mine, processing plant, and refinery, have been considered as variables which improve the determination of the CoG in open-pit mines [10]; the Life of Mine has been used as a variable in an open-pit mine as well [11]. On other hand, the Capital Expenditure (CAPEX) and capacities have been taken into account for optimizing the NPV of a phosphate mine [12]. However, to the best of our knowledge, no work has jointly addressed the mining and processing capacities, the LoM, the CAPEX, and the overhead costs as variables for optimizing the cutoff grade in a deterministic or probabilistic setting, much less for the underground mining.
As decision variables and parameters have been added to capture the complexity of the mining business, the computational complexity of the problems has been increased [13]. In particular, probabilistic approaches involve a large amount of time to solve the corresponding optimization problems as well as computational resources due to the numerous scenarios considered [14]. To address the size and complexity of optimization problems, metaheuristic optimization methods are used instead of traditional methods because they are less time-consuming than traditional ones [15]. Metaheuristic algorithms find optimal (or locally optimal) solutions by exploring solution candidates that are generated following general procedures that exploit the information collected during the search [16]. Although metaheuristics do not guarantee obtaining global optimal solutions, they are a good option for addressing large-scale problems; also, their effectiveness can be improved if they exploit the particularities of a specific optimization problem [15]. Consequently, many types of metaheuristics are applied to mining problems which are typically intractable through classical optimization, listed as follows: Artificial Neural Networks, Tabu Search, Ant Colony Optimization, Simulated Annealing, Genetic Algorithms (GAs), Particle Swarm Optimization, Imperialist Competitive Algorithm and Variable Neighborhood Search. They have been applied to a wide variety of mining problems, such as blast, transport, mineral processing, geological uncertainty, CoG, production scheduling and global optimization [16]. In particular, the determination of the optimal CoG has been tackled by using GAs [17], Simulated Annealing [18] and Imperialist Competitive Algorithms [19].
In this work, we revisit the determination of the optimal CoG problem with a probabilistic approach by using a GA combined with Monte Carlo simulation and considering the geological uncertainties and operational variables, such as mining and processing capacities, fixed costs and LoM.
The main contributions of this work are as follows:
- (a)
- We present a model to maximize the NPV in an underground gold mine considering economic, operational, technical, and geological uncertainties. Deterministic and probabilistic models are formulated.
- (b)
- Our operational decision variables are the CAPEX, the LoM, which is typically considered fixed, the overhead costs, and the mining and the processing capacities.
- (c)
- We analyzed the fixed and variable mining costs, their impact on the cost structure, and the change in the cutoff grade (CoG) due to the change in overhead expenses and mining capacity.
- (d)
- We apply our work on a real case study, a Colombian underground gold mine, and we compare the results of the deterministic case and probabilistic model. The probabilistic problem is solved combining Monte Carlo simulations and a GA.
- (e)
- We show, through our real case study, the relevance of considering a dynamic CoG, LoM, and mining capacity as variables, namely that the NPV improves considerably by allowing for dynamic CoG and a variable mining capacity. The LoM decreases in the probabilistic framework compared to the deterministic one by one year to optimize the NPV.
The paper is organized as follows: In Section 2, we present the methodology, that is, the optimization techniques used and the proposed optimization model. In Section 3, the proposed model is applied to a real underground gold mine and comparisons are made between deterministic and probabilistic models. Finally, in Section 4, we outline the conclusions and future work.
2. Methodology
2.1. Monte Carlo Optimization
To conduct a capital budgeting process based on a deterministic basis can be risky, especially for mining projects, because uncertain components are ignored. To avoid this limitation, we can adopt probabilistic approaches, such as the capital budgeting based on Monte Carlo simulation [20]: simulations are performed using historical data or preset probability distributions of some uncertain parameters; after that, a discounted cash flow is calculated, which for our study is the NPV, for each simulated scenario in order to find the average of the NPVs of the scenarios:
where represents the scenarios which have been supposed to be equiprobable, and is the number of scenarios. In this analysis, the standard deviation of the NPV is also considered in order to assess the risk involved in the return estimation:
Now, we are interested in maximizing the average NPV on the decision variables, that is, we seek an optimal policy that maximizes the average of the NPV. For it, we use the implicit probabilistic optimization method, also called the Monte Carlo optimization, whose operation is schematized in the following algorithm [11] (Algorithm 1):
| Algorithm 1 Implicit Optimization |
| Step 0: Define an initial policy. |
| Step 1: Simulate scenarios by the Monte Carlo method. |
| Step 2: Find the NPV for each scenario and the chosen policy. From the obtained NPV empirical distribution, calculate the average and the standard deviation of the NPV. |
| Step 3: Check some stopping criteria. If not satisfied, update the policy in order to maximize the average of the NPV by one of the optimization methods (e.g., metaheuristic methods) and go back to Step 1. |
The stopping criteria used in this work is the Cauchy criteria:
where is the average NPV for the iteration and is a tolerance parameter.
The advantage of using implicit optimization is obtaining optimal or locally optimal solutions in less time than classical optimization, but sometimes it can be inefficient or unsuccessful, and for this reason it is crucial to select an appropriate metaheuristic method adapted to the specific optimization problem [21].
2.2. Genetic Algorithm (GA)
GAs are evolutionary algorithms inspired by Darwin’s evolutionary theory, which states that natural characteristics compatible with the conditions of nature are more likely to survive [17]. GA was introduced by Holland [9] as a random optimization algorithm, with application in complex optimization problems for which classical methods are inefficient, such as discrete, nonlinear, and non-differentiable optimization problems [22].
A GA encompasses the following operations [17]:
- (a)
- Codification: The parameters are coded as binary strings. The parameters are called genes and the binary strings are called chromosomes.
- (b)
- Generation: The algorithm initiates with an initial population. From the initial population, offspring are generated through selection, crossing and mutation operations. The population of a particular iteration is called generation.
- (c)
- Fitness function: The fitness function is the objective function that has to be optimized, e.g., the NPV. It determines the fitness of populations compared to their ancestors.
- (d)
- Selection: The fittest individuals of the current generation are selected. Their fitness is assessed by the fitness function. They will generate offspring by crossover operation.
- (e)
- Crossover: The selected individuals are combined. The chromosomes of each individual are cut at random and the pieces are randomly recombined to create new individuals.
- (f)
- Mutation: After crossover operation, a mutator operator is applied to the chromosomes. This operator modifies randomly the individuals. Thus, a new generation has been created.
- (g)
- Stopping Criteria: There are two common stopping criteria, listed as follows: (i) the algorithm ends after generating a predetermined number of generations and (ii) the algorithm stops when a certain uniform population is reached, that is, a high proportion of genes do not change significantly after a new iteration of the algorithm.
Most cutoff grade optimization problems have a large number of local optima, which can be far from the global optimum. Probabilistic search methods can easily fail in finding the global optimum for such problems. The real challenge is to find solutions close to the global optimal point during a limited time. GAs are more robust in this context than other existing search methods [23].
2.3. Optimization Model
The probabilistic optimization model used in this work was proposed, taking into account the data and characteristics of a gold mining company with underground mining operations. To obtain a flexible assessment, we introduce operational and economic variables that typically are considered fixed in the literature, such as the mining and processing capacities, the LoM, the CAPEX and the overhead costs. Moreover, to the best of our knowledge, these variables have not been considered jointly in a probabilistic model that optimizes the cutoff grade for maximizing the profit. The model aims to maximize the NPV in the deterministic approach and the average NPV in the probabilistic setting.
Next, we introduce the parameters, scenarios, decision variables and outcomes, and its notation.
2.3.1. Parameters
The values of the parameters for our case study are shown in Table 1. They are the same for the deterministic and probabilistic models, as follows:
Table 1.
Parameter values. The quantities and are considered as variables for the probabilistic model.
- -
- : mining cost (USD/t). The mining cost per tonne, , is fixed, but the mining cost for the operation, , where is the mined material (see Section 2.3.3), is variable.
- -
- : processing cost (USD/t). The processing cost per tonne, , is fixed, but the mining cost for the operation, , is variable.
- -
- : metal price (USD/oz). The metal price is considered as a deterministic parameter.
- -
- : metal saleable percentage (%).
- -
- : royalties (%).
- -
- : metallurgical recovery coefficient (%).
- -
- : commercialization expenditures (USD/oz).
- -
- : price of saleable metal (USD/oz).
- -
- : number of scenarios.
- -
- : discount rate (%).
- -
- : depreciation (USD). It is supposed to be a linear depreciation.
- -
- : income tax (%). It is 33% on earnings before interest and taxes (EBIT).
- -
- : cash cost (USD/oz).
2.3.2. Scenarios
One of the main sources of uncertainty in a mining project is the ore grade. Firstly, we consider a deterministic mineralogical model of the ore body, and secondly, many scenarios are generated from a five tonnage-grade curve. The orebody is shown in Figure 1.
Figure 1.
Different views of the orebody. (a) From above, (b) from south-east, and (c) from south-west.
Just one tonnage-grade curve is considered for the deterministic instance, because no geologic uncertainty is assumed. It is depicted in Figure 2. Instead, for the application of the probabilistic model, thousands of scenarios are created by Monte Carlo sampling based on the five tonnage-grade curves shown in Figure 3.
Figure 2.
Tonnage-grade curve for the deterministic model.
Figure 3.
Tonnage-grade curves for the probabilistic model.
- -
- : tonnage-grade curve sampling using the Monte Carlo technique.
- -
- : fine gold reserves (g).
2.3.3. Decision Variables
- -
- : Life of Mine (years).
- -
- : mined material for scenario at year (t).
- -
- : maximum mining capacity at year (t/year).
- -
- : processed material for scenario at year (t).
- -
- : maximum processing capacity at year (t/year).
- -
- : Overhead for scenario at year (USD/t). The total overhead for the operation, , is assumed to be fixed for each and , while the overhead per tonne, , is variable for each scenario at year .
- -
- : Overhead at year for the maximum mining capacity (USD/t). The same observation that was commented for is valid for .
- -
- : capital expenditure (USD).
On one hand, the decision variables , and do not depend on the scenarios’ variables. These variables are robust, so they have to maximize the average NPV considering all scenarios generated by the Monte Carlo simulations, and they will be improved at each iteration of the GA. On the other hand, the decision variables depend on the scenarios’ variables, so they will be optimized for a particular scenario at year with the variables , and constraining them.
2.3.4. Outcomes
The outcomes are defined to prepare the income statements shown in Section 3.1 and Section 3.2 [24].
- -
- : Optimal CoG for scenario at year (g/t). The optimal CoG was calculated omitting the refinement costs (see [3]).
- -
- : optimal CoG at year without the refinement costs (g/t).
- -
- : reserves for scenario and CoG (t).
- -
- : reserve average grade for scenario and CoG (g/t).
- -
- : initial reserves for the maximum mining capacity at period (t).
- -
- : final reserves for the maximum mining capacity at period (t).
The relation between the last two outcomes and the production is .
- -
- : total cost at year (USD/t).
- -
- : operational expenditures (OPEX) at year (USD).
- -
- : processed fine gold for scenario at year (g).
- -
- : processed fine gold for the maximum capacity process at year (g).
- -
- : Sale incomes at year (USD).
- -
- : gross profit margin at year (USD).
- -
- : earnings before interest, taxes, depreciation, and amortization at year (USD).
- -
- : earnings before interest and taxes at year (USD).
2.3.5. Objective Function
Firstly, we fixed the decision variables , and to certain values, chosen according to implicit optimization and the GA.
Now, we maximize the NPV of the mine for each scenario and the fixed variables , and :
where is the free cash flow in dollars, which is calculated as the gross margin at each period under scenario :
where is the gross margin, which is calculated as
The maximization in (1) is subject to the constraints:
which says that the tonnage of processed material is lesser or equal than the processing capacity for any scenario and year ,
which means that there are no stockpiles; that is, all mined material is processed, and
which means that annual total overhead is constant for every scenario and any year. In our case, we have . In the deterministic case, this constraint is valid except for the closure mine year, , for which the overhead expenses are proportional to the mine production.
Finally, we suppose that all scenarios’ variables are equiprobable. Thus, we calculate the average NPV for all scenarios by the expression:
where is the solution of the optimization problem (1)–(5). The highest value of average NPV, , is updated and the optimization is repeated for the other policy .
The optimization model incorporates geological uncertainty through the simulated tonnage-grade curves represented by . The operational variables are the mining capacity and the processing capacity , as variables which satisfy because there are no stockpiles. The optimization model maximizes the average of the NPV, and this maximization is performed over the following variables: the overhead, the LoM, the mining capacity and the processing capacity, and the CAPEX. One of most important outcomes of the model is the dynamic cutoff, which depends on the operational costs (, and ), the metal prices ( and ), the metal saleable percentage (), the royalties (), the metallurgic recovery coefficient (), and the commercialization expenditures () according to
3. Results
Our model is applied to a real gold underground mine. For confidentiality, we have omitted the identity of the mining company. The ore is processed, but not refined for commercialization. The products commercialized are gravimetric and flotation concentrates. In the case study, the stockpiles are not considered, so all mined material is processed.
To compare the results of the deterministic and probabilistic models, we apply both to the real case.
3.1. Deterministic Model
The deterministic problem is based on the model currently employed by a real underground gold mine. It does not consider uncertainty for the calculation of the CoG, which is assumed to be constant. Also, this model considers a known tonnage-grade curve and fixed extraction and processing capacities. For these reasons, income is constant throughout the mining project except for the mine closure year for obvious reasons.
The original data were modified by a white noise for confidentiality reasons. The variables and parameters for the deterministic case are summarized in Table 1.
The static CoG was calculated by Equation (6). As was mentioned, the constant CoG and the corresponding constant average grade of 4.4 (g/t) along the entire time horizon implies a very inflexible policy that ignores the geological and the operational uncertainties. Note that the CoG is linear on the mining, processing, and overhead per tonne. It means that the CoG increases linearly as costs increase, and it implies that for increasing costs, the metal mined requires higher ore grades to keep the business profitable.
The results of the deterministic model are summarized in Table 2, indicating that the optimal CoG is , LoM is 7 years, the cash flow is USD 112,335,120, and the NPV is USD 36,043,086.
Table 2.
Results for the deterministic model.
In Table 3, the results are detailed through a simplified cash flow statement. As the CoG, the rock mined is constant along the LoM, except during the last year when production decreases before mine closure. Consequently, processed material, mining costs, processing costs, OPEX, and free cash flow are constant along the first six years. The total overhead per ton is constant, as well as the total overhead during the first six years. By the seventh year, the remaining reserves are totally depleted, and for that reason the processed material, costs, and revenues diminish.
Table 3.
Parameters, variables, and annual outcomes for the deterministic model.
Summarizing the results of Table 3, we can say that for the first six years, the annual results are as follows: the total rock extracted, as well as processed rock, are 328,500 tonnes, the mining cost is USD 14,848,200, the processing cost is USD 3,285,000, the overhead is USD 9,000,900, OPEX is USD 27,134,100, and the free cash flow is USD 31,965,463. In the seventh year, the results are as follows: the total rock extracted, as well as processed rock, are 90,110 tonnes, the mining cost is USD 4,072,962, the processing cost is USD 901,098, the overhead is USD 2,469,008, OPEX is USD 7,443,068 and the free cash flow is USD 8,768,344. Note that the overhead diminishes in the last year because the production diminishes as well, and we assume for the deterministic model a constant overhead of expenses per tonne (USD/t).
Therefore, the results show us a rigid and non-robust scheduling of the mining operation, which is incompatible with the changing conditions due to geological, operational, and financial uncertainties.
3.2. Probabilistic Model
In order to apply GA, we select an initial population of individuals for the variables , , for and to start the optimization. The values are shown in Table 4.
Table 4.
Values for the initial population .
The optimization with Monte Carlo simulations was carried out using the @Risk Palisade 2015 software as follows: first, we fix a population of individuals and many scenarios are generated according to a specific probability distribution. The NPV is maximized for each scenario, solving the problems (1)–(5) for the generated scenarios. The solving of each optimization problem is called iteration. After that, we calculate the average NPV, completing a trial which can be valid if all restrictions are met or not valid if contrary. If the trial result meets the stopping criteria, which could be a limited number of tests or a convergence criterion, the optimization ends; otherwise, a new population is proposed and a new trial is performed [25].
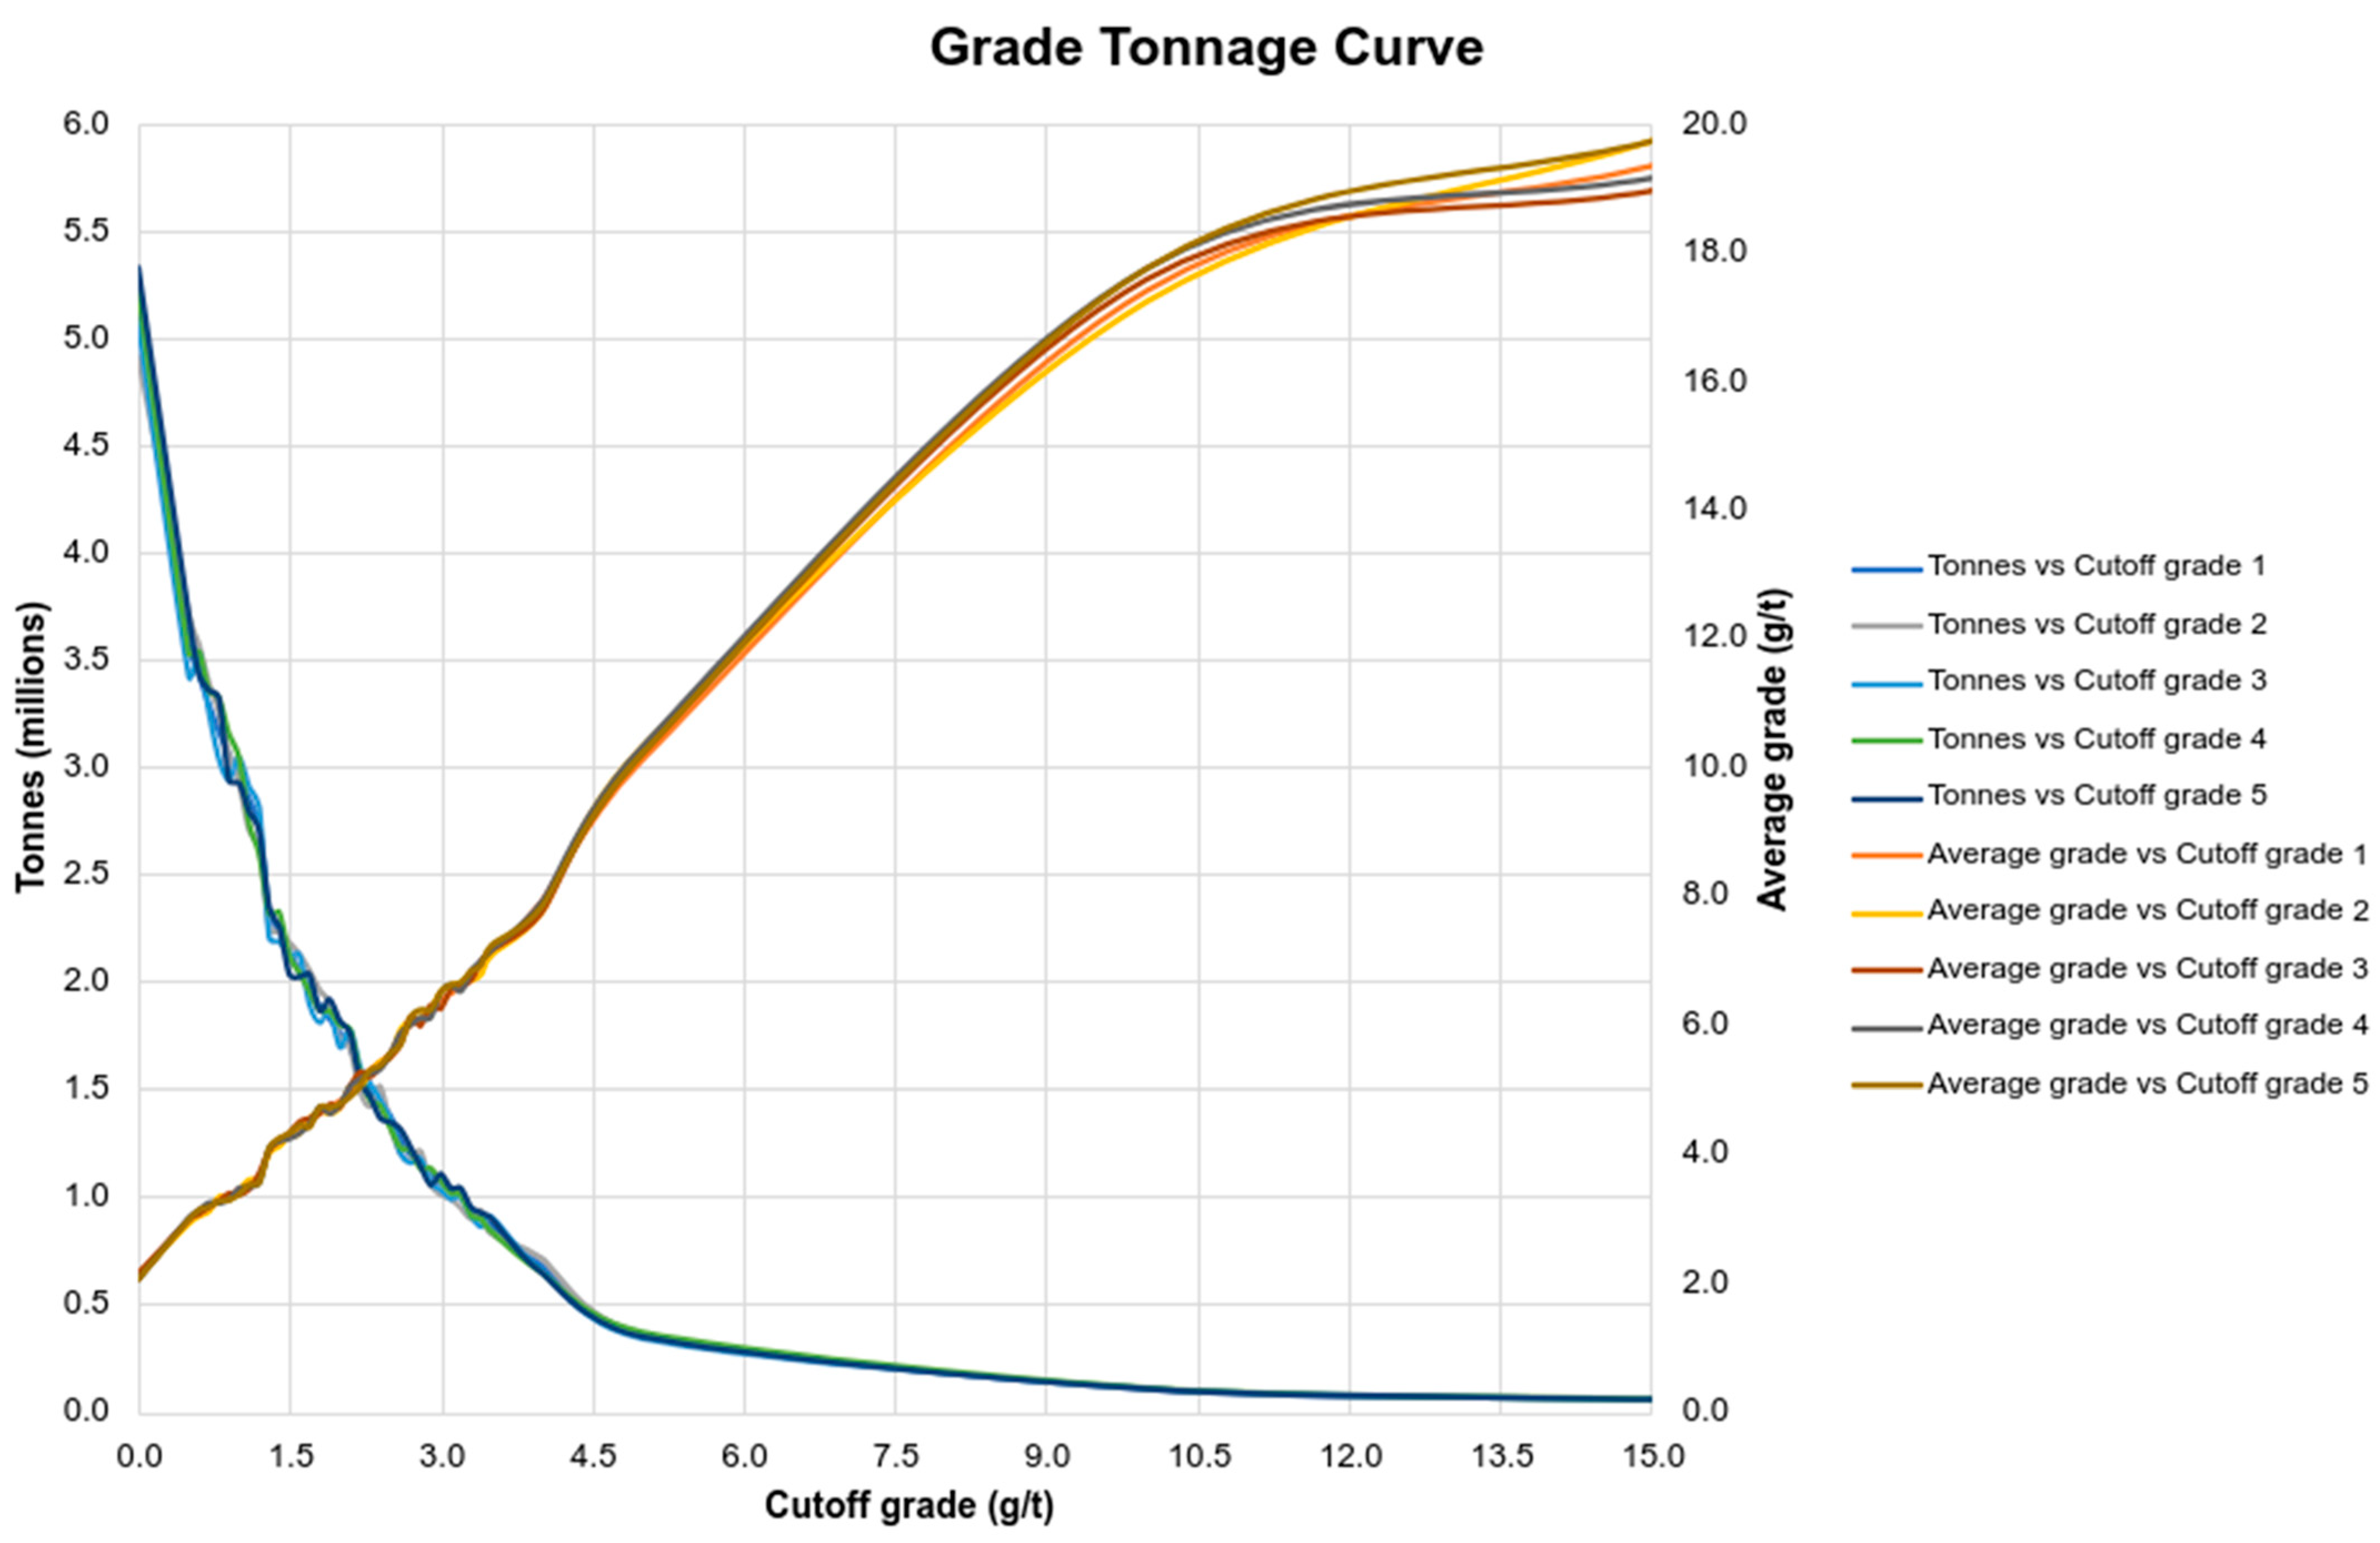
The tonnage-grade curves were estimated by the conditional simulation process to obtain tonnage-grade curves, and the model includes five curves, each of which corresponds to the average of 25 conditional simulations in which the capping value was modified as an estimation parameter, establishing for each curve a capping value of 30, 40, 50, 60 and 70 g/t, respectively. The estimation process was carried out by the mining company, taking into account the confidentiality of the data. In that way, the five tonnage-grade curves were obtained (Figure 3). These five scenarios were used to generate thousands of geological scenarios by combining them through a discrete uniform distribution. This allows for combining optimistic and non-optimistic scenarios, treating them as equally probable. Mathematically, let be a CoG, be a tonnage-grade curve, be the corresponding tonnage and be the corresponding average grade. Then, the scenarios of the tonnage-grade curve at cutoff are generated as realizations of the random variables, as follows:
and
and a particular realization of these variables is denoted by and , respectively.
After many operations of selection, crossover, and mutation, the algorithm implemented in @Risk converged to the solution summarized in Table 5. The number of iterations per trial, the trials, and the valid trials are shown in Table 5. To determine the convergence of the algorithm, we implemented the stopping criteria (SC). The convergence of the probabilistic optimization is depicted in Figure 4.
Table 5.
Probabilistic model results.
Figure 4.
Number of iteration vs. . The convergence of the algorithm is observed graphically around the iteration .
The NPV distributions for the initial and the optimized values are shown in Figure 5.
Figure 5.
NPV distributions for the initial and the optimized values.
Comparing the deterministic results and the probabilistic ones, we note an improvement on the cash flow and the NPV. Indeed, the average NPV of the probabilistic model increases USD 21,142,372 compared to the deterministic NPV. Furthermore, the probabilistic model generates a dynamic CoG and a material processing around 438,000 tonnes per year the first four years, decreasing to 364,299 tonnes the fifth year and increasing to 438,000 tonnes the sixth year, as the end of LoM is approaching. Instead, the deterministic case considers a constant CoG and a material processing value of 328,000 tonnes per year the first six years, and decreases to 90,110 tonnes the seventh year. The comparison between the results of production is shown in Figure 6. The high costs required to maintain equipment in operation suggest that the optimal solution is to utilize machinery, such as the mill, at its maximum capacity. Thus, the optimal solution tends involve maintaining a constant level of production. Generally, the production falls during the last years of operations, and the mineral reserves are depleted. However, the solution obtained indicates that it is more convenient to anticipate the decline in production to the fifth year. To maintain a mostly constant production, it would be necessary to modify the cutoff grade, which explains the fluctuation of the cutoff grade during the Life of Mine.
Figure 6.
Optimal dynamic cutoff and optimal capacity process for the probabilistic model.
The variation coefficient for the probabilistic NPV is 10.36%, which indicates that the risk is moderate, considering that mining projects are highly risky. Instead, the deterministic NPV has no associated uncertainty and it can not capture the inherent risk of the mining business.
As for costs, the mining costs per tonne are the same for the deterministic and probabilistic cases, but the total mining costs vary, detailed as follows: the probabilistic case gives us higher mining costs than the deterministic case, because at the probabilistic setting more rock is extracted than in the deterministic one. Taking into account that all the rock extracted is processed by assumption, we analogously conclude that the processing costs are higher for the probabilistic model. Instead, the total overhead is fixed in both cases to 9,000,900 dollars, but the overhead per tonne is 27.4 (USD/t) for the deterministic model, 20.6 (USD/t) at years 1, 2, 3, 4, 6, and is 24.7 (USD/t) at year 5 for the probabilistic approach, which reveals a lower overhead for the probabilistic instance than the deterministic one. The efficiency in relation to the overhead is higher for the probabilistic model, because with the same resources the company produces more at the probabilistic setting than in the deterministic one. This efficiency is reflected in the OPEX, as follows: indeed, for these expenses, the probabilistic results show more efficiency than the deterministic ones, as can be seen in Table 3 and Table 6. Further, the overhead per tonne impacts the CoG, which follows from Equation (6). Thus, the probabilistic solution shows an increase in production compared to the deterministic results with the same overhead, which implies a lower overhead per tonne and, consequently, a lower CoG in the probabilistic case.
Table 6.
Parameters, variables, and outcomes for the probabilistic model.
Finally, on the one hand, for the probabilistic model, the obtained LoM was 6 years and the CAPEX was USD 83,226,000. On the other hand, the LoM for the deterministic model was 7 years and the CAPEX was USD 88,226,000. Hence, LoM and CAPEX decrease when uncertainty is considered, and it could make the project more attractive for investors and creditors because the profit is expected to be earned in less time, diminishing the opportunity cost and the initial investment, thereby easing the project initiation phase.
In summary, either the CoG, the process capacity, or the LoM show that the probabilistic model provides better financial results than the deterministic one. The results of the probabilistic model are summarized in Table 6. These results were calculated using the last sampling, corresponding to the last iteration of the last valid trial performed by @Risk.
We conclude that the results reveal the relevance of the decision variables of our model, because they vary significantly when uncertainty is considered, producing an increase in the NPV.
3.3. Sensitive Analysis
The reviewed literature considers various variables and uncertainties associated with the optimization of cutoff grades. In the case of gold deposits, geological and economic uncertainties are commonly identified as the key variables in stochastic models. Unlike the models consulted, economic uncertainty related to gold prices was not factored in, despite the constant macroeconomic and geopolitical changes worldwide that frequently impact forecast confidence intervals in commonly used time series.
Regarding operating costs, the proposed model treats mining and processing costs as variable, meaning they fluctuate according to the set processing capacity. Meanwhile, general costs are treated as fixed in the free cash flow structure, meaning they do not vary with the volume of processed tons. This aspect of the model has the two following objectives: first, to assess the impact of fixed costs on total operating costs by altering the plant’s processing capacity without changing general costs, i.e., maintaining the same personnel and direct support areas, main activities, general and administrative (G&A) costs, and sustainability expenses; second, to evaluate the change in cutoff grade when adjusting the processing capacity while keeping the general cost component fixed.
A sensitivity analysis is presented below, with variables including mineral prices and operating costs, considering the historical price of gold over the past 10 years and the company’s historical operating costs (Figure 7):
Figure 7.
Sensitivity analysis of NPV in relation to metal prices and operational costs. Losses are shown in red and gains in black.
This sensitivity analysis reveals that a gold price below USD 1200/oz leads to a negative NPV, indicating the project is unprofitable and financially unfeasible. Conversely, a price above USD 1800/oz yields a positive NPV, suggesting the investment would be profitable across all cost scenarios analyzed.
4. Conclusions and Future Work
The mining business involves multiple risks and uncertainties and mining planning is applied to mitigate them. More sophisticated models are created to obtain more realistic financial projections, such as those that consider uncertainties in prices and geological models. Economic, operational, and geological technical aspects have also been taken into account to conduct capital budgeting of mining investments. In this work, we consider a Lane algorithm type with financial and operational variables, namely the capital expenditure and the mining and processing capacity, and the LoM was considered as a decision variable. The tonnage-grade curve was an uncertain parameter which was simulated by the Monte Carlo method. To perform the optimization, we used a metaheuristic method called GA to manage optimization problems with thousands of scenarios. The proposed model was applied to a real underground gold mining and its performance was noticeably better than the deterministic version of the model. It demonstrates the advantage of considering probabilistic models that allow for dynamic policies rather than deterministic ones that generate static policies. Also, it reveals the advantage of considering probabilistic models with economic and operational parameters as variables increasing the profit of the project. Therefore, the use of probabilistic approaches with economic and operational variables improves the profit and provides better information for the stakeholders as administrators and investors.
The adopted approach is applicable to other mineral deposits without stockpiles, such as copper or silver, after making minor modifications.
We propose, as a future work, the incorporation of uncertainty in financial factors such as price metals, costs, discount rate, depreciation and inflation for obtaining more realistic cash flows. Another improvement of our work could be the analysis of the stockpiling with its costs and their impact on the CoG. Finally, following global needs, we recommend creating planning models that consider environmental and social costs, as well as mine closures, to develop sustainable and socially responsible plans.
Author Contributions
Conceptualization, D.A.T.M., G.F.S., E.d.l.B. and J.C.D.R.C.; Methodology, D.A.T.M. and J.C.D.R.C.; Software, D.A.T.M. and J.C.D.R.C.; Formal analysis, D.A.T.M. and G.F.S.; Investigation, D.A.T.M. and E.d.l.B.; Resources, D.A.T.M.; Data curation, D.A.T.M. and J.C.D.R.C.; Writing—original draft, E.d.l.B.; Writing—review & editing, E.d.l.B.; Supervision, G.F.S. and J.C.D.R.C.; Project administration, G.F.S.; Funding acquisition, G.F.S. All authors have read and agreed to the published version of the manuscript.
Funding
This work contributes to the Society’s focus areas, specifically addressing the “Social Innovation for Economic Development and Productive Inclusion” challenge under the productivity objective of the Colombia Científica program.
Data Availability Statement
The data is confidential and it could be available under request directed to the corresponding author.
Conflicts of Interest
Juan Camilo Del Río Cuervo was employed by Amazon Web Services (AWS) during this research. The other authors declare no commercial or financial relationships that could constitute a potential conflict of interest.
Correction Statement
This article has been republished with a minor correction to the Funding and Conflicts of Interest Statements. This change does not affect the scientific content of the article.
References
- Benning, I. Bankers’ Perspective of Mining Project Finance. J. South. Afr. Inst. Min. Metall. 2000, 100, 145–152. [Google Scholar] [CrossRef]
- Bedoya Londoño, J.A.; Franco Sepúlveda, G.; De la Barra Olivares, E. Strategic Minerals for Climate Change and the Energy Transition: The Mining Contribution of Colombia. Sustainability 2024, 16, 83. [Google Scholar] [CrossRef]
- Rendu, J.-M. An Introduction to Cut-off Grade Estimation, 2nd ed.; Society for Mining, Metallurgy, and Exploration: Englewood, CO, USA, 2014; ISBN 978-0-87335-393-9. [Google Scholar]
- Lane, K.F. Choosing the Optimum Cut-off Grade. Colo. Sch. Mines Q 1964, 59, 811–829. [Google Scholar]
- Ataei, M.; Osanloo, M. Determination of Optimum Cutoff Grades of Multiple Metal Deposits by Using the Golden Section Search Method. J. South. Afr. Inst. Min. Metall. 2003, 103, 493–499. [Google Scholar]
- Gu, X.; Wang, Q.; Chu, D.; Zhang, B. Dynamic Optimization of Cutoff Grade in Underground Metal Mining. J. Cent. South Univ. Technol. 2010, 17, 492–497. [Google Scholar] [CrossRef]
- Githiria, J.; Musingwini, C. A Stochastic Cut-off Grade Optimization Model to Incorporate Uncertainty for Improved Project Value. J. South. Afr. Inst. Min. Metall. 2019, 119, 217–228. [Google Scholar] [CrossRef]
- Sotoudeh, F.; Nehring, M.; Kizil, M.; Knights, P.; Mousavi, A. A Novel Cut-off Grade Method for Increasing the Sustainability of Underground Metalliferous Mining Operations. Miner. Eng. 2021, 172, 107168. [Google Scholar] [CrossRef]
- Bragin, V.I.; Kharitonova, M.Y.; Matsko, N.A. A probabilistic approach to the dynamic cut-off grade assessment. J. Min. Inst. 2021, 251, 617–625. [Google Scholar] [CrossRef]
- Abdollahisharif, J.; Bakhtavar, E.; Anemangely, M. Optimal Cut-off Grade Determination Based on Variable Capacities in Open-Pit Mining. J. South. Afr. Inst. Min. Metall. 2012, 112, 1065–1069. [Google Scholar]
- Sepúlveda, G.F.; Álvarez, P.J.; Bedoya, J.B. Stochastic Optimization in Mine Planning Scheduling. Comput. Oper. Res. 2020, 115, 104823. [Google Scholar] [CrossRef]
- Said, M.; El-Midany, A.A. Financial Risk Analysis with Uncertainties of Phosphate Ore Beneficiation. Min. Technol. 2022, 131, 115–127. [Google Scholar] [CrossRef]
- Dimitrakopoulos, R. Stochastic Optimization for Strategic Mine Planning: A Decade of Developments. J. Min. Sci. 2011, 47, 138–150. [Google Scholar] [CrossRef]
- Shapiro, A. On Complexity of Multistage Stochastic Programs. Oper. Res. Lett. 2006, 34, 1–8. [Google Scholar] [CrossRef]
- Dullaert, W.; Sevaux, M.; Sörensen, K.; Springael, J. Applications of Metaheuristics. Eur. J. Oper. Res. 2007, 179, 601–604. [Google Scholar] [CrossRef]
- Franco-Sepúlveda, G.; Del Rio-Cuervo, J.C.; Pachón-Hernández, M.A. State of the Art about Metaheuristics and Artificial Neural Networks Applied to Open Pit Mining. Resour. Policy 2019, 60, 125–133. [Google Scholar] [CrossRef]
- Ahmadi, M.R.; Shahabi, R.S. Cutoff grade optimization in open pit mines using genetic algorithm. Resour. Policy 2018, 55, 184–191. [Google Scholar] [CrossRef]
- Goodfellow, R.; Dimitrakopoulos, R. Algorithmic Integration of Geological Uncertainty in Pushback Designs for Complex Multiprocess Open Pit Mines. Min. Technol. 2013, 122, 67–77. [Google Scholar] [CrossRef]
- Mohammadi, S.; Ataei, M.; Khalokakaei, R.; Pourzamani, E. Comparison of Golden Section Search Method and Imperialist Competitive Algorithm for Optimization Cut-off Grade- Case Study: Mine No. 1 of Golgohar. J. Min. Environ. 2015, 6, 63–71. [Google Scholar] [CrossRef]
- Benallou, O.; Aboulaich, R. Improving Capital Budgeting Through Probabilistic Approaches. Rev. Pac. Basin Financ. Mark. Policies 2017, 20, 1750018. [Google Scholar] [CrossRef]
- Yang, X.-S.; Gandomi, A.H.; Talatahari, S.; Alavi, A.H. Metaheuristics in Water, Geotechnical and Transport Engineering; Newnes: Oxford, UK, 2012; ISBN 978-0-12-398296-4. [Google Scholar]
- Goldberg, D.E. Genetic Algorithms in Search, Optimization, and Machine Learning; Addison-Wesley: Boston, MA, USA, 1989; ISBN 978-0-201-15767-3. [Google Scholar]
- Cetin, E.; Dowd, P.A. Multiple Cut-off Grade Optimization by Genetic Algorithms and Comparison with Grid Search Method and Dynamic Programming. J. South. Afr. Inst. Min. Metall. 2016, 116, 681–688. [Google Scholar] [CrossRef]
- Hansen, D.R.; Mowen, M.M. Managerial Accounting; Thomson/South-Western: Mason, OH, USA, 2006; ISBN 978-0-324-37600-5. [Google Scholar]
- Iterations Versus Simulations Versus Trials-Palisade Knowledge Base. Available online: https://kb.palisade.com/index.php?pg=kb.page&id=27 (accessed on 3 February 2024).
Disclaimer/Publisher’s Note: The statements, opinions and data contained in all publications are solely those of the individual author(s) and contributor(s) and not of MDPI and/or the editor(s). MDPI and/or the editor(s) disclaim responsibility for any injury to people or property resulting from any ideas, methods, instructions or products referred to in the content. |
© 2024 by the authors. Licensee MDPI, Basel, Switzerland. This article is an open access article distributed under the terms and conditions of the Creative Commons Attribution (CC BY) license (https://creativecommons.org/licenses/by/4.0/).