Abstract
Moments of order statistics (OSs) characterize the Weibull–geometric and half-logistic families of distributions, of which the extended exponential–geometric (EEG) distribution is a particular case. The EEG distribution is used to create the log-extended exponential–geometric (LEEG) distribution, which is bounded in the unit interval (0, 1). In addition to the generalized Stirling numbers of the first kind, a few years ago, the polylogarithm function and the Lerch transcendent function were used to determine the moments of order statistics of the LEEG distributions. As an application based on the L-moments, we expand the features of the LEEG distribution in this work. In terms of the Gauss hypergeometric function, this work presents the precise equations and recurrence relations for the single moments of OSs from the LEEG distribution. Along with recurrence relations between the expectations of function of two OSs from the LEEG distribution, it also displays the truncated and conditional distribution of the OSs. Additionally, we use the L-moments to estimate the parameters of the LEEG distribution. We further fit the LEEG distribution on three practical data sets from medical and environmental sciences areas. It is seen that the estimated parameters through L-moments of the OSs give a superior fit. We finally determine the correspondence between the entropies and the OSs.
Keywords:
Gauss hypergeometric function; order statistics; moments; recurrence relations; entropy; numerical results MSC:
62E10; 62E15; 62F10; 62P10
1. Introduction
Over the last several years, many different and modified statistical models have been deployed to fit practical data sets from different domains. However, some types of these data may not be fitted by the classical distributions. Because of this, many authors have generalized such distributions or combined two or more classical distributions to add new parameters for data flexibility. Among these models is exponential distribution, which is a popular choice because of its flexibility. The exponential distribution has various applications, and, even in recent years, a large number of authors have contributed to its generalizations. A survey of the literature is provided below, which includes some well-known generalizations of the exponential distribution shown in Table 1.

Table 1.
A review on the generalization of the exponential distribution in chronological order.
The probability density function (pdf) of the LEEG distribution is defined by Jodrá and Jiménez-Gamero [12] as
the distribution function as
and the survival function is given as
Figure 1 represents the of the LEEG distribution for several values of the parameters. The power function and the uniform distributions are special cases, with and , respectively. As one may further note, for a negative value of , the pdf strictly increases over the entire range. For positive and higher values of , the pdf achieves its peak earlier (small values of x), where the peak is also seen to be substantially higher than in cases where is positive but small.
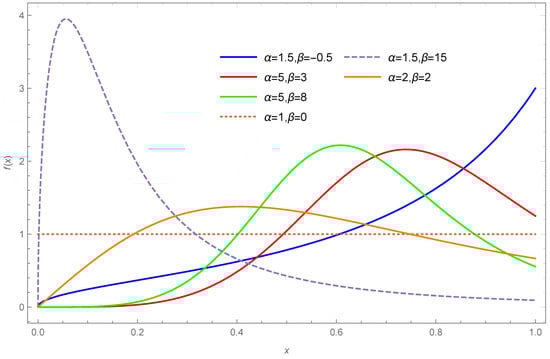
Figure 1.
Behavior of the LEEG distribution at different values of different parameters.
Thus, it can be noted that
Equation (4) is a characterizing equation, which is used for finding the recurrence relations of the LEEG distribution for the moments of the OSs.
This paper is summarized as follows. Section 2 presents some supporting lemmas, which are needed to establish the main results. In Section 3, we obtain some explicit expressions and recurrence relations of the OSs for the single moments of the LEEG distribution with numerical computations. Section 4 contains applications based on L-moments applied on different data sets, entropies and projective future data. Finally, Section 5 contains a few concluding remarks and future work.
2. Supporting Results
The following lemma is needed to calculate OSs’ moments from the LEEG distribution.
Lemma 1.
(See Gradshteyn and Ryzhik [13])
We have
for , where denote the Gauss hypergeometric function defined by
where denotes the ascending factorial.
The hypergeometric function [see Mathai and Saxena [14]] can be also written as
Following Mathai and Saxena [14], the series converges for , diverges for and, for , converges only for and .
At and , this is known as a Gauss hypergeometric series, which is defined above.
Lemma 2.
(See Jodrá and Jiménez-Gamero [8])
For any real numbers , and , we consider
Jodrá and Jiménez-Gamero [8] expressed the in a finite sum involving the Lerch transcendent function with the generalized Stirling numbers of the first kind and the polylogarithm function . Those expressions are
and
As a special case,
The Lerch transcendent function is defined as the analytic continuation of the series
which converges for any real number if z and λ are any complex numbers with either , or and .
The polylogarithm function of order λ and argument z is defined by the Dirichlet series
which is absolutely convergent for all complex λ and z inside the unit circle in the complex z-plane. It is clear that the Lerch transcendent function includes as a particular case the polylogarithm function, specifically, . For more details on the Lerch transcendent, the polylogarithm function and the generalized Stirling numbers of the first kind, see Erdélyi et al. [15], Apostol [16] and Pickard [17].
The moment properties derived in Section 3.1 involve Lemmas 1 and 2, which are an infinite series. In general, the problem of finding closed-form expressions for computing the moments of order statistics has attracted a great deal of attention in statistics. All these functions can be computed numerically, and computations are available in mathematical and statistical packages, such as MATHEMATICA 13.1 and R software R-4.4.0. Hence, the expressions derived in Section 3.1 are seen to be convenient.
3. Order Statistics
In the statistical sciences, OSs are highly helpful. They have a wide range of applications, including modeling, manufacturing, insurance, optimizing production processes, estimating parameters of distributions. OSs and their uses have been extensively discussed in the popular books by Arnold et al. [18] and David and Nagarajah [19].
When the magnitude of the random variables of size n from the LEEG distribution with and as in (1) and (2), respectively, are arranged in an increasing order as , they are called as the OSs from the LEEG distribution. The of , the order statistic, denoted by , for is given in [Arnold et al. [18] and David and Nagaraja [19]] as
where
Now, we shall denote,
the single moment of the order statistic from the LEEG distribution.
In statistical literature, the explicit expression and recurrence relations for the moments of order statistics are frequently utilized, such as statistical modelling, statistical inferences, decision procedures, nonparametric statistics, among others. Many authors have established the exact expressions and recurrence relations for several distributions. For example, see Khan et al. [20,21], Ali and Khan [22], Khan and Khan [23], Nadarajah [24], Genç [25], Nagaraja [26], MirMostafaee [27], Akhter et al. [28,29], Alam et al. [30], Singh et al. [31] and references therein.
3.1. Exact Moments of Order Statistics from of the LEEG Distribution
In this section, we obtain the results for the single moments of order statistics for the underlying distribution. The results are presented in the form of the following theorems.
Theorem 1.
For and , we have
where is as defined in (10) and is the Gauss hypergeometric function, defined in Lemma 1.
Proof.
Using (10), we have
Substituting , we find that
Using the binomial expression, we get
Since, using Lemma 1, the resulting expression can be viewed as (11). This proves the theorem. □
Theorem 2.
Proof.
Remark 1.
3.2. Recurrence Relations of the LEEG Distribution
In this section, we obtain the recurrence relations for the single moments of order statistics for the LEEG distribution. Recurrence relations are particularly helpful in minimizing the amount of direct computation, which lessens labor and time. They also offer a few easy ways to verify that the computation of moments of OSs is accurate. The results are presented in the form of the following theorems.
Theorem 3.
For and , we have
and consequently,
Proof.
Khan et al. [20] have shown that for ,
Now, by using the following well-known moment recurrence relation,
[see, e.g., David and Nagaraja [19]], we obtain (25). This completes the proof of the theorem.
Corollary 1.
For and ,
and
3.3. Truncated and Conditional Distribution of the OSs
We refer to the following identities pertaining to the LEEG distribution
This implies
or, equivalently,
Thus, the doubly truncated pdf of the LEEG distribution is given by
and the corresponding cdf is given by
where such that are the lower and upper truncation points. If we fix , the distribution will be truncated to the right. Similarly, if , the distribution will be truncated to the left. Finally, if and , we get the non-truncated distribution. The following remarks give a connection between the truncated distributions given above and the conditional distributions of the OSs pertaining to the LEEG distribution. All these are based on similar results derived in David and Nagaraja [19].
Remark 3.
Let be a random sample from the LEEG distribution with pdf and cdf as given in (1) and (2). Let denote the OSs obtained from this sample. Then, the conditional distribution of given for is the same as the distribution of the r-th order statistic obtained from a sample of size from a population whose distribution is truncated on the right at y.
Remark 4.
We consider a random sample from the LEEG distribution, such as , with pdf and df given in (1) and (2). Let denote the OSs obtained from this sample. Then, the conditional distribution of given for is the same as the distribution of the -th OSs obtained from a sample of size from a population whose distribution is truncated on the left at x.
Remark 5.
Let be a random sample from the LEEG distribution with pdf and df as given in (1) and (2). Let denote the order statistics obtained from this sample. Then, the conditional distribution of given and for is the same as the distribution of the -th order statistic obtained from a sample of size from a population whose distribution is truncated on the left at x and on the right at z.
One can find the proofs of the above remarks in Kumar [32].
3.4. Recurrence Relations between Expectations of Function of Two OSs from the LEEG Distribution
The df of the LEEG distribution can be written as
which can be seen in the form where and . Using the results of Ali and Khan [33], we can write the following theorems:
Theorem 4.
For , we get
where is a function defined as
and is a Borel measurable function from to . Further, , where are as defined in Section 3.3.
Theorem 5.
For ,
where is a function defined as
and is defined as previously.
The proofs of above theorems can be seen to be in line with Kumar [32].
3.5. Numerical Computations
Here, we have calculated means, second moments and variances of OSs (Table 2). All computations were obtained using Mathematica. Mathematica, like other algebraic manipulation packages, allows for arbitrary precisions, so the accuracy of the given values is not an issue. In the case of OSs, following identities are used to check the calculation of mean and variances (see David and Nagarajah [19]).
Table 2.
Means, second moments and variances of OSs.
For any fixed sample size n, the increase in r results in increase in moments. For any fixed r, an increase in sample size n leads to a decrease in variance, which is universally true.
4. Applications
In this section, we estimate the parameters of the LEEG distribution through L-moments of OSs. Furthermore, we fit the distribution to flood levels data, clinical trial data and the testosterone level data, which were already studied by several authors (cf. Asgharzadeha et al. [34], Makouei et al. [35]) and are commonly used in the OSs area. Compared to ordinary moments, L-moments exhibit less sample variance and are better adapted to outliers. Additionally, model specification probability distributions can be characterized using L-moments for parameter estimation and hypothesis testing. The L-moments are expectations of certain linear combinations of OSs (see Hosking [36]). The r-th L-moment of a distribution can be defined as OSs appearing in several areas of study and provide the suitable and appropriate solution for many problems, such as detection of outlier, robustness, quality control, reliability analysis, breaking strength analysis and so on.
4.1. L-Moments
Let be a random sample from the LEEG distribution given in (1) and denote the corresponding OSs. Hosking [36] defined L-moments as linear combinations of OSs. When there are outliers in the data, L-moments are more accurate than ordinary moments. The L-moments of a distribution are given by
where is defined in (11) for .
For in (29), the first and second L-moments are given as
According to Hosking [36], the first and second sample L-moments are calculated as
4.2. Examples
Flood levels data: The data represent the maximum flood levels (in millions of cubic feet per second) of the Susquehenna River at Harrisburg, Pennsylvania over 20 four-year periods (1890–1969) as follows: 0.654, 0.613, 0.315, 0.449, 0.297, 0.402, 0.379, 0.423, 0.379, 0.324, 0.269, 0.740, 0.418, 0.412, 0.494, 0.416, 0.338, 0.392, 0.484 and 0.265, assuming the data to be independent. From Table 3 and Table 4, one can see that the flood data are leptokurtic and fit the LEEG distribution.
Table 3.
Summaries of the data.
Table 4.
Estimates, KS statistic and their p-values for the data.
Clinical trials data: The data display the relief time (in hours) for 50 arthritic patients as follows: 0.70, 0.84, 0.58, 0.50, 0.55, 0.82, 0.59, 0.71, 0.72, 0.61, 0.62, 0.49, 0.54, 0.72, 0.36, 0.71, 0.35, 0.64, 0.85, 0.55, 0.59, 0.29, 0.75, 0.53, 0.46, 0.60, 0.60, 0.36, 0.52, 0.68, 0.80, 0.55, 0.84, 0.70, 0.34, 0.70, 0.49, 0.56, 0.71, 0.61, 0.57, 0.73, 0.75, 0.58, 0.44, 0.81, 0.80, 0.87, 0.29 and 0.50. The data summary and fitting to the LEEG distribution are provided in Table 3 and Table 4.
The testosterone level in infertile women data: The data show the testosterone level (g/dL) in 30 infertile women in Alzahra hospital in Tabriz, Iran, as follows: 0.33, 0.37, 0.51, 0.30, 0.45, 0.18, 0.67, 0.20, 0.33, 0.38, 0.35, 0.25, 0.33, 0.68, 0.32, 0.35, 0.35, 0.31, 0.38, 0.35, 0.19, 0.70, 0.50, 0.50, 0.73, 0.83, 0.77, 0.45, 0.50 and 0.90. Table 3 and Table 4 give the summary of the data and fit them to the LEEG distribution.
The conclusion that can be drawn from the p-values of the three data sets is that the LEEG can fit the data with acceptable estimations.
4.3. The Predictive Moments of OSs
The most significant use of estimation is the prediction of upcoming events. In the case of the prediction of future emergencies related to extreme events, it is of interest to have the largest observations of the OSs. For this purpose, we used the moments of some OSs for the earlier data sets using Equation (11) of the LEEG distribution, where the parameters of the LEEG distribution are replaced by their corresponding L-moments estimates for the earlier data set. Those OSs are given in Table 5, where the moments increase with increasing r.
Table 5.
The predictive moments of OSs.
4.4. Entropies
Entropy is a scientific concept as well as a measurable physical property that provides a measure of the average amount of information associated with a state of disorder, randomness or uncertainty. The classical entropy is the information that is mathematically calculated by C. E. Shannon and called the Shannon entropy. If X is a non-negative absolutely continuous random variable associated with the information, then the Shannon entropy is defined by [38] as
There are different types of entropies, each suitable for a specific situation. Recently, various authors have discussed different versions of entropies and their applications. For more details, the reader may see [39,40,41,42,43]. The cumulative residual entropy (CRE) of X given by Rao et al. [44] and the cumulative entropy (CE) of X given by Di Crescenzo and Longobardi [45] are one of the most important versions of entropy. These entropies are defined, respectively, as
4.4.1. Relationships between Entropies and OSs of the LEEG Distribution
Theorem 6.
Let X follow the LEEG distribution with a finite mean, noting . Then, the CRE of X is given by
and the CE of X is given by
where and .
Proof.
In view of [46], we have
and
□
Thus, the proof follows by applying Theorem 1 and for . This completes the proof of the theorem.
4.4.2. The Estimated Values of the CRE and the CE for the Considered Data Sets
In this section, we estimated the CRE and CE for the given data sets, using the formulas given in Theorem 6 that represent the relationship between the measures of entropy and OSs from the LEEG distribution. Since both the formulas contain summation over the summand index (n) up to infinity, we picked different values of n to outline different situations. The results are given in Table 6. One can note that both entropies’ estimated values grow as the summand index (n) increases. For all data sets, the estimated values of the CRE are bigger than the corresponding values of the CE.
Table 6.
The estimated values of the CRE and the CE for the data sets.
5. Conclusions and Future Work
The moments of OSs from the LEEG distribution were obtained by Jodrá and Jiménez-Gamero [12]. This current work presented an adaptable approach to find the exact moments of the OSs using a suitable Gauss hypergeometric function. Some recursive relations for single moments were also developed to simplify the computation of moments. Such computations were obtained and also verified as per the result of David and Nagaraja [19]. The LEEG distribution was also applied through the moments of OSs. The L-moments were used for estimating the parameters, which turned out to be more efficient in the case of outliers. The LEEG distribution was successfully fitted on some practical data sets from different fields. Moreover, we established the relation between the OSs, entropies and estimated the entropies.
As a few future research directions, these studies may be extended to generalized OSs, which contain OSs recording and progressive censoring of the LEEG distribution. One may also look at some other members of the Weibull–geometric or half-logistic families of distributions to obtain the moments of OSs similarly.
Author Contributions
Conceptualization, M.A., H.S.B. and S.R.B.; methodology, M.A., H.S.B. and S.R.B.; software, M.A.; formal analysis, M.A., H.S.B., S.R.B. and F.E.A.; writing—original draft preparation, F.E.A., M.A. and O.A.; writing—review and editing, M.A., S.R.B. and H.S.B.; project administration, F.E.A.; funding acquisition, F.E.A. and O.A. All authors have read and agreed to the published version of the manuscript.
Funding
This work was funded by the Deanship of Scientific Research, Vice Presidency for Graduate Studies and Scientific Research, King Faisal University, Saudi Arabia [Grant No. A222].
Data Availability Statement
The data presented in this study are available on request from the corresponding author.
Acknowledgments
This work was supported by the Deanship of Scientific Research, Vice Presidency for Graduate Studies and Scientific Research, King Faisal University, Saudi Arabia [Grant No. A222].
Conflicts of Interest
The authors declare no conflicts of interest.
References
- Adamidis, K.; Loukas, S. A lifetime distribution with decreasing failure rate. Statist. Probab. Lett. 1998, 39, 35–42. [Google Scholar] [CrossRef]
- Gupta, R.D.; Kundu, D. Generalized exponential distributions. Aust. N. Z. J. Stat. 1999, 41, 173–188. [Google Scholar] [CrossRef]
- Nadarajah, S. The exponentiated exponential distribution: A survey. AStA Adv. Stat. Anal. 2011, 95, 219–251. [Google Scholar] [CrossRef]
- Adamidis, K.; Dimitrakopoulou, T.; Loukas, S. On an extension of the exponential-geometric distribution. Stat. Probab. Lett. 2005, 73, 259–269. [Google Scholar] [CrossRef]
- Nadarajah, S.; Haghighi, F. An extension of the exponential distribution. Statistics 2011, 45, 543–558. [Google Scholar] [CrossRef]
- Louzada, F.; Roman, M.; Cancho, V.G. The complementary exponential-geometric distribution: Model, properties, and a comparison with its counterpart. Comput. Stat. Data Anal. 2011, 55, 2516–2524. [Google Scholar] [CrossRef]
- Lemonte, A.J. A new exponential-type distribution with constant, decreasing, increasing, upside-down bathtub and bathtub-shApplied Mathematics and Information Scienced failure rate function. Comput. Stat. Data Anal. 2013, 62, 149–170. [Google Scholar] [CrossRef]
- Jodrá, P.; Jiménez-Gamero, M.D. On a logarithmic integral and the moments of order statistics from the Weibull-geometric and half-logistic families of distributions. J. Math. Anal. Appl. 2014, 410, 882–890. [Google Scholar]
- Bakouch, H.S.; Chesneau, C.; Leao, J. A new lifetime model with a periodic hazard rate and an application. J. Stat. Comput. Simul. 2018, 88, 2048–2065. [Google Scholar] [CrossRef]
- Chesneau, C.; Bakouch, H.S.; Ramos, P.L.; Louzada, F. The polynomial-exponential distribution: A continuous probability model allowing for occurrence of zero values. J. Stat. Comput. Simul. 2022, 51, 4581–4606. [Google Scholar] [CrossRef]
- Bakouch, H.S.; Chesneau, C.; Enany, G.M. A new weighted exponential distribution as an alternative to the Weibull distribution and its fit to failure times data. Int. J. Data Sci. 2021, 6, 223–240. [Google Scholar] [CrossRef]
- Jodrá, P.; Jiménez-Gamero, M.D. A quantile regression model for bounded responses based on the exponential-geometric distribution. REVSTAT 2020, 18, 415–436. [Google Scholar]
- Gradshteyn, I.S.; Ryzhik, I.M. Tables of Integrals, Series and Products, 7th ed.; Jeffrey, A., Zwillinger, D., Eds.; Academic Press: Cambridge, MA, USA, 2007. [Google Scholar]
- Mathai, A.M.; Saxena, R.K. Generalized Hyper-Geometric Functions with Applications in Statistics and Physical Science; Lecture Notes in Mathematics. 348; Springer: Berlin, Germany, 1973. [Google Scholar]
- Erdelyi, A.; Magnus, W.; Oberhettinger, F.; Tricomi, F. Higher Transcendental Functions; McGraw-Hill: NewYork, NY, USA, 1995; Volume I. [Google Scholar]
- Apostol, T.M. Zeta and related functions. In NIST Handbook of Mathematical Functions; Olver, F.W.F., Lozier, D.W., Boisvert, R.F., Clark, C.W., Eds.; National Institute of Standards and Technology: Washington, DC, USA; Cambridge University Press: Cambridge, UK, 2010. [Google Scholar]
- Pickard, W.F. Tables of the generalized Stirling numbers of the first kind. J. Assoc. Comput. Mach. 1964, 11, 70–78. [Google Scholar] [CrossRef]
- Arnold, B.C.; Balakrishnan, N.; Nagaraja, H.N. A First Course in Order Statistics; SIAM Publishers: Philadelphia, PA, USA, 2008. [Google Scholar]
- David, H.A.; Nagaraja, H.N. Order Statistics, 3rd ed.; John Wiley: New York, NY, USA, 2003. [Google Scholar]
- Khan, A.H.; Yaqub, M.; Parvez, S. Recurrence relations between moments of order statistics. Nav. Res. Logist. Q. 1983, 30, 419–441, Corrections 1985, 32, 693. [Google Scholar] [CrossRef]
- Khan, A.H.; Parvez, S.; Yaqub, M. Recurrence relations between product moments of order statistics. J. Stat. Plan. Inference 1983, 8, 175–183. [Google Scholar] [CrossRef]
- Ali, M.M.; Khan, A.H. On order statistics from the log-logistic distribution. J. Stat. Plan. Inf. 1987, 17, 103–108. [Google Scholar]
- Khan, A.H.; Khan, I.A. Moments of order statistics from Burr distribution and its characterization. Metron 1987, XLV, 21–29. [Google Scholar]
- Nadarajah, S. Explicit expressions for moments of order statistics. Stat. Probab. Lett. 2008, 78, 196–205. [Google Scholar] [CrossRef]
- Genç, A.İ. Moments of order statistics of Topp-Leone distribution. Stat. Pap. 2012, 53, 117–131. [Google Scholar] [CrossRef]
- Nagaraja, H.N. Moments of order statistics and L-moments for the symmetric triangular distribution. Stat. Probab. Lett. 2013, 83, 2357–2363. [Google Scholar] [CrossRef]
- MirMostafaee, S.M.T.K. On the moments of order statistics coming from the Topp-Leone distribution. Stat. Probab. Lett. 2014, 95, 85–91. [Google Scholar] [CrossRef]
- Akhter, Z.; MirMostafaee, S.M.T.K.; Athar, H. On the moments of order statistics from the standard two-sided power distribution. J. Math. Model. 2019, 7, 381–398. [Google Scholar]
- Akhter, Z.; Saran, J.; Verma, K.; Pushkarna, N. On the moments of order statistics from the length-biased exponential distribution and associated inferences. Ann. Data Sci. 2020, 7, 1–26. [Google Scholar] [CrossRef]
- Alam, M.; Barakat, H.M.; Bakouch, H.S.; Chesneau, C. Order statistics and record values moments from the Topp-Leone Lomax distribution with applications to entropy. Wirel. Pers Commun. 2024, 135, 2209–2227. [Google Scholar] [CrossRef]
- Singh, B.; Alam, I.; Rather, A.A.; Alam, M. Linear combination of order statistics of exponentiated Nadarajah–Haghighi distribution and their applications. Lobachevskii J. Math. 2023, 44, 4839–4848. [Google Scholar] [CrossRef]
- Kumar, D. Moments of Order Statistics and its Applications. Master’s Thesis, Aligarh Muslim University, Aligarh, India, 2008. [Google Scholar]
- Ali, M.M. and Khan, A.H. Recurrence relations for expected values of certain functions of two order statistics. Metron 1998, LVI, 107–119. [Google Scholar]
- Asgharzadeha, A.; Abdib, M.; Nadarajah, S. Interval estimation for Gumbel distribution using climate records. Bull. Malays. Math. Sci. Soc. 2016, 39, 257–270. [Google Scholar] [CrossRef]
- Makouei, R.; Khamnei, H.J.; Salehi, M. Moments of order statistics and k-record values arising from the complementary beta distribution with application. J. Comput. Appl. Math. 2021, 390, 1133–1186. [Google Scholar] [CrossRef]
- Hosking, J.R.M. L-moments: Analysis and estimation of distributions using linear combinations of order statistics. J. Roy. Statist. Soc. B 1990, 52, 105–124. [Google Scholar] [CrossRef]
- R Core Team. R: A Language and Environment for Statistical Computing; R Foundation for Statistical Computing: Vienna, Austria, 2016; Available online: http://www.R-project.org/ (accessed on 3 May 2024).
- Shannon, C.E. A mathematical theory of communication. Bell. Syst. Tech. J. 1948, 27, 379–423. [Google Scholar] [CrossRef]
- Calì, C.; Longobardi, M.; Ahmadi, J. Some properties of cumulative Tsallis entropy. Phys. A 2017, 486, 1012–1021. [Google Scholar]
- Calì, C.; Longobardi, M.; Navarro, J. Properties for generalized cumulative past measures of information. Probab. Eng. Inform. Sci. 2020, 34, 92–111. [Google Scholar]
- Calì, C.; Longobardi, M.; Psarrakos, G. A family of weighted distributions based on the mean inactivity time and cumulative past entropies. Ric. Mat. 2019, in press. [Google Scholar]
- Longobardi, M. Cumulative measures of information and stochastic orders. Ric. Mat. 2014, 63, 209–223. [Google Scholar] [CrossRef]
- Mohamed, M.S.; Barakat, H.M.; Alyami, S.A.; Abd Elgawad, M.A. Fractional entropy-based test of uniformity with power comparisons. J. Math. 2021, 2021, 5331260. [Google Scholar] [CrossRef]
- Rao, M.; Chen, Y.; Vemuri, B.; Wang, F. Cumulative residual entropy: A new measure of information. IEEE Trans. Inf. Theory 2004, 50, 1220–1228. [Google Scholar] [CrossRef]
- Di Crescenzo, A.; Longobardi, M. On cumulative entropies. J. Stat. Plann Inference 2009, 139, 4072–4087. [Google Scholar] [CrossRef]
- Balakrishnan, N.; Buono, F.; Longobardi, M. On cumulative entropies in terms of moments of order statistics. Methodol. Comput. Appl. Probab 2022, 24, 345–359. [Google Scholar] [CrossRef]
Disclaimer/Publisher’s Note: The statements, opinions and data contained in all publications are solely those of the individual author(s) and contributor(s) and not of MDPI and/or the editor(s). MDPI and/or the editor(s) disclaim responsibility for any injury to people or property resulting from any ideas, methods, instructions or products referred to in the content. |
© 2024 by the authors. Licensee MDPI, Basel, Switzerland. This article is an open access article distributed under the terms and conditions of the Creative Commons Attribution (CC BY) license (https://creativecommons.org/licenses/by/4.0/).