Article

EHFP-GAN: Edge-Enhanced Hierarchical Feature Pyramid Network for Damaged QR Code Reconstruction

1
College of Information Science and Technology, Zhongkai University of Agriculture and Engineering, Guangzhou 510225, China
2
Guangzhou Key Laboratory of Agricultural Products Quality & Safety Traceability Information Technology, Zhongkai University of Agriculture and Engineering, Guangzhou 510225, China
*
Author to whom correspondence should be addressed.
Mathematics 2023, 11(20), 4349; https://doi.org/10.3390/math11204349
Submission received: 13 September 2023 / Revised: 16 October 2023 / Accepted: 18 October 2023 / Published: 19 October 2023

Abstract

:
In practical usage, QR codes often become difficult to recognize due to damage. Traditional restoration methods exhibit a limited effectiveness for severely damaged or densely encoded QR codes, are time-consuming, and have limitations in addressing extensive information loss. To tackle these challenges, we propose a two-stage restoration model named the EHFP-GAN, comprising an edge restoration module and a QR code reconstruction module. The edge restoration module guides subsequent restoration by repairing the edge images, resulting in finer edge details. The hierarchical feature pyramid within the QR code reconstruction module enhances the model’s global image perception. Using our custom dataset, we compare the EHFP-GAN against several mainstream image processing models. The results demonstrate the exceptional restoration performance of the EHFP-GAN model. Specifically, across various levels of contamination, the EHFP-GAN achieves significant improvements in the recognition rate and image quality metrics, surpassing the comparative models. For instance, under mild contamination, the EHFP-GAN achieves a recognition rate of 95.35%, while under a random contamination, it reaches 31.94%, both outperforming the comparative models. In conclusion, the EHFP-GAN model demonstrates remarkable efficacy in the restoration of damaged QR codes.

1. Introduction

In recent years, QR codes have found widespread applications globally, especially in areas such as mobile payments, logistics tracking, identity verification, and access control [1,2,3,4,5]. Take traceable QR codes as an example; they assist users in tracking critical information such as the product origin, production date, and manufacturer, ensuring product quality and safety [2,3,6]. However, in practical usage, QR codes can become damaged due to various reasons such as daily wear and tear, liquid splashes, or other accidental factors, leading to their failure to be recognized, thereby affecting the product traceability and security [7,8,9,10].
The objective of repairing damaged QR codes is to restore their missing areas and enable proper recognition [11]. From this standpoint, the restoration of damaged QR codes can be considered a specific application within the domain of image restoration. With their excellent image generation capabilities, Generative Adversarial Networks (GANs) have achieved considerable research success [9,10,12,13,14,15,16,17]. However, the integration of restoring damaged QR codes with GAN methods commonly used in the field of image restoration is relatively scarce. Therefore, from this perspective, our research aims to explore the feasibility of applying GANs to the task of repairing damaged QR codes and propose a novel solution. As previously mentioned, the restoration of damaged QR codes is essentially a special case of image restoration. However, due to the specific characteristics of QR code images, we encounter unique challenges when employing GANs for restoration.
Challenge 1: Information recovery takes priority over image quality for QR code restoration. The core of QR code image restoration is to recover the information contained so that it can be read again. Compared to general image restoration that focuses on visual effect, QR code restoration needs to first consider the recognizability rate after restoration. This requires that the recognition rate metric is more important than image quality when evaluating the restoration models. The availability of information is an additional constraint unique to QR code image restoration tasks.
Challenge 2: The lack of local textures makes relying on the local context difficult for QR code restoration. QR code images inherently have fewer texture details, which makes local restoration difficult. Models need to rely more on non-local contextual information for structurally reasonable inference [15]. Different from image inpainting that only cares about visual effects, QR code image restoration needs to prioritize ensuring the recognizability of information, paying more attention to restoring the global structure rather than reconstructing the local texture details.
To address the aforementioned unique challenges faced by QR code image restoration, we propose a novel deep learning model named the Edge-enhanced Hierarchical Feature Pyramid GAN (EHFP-GAN). The model comprises two sub-modules: the Edge Restoration Module and the QR Code Reconstruction Module. The Edge Restoration Module repairs the edge image generated by the Canny edge detection [18], and its restoration results are fed alongside the original image into the QR Code Reconstruction Module, enhancing the quality of the edge restoration. Within the QR Code Reconstruction Module, we introduce the Hierarchical Feature Pyramid (HFP) Block that leverages multi-scale feature fusion to expand the receptive field, enhancing the global information modeling capability, thus improving the restoration results. Additionally, we design a discriminator for adversarial training and introduce a recognition rate loss to optimize the information recovery.
The main contributions of this paper can be summarized as follows:
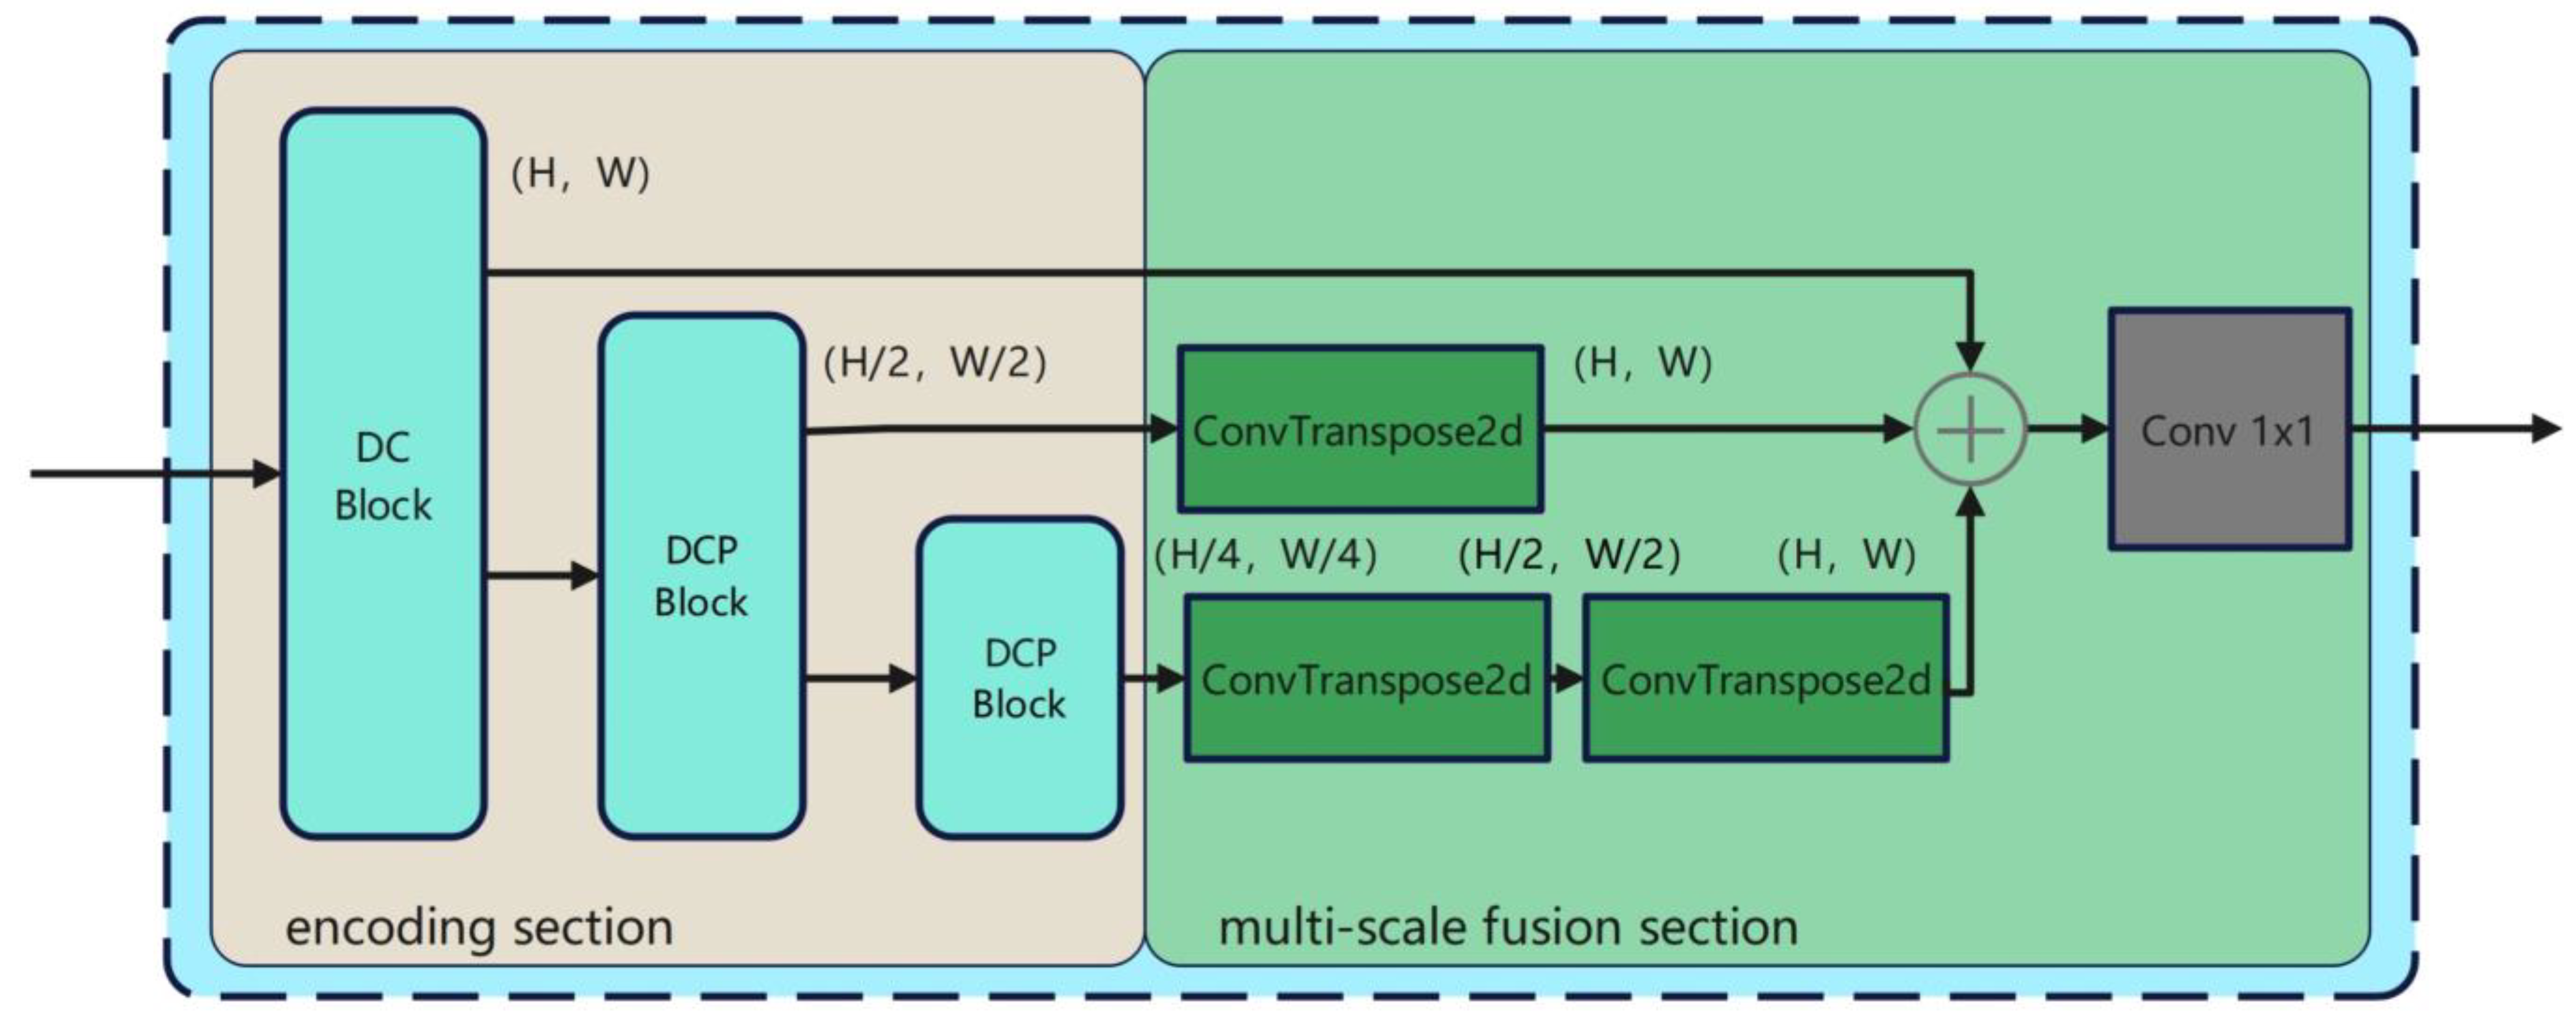
  • We propose a multi-scale feature fusion module named the Hierarchical Feature Pyra-mid (HFP) Block, which seamlessly integrates into the network and enhances the model’s perception of global contextual information.
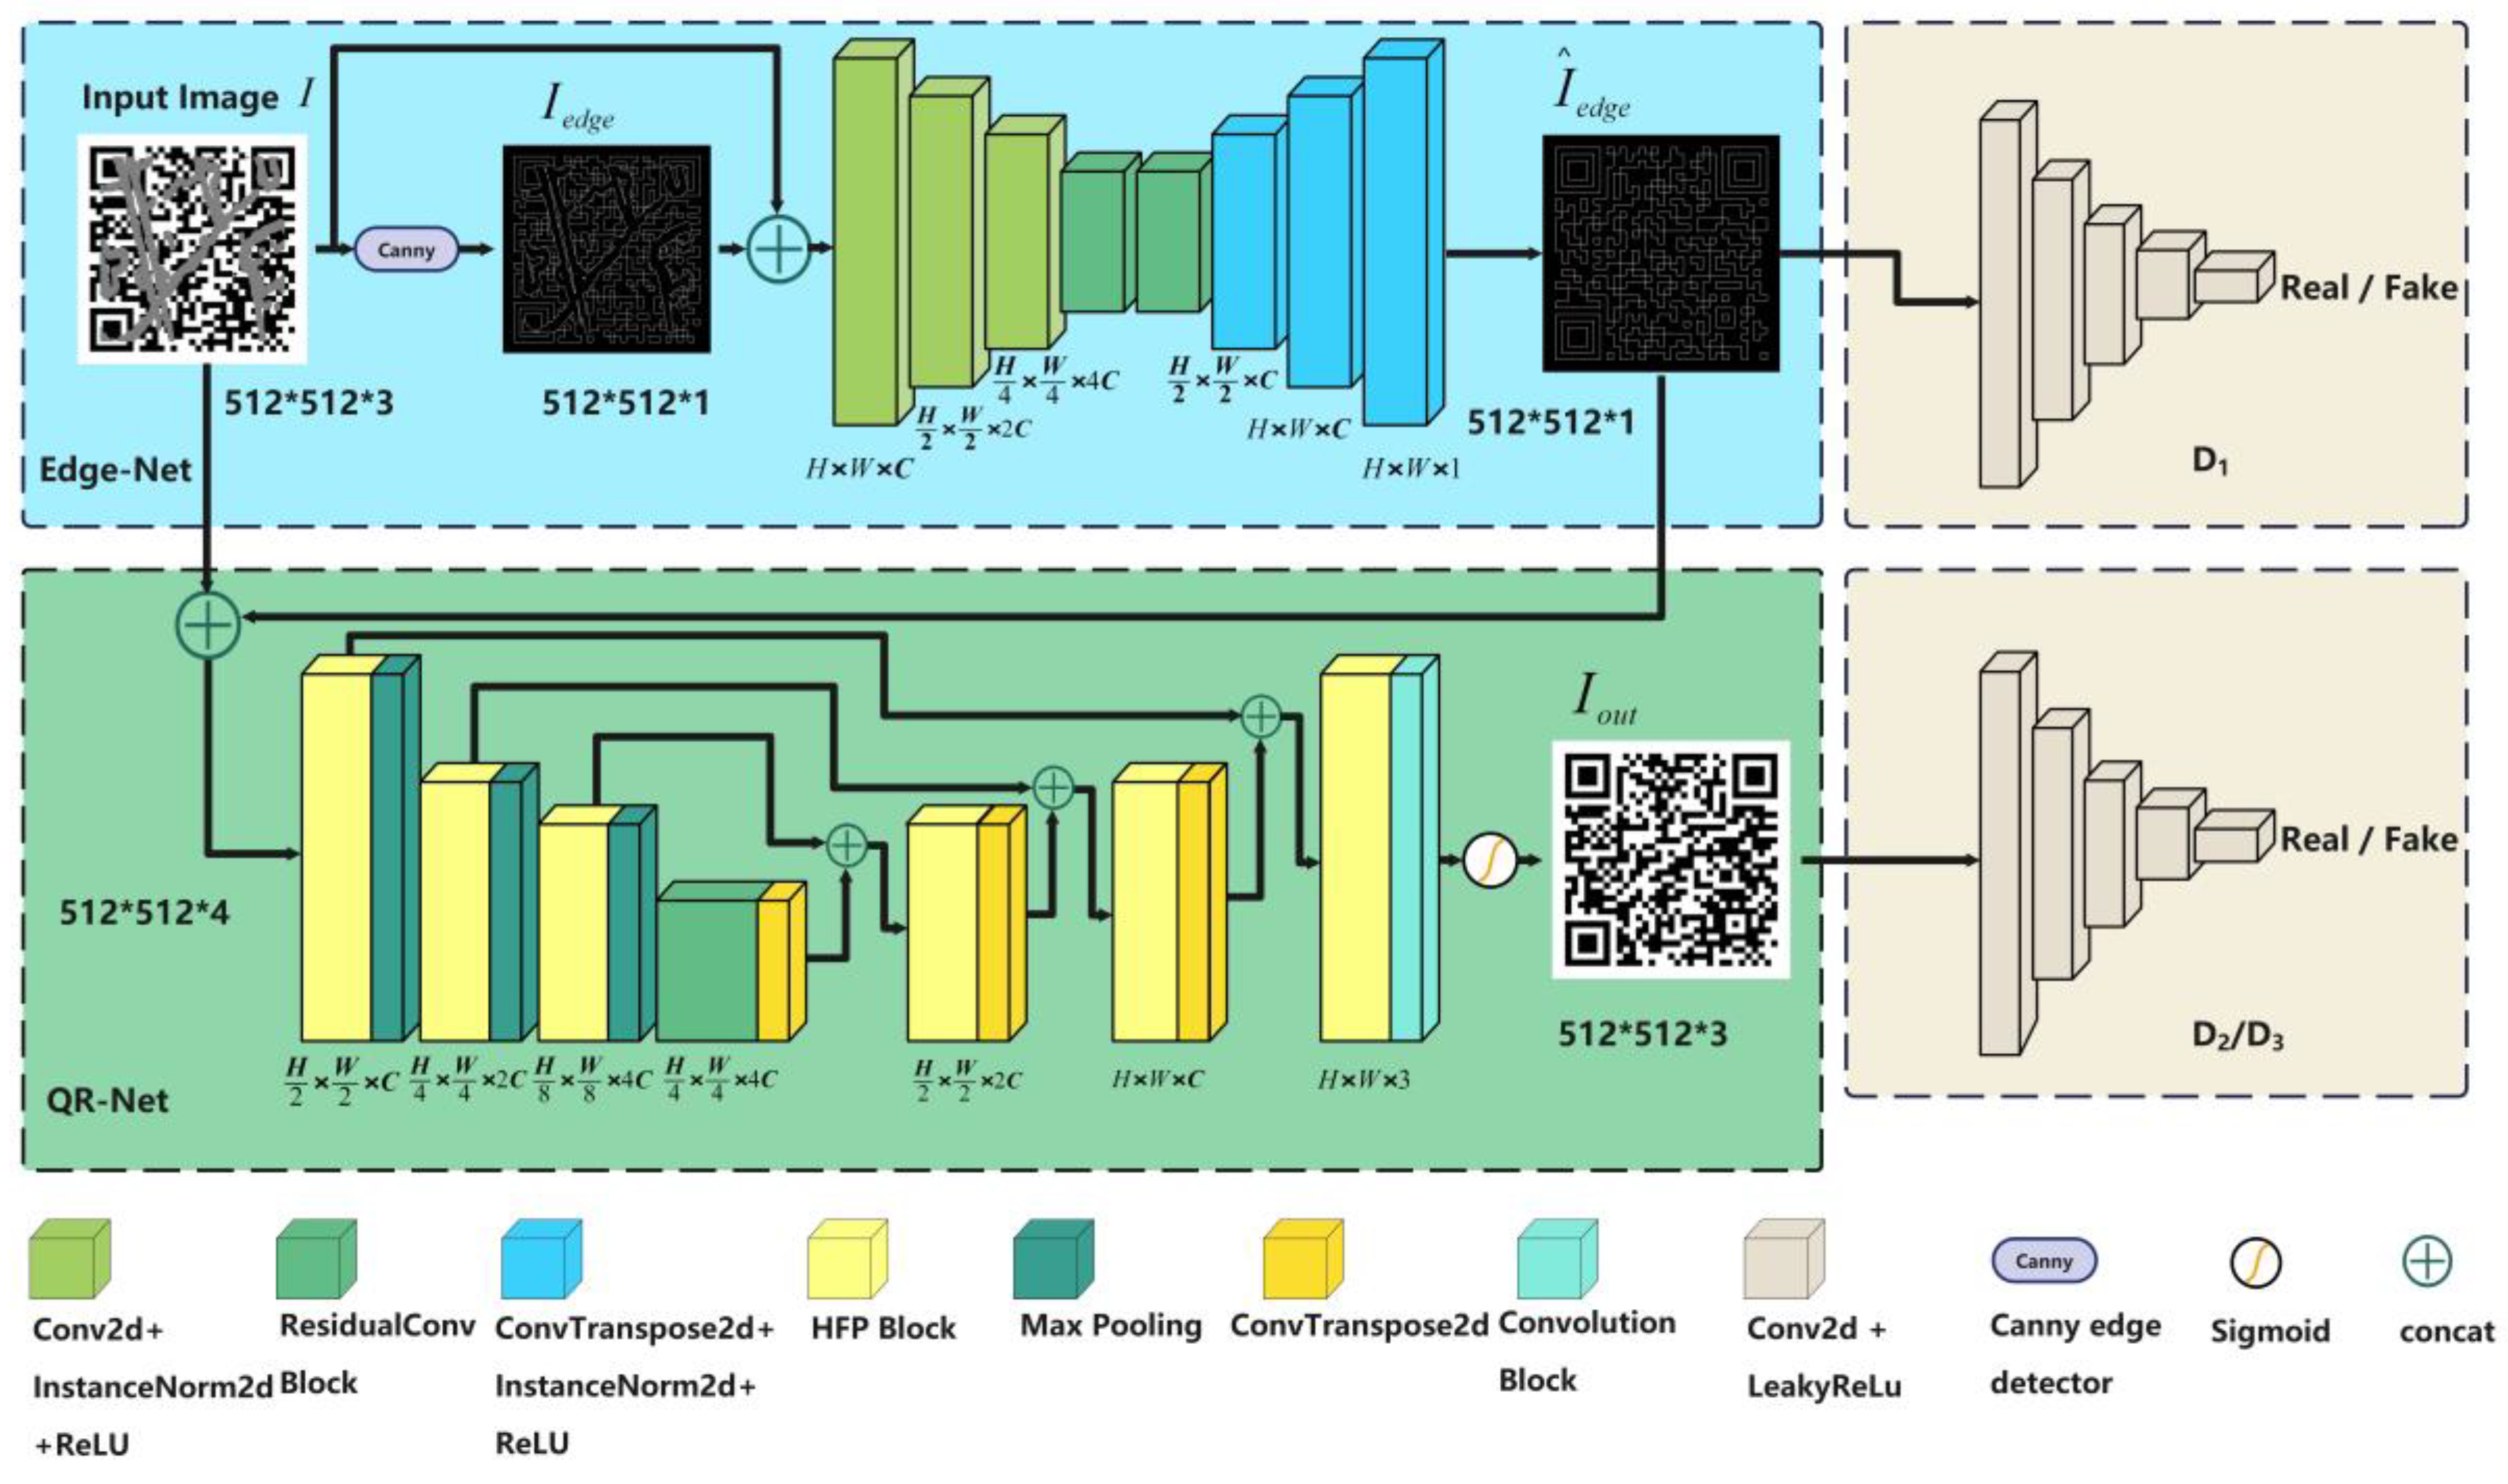
  • We design and implement an edge-enhanced hierarchical feature pyramid GAN, named EHFP-GAN, built upon the foundation of the HFP Block. The EHFP-GAN focuses on restoring and reconstructing damaged QR code images.
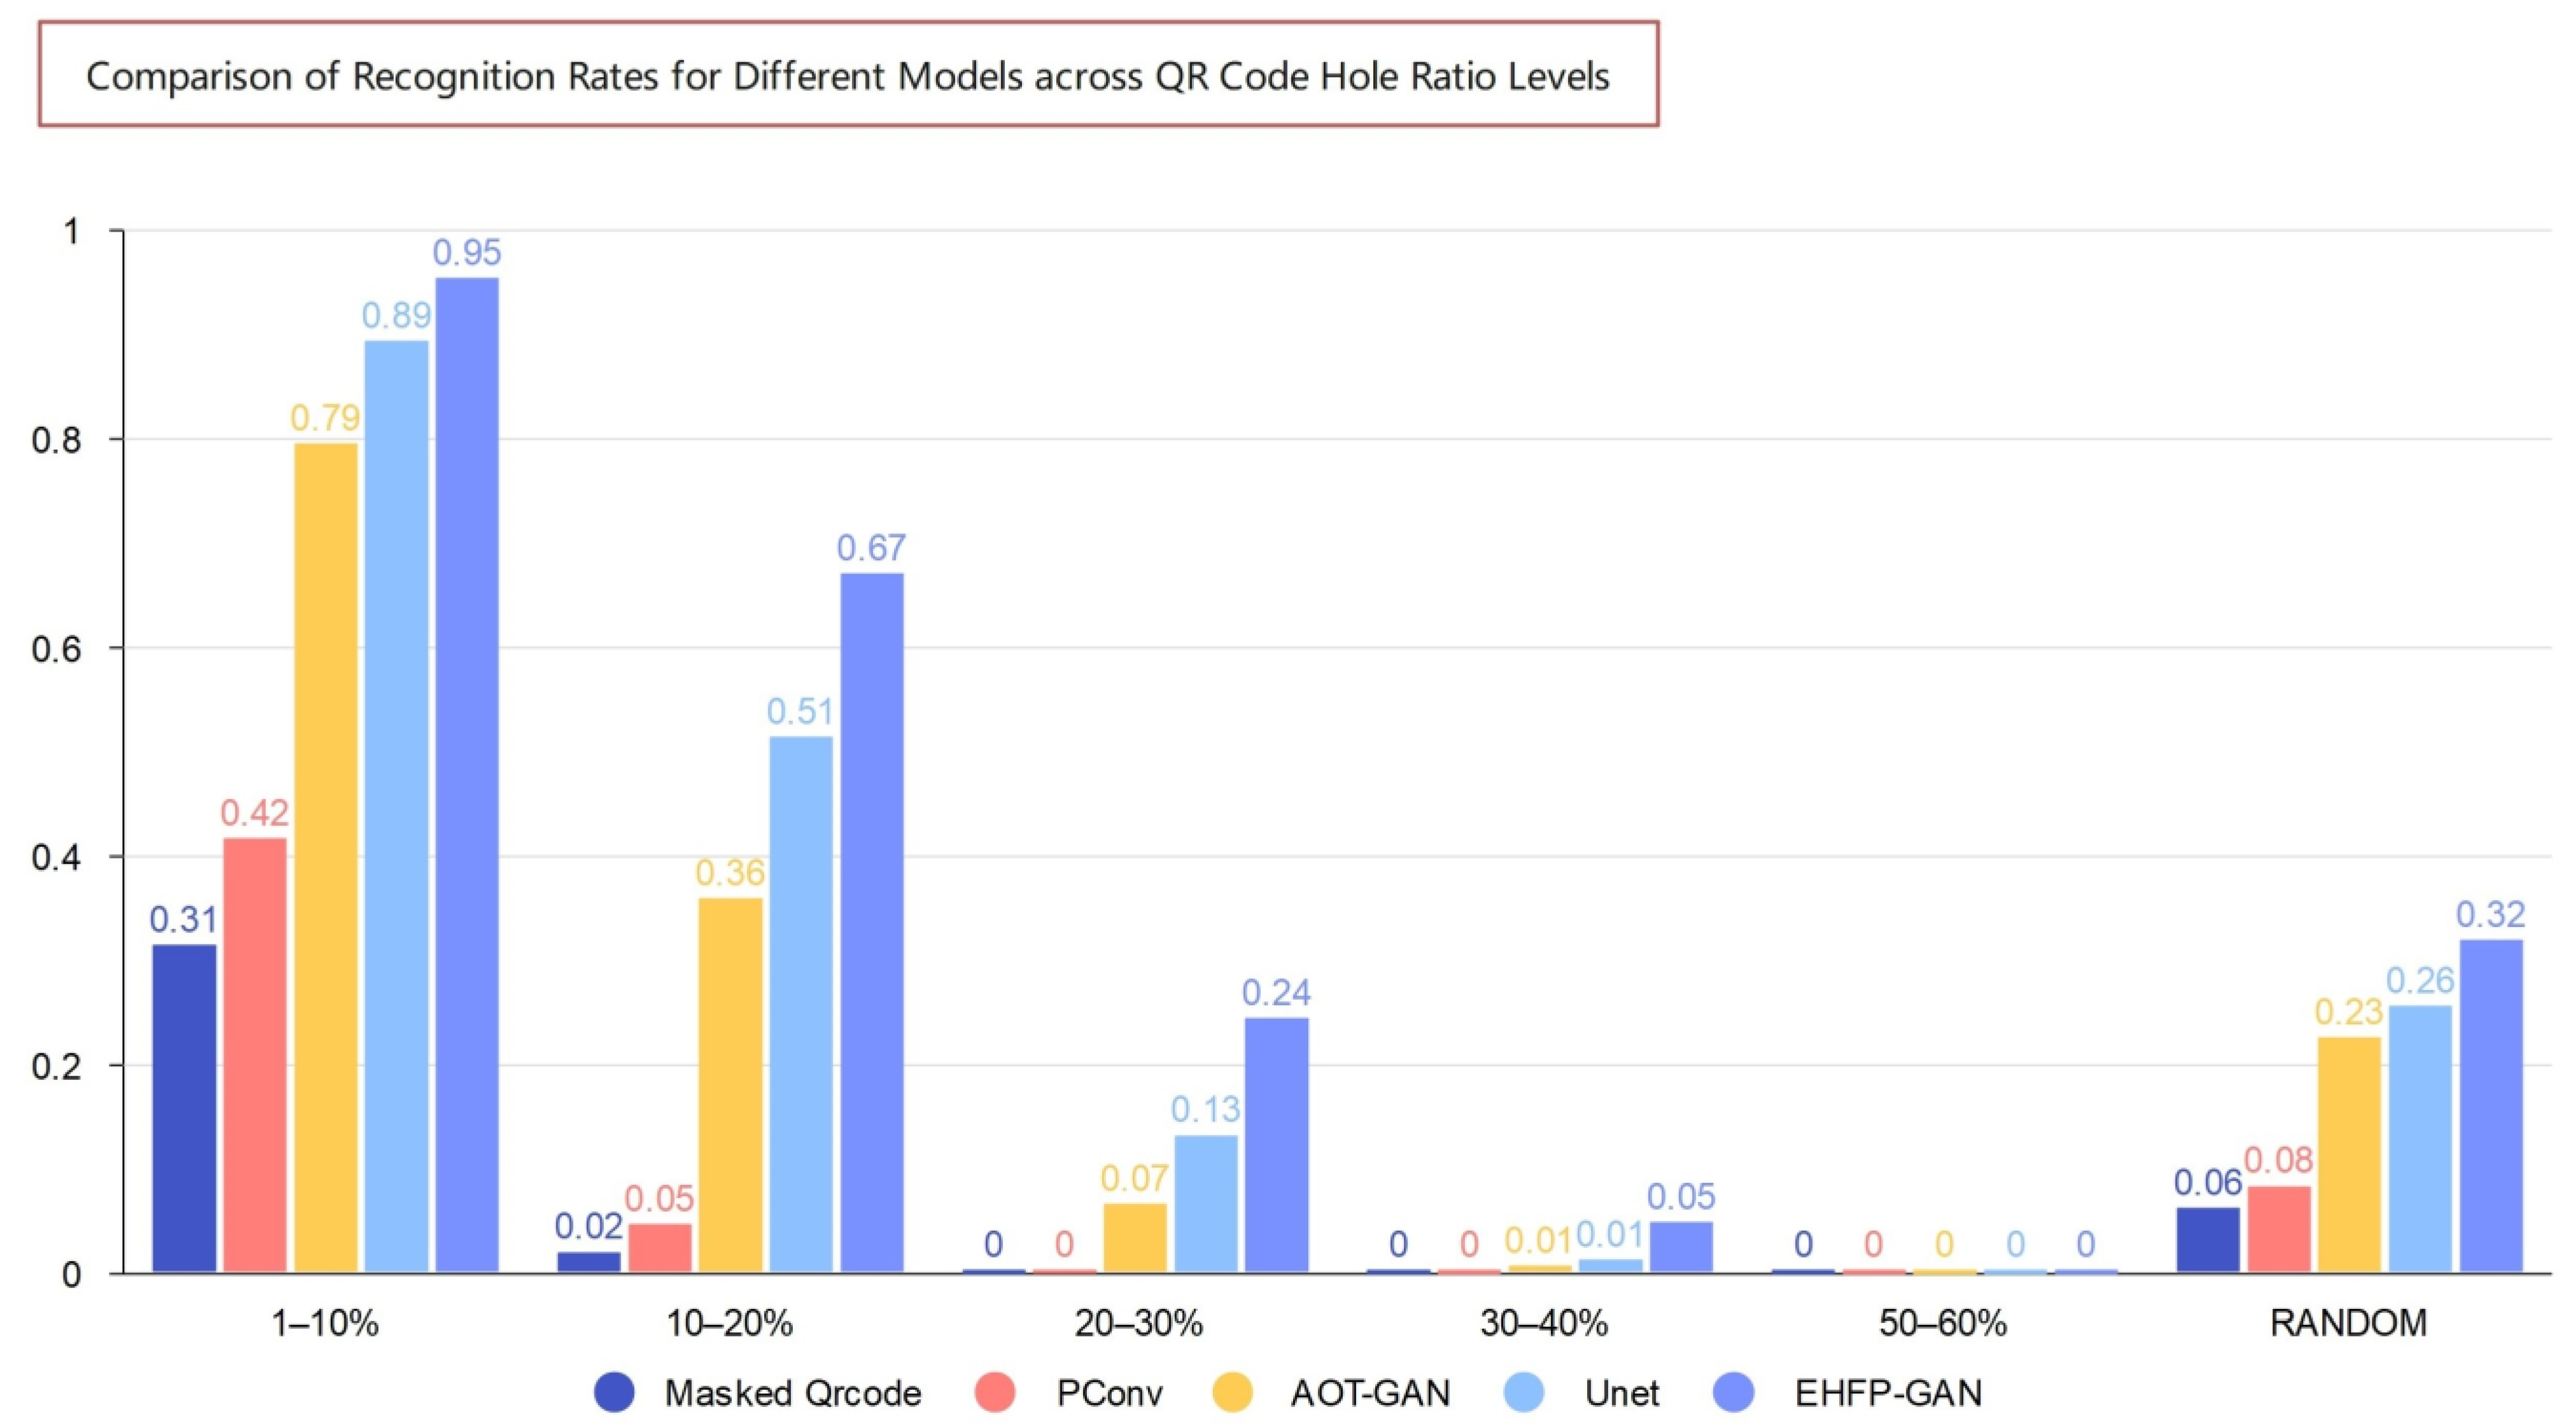
  • We demonstrate through comparative experiments with other advanced methods that the EHFP-GAN model achieves state-of-the-art improvements in QR code image quality, with a particularly notable enhancement in QR code recognizability.
The structure of this paper is organized as follows: In Section 2, we review the related work in the field. Section 3 introduces our proposed QR code restoration method. Section 4 details the experimental setup and presents our analysis of the results. Section 5 delves into the practical applications and challenges inherent in this research. Finally, in Section 6, we conclude our study and outline future research directions.

2. Related Work

Since the inception of QR codes, ensuring their reliable scanning and decoding in various environments has been a focus of research [1,4,5,7,8,9,10,19,20,21,22]. Concurrently, image inpainting techniques have played a significant role in image processing tasks such as photo restoration and object removal [11,15,16,17,21,23,24,25,26]. Therefore, existing image inpainting methods provide valuable references for investigating QR code restoration. In this chapter, we review the advancements in QR code and image inpainting research to establish the theoretical foundation for subsequent chapters.

2.1. QR Code-Related Work

Since the emergence of QR codes, ensuring their reliable scanning and decoding in different environments has been a research hotspot. Relevant studies have mainly aimed at improving the reliability of QR codes from the perspectives of error correction codes, denoising techniques, and image enhancement. In terms of error correction codes, QR codes primarily utilize Reed–Solomon error correction techniques to rectify reading errors, enhancing the data reliability and readability [27]. However, in cases of actual damage, the performance of this technique is not ideal. Due to potential interferences such as stains, blurriness, rotation, and scaling, researchers have developed a range of anti-interference techniques, including filtering, denoising, rotation correction, and scale normalization, to reduce the impact of interference on QR code recognition. In terms of denoising techniques, Tomoyoshi Shimobaba et al. (2018) proposed a holographic image restoration algorithm using autoencoders. Through numerical diffraction calculations or holographic optical reconstruction, they obtained reconstructed images and utilized autoencoders to remove image noise pollution, thus restoring clearer holographic images of QR codes [28]. Furthermore, researchers have employed the Cahn–Hilliard equation to address QR code image restoration, particularly in restoring low-order sets (edges, corners) and enhancing edges [21]. When dealing with severely damaged QR codes, the effectiveness of traditional image processing techniques is relatively limited. As a result, in recent years, researchers have shifted their focus towards deep learning technology. For blurred QR images, researchers have begun exploring from the perspective of deep learning. For instance, Michael John Fanous et al. proposed GANscan, a high-speed imaging method based on generative adversarial networks, which is employed to capture QR codes on rapidly moving scanning devices. This method primarily utilizes GANs to process motion-blurred QR video frames into clear images [12]. The above studies extended QR technology to adapt to various environments from different perspectives. However, these methods mainly addressed QR code blurriness and noise issues, with limited research on addressing damaged QR codes.

2.2. Image Inpainting Work

Image inpainting refers to the task of reconstructing lost or corrupted parts of images based on the surrounding available pixels. Its core idea is to utilize spatial continuity and texture similarity in natural images to synthesize plausible content for missing regions. Early methods relied on traditional signal processing techniques for image completion, extending based on the inherent image similarity and structure, yielding limited effects. For example, pixel-by-pixel and block-by-block filling, both of which start from the boundaries of the image’s damaged areas, gradually fill unknown regions in images using known information from the surrounding or similar areas in the image based on calculated priorities, aiming to synthesize visually continuous images [25,26]. However, this method is only suitable for small area restoration, and it presents issues of blurriness and unnatural textures in repairing complex backgrounds and large missing areas. In recent years [29], deep learning has seen rapid development, particularly excelling in image inpainting tasks, enabling the learning of intrinsic priors in images and yielding more realistic completion results. For example, the Context Encoders model utilizes end-to-end convolutional neural networks for image completion, representing one of the earliest successful applications of deep learning to this task. Its core innovation lies in the introduction of the encoder–decoder structure of generative models, which can directly process images with holes [30]. Given the development of deep learning in image inpainting tasks in recent years, more people have focused on its applied research, such as object removal and photo restoration. For example, Wan et al. proposed a method using deep learning to restore severely degraded old photos. The method involves training two VAEs to transform old photos and clean photos into latent spaces and learning transformations between the two latent spaces on synthesized image pairs, and then designing global and local branches to handle structural and non-structural defects in old photos, respectively. The two branches are fused in the latent space to enhance the recovery from composite defects [14]. This provides new perspectives for researching QR code restoration. However, unlike ordinary image restoration tasks such as object removal and photo restoration, QR images contain semantic information, requiring a delicate balance between the visual effect and readability. How to employ the image inpainting techniques for high-quality QR code restoration still offers many unexplored possibilities.
In summary, effective restoration techniques for damaged QR codes are not only significant in the field of QR codes but also represent a new extension of image restoration issues. This study is conducted based on this background, aiming to explore efficient QR code restoration methods. The subsequent chapters will detail our technical approach and innovative work.

3. Methods

Inspired by the EdgeConnect model [16], we propose an end-to-end generative adversarial network named EHFP-GAN for reconstructing severely damaged QR code images. As illustrated in Figure 1, this model consists of multiple modules, including the core modules Edge-Net and QR-Net, along with their corresponding edge reconstruction discriminator D1, QR code reconstruction discriminator D2, and global result discriminator D3. These three discriminators share a unified network architecture. The Edge-Net module predicts the edge map of the QR code using an encoder–decoder architecture. Based on the predicted edge map, the QR-Net module utilizes a convolutional network to reconstruct the complete QR code image. Additionally, the discriminator modules facilitate adversarial training, and the loss function integrates multiple constraints such as adversarial loss, structural similarity, and mean squared error. By connecting the Edge-Net and QR-Net modules in series, along with the discriminators and loss functions, the proposed EHFP-GAN model achieves end-to-end QR code image reconstruction.

3.1. Edge Reconstruction Module

The edge reconstruction module employs an encoder–decoder structure [30]. The encoder consists of 3 downsampling convolutional blocks, utilizing Instance Normalization and ReLU for normalization and nonlinear activation. The input channel count of the first convolutional block is 4, progressively increasing to 128 and 256 channels for feature extraction. The decoder conducts stepwise upsampling to restore the resolution. The encoder and decoder exchange information through a bottleneck connection composed of residual networks [31], where the feature maps output by the encoder are passed to different levels of the decoder after undergoing upsampling and channel reduction. This architecture transfers both semantic information and detailed content. The final convolutional layer maps the channel count to 1, and after being processed by the sigmoid activation function, it outputs the predicted edge map.
The objective of the edge reconstruction module is to predict and generate the repaired edge map based on the prior knowledge of the Canny edge map of the original QR code image. We first detect the edge information E of the damaged QR code original image I using the Canny edge detection, and then, we concatenate E and I along the channel dimension to form the input feature map X e g d e of the module
X e d g e = E I
where I provides the image content, while E provides crucial prior knowledge about the edge structure. Based on the input X e g d e , we construct a network with an encoder–decoder structure to predict the target edge map. The forward operation of the network can be expressed as
E ^ = E d g e - Net X e g d e
Here, E ^ represents the edge map predicted by the network. Through end-to-end training, the model learns to reconstruct fine edge details from the input X e g d e as guidance for the subsequent QR code reconstruction module. We employ stepwise downsampling and upsampling to extract and restore edge semantic information. Residual connections assist in optimizing network training. This design ensures that the predicted edge map E ^ maintains sufficient structural coherence.

3.2. QR Code Reconstruction Module

We have designed a multi-scale feature fusion module [32,33] known as the Hierarchical Feature Pyramid (HFP) Block to enhance the model’s contextual reasoning capability. The HFP Block has the ability to capture information from various semantic levels, offering a broader perspective even in the presence of extensive damage, thus enhancing the structural coherence.
The design of the HFP, as depicted in Figure 2, primarily consists of (1) an encoding section that progressively acquires feature maps at different scales using convolution and pooling; (2) a multi-scale fusion section that performs upsampling and channel fusion on the encoded features, resulting in a fused pyramid-style feature representation. In the context of fusing multi-scale encoded features, we utilize learnable upsampling layers rather than fixed interpolation methods like bilinear upsampling. This design choice stems from the need to recover fine details lost during downsampling in the encoding process. Fixed interpolation often cannot restore such high-frequency information, resulting in blurring. By contrast, learnable upsampling allows the network to learn optimized upscaling filters, thus helping to reconstruct critical details and mitigate information loss. This capability is crucial for the HFP Block to focus on restoring damaged portions in QR codes.
We express the computational process of the HFP Block using the following formula:
H F P X = C o n v 1 × 1 X 2 4 x X 1 2 x C o n v X
where X represents the input feature map of the HFP Block, X 1 and X 2 are the downsampled feature maps generated by the encoder at different layers, denotes channel concatenation, and ↑ indicates upsampling. Through upsampling and concatenation, the HFP Block combines multi-scale features.
The feature map processed by the HFP Block retains rich contextual information. We use HFP in place of conventional convolutional layers in the QR code reconstruction module, constructing an encoder–decoder structure as shown in Figure 1. This design enhances the model’s ability to capture both local and global information. The QR code reconstruction module can be represented as a whole:
I o u t = Q R - Net ( E ^ I )
Q R - Net ( x ) = D e c ( E n c ( x ) )
where Enc and Dec represent the encoder and decoder, respectively, and the input image I along with the predicted edge E ^ serve as the input for the Q R - Net module of the QR code reconstruction module. The encoder Enc is composed of a series of cascaded HFP Blocks, with the first-level HFP Block directly taking the original input x as its input.
Enc 1 x = H F P x
In the subsequent levels, each HFP Block takes the output of the previous level HFP Block as its input:
Enc n x = H F P Enc n 1 x
Similarly, the decoder Dec is also composed of multiple levels of concatenated HFP Blocks. In the first-level HFP Block, the input consists of the upsampled original input x concatenated with the encoded feature e n from the nth layer of the encoder:
D e c 1 x = H F P x e n
Each subsequent HFP module concatenates the output of the previous HFP module with the corresponding encoder features and uses it as the input:
D e c n x = H F P D e c n 1 x e n 1
Through the design of the HFP Block, the QR code reconstruction network enhances its ability to model information from different semantic levels. It overcomes the challenge of the QR code images lacking sufficient texture details, and even in the presence of extensive damage, it can provide a broader perspective, leading to the generation of more coherent and natural reconstruction results. The encoder–decoder architecture we employ also facilitates the better fusion of local and global information. In the subsequent experiments, we will observe that compared to other methods, this QR code reconstruction module can achieve a qualitative improvement, especially performing better in cases of severe damage. Ultimately, our EHFP-GAN model, through the combined utilization of the edge reconstruction module and the QR code reconstruction module, establishes an effective end-to-end learning framework to achieve image restoration of severely damaged QR codes.

3.3. Discriminators

To address the discrimination between generated images and real images, we designed a convolutional neural network-based discriminator to differentiate between real QR code images and generated QR code images. As depicted in Figure 1, the discriminator consists of 5 convolutional blocks that progressively extract feature representations from the input images using Leaky ReLU activation functions and downsampling operations. The first convolutional block utilizes 4 × 4 convolution kernels with 64 channels and a stride of 2 for downsampling. The subsequent two blocks further increase the number of channels to enhance feature expression. The fourth block maintains the resolution without downsampling to refine features. Finally, a 1 × 1 convolution kernel reduces the channel count to 1, resulting in a binary classification output. Except for the first convolutional layer, spectral normalization is applied to the remaining convolutional layers to enhance the network stability. The optimization of the discriminator is conducted within the adversarial training framework, aiming to effectively distinguish between real and generated QR codes.

3.4. Loss Functions

In the context of generative adversarial networks, the training objective of the generator network is to produce fake images that are convincing enough to deceive the discriminator. To achieve this goal, it is necessary to design a loss function that effectively guides the generator. In this paper, a combined multi-task loss function is designed as follows:
L o s s total   = α L o s s adv   + β L o s s S S I M + γ L o s s M S E + δ L o s s Q R
where α , β , γ , and δ are coefficients used to balance the contributions of different losses. In this study, α = 0.1, β = 0.25, γ = 0.6, and δ = 0.05 were chosen. The setting of these coefficients in the entire loss function is crucial for the model’s performance and stability. Now, let us delve into the reasons behind each loss and weight configuration in more detail.
The adversarial loss   Loss adv stems from the ability of the generator in a generative adversarial network to deceive the discriminator. Its calculation formula is as follows:
L o s s a d v = E x p d a t a x l o g D x + E z p z z l o g 1 D G z
where x p data   ( x ) represents sampling from the distribution of real QR code images, where p data   ( x ) is the distribution of the original QR codes. D ( x ) represents the discriminator’s probability of judging the authenticity of the original QR code image. z p z   ( z ) represents sampling from the distribution of damaged QR code images, where p z ( z ) is the distribution of damaged QR codes. G ( z ) generates repaired images based on the damaged images, and D ( G ( z ) ) represents the discriminator’s probability of judging the authenticity of the repaired QR code images. The choice of a smaller weight ( α = 0.1) is made to ensure that in the early stages of training, the generator is not unduly affected by a significant adversarial loss, thus preventing an early model collapse. This weight selection helps to maintain training stability and allows the model to gradually learn to generate more deceptive images without facing excessive penalties too soon in the process.
Structural similarity loss L o s s S S I M [34] is calculated using the following formula:
S S I M = 1 2 μ x μ y + c 1 2 σ x y + c 2 μ x 2 + μ y 2 + c 1 σ x 2 + σ y 2 + c 2
L o s s S S I M = 1 S S I M + 1 2
where μ x and μ y represent the mean values of the original and generated images, respectively, σ x 2 and σ y 2 represent the variances of the original and generated images, respectively, σ x y represents the covariance between the original and generated images, and c 1 and c 2 are stability constants. For ease of computation and utilization, L o s s S S I M is normalized to map the S S I M range from [−1, 1] to [0, 1]. L o s s S S I M contributes to maintaining the structural similarity between the generated images and the original images, ensuring that essential features are preserved. The rationale behind setting this weight to β = 0.25 for this task is rooted in the emphasis of QR code image reconstruction on preserving the structural similarity of the images. Selecting an appropriate weight ensures that the generated images maintain visually similar structures to the original images, consequently upholding the readability and accuracy of the QR codes. This weight configuration underscores the task’s focus on image structure and plays a pivotal role in upholding the quality and recognizability of the images.
Mean squared error loss L o s s M S E , is calculated using the following formula:
L o s s M S E = 1 n i = 1 n   ( x i y i ) 2
where x i and y i represent the grayscale values of the i-th pixel in the original and generated images, respectively, and n is the total number of pixels in the image. L o s s M S E emphasizes pixel-level accuracy and detail retention in images. The weight setting for L o s s M S E ( γ = 0.6) plays a crucial role in the task by maintaining image clarity and improving image quality in later stages of training. This high γ value ensures close alignment between generated and target images at the pixel level, particularly preserving image sharpness. MSE loss is vital for enhancing image quality, emphasizing its key role in the task.
QR code loss L o s s Q R is calculated using the following formula:
L o s s Q R = similarity ( Q 1 , Q 2 ) , if   repaired   QR   code   is   readable 0 , otherwise
Q 1 and Q 2 represent the original QR code image and the generated QR code image, respectively. When the repaired QR code is readable, the character similarity between the repaired and original QR codes is computed as L o s s Q R ; when the repaired QR code is not readable, L o s s Q R is set to 0. The L o s s Q R is crucial for rapid model convergence during the early stages of training. However, in the later stages of training, as most QR code images can already be recognized but the image quality still needs improvement, the impact of L o s s Q R gradually diminishes. To address this, we set its weight coefficient δ to a relatively small value (0.05) to ensure a positive effect on the model’s training during the initial stages while avoiding excessive constraints on the model’s learning in the later stages.
The combination of multiple loss functions contributes to generating high-quality QR code images. Among them, the adversarial loss promotes the generation of realistic images, structural similarity loss ensures structural similarity, mean squared error loss enhances detail restoration, and QR code loss optimizes the accuracy of information recovery.

4. Experiments

4.1. Datasets

To train and evaluate the performance of our proposed QR code restoration model, we created a custom dataset consisting of two main components: original QR code images and irregular masks.

4.1.1. Original QR Code Images

In QR code restoration tasks, the error correction level and version of the QR code play a significant role in the difficulty of the restoration. The error correction level (L—Low; M—Medium; Q—Quarter; H—High) determines the extent of damage that the QR code can withstand (L-7%, M-15%, Q-25%, H-30%) [35], while the version determines the complexity and data capacity of the QR code. There are different versions ranging from 1 to 40, each with its inherent number of modules. (A module refers to the square black and white dots that make up the QR code.) For instance, a QR code of version 1 consists of 21 × 21 modules. To comprehensively consider the impact of these factors on the restoration model, we intentionally created an original QR code image dataset that includes various error correction levels (L, M, Q, H) and versions (1–5).
We employed the qrcode library in Python to generate original QR code images. During the generation process, we set different version numbers, error correction levels, and image size parameters to obtain diversified QR code styles. To ensure dataset diversity, we used timestamps as the data content of each QR code, ensuring unique content for each QR code. The generated QR code images were saved in JPEG format. By generating original QR codes with different error correction levels and versions, we ensure dataset diversity and generalization ability. This dataset design helps to better verify the performance of the restoration model when dealing with various styles of QR codes, avoiding model over-reliance on specific QR code styles. This dataset design enhances the robustness and generalization ability of the restoration model, ensuring its capability to handle various types of damaged QR codes in real-world applications. It is worth noting that in the subsequent experimental evaluations, we will demonstrate the model’s performance on QR code images with different error correction levels and degrees of damage to further validate the effectiveness of the dataset.

4.1.2. Irregular Masks

To simulate varying levels of contamination and damage, we utilized the irregular masks from the Irregular Mask Dataset [17]. This dataset offers masks of various shapes and sizes, which can simulate damage and missing parts in QR code images. The dataset covers different hole-to-image area ratios: (0.01, 0.1], (0.1, 0.2], (0.2, 0.3], (0.3, 0.4], (0.4, 0.5], (0.5, 0.6]. Each category contains 1000 masks with and without border constraints. We randomly selected and applied these irregular masks to the original QR code images to generate QR code images with different degrees of damage. The application of masks includes covering, masking, and partial covering. By combining the original QR code images with irregular masks, we generated a dataset of damaged QR code images with varying degrees of contamination and random damage.
In summary, our dataset includes damaged QR code images with varying degrees of contamination and damage, along with corresponding irregular masks for each image. This dataset will be used to evaluate the performance and effectiveness of our proposed restoration model.

4.1.3. Dataset Split

We followed the method described in Section 4.1.1 to generate a total of 13,800 original QR code images and divided them into 10,000 for training and 3800 for testing.
For training, it is important to note that we used 10,000 generated original QR code images, and in each training iteration, we randomly selected one mask image to create a paired damaged QR code image. This approach ensures that the damaged QR code images used for training are not precomputed but are dynamically generated during each iteration.
For testing, to maintain fairness and stability, we employed a different method. We initially combined the original QR code images with mask images to create the damaged QR code dataset, which was then used for testing. Therefore, from the test dataset, we extracted 2000 images to create a contamination level test set, which was used to evaluate the model’s performance on QR codes with different levels of contamination. Furthermore, we extracted 1800 images from the test dataset to create a random contamination level test set, which allowed us to assess the model’s performance under random contamination levels.
Through this dataset splitting, we can assess the generalization and robustness of the restoration model on data outside the training set. Simultaneously, the test sets with different contamination levels and random contamination degrees provide a more comprehensive evaluation of the model’s performance under various scenarios.

4.2. Training Configuration and Strategies

4.2.1. Staged Training Strategy

We adopted a staged training strategy to effectively enhance the QR code restoration performance of our model. Specifically, the training process is divided into the following stages:
  • Individual training of the edge reconstruction module. The optimizer updates only the parameters of this module. We utilize the Canny edge detection algorithm [18] to obtain the edge map A from the input image and edge map B from the target image. Edge map A is used as the input, and B serves as the supervisory signal for training. In this case, the loss function excludes the QR code loss, with the weight parameter set to zero. This ensures that the edge restoration module can accurately restore edge information.
  • Individual training of the QR code reconstruction module. The optimizer updates only the parameters of this module. We also acquire edge maps B from the target image and concatenate them with the original input image along the channel dimension, using the complete loss function for training.
  • Joint training of the entire model. The optimizer updates all parameters, while keeping the loss function unchanged. Following the phased training of the previous two steps, the individual modules have been pre-trained effectively, and this step aims to strengthen the collaborative effect between the two modules.
In all three stages mentioned above, we employed corresponding discriminators for adversarial training. This essentially designs three independent GANs for training in different stages. Such a staged strategy allows for better training of our designed EHFP-GAN model, thus achieving superior performance in QR code restoration tasks.

4.2.2. Training Parameter Settings

During the model training process, we thoroughly considered the settings of various critical parameters to ensure efficient and stable training, resulting in excellent QR code restoration performance. Detailed adjustments were made in the following aspects:
We employed Adam optimizers for both discriminators and generators, with initial learning rates set at 10−5 and 10−6. To further optimize the training process, we introduced a learning rate decay strategy. Such settings help to maintain the stability of Generative Adversarial Networks (GANs) and enable the model to better learn image restoration tasks. Considering that a single GPU memory is approximately 16 GB, we set the batch size to 8. This choice aims to ensure sufficient utilization of CUDA memory space and also helps to avoid memory-related limitations. Based on our preliminary experiments, we set the training iteration count to 200 epochs. This setting ensures that the model fully converges during the training process, leading to improved restoration results. Additionally, we selected an input image size of 512 × 512. This size choice strikes a balance between computational resources and model performance, demonstrating excellence in QR code restoration tasks. Through meticulous hyperparameter tuning, our objective is to achieve efficient and stable model training, resulting in outstanding restoration performance across various tasks.

4.3. Evaluation Metrics

The following are the objective evaluation metrics that we will use in this experiment, along with their rationales:
  • The Recognition Rate (RR) is adopted as a key quantitative metric to evaluate the performance of QR code restoration methods. The RR is calculated as the number of restored QR code images that are correctly recognized, divided by the total number of damaged input images. A restored image is considered successfully recognized only if the QR decoder can extract its original embedded information without errors. The RR directly quantifies how well a method can recover damaged QR codes to be identifiable again. A higher RR indicates the method restores more damaged codes to be correctly recognized. Maximizing the RR is an important goal when optimizing solutions for QR code restoration.
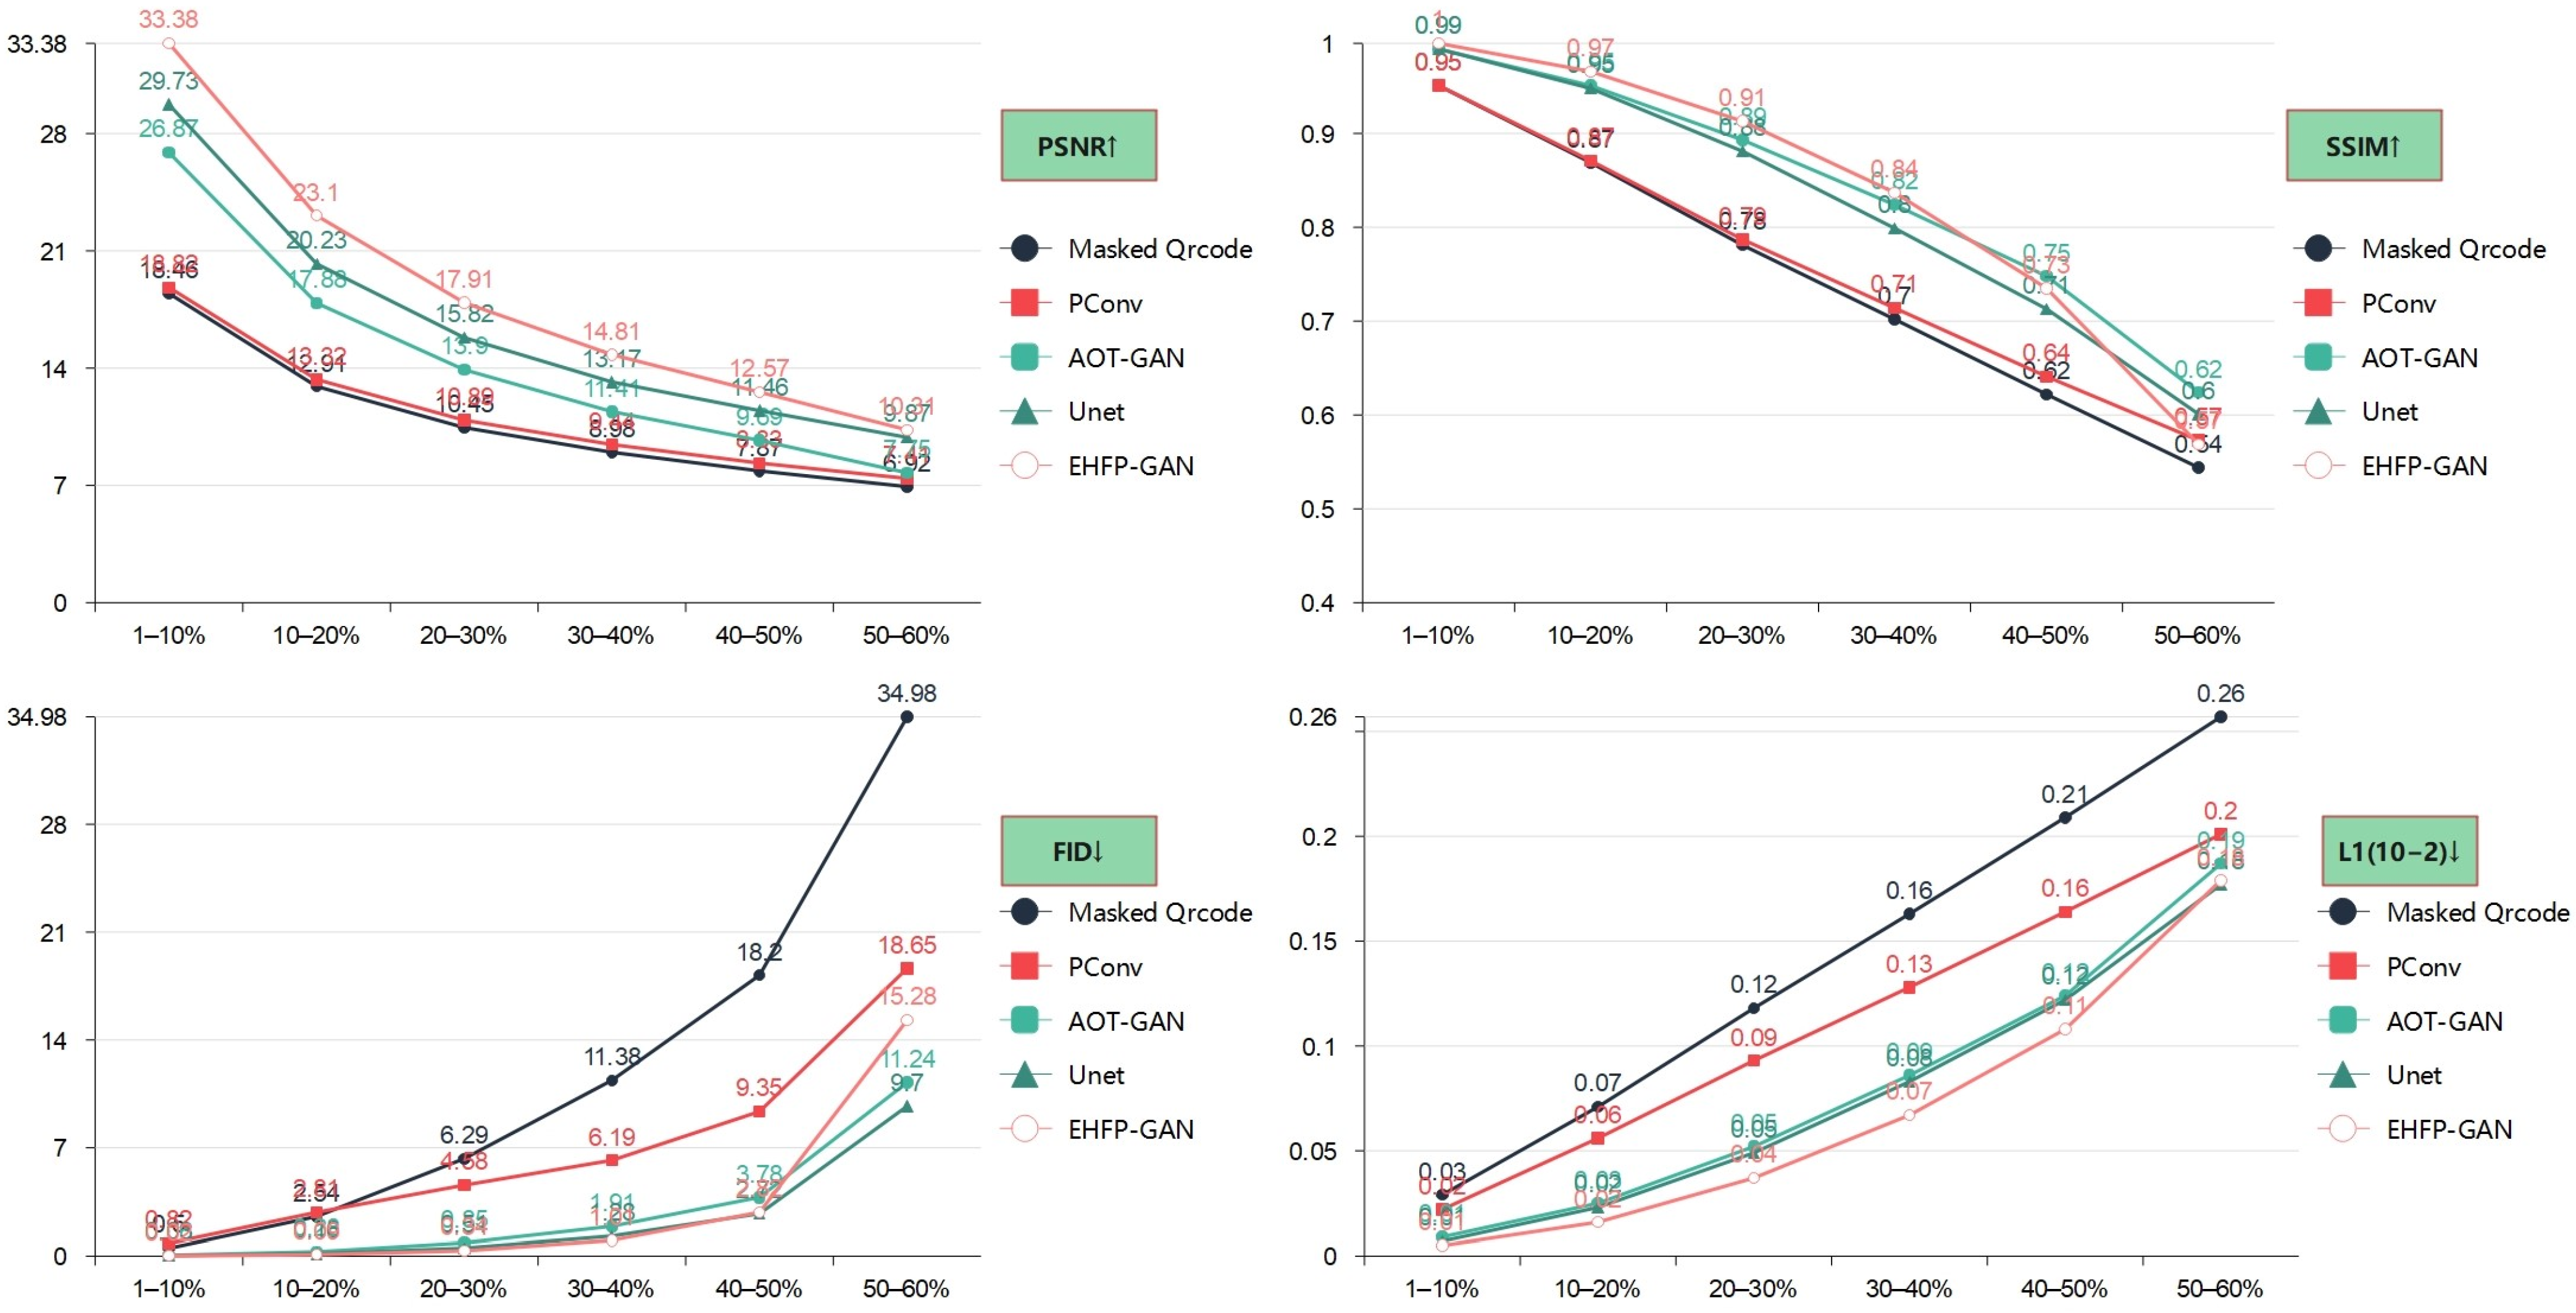
  • Structural Similarity Index (SSIM) [34] compares the restored results with original images in terms of brightness, contrast, and structure.
  • L1 Error is widely used to measure the average absolute error between restored and original images at the pixel level for evaluating reconstruction accuracy.
  • Fréchet Inception Distance (FID) [36] evaluates the perceptual quality distance between generated and real images. Compared to traditional pixel-level metrics, FID focuses more on perceptual quality, consistent with human subjective evaluation.
  • Peak Signal-to-Noise Ratio (PSNR) measures the image reconstruction accuracy by calculating the PSNR between restored and original images. It is commonly used to assess restoration quality.
In summary, we will primarily use RR as the main metric to evaluate model restoration performance, along with the other four metrics for comprehensive assessment.

4.4. Comparison Models

The following is a brief introduction to the classic models used for comparison.
  • Pconv [17]: Partial Convolutional Network aims to address color discrepancies both inside and outside of the holes. By incorporating partial convolutional layers, PConv effectively restores details and structure in damaged images.
  • AOT-GAN [15]: A method based on learning aggregated contextual transformations and enhancing discriminators for high-resolution image restoration. AOT-GAN leverages a generative adversarial network framework to generate more authentic and intricate restoration outcomes.
  • Unet [37]: A classical image segmentation network model featuring an encoder–decoder architecture. Unet performs well in image processing tasks, capturing contextual information between input and output by learning their mapping, thus achieving precise image restoration.
We selected these comparison models because of their extensive applications and successful case studies in image processing tasks. Although research on deep learning models for QR code restoration is relatively limited, we believe that these classic image restoration models hold certain adaptability and potential. They serve as benchmarks for comparison and analysis alongside our proposed method. Moreover, there are other potential comparison models or methods worth exploring, especially those extensively employed in analogous tasks or domains. Introducing and comparing these models will further enrich our research and analysis.

4.5. Experimental Results

4.5.1. Quantitative Comparisons

To validate the effectiveness of our proposed EHFP-GAN model, this section conducts quantitative comparisons with three representative comparative models, Pconv, AOT-GAN, and Unet, using the designed test dataset as previously mentioned. The experimental results are presented in Table 1. It can be observed that as the QR code hole ratio increases, the recognition rate gradually decreases, becoming completely unrecognizable at a 20–30% hole ratio level. Simultaneously, the variations in metrics such as L1, SSIM, and PSNR further validate the moderate difficulty level of the dataset.
In comparison with other methods, the EHFP-GAN achieves the best performance in terms of recognition rate. As shown in Table 1, across different levels of the QR code hole ratio, the EHFP-GAN’s recognition rate surpasses that of the other models, reaching 95.35% within a 1–10% hole ratio range, which is significantly higher than Unet’s second-best result of 89.3%. Figure 3 presents a clear line chart illustrating the impact of increasing the hole ratio on QR code recognition rates for different models. Recognition rates for all models exhibit a declining trend, and as the hole ratio increases, the differences in recognition rates among the models become more pronounced. The EHFP-GAN model consistently maintains the highest recognition rates, demonstrating its superior robustness for damaged QR codes. Compared to other models, the EHFP-GAN achieves higher recognition rates at higher hole ratios, especially excelling under severe damage conditions. EHFP-GAN consistently exhibits the highest recognition accuracy across all hole ratio levels.
In terms of restored image quality, the EHFP-GAN outperforms the other methods in overall PSNR and SSIM indicators, indicating superior visual fidelity and structural similarity of the generated images. For instance, at a 10–20% hole ratio level, the EHFP-GAN achieves a PSNR of 23.103 and an SSIM of 0.966, both superior to Pconv (PSNR 20.226, SSIM 0.948) and the AOT-GAN (PSNR 17.882, SSIM 0.951). From the perspective of FID, our model performs optimally in the 1–40% range, while in other cases, it maintains a high level of performance, although not the best. Concerning the L1 metric, Unet performs better under high hole ratio conditions, whereas the EHFP-GAN shines under low hole ratio conditions. For instance, at a 1–10% hole ratio level, the EHFP-GAN’s L1 of 0.005 is lower than that of Unet (0.007) and AOT-GAN (0.009). Figure 4 visually demonstrates that as the QR code hole ratio increases, the PSNR and SSIM values for all models gradually decrease, while the FID and L1 values increase. However, it is worth noting that the EHFP-GAN consistently delivers a top-tier performance across these metrics, especially in the 1–40% hole ratio range. In the range of 40–60%, certain metrics may not attain their peak performance, but they typically reach a level close to optimal. This underscores EHFP-GAN’s exceptional ability to generate high-quality images, particularly under conditions of low hole ratios. In the case of hole ratios ranging from 50% to 60%, several metrics, such as SSIM, PSNR, L1, and more, as depicted in Figure 4, clearly demonstrate a tight clustering of results for all models within a remarkably limited range. This phenomenon arises due to the substantial occlusion experienced by QR code images in this range, resulting in generally suboptimal performance across these models when it comes to recovering images with such elevated levels of obstruction.
In summary, the quantitative analysis validates that the EHFP-GAN model outperforms the current comparative methods in terms of recognition rate and generated image quality, confirming its effectiveness in the realm of QR code restoration tasks.

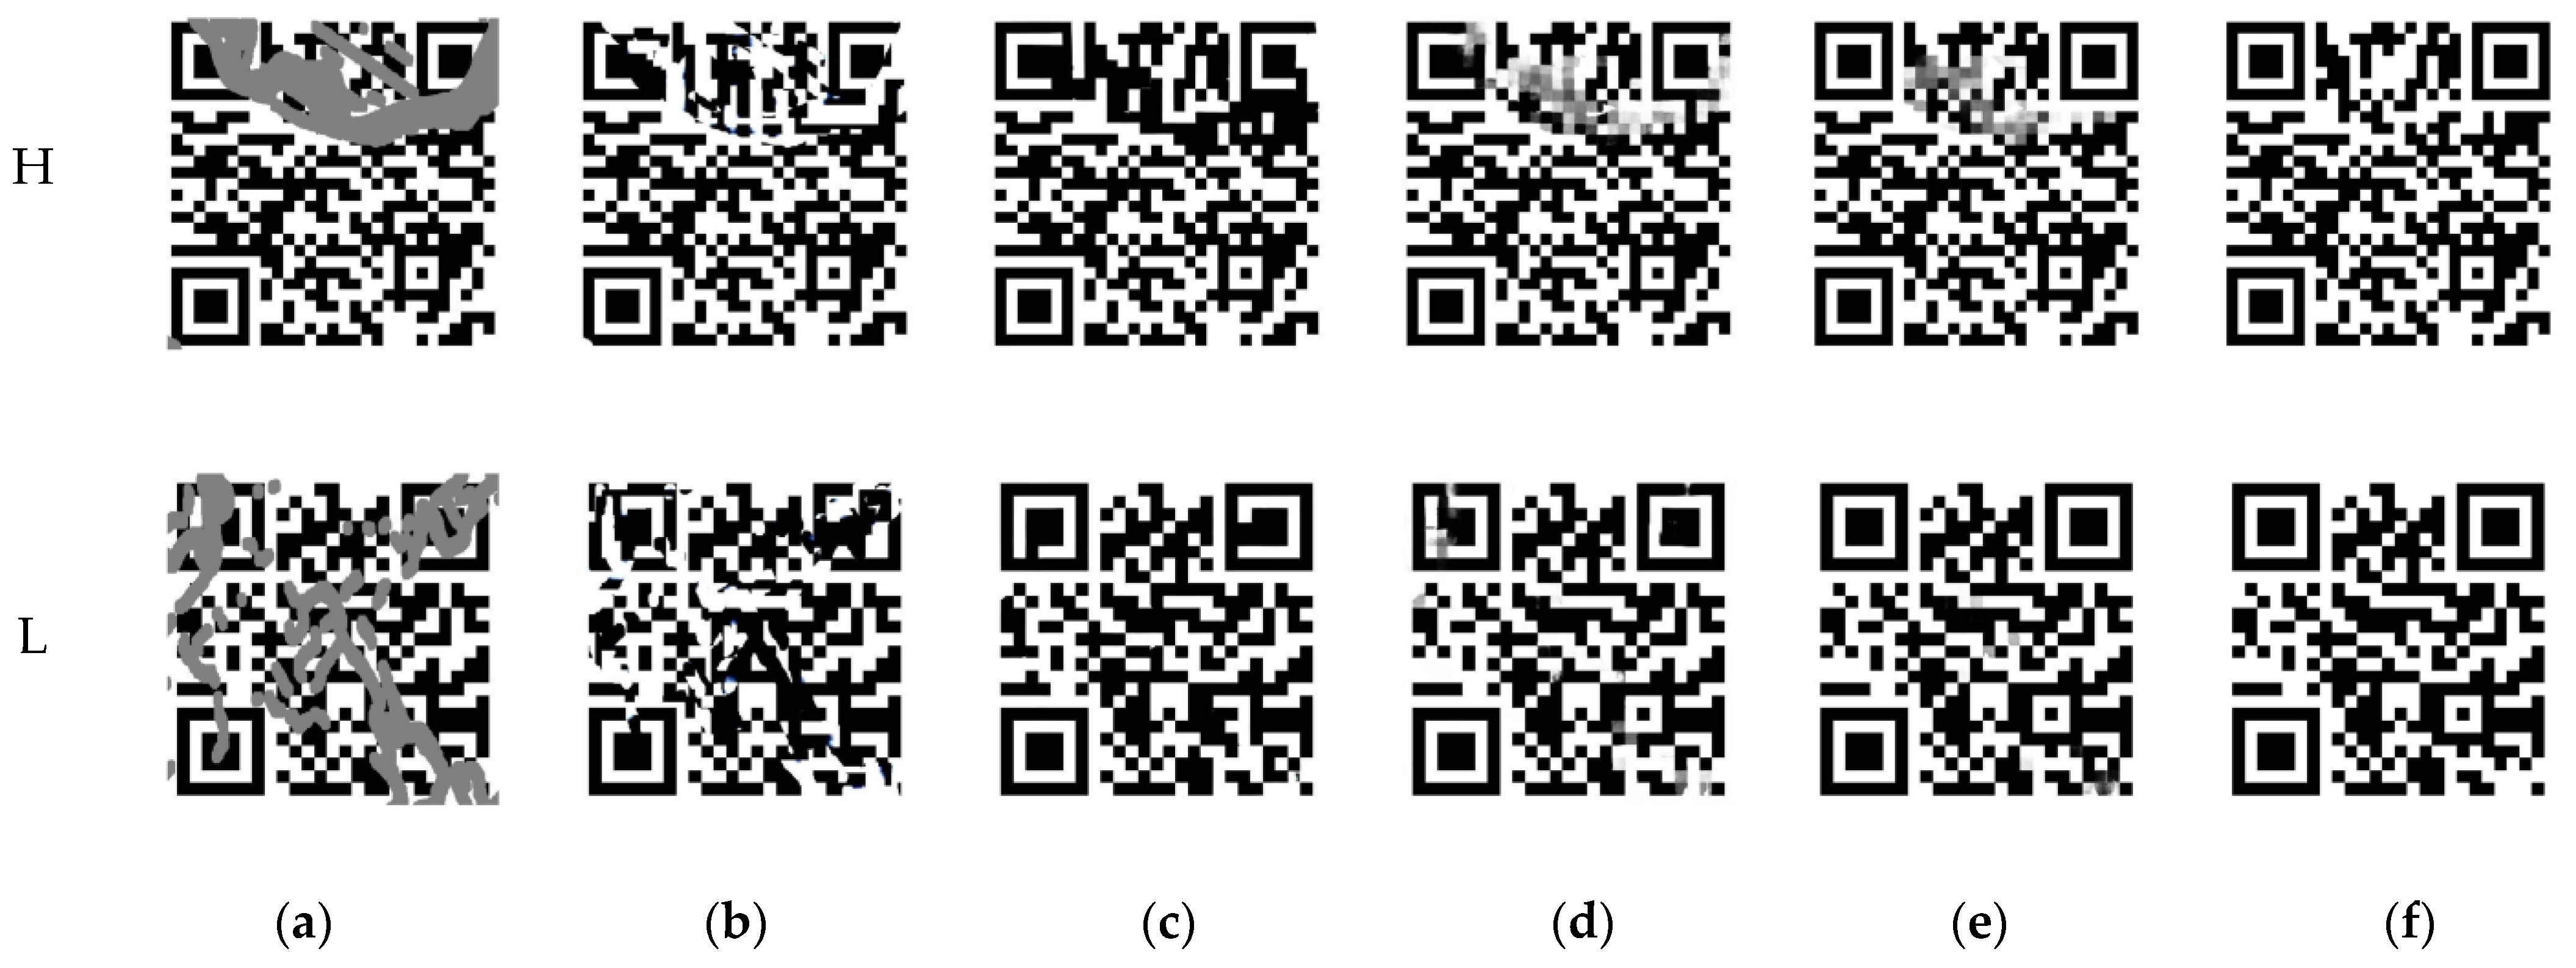
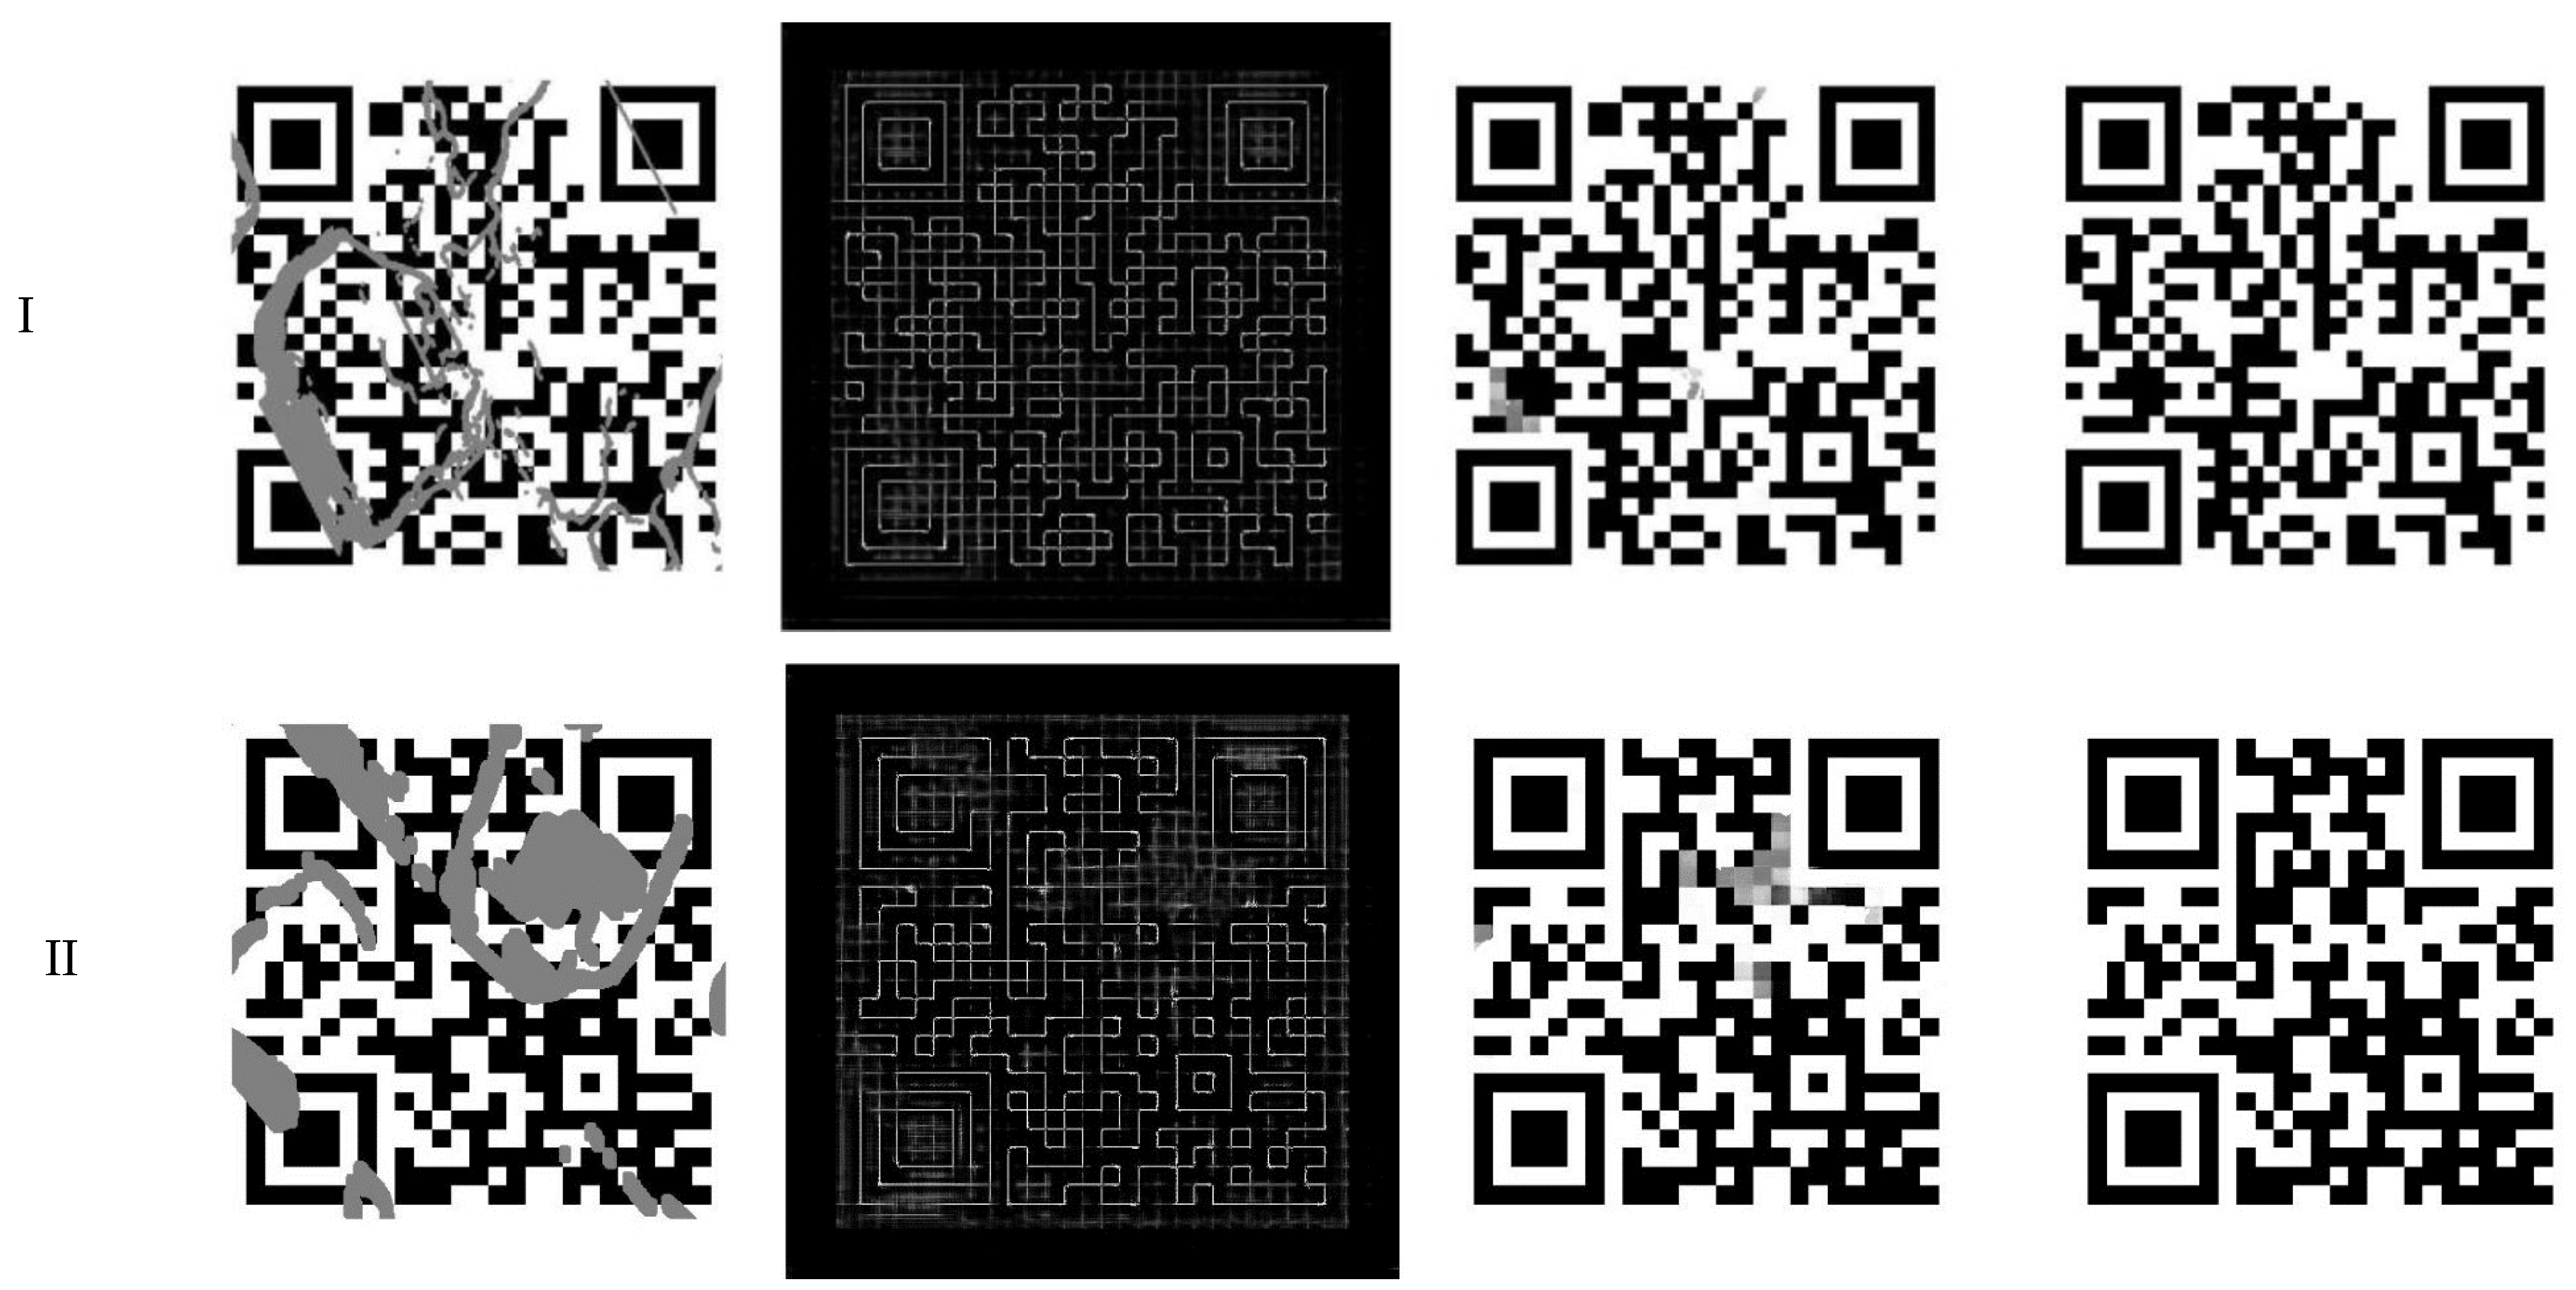
4.5.2. Qualitative Comparisons

To intuitively demonstrate the image restoration effects of different models, we conducted qualitative analysis. In Figure 5, row H shows the restoration results of each model under conditions of high hole density. It can be seen that Pconv and AOT-GAN generated QR code images with distinct black and white colors. While Unet and EHFP-GAN have gray areas, which is due to color deviations occurring when restoring large occluded areas. In Figure 5, row L shows the results under conditions with scattered damage and a moderate hole ratio. In this case, the overall color performance of the four models is better, but the effect of the EHFP-GAN is the best. This is because the AOT-GAN and Unet underperformed compared to the EHFP-GAN in restoring the locator area, while the latter can perfectly restore the position and graphical structure of the locator area. As for Pconv, although its color restoration is better, there is obvious distortion in the structure.
To validate the robustness of the EHFP-GAN model under different hole ratios, we compared its image restoration effects at four different ratios of (1) 1–10%, (2) 10–20%, (3) 20–30%, and (4) 30–40% (as shown in rows I–IV of Figure 6). The experimental results show that due to the blank borders around QR code images, the actual information content damage is more severe than the direct image damage level. Under low hole ratios, the model can restore QR code edges relatively well. But as the ratio increases, the edge restoration quality gradually decreases, and the images become blurred to some extent. Nevertheless, the restored QR codes at different hole ratios can all be successfully recognized. This result proves the robust restoration capability of the EHFP-GAN model for damaged QR code images.
In summary, the qualitative analysis shows that the EHFP-GAN model can effectively restore QR code images damaged to different degrees, and outperforms existing comparative models in aspects of color, structure, information integrity, and especially, restoring the locator area of QR codes better. This is consistent with the aforementioned quantitative results, and intuitively verifies the superiority of the EHFP-GAN over comparative models.

4.5.3. Ablation Study

To validate the effectiveness of the proposed modules, we conducted ablation experiments on a subset of QR codes from the test dataset with damage levels ranging from 1% to 40%. Since the QR code reconstruction module adopts a structure similar to Unet [31], we selected the basic module of Unet, the Double Convolution (DC Block), as the comparative baseline in the experiments. Four network structures were constructed: one with only the DC Block, one with only the HFP Block, one utilizing only edge information, and one combining both the HFP Block and edge information.
Table 2 presents the QR code recognition rate, PSNR, SSIM, and other metrics for each experimental combination. The results for the DC Block alone indicate a significantly lower recognition rate of only 13.5% and a PSNR of 11.434, underscoring its limited capacity to effectively restore damaged QR codes. This highlights its constraint in extracting critical context features necessary for QR code restoration. In contrast, the HFP Block alone yielded a notable improvement in the recognition rate, achieving 44.8%, and a corresponding PSNR of 21.588. This substantial enhancement can be attributed to its multi-scale encoding–decoding structure, which captures both localized patterns and global semantics essential for reconstructing corrupted regions in the QR codes. Utilizing only edge information also led to an increased recognition rate of 41.45%, validating its valuable contribution during the restoration process. However, it became evident that edge information alone is insufficient. The optimal performance was achieved when combining it with the HFP Block’s contextual features, resulting in a recognition rate of 47.05% and a PSNR of 22.083. This underscores the strong synergistic effect between the two components.
In conclusion, the ablation experiments confirm the pivotal roles of the HFP Block and edge information in enhancing model performance for QR code restoration. The HFP Block provides essential contextual features for focusing on damaged portions, while edges offer valuable structural guidance. Combining the two components enables the comprehensive utilization of both local patterns and global semantics, leading to the effective restoration of QR codes. These results provide robust support for the validity of the proposed network design.

5. Discussion

In this section, we will discuss the practical applications and implications of our QR code restoration approach. While our study has achieved notable results in the field of QR code restoration, there remain areas for improvement and further exploration.
  • Real-world applications: Our QR code restoration method holds great potential for real-world applications. The ubiquity of QR codes in various industries, including retail, logistics, and advertising, underscores the importance of effective QR code restoration. Specifically, our approach can enhance the readability and visual quality of damaged QR codes, which are commonly encountered in practical scenarios. By restoring QR codes to their original state, our technology can facilitate seamless transactions, improve inventory management, and enhance user experiences in scanning codes.
  • Impact on special QR codes: In contemporary applications, QR codes are increasingly diverse, often incorporating images and additional elements. While our study primarily focused on standard QR codes, there is a growing need to address specialized QR codes. Future research should expand our dataset to include these unique QR code variations, allowing our model to effectively restore a broader range of QR codes found in real-world contexts.
  • Resource optimization: The demand for computational resources during model training and restoration is an important consideration, especially for real-time applications. We acknowledge the need to optimize algorithms and model structures to reduce computational resource requirements. This optimization will not only improve the real-time performance but also make our approach more accessible for a wide range of practical applications.
  • External factors: Real-world environments are often subject to external factors such as changes in lighting conditions, which can interfere with restoration results. To address this, we propose the incorporation of image enhancement and preprocessing techniques that can mitigate the effects of external factors. These enhancements will contribute to our model’s robustness in real-world scenarios.

6. Conclusions

In conclusion, our study presents a novel approach to the restoration of damaged QR codes using generative adversarial networks and hierarchical feature pyramid modules. Our research demonstrates the effectiveness of this approach in enhancing QR code recognition accuracy and visual quality. As QR codes continue to play a crucial role in various industries, our technology holds promise for practical applications in retail, logistics, and beyond.
Future research endeavors should focus on further refining restoration algorithms, expanding datasets to accommodate diverse QR code types, optimizing computational resource requirements, and addressing external interference. By pursuing these avenues, we can enhance the performance and applicability of QR code restoration models, ultimately providing improved solutions for relevant application domains.

Author Contributions

J.Z. and Z.L. worked on conceptualization, methodology, the model, and writing—original draft preparation; R.Z. (Ruolin Zhao), Z.Z., Y.F., J.L., R.Z. (Rong Zhu) and S.L. worked on validation and writing—review and editing. All authors have read and agreed to the published version of the manuscript.

Funding

This work was supported in part by the National Natural Science Foundation of China under Grant 62373390, and in part by the Key projects of Guangdong basic and applied basic research fund 2022B1515120059.

Data Availability Statement

Data underlying the results presented in this paper are not publicly available at this time but may be obtained from the authors upon reasonable request.

Conflicts of Interest

The authors declare no conflict of interest.

References

  1. Jiao, S.; Zou, W.; Li, X. QR code based noise-free optical encryption and decryption of a gray scale image. Opt. Commun. 2017, 387, 235–240. [Google Scholar] [CrossRef]
  2. Bai, H.; Zhou, G.; Hu, Y.; Sun, A.; Xu, X.; Liu, X.; Lu, C. Traceability technologies for farm animals and their products in China. Food Control 2017, 79, 35–43. [Google Scholar] [CrossRef]
  3. Tarjan, L.; Šenk, I.; Tegeltija, S.; Stankovski, S.; Ostojic, G. A readability analysis for QR code application in a traceability system. Comput. Electron. Agric. 2014, 109, 1–11. [Google Scholar] [CrossRef]
  4. Chen, R.; Zheng, Z.; Yu, Y.; Zhao, H.; Ren, J.; Tan, H.-Z. Fast Restoration for Out-of-Focus Blurred Images of QR Code With Edge Prior Information via Image Sensing. IEEE Sens. J. 2021, 21, 18222–18236. [Google Scholar] [CrossRef]
  5. Karrach, L.; Pivarčiová, E.; Bozek, P. Recognition of Perspective Distorted QR Codes with a Partially Damaged Finder Pattern in Real Scene Images. Appl. Sci. 2020, 10, 7814. [Google Scholar] [CrossRef]
  6. Fröschle, H.-K.; Gonzales-Barron, U.; McDonnell, K.; Ward, S. Investigation of the potential use of e-tracking and tracing of poultry using linear and 2D barcodes. Comput. Electron. Agric. 2009, 66, 126–132. [Google Scholar] [CrossRef]
  7. Chen, R.; Zheng, Z.; Pan, J.; Yu, Y.; Zhao, H.; Ren, J. Fast Blind Deblurring of QR Code Images Based on Adaptive Scale Control. Mob. Netw. Appl. 2021, 26, 2472–2487. [Google Scholar] [CrossRef]
  8. van Gennip, Y.; Athavale, P.; Gilles, J.; Choksi, R. A Regularization Approach to Blind Deblurring and Denoising of QR Barcodes. IEEE Trans. Image Process. 2015, 24, 2864–2873. [Google Scholar] [CrossRef] [PubMed]
  9. Wang, M.; Chen, K.; Lin, F. Multi-residual generative adversarial networks for QR code deblurring. In Proceedings of the International Conference on Electronic Information Technology (EIT 2022), Chengdu, China, 18–20 March 2022; pp. 589–594. [Google Scholar]
  10. Wang, B.; Xu, J.; Zhang, J.; Li, G.; Wang, X. Motion deblur of QR code based on generative adversative network. In Proceedings of the 2019 2nd International Conference on Algorithms, Computing and Artificial Intelligence, Sanya, China, 20–22 December 2019; pp. 166–170. [Google Scholar]
  11. Bertalmio, M.; Sapiro, G.; Caselles, V.; Ballester, C. Image inpainting. In Proceedings of the 27th Annual Conference on Computer Graphics and Interactive Techniques, New Orleans, LA, USA, 23–28 July 2000; pp. 417–424. [Google Scholar]
  12. Fanous, M.J.; Popescu, G. GANscan: Continuous scanning microscopy using deep learning deblurring. Light. Sci. Appl. 2022, 11, 265. [Google Scholar] [CrossRef] [PubMed]
  13. Goodfellow, I.; Pouget-Abadie, J.; Mirza, M.; Xu, B.; Warde-Farley, D.; Ozair, S.; Courville, A.; Bengio, Y. Generative adversarial networks. Commun. ACM 2020, 63, 139–144. [Google Scholar] [CrossRef]
  14. Wan, Z.; Zhang, B.; Chen, D.; Zhang, P.; Chen, D.; Liao, J.; Wen, F. Bringing old photos back to life. In Proceedings of the IEEE/CVF Conference on Computer Vision and Pattern Recognition, Seattle, WA, USA, 13–19 June 2020; pp. 2747–2757. [Google Scholar]
  15. Zeng, Y.; Fu, J.; Chao, H.; Guo, B. Aggregated Contextual Transformations for High-Resolution Image Inpainting. IEEE Trans. Vis. Comput. Graph. 2022, 29, 3266–3280. [Google Scholar] [CrossRef] [PubMed]
  16. Nazeri, K.; Ng, E.; Joseph, T.; Qureshi, F.Z.; Ebrahimi, M. Edgeconnect: Generative image inpainting with adversarial edge learning. arXiv 2019, arXiv:1901.00212. [Google Scholar]
  17. Liu, G.; Reda, F.A.; Shih, K.J.; Wang, T.-C.; Tao, A.; Catanzaro, B. Image inpainting for irregular holes using partial convolutions. In Proceedings of the European Conference on Computer Vision (ECCV), Munich, Germany, 8–14 September 2018; pp. 85–100. [Google Scholar]
  18. Canny, J. A computational approach to edge detection. IEEE Trans. Pattern Anal. Mach. Intell. 1986, 6, 679–698. [Google Scholar] [CrossRef]
  19. Fan, Z.; Liu, Z.; Li, M. Research on QR Code Image Recognition. In Proceedings of the 2012 Second International Conference on Electric Information and Control Engineering-Volume 01, Washington, DC, USA, 6–8 April 2012; pp. 1189–1192. [Google Scholar]
  20. Gu, Y.; Zhang, W. QR code recognition based on image processing. In Proceedings of the International Conference on Information Science and Technology, Nanjing, China, 26–28 March 2011; pp. 733–736. [Google Scholar]
  21. Theljani, A.; Houichet, H.; Mohamed, A. An adaptive Cahn-Hilliard equation for enhanced edges in binary image inpainting. J. Algorithms Comput. Technol. 2020, 14, 1748302620941430. [Google Scholar] [CrossRef]
  22. Wakahara, T.; Yamamoto, N. Image processing of 2-dimensional barcode. In Proceedings of the 2011 14th International Conference on Network-Based Information Systems, Tirana, Albania, 7–9 September 2011; pp. 484–490. [Google Scholar]
  23. Yu, J.; Lin, Z.; Yang, J.; Shen, X.; Lu, X.; Huang, T.S. Generative image inpainting with contextual attention. In Proceedings of the IEEE Conference on Computer Vision and Pattern Recognition, Salt Lake City, UT, USA, 18–23 June 2018; pp. 5505–5514. [Google Scholar]
  24. Yang, C.; Lu, X.; Lin, Z.; Shechtman, E.; Wang, O.; Li, H. High-resolution image inpainting using multi-scale neural patch synthesis. In Proceedings of the IEEE Conference on Computer Vision and Pattern Recognition, Honolulu, HI, USA, 21–26 July 2017; pp. 6721–6729. [Google Scholar]
  25. Telea, A. An image inpainting technique based on the fast marching method. J. Graph. Tools 2004, 9, 23–34. [Google Scholar] [CrossRef]
  26. Criminisi, A.; Perez, P.; Toyama, K. Region Filling and Object Removal by Exemplar-Based Image Inpainting. IEEE Trans. Image Process. 2004, 13, 1200–1212. [Google Scholar] [CrossRef] [PubMed]
  27. Reed, I.S.; Solomon, G. Polynomial Codes Over Certain Finite Fields. J. Soc. Ind. Appl. Math. 1960, 8, 300–304. [Google Scholar] [CrossRef]
  28. Shimobaba, T.; Endo, Y.; Hirayama, R.; Nagahama, Y.; Takahashi, T.; Nishitsuji, T.; Kakue, T.; Shiraki, A.; Takada, N.; Masuda, N.; et al. Autoencoder-based holographic image restoration. Appl. Opt. 2017, 56, F27–F30. [Google Scholar] [CrossRef] [PubMed]
  29. Nguyen, V.-T.; Nguyen, A.-T.; Nguyen, V.-T.; Bui, H.-A. A real-time human tracking system using convolutional neural network and particle filter. In Intelligent Systems and Networks; Selected Articles from ICISN 2021, Vietnam, 2021; Springer: Berlin/Heidelberg, Germany, 2021; pp. 411–417. [Google Scholar]
  30. Pathak, D.; Krahenbuhl, P.; Donahue, J.; Darrell, T.; Efros, A.A. Context encoders: Feature learning by inpainting. In Proceedings of the IEEE Conference on Computer Vision and Pattern Recognition, Las Vegas, NV, USA, 27–30 June 2016; pp. 2536–2544. [Google Scholar]
  31. He, K.; Zhang, X.; Ren, S.; Sun, J. Deep residual learning for image recognition. In Proceedings of the IEEE Conference on Computer Vision and Pattern Recognition, Las Vegas, NV, USA, 27–30 June 2016; pp. 770–778. [Google Scholar]
  32. Zhao, H.; Shi, J.; Qi, X.; Wang, X.; Jia, J. Pyramid scene parsing network. In Proceedings of the IEEE Conference on Computer Vision and Pattern Recognition, Honolulu, HI, USA, 21–26 July 2017; pp. 2881–2890. [Google Scholar]
  33. Yu, F.; Koltun, V. Multi-scale context aggregation by dilated convolutions. arXiv 2015, arXiv:1511.07122. [Google Scholar]
  34. Wang, Z.; Simoncelli, E.P.; Bovik, A.C. Multiscale structural similarity for image quality assessment. In Proceedings of the Thrity-Seventh Asilomar Conference on Signals, Systems & Computers, Pacific Grove, CA, USA, 9–12 November 2003; pp. 1398–1402. [Google Scholar]
  35. Wave, D. Information Capacity and Versions of the QR Code. 2022. Available online: https://www.qrcode.com/en/about/version.html (accessed on 4 October 2023).
  36. Heusel, M.; Ramsauer, H.; Unterthiner, T.; Nessler, B.; Hochreiter, S. Gans trained by a two time-scale update rule converge to a local nash equilibrium. arXiv 2017, arXiv:1706.08500. [Google Scholar]
  37. Ronneberger, O.; Fischer, P.; Brox, T. U-net: Convolutional networks for biomedical image segmentation. In Proceedings of the Medical Image Computing and Computer-Assisted Intervention–MICCAI 2015: 18th International Conference, Munich, Germany, 5–9 October 2015; Proceedings, Part III 18. pp. 234–241. [Google Scholar]
Figure 1. The overall framework of our proposed EHFP-GAN model. It consists of two modules, edge reconstruction and QR code reconstruction. The edge reconstruction module adopts an encoder–decoder architecture to predict the restored edge map based on the input corrupted QR code image and its Canny edge. The QR code reconstruction module uses a multi-scale feature Unet, which utilizes a Hierarchical Feature Pyramid (HFP) Block for cross-scale feature fusion by extracting multi-scale features through the encoder and progressively restoring spatial resolution through the decoder. The input image enhanced by edge reconstruction is concatenated with the predicted edge feature and fed into the QR code reconstruction module to output the final restored result.
Mathematics 11 04349 g001
Figure 2. Architecture diagram of HFP Block.
Mathematics 11 04349 g002
Figure 3. Bar chart of QR code recognition rates for compared models.
Mathematics 11 04349 g003
Figure 4. Line chart of image quality metrics (PSNR, SSIM, FID, L1) for models.
Mathematics 11 04349 g004
Figure 5. Qualitative comparison of image restoration results: (a) masked QR code, (b) Pconv, (c) AOT-GAN, (d) Unet, (e) ours, (f) original QR code.
Mathematics 11 04349 g005
Figure 6. Image restoration results of EHFP-GAN under different hole ratios: (a) QR code with mask, (b) detected edges, (c) restored by EHFP-GAN, (d) original QR code.
Mathematics 11 04349 g006aMathematics 11 04349 g006b
Table 1. Quantitative comparisons of the proposed EHFP-GAN with representative comparative models. ↓ Lower values indicate better performance, while ↑ higher values denote improved results. Best and second best outcomes are highlighted and underlined, respectively.
Masking RateMasked QrcodePConv [17]AOT-GAN [15]Unet [37]EHFP-GAN
RR↑1–10%31.45%41.65%79.45%89.3%95.35%
10–20%2.00%4.65%35.9%51.4%67.05%
20–30%0.00%0.10%6.62%13.2%24.45%
30–40%0.00%0.05%0.70%1.25%4.85%
40–50%0.00%0.00%0.03%0.05%0.10%
50–60%0.00%0.00%0.00%0.00%0.00%
RANDOM6.22%8.33%22.56%25.61%31.94%
PSNR↑1–10%18.45618.81726.86729.73433.385
10–20%12.9113.32317.88220.22623.103
20–30%10.45110.89213.90515.81817.905
30–40%8.9779.43911.40613.17414.807
40–50%7.8668.3339.68911.46512.569
50–60%6.9257.4147.7519.86610.315
RANDOM10.92111.32114.53216.70318.591
SSIM↑1–10%0.9510.9510.990.990.996
10–20%0.8690.8710.9510.9480.966
20–30%0.7810.7870.8930.8810.913
30–40%0.7020.7140.8240.7990.837
40–50%0.6220.6410.7480.7130.735
50–60%0.5440.5730.6240.6010.569
RANDOM0.7460.7550.8380.8230.837
FID↓1–10%0.5040.8220.0550.0290.017
10–20%2.5432.8120.2810.1590.093
20–30%6.2954.5750.850.5120.34
30–40%11.386.1871.9141.2841.012
40–50%18.2019.3543.7842.7242.817
50–60%34.97818.64611.2419.70115.284
RANDOM10.465.642.5451.8312.452
L1(10−2)↓1–10%0.0290.0220.0090.0070.005
10–20%0.0710.0560.0250.0230.016
20–30%0.1180.0930.0520.0490.037
30–40%0.1630.1280.0860.0830.067
40–50%0.2090.1640.1240.1220.108
50–60%0.2570.2010.1870.1770.179
RANDOM0.1410.1110.080.0760.068
Table 2. Quantitative results of ablation experiment.
Edge-NetHFP BlockDC BlockRR↑PSNR↑SSIM↑FID↓L1↓
13.50%11.4340.7815.6450.106
41.45%21.1240.9140.4110.037
44.80%21.5880.9260.2580.033
47.05%22.0830.9270.2840.032
Disclaimer/Publisher’s Note: The statements, opinions and data contained in all publications are solely those of the individual author(s) and contributor(s) and not of MDPI and/or the editor(s). MDPI and/or the editor(s) disclaim responsibility for any injury to people or property resulting from any ideas, methods, instructions or products referred to in the content.

