Abstract
Traditional machine learning sequence models, such as RNN and LSTM, can solve sequential data problems with the use of internal memory states. However, the neuron units and weights are shared at each time step to reduce computational costs, limiting their ability to learn time-varying relationships between model inputs and outputs. In this context, this paper proposes two methods to characterize the dynamic relationships in real-world sequential data, namely, the internal time-varying sequence model (ITV model) and the external time-varying sequence model (ETV model). Our methods were designed with an automated basis expansion module to adapt internal or external parameters at each time step without requiring high computational complexity. Extensive experiments performed on synthetic and real-world data demonstrated superior prediction and classification results to conventional sequence models. Our proposed ETV model is particularly effective at handling long sequence data.
MSC:
68U99
1. Introduction
Deep neural networks (DNNs) are representation-learning techniques composed of multiple layers equipped with weights, biases, and activation functions, each learning a simple but non-linear function. These layers transform the representation at one level into a higher, more abstract representation [1]. The composition of all units is thus capable of representing complex structures and automatically identifying the data features appropriate for a given task [2]. With models such as convolutional neural networks, autoencoders, and transformers, deep learning offers new possibilities over many traditional methods. The vast potential of neural networks extends to the processing of sequential data, where recurrent neural networks have achieved benchmark performances in numerous fields. Recurrent neural networks (RNNs) are special types of neural networks that involve embedded loops that allow information to be passed from one time step to the next while maintaining information from previous elements in the sequence [3]. By capturing the dependency between data points, RNNs offer new possibilities over traditional DNNs. In application, sequential neural networks have shown great performance in machine translation problems [4,5], lexical domain classification [6], and speech recognition [7].
Despite their wide range of applications, RNNs still have some drawbacks when processing sequential data [8,9]. One common characteristic shared by simple RNN and many of its variants like long short-term memory (LSTM) [10], is that the weight parameters at each neuron unit are the same for different time steps. This feature offers many benefits: we may train much fewer parameters for each RNN model, resulting in significantly lower computational costs; by applying the same statistical mapping to every hidden state information from previous time steps, we reduce the problem of overfitting. However, this constrains its ability to learn data whose features (trend, mean, etc.) change over time, as is often the case in real-world domains.
In this paper, we propose a novel time-varying sequence neural network structure that enables the parameters of sequence models to change dynamically over time steps without high computational complexity. The input sequence data at each time step is processed with different weights to ensure a flexible dynamic relationship between the input and output. Our approach features a combination of basis expansion techniques commonly used in functional data analysis (FDA) [11] to produce the unique time-varying weight matrix. In more detail, we make the following contributions:
- We propose an architecture that incorporates functional data analysis to capture the dynamic hidden state information with respect to time. The use of basis expansion techniques also improves prediction smoothness in the absence of historical observations;
- Rather than having a handful of distinct parameters between different time steps, our time-varying sequence models are computationally efficient, and the numbers of trainable parameters do not scale up with sequence length;
- Evaluating the performance on four types of tasks (many-to-many prediction, many-to-one prediction, binary classification, and multi-class classification), our proposed methods show superior performance over existing RNN and LSTM in all categories on both synthetic and real-world datasets, particularly for long sequence data.
2. Background and Related Work
In this section, we introduce the background and review related works from two aspects: basis expansion in functional data analysis and the development of recurrent neural networks.
2.1. Functional Data Analysis
The sample observation data collected in many fields show an obvious functional characteristic (i.e., smoothness, shape) in the data space. When analyzing functional data, the observed data (function) is regarded as a whole rather than a string of numbers, which is called functional data analysis (FDA) [12,13]. Essentially, functional data is infinite-dimensional, which offers a rich source of information, but also presents many challenges to data analysis and research.
Functional data is generally processed using basis functions [14]. Almost any function can be represented as a linear combination of many other types of functions. This means that, when provided with a sufficiently flexible set of basis functions , we need only find a suitable set of coefficients that multiply the basis functions to accurately represent the desired function. A basis function system consists of known functions that are independent of each other and have the property that any functional data can be approximated by using enough -weighted or linear combinations of these basis functions [15]. Here, is considered as a basis system for .
2.2. Recurrent Neural Networks
Recurrent neural networks have received increasing attention due to their ability to handle sequence data. The recurrent structure allows them to effectively extract temporal correlations [16], which is infeasible for traditional neural networks. Their weight-sharing design can greatly reduce the amount of training computation and ensure high learning efficiency. However, because the internal structure of RNNs is simple, there can be problems of gradient disappearance and explosion [17,18]. When processing long sequence data, the RNN may lose the ability to learn long-distance information. To solve this problem, a gated activation function was introduced to memorize long-term information, resulting in a series of RNN variants, such as Long Short Term Memory (LSTM) [10] and Gated Recurrent Unit (GRU) [4]. LSTM outperforms the traditional RNN and achieves great success in long sentence data [19]. As compared to LSTM, GRU has an equivalent performance but requires fewer parameters. Besides the gated mechanisms, there are other approaches to solving the length dependence problem [20,21,22], such as the CW-RNN [23], which divides the hidden layer into several modules that are updated at different rates.
Recently, several approaches have been proposed to address the issue of exploding and vanishing gradients by combining RNNs with statistical theory. Since the Fourier transformation [24] is a powerful tool in time series analysis that can decompose time series data into components with varied frequencies, there are practices that incorporate the Fourier transformation into recurrent neural networks. For instance, inspired by the similarity between recurrent neural networks and discrete Fourier transformation (DFT) in time series analysis, Zhang et al. [25] proposed Fourier Recurrent Network (ForeNet) that uses diagonal transition matrices to feature information updates between hidden layers. However, one drawback of this approach is that the predefined weights may not be adequate to capture the dynamic change data. Thus, there is a need for an algorithm that can model complex time-varying characteristics of time series [26].
Another approach to stabilizing network gradient is Fourier Recurrent Unit (FRU) [27]. The idea of an FRU is similar to that of a Statistical Recurrent Unit (SRU) [28], but instead of having the weight decay exponentially over time like SRU, FRU utilizes the expressive power of Fourier basis to summarize the information from previous states. However, FRU does not fully exploit Fourier basis to capture the temporal nature of (nonstationary) time series. Moreover, both ForeNet and FRU have not explored other expressive basis functions that are commonly used in functional data analysis, such as monomial and B-spline basis [29].
Some models automate time series forecasting using a fully ML-based framework, while preserving the interpretability of statistical models. The Neural Basis Expansion Analysis [30] proposed by Oreshkin et al. stacks blocks of fully connected (FC) [31] layers to learn a hierarchy of basis expansion coefficients in both forecasting and back-casting directions. Each deeper block computes the difference between the back-casting summary and the actual input series, and generates additional ensemble forecasting. This methodology achieved state-of-the-art performance over several univariate time series prediction tasks. However, this approach is limited to univariate time series forecasting, and we are interested in broader applications that can be addressed by RNNs.
3. Method
3.1. Basis Expansion Matrix
In this subsection, we construct the basis expansion matrix used for the later time-varying sequence model. Basis expansion is a technique that approximates/represents a function as a linear combination of basis functions. The goal of basis expansion is to choose a set of bases such that their span includes a good approximation of the smoothest function. To reflect the underlying structure in the sample data, they must be flexible enough to exhibit the desired curvature while also being close to linear when necessary [32]. Further, they should be easy to compute and differentiate as frequently as required for computational reasons. A generic function usually has the following form:
where are the predefined basis functions of [33,34] and are the coefficients related to . It has the property that any function can be arbitrarily approximated by taking a weighted sum or linear combination of enough q of these basis functions. Every variable parameter in a time-varying matrix can be regarded as a function approximated by a basis expansion. Therefore, the basis expansion can be used to construct a dynamically changing matrix. The dimension of the basis expansion matrix is completely determined by a parameter matrix Q and the basis function matrix . For example, if we need to generate a basis expansion matrix with dimension , we only need to adjust the dimensions of matrix B and matrix Q as follows:
is the basis expansion matrix at time step , is a basis function matrix, and Q is the corresponding coefficient matrix. The format of and Q can be written as:
is determined by Q and :
can be chosen from basis functions such as Fourier and B-spline, q is the number of basis functions, and h is the number of hidden units used in sequential neural networks. We can change the dimension of Q to achieve the basis expansion matrix of various dimensions. Each element in the basis expansion matrix can be considered as a dynamic parameter that changes with time via .
3.2. Internal Time-Varying Sequence Model
For a traditional RNN, network parameters are shared at each time step to reduce the computational cost. Specifically, the hidden state at time step is updated as follows
where the previous hidden state is first concatenated with the input data at time , then multiplied with the weight matrix W. d is the number of features of the input sample and h is the number of hidden units. The static weight W indicates that the relationship between input and output remains constant over time.
To characterize the dynamic nature of the underlying data, we use the basis expansion derived in Section 3.1 to construct a time-varying parameter matrix whose computational complexity does not increase proportionally to the sequence length. Specifically, we define the dynamic parameter W and the new RNN formula as:
As shown in Figure 1, W is a time-dependent parameter inside the RNN cell;n we call this an internal time-varying recurrent neural network (ITV-RNN).
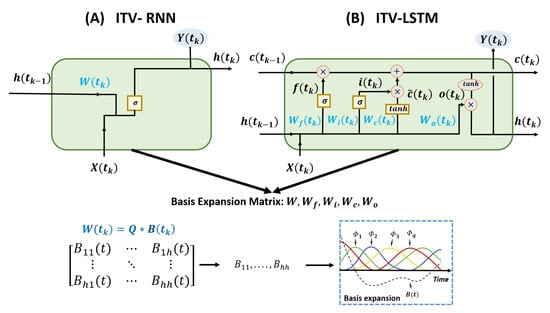
Figure 1.
Internal time-varying models. The internal weights of RNN and LSTM cells are updated using the basis expansion matrix.
Similarly, we can design an internal time-varying LSTM (ITV-LSTM) [35]. A typical structure of LSTM consists of four gates to discard and retain memory information; the weights of each gate are shared across each time step. To make this a time-varying sequence model, parameters , and are defined as dynamic variables that change over time. As shown in Equation (6), we introduced four parameters , and to control the forget, input, modulation, and output gates, respectively.
3.3. External Time-Varying Sequence Model
As LSTM is more complex than RNN with four gate structures, one can choose to change one or multiple gate parameters using basis expansion matrix. We have 15 options for different permutations and combinations. In our experiments, we sometimes obtained good results by updating only one gate with basis expansion matrix. Considering that the four gates interact with each other, it is hard to evaluate which gate plays a more important role in the overall performance of memory information processing. On the other hand, updating all four gates to some extent increases the training difficulty and the computational complexity. Since the basis expansion matrix added inside RNN and LSTM cells affects the output memory states and , we can instead directly update hidden states to achieve satisfactory performance as well as improve overall efficiency.
In order to gain time-varying memory states, the basis expansion matrix can be added between cells (see Figure 2), which will not affect internal information states inside the cell. Thus, we design external time-varying sequence models for RNN (ETV-RNN) and LSTM (ETV-LSTM), as shown in Equations (7) and (8).
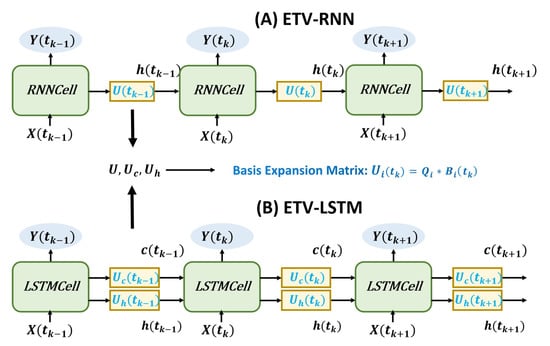
Figure 2.
External time-varying models. The external weights between RNN and LSTM cells are updated using the basis expansion matrix.
Given that LSTM has a cell state memory channel in addition to the hidden layer state, we add basis expansion matrices and to both channels. This ETV-LSTM can capture dynamic relationships between input and output data and greatly improves prediction accuracy.
To reflect the model complexity, we measure the number of trainable parameters (i.e., matrices W and Q) of ITV and ETV models. If we train an RNN or LSTM model whose parameters are not shared between neuron units, the number of parameters will be proportional to the sequence length, written as or . Here, T is the sequence length, h is the number of hidden units, and d is the size of input features. By contrast, the numbers of trainable parameters of ITV-RNN, ETV-RNN, ITV-LSTM, and ETV-LSTM are , , , and , respectively. Compared to the sequence length T that can range from 20 to 1000 or even higher, the basis function number q is usually chosen between 5∼10 to achieve satisfactory performance for most experiments. Therefore, the parameter numbers of our proposed ITV and ETV models do not scale up with the sequence length, while still capturing the time-varying relationships between model inputs and outputs.
4. Experiments
In this section, both simulated and real data are used to evaluate the performance of our proposed methods, including ETV-RNN, ETV-LSTM, ITV-RNN, and ITV-LSTM. In particular, we conducted four types of experiments, including many-to-one regression, many-to-many regression, binary classification, and multiclass classification tasks.
We employed a single-layer network structure for internal and external time-varying sequence models. The hyperparameters and experimental settings varied with different experiments to achieve the optimal prediction. Specifically, we used five basis functions for most experiments. The number of hidden units ranged between 16∼32, and the batch size ranged between 32∼256. Each model was trained for 1000∼5000 epochs until the loss stabilized. We used the Adam optimizer and employed a decay learning rate. The initial learning rate was set to 0.001∼0.01, decreasing by 10% for every 10 epochs. All experiments were performed on NVIDIA RTX 3090 Ti GPU with 24GB RAM. The code and data are available from https://github.com/chenm19/TimeVaryingSeqModel (accessed on 15 November 2022).
4.1. Simulation Studies
4.1.1. Datasets Generation
For the simulation studies, we generated curves and sequentially sampled time points on the curve to form sequence data of different lengths. The simulated data were generated by a linear combination of functions as follows:
where coefficient ∼; function is a function of time that has no deterministic trends. p is the number of functions, T is the sequence length, and n is the sample size. Since our goal was to predict future progression based on previous sequence data, we used the sample data from the previous time point as input X, and the sample data from the next time point as output Y.
To fully test our method, we can vary sample size n, sequence length T, and function numbers p to get rich simulation data. Here we used B-spline as our function . In total, nine datasets were obtained under different settings, as summarized in Table 1.

Table 1.
Eight simulated datasets of varying sequence lengths, sample sizes, and function numbers.
4.1.2. Experimental Results and Analysis
We first use Data S9 as an example to compare the correct data with the results predicted by the models. Figure 3a shows that the time-varying RNN models provide a closer approximation to the real sequence than the traditional RNN. The loss trajectories in Figure 3b exhibit a much faster convergence rate. Similarly, for time-varying LSTM models, we observed better performance than the original LSTM from Figure 3c,d. The use of basis functions provides smoothness in absence of historical observations, as evident in the obvious improvement at the beginning of time series data. To mimic real-world data, we added Gaussian noise () to the simulation data and evaluated model performance. As shown in Figure 4, our ITV and ETV models achieved more accurate predictions than the original sequence models. Note that for ITV-LSTM, the weights of the four gates may interact with each other and result in less desirable predictions compared to ETV-LSTM. Thus, ITV-LSTM is not considered for comparison in the following experiments.
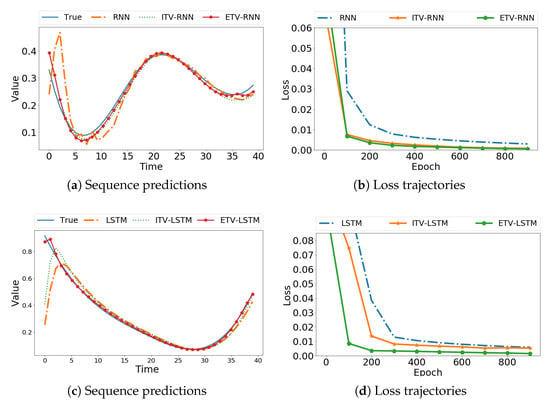
Figure 3.
Prediction of smooth noise-free simulation data using the original model, ITV, and ETV, respectively.
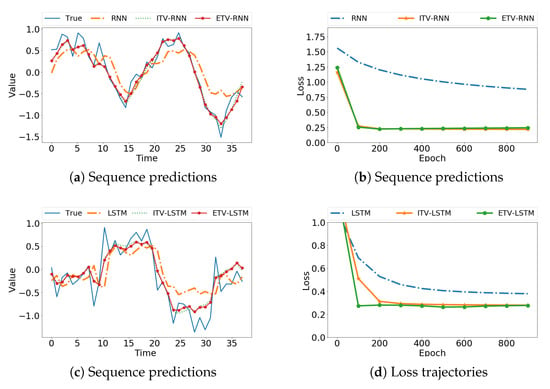
Figure 4.
Prediction of noisy simulation data (Gaussian noise, ) using the original model, ITV, and ETV, respectively.
We are also interested in other factors that may influence our model performance. First, we used the sample sequence length as a variation factor to compare the MSE results of ITV-RNN, ETV-RNN, and ETV-LSTM. In Figure 5a, it is evident that our models have much lower MSE than conventional models under different sequence lengths ranging from 10 to 300. Figure 5b further illustrates the overall trend of MSE improvement. We can see that our model accuracy was boosted when the sequence length increases from 10 to 50, then stabilized between 65∼85% when the sequence length is greater than 100. This pattern is consistent across all three methods (ITV-RNN, ETV-RNN, and ETV-LSTM), suggesting that they have great advantages over original RNN and LSTM in processing long sequence data. This may be explained that more dynamic weight matrices will be generated for each time step of longer sequences. Compared to the original RNN and LSTM using the same weight matrix, our models provide a more accurate reflection of the input data as well as a more flexible relationship between input data and output data.
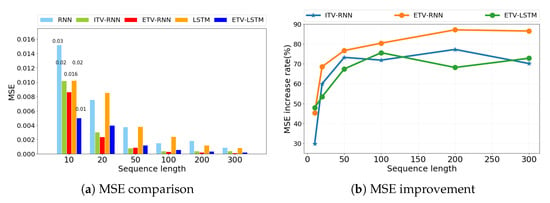
Figure 5.
The impact of different sequence lengths from simulation data on model performance (RNN, ITV-RNN, ETV-RNN, LSTM, ETV-LSTM).
Our next concern is whether the type of basis functions that constitute the basis expansion matrix affect the performance of our model. We evaluated three basis functions—B-spline, Fourier, and monomial—to construct the basis expansion matrix and applied them to ITV-RNN, ETV-RNN, and ETV-LSTM methods, respectively. In Figure 6, the loss curves show no obvious difference between the types of basis function across three methods. Compared with the original model, they all have a considerable improvement in loss convergence rate and prediction accuracy.

Figure 6.
The impact of basis function types (B-spline, Fourier, and monomial) on model performance using Data S9. The shaded region denotes the loss range of five-fold cross-validation and the solid line is the average loss.
Table 2 and Table 3 summarize the overall performance of RNN and LSTM models on eight simulated datasets. The experiments in the table were all carried out using five-fold cross-validation. As we can see, ETV-RNN and ETV-LSTM have the best performance compared to original models, with a stable 30% improvement in mean square error (MSE) across all experimental groups. Moreover, the range of fluctuations (variance) is smaller, indicating that the model stability was also improved. On Data S2 and Data S6 with longer sequence lengths, ETV-RNN and ETV-LSTM are an order of magnitude better than the original RNN and LSTM, respectively. This suggests that the time-varying sequence models can be more effective when dealing with long sequence data. As we analyzed before, ETV-LSTM is more accurate and efficient than ITV-LSTM, indicating that the external dynamic parameter module is preferable.

Table 2.
Predictive performance of RNN, ITV-RNN, and ETV-RNN on different simulated datasets. The average MSE and variance were obtained using five-fold cross-validation.

Table 3.
Predictive performance of LSTM, ITV-LSTM, and ETV-LSTM methods on different simulated datasets. The average MSE and variance were obtained using five-fold cross-validation.
4.2. Application to Real Datasets
On real data, we evaluated ETV-RNN and ETV-LSTM over both regression and classification tasks. The ITV models were not considered due to less satisfying results from simulated studies.
4.2.1. Datasets Description
We prepared a large number of real datasets for experiments in two domains: forecasting of time series data and classification of time series data. According to the output formats, the prediction tasks are divided into many-to-many regression and many-to-one regression. The classification tasks are separated into binary classification and multiclass classification tasks. For each task, we selected datasets with varied sample sizes, sequence lengths, and feature numbers to test the generalizability of our model. While many-to-many and many-to-one prediction tasks share the same datasets, the difference is that many-to-many predicts the next data point for each previous data point and many-to-one only predicts the last time point data.
- I
- Regression datasets
Data R1 Stock Price: We collected Twitter Inc. stock closing prices from 7 September 2013 to 6 April 2022 as our dataset. Taking every 70 days as a sample, a total of 2047 sets of sample data were obtained.
Data R2 Semiconductor Fabrication: Sensors convert recorded process information into sequence data during semiconductor manufacturing. We obtained 6402 samples and each sequence is 151 in length.
Data R3 Wind Power: We downloaded daily wind power generation data from Belgian grid company Elia. The power data is recorded every fifteen minutes from 31 December 2021 to 12 May 2022. We took every 250 data as a sequence and generated 12,513 samples.
- II
- Binary classification datasets
Data R4 Puree Data: The puree was analyzed by a food spectrograph to obtain sequence data in the form of infrared spectra. There are two types of puree data: strawberry puree and non-strawberry puree (adulterated strawberries and other fruits). The sample size is 983 and the sequence length is 253.
Data R5 Trigonometric Data: Sin and cos functional data were gathered and added with a normal distribution noise of . The sample size is 2000 and the sequence length is 50.
Data R6 Electrical Load: The REFIT (Personalised Retrofit Decision Support Tools for UK Homes using Smart Home Technology) dataset includes data from 20 households from the Loughborough area over the period 2013–2014. The first data class is household usage of electricity. The second data class is electricity load of tumble dryers and washing machines. The sample size is 2850 with a sequence length of 301.
Data R7 Semiconductor Data: We acquired semiconductor process information recorded by sensors during semiconductor fabrication. The data is divided into two categories: normal processes and abnormal processes. The sample size is 7164 and the sequence length is 152.
- III
- Multi-classification datasets
Data R8 Face Data: Face outlines from 14 graduate students were mapped to one-dimensional series data, constituting a 14-class problem. The sample size is 560 and the sequence length is 131.
Data R9 Trigonometric Data: Sin, cos, and tan functional data were collected and combined with noise following a normal distribution of . The sample size is 3000 and the sequence length is 50.
Data R10 Consumer Electricity Behavior: There are seven consumer behavior figures on how consumers use electricity in their homes to help reduce the UK’s carbon footprint. The data was recorded every two minutes for 251 households over a month. The sample size is 16,000 with a sequence length of 96.
4.2.2. Experimental Results and Analysis
We used mean square error as the regression metric and accuracy as the classification metric. Figure 7 shows the many-to-many regression results for Twitter’s stock price. The prediction results of ETV-RNN and ETV-LSTM are closer to real stock prices. It is also obvious that the original RNN and LSTM predictions have a large deviation from the real sequence curve, especially for the 200th–300th days and 1000th–1500th days.
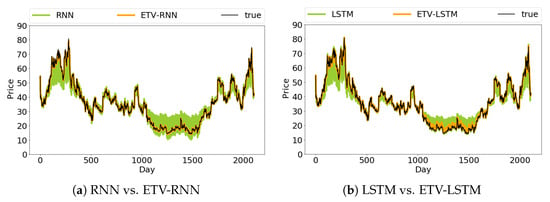
Figure 7.
Many-to-many stock price prediction from methods RNN, ETV-RNN, LSTM, and ETV-LSTM.
In ETV-RNN and ETV-LSTM, the basis expansion matrix Q is of size , which leads us to examine the model effect under h (the number of hidden units) and q (the number of basis functions), which constitute the matrix dimension. Here, we use stock price as a testing dataset and vary q and h values to check the MSE changes, see Figure 8. From Figure 8a, the number of h is strongly correlated to the performance of ETV-RNN and ETV-LSTM. A larger h value provides better model accuracy, consistent across all methods. It was also found that ETV-RNN with fewer hidden units can achieve the same accuracy as the original RNN using more hidden units, which is true for ETV-LSTM as well. Although q is an important parameter in Equation (1), it only jointly controls the column dimension of U, which is less important compared to h. From Figure 8b, we can confirm our conjecture that the value of q has little effect on ETV-RNN and ETV-LSTM accuracy. Moreover, we observed that a small number of basis functions (e.g., ) is sufficient to achieve good prediction accuracy.
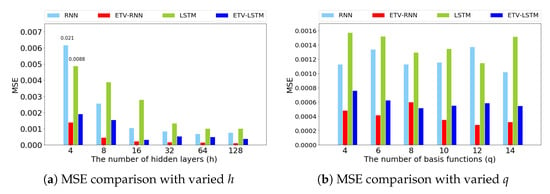
Figure 8.
The influence of the number of hidden units and the number of basis functions on the many-to-many stock prediction results.
Figure 9a,b present all model accuracies of binary and multiclass classification tasks. We achieved better classification performance with our time-varying models than with original models, especially for Data R6 and R10. In Figure 9c,d, we plot the ROC curves of the binary classification on Data R4 and the multi-classification task Data R8. Both ETV-RNN and ETV-LSTM can completely wrap the corresponding curves of RNN and LSTM, respectively. Both ETV-RNN and ETV-LSTM yield better classification results.
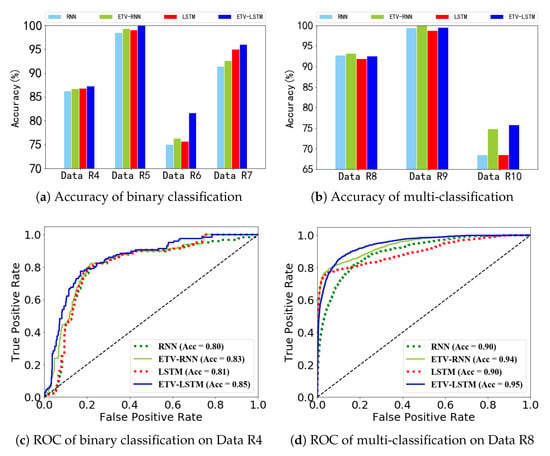
Figure 9.
Comparison of classification accuracy and ROC curves over RNN, ETV-RNN, LSTM, and ETV-LSTM.
Table 4 summarizes all methods’ performance on real-world datasets. The average MSE, accuracy, and variances in the table are obtained through five-fold cross-validation. According to the results, ETV-RNN and ETV-LSTM outperform original RNN and LSTM, respectively, for all tasks in terms of prediction accuracy and stability, providing evidence that our proposed time-varying sequence neural networks are suitable for various forms of real data on both regression and classification tasks. Especially for the regression task, we obtained a significant improvement, with at least 50% higher accuracy. In both prediction tasks using Data R1 and Data R2, our models achieved more than one order of magnitude improvement.

Table 4.
Prediction performance of different methods on 10 real datasets (MSE for regression and accuracy for classification over five-fold cross-validation).
5. Conclusions
This work proposes time-varying sequence models to deal with nonstationary sequence data. With the use of basis expansion in statistics, we constructed a basis expansion matrix that can change with time to characterize dynamic relationships between input and output data. The basis expansion matrices can be embedded in two ways. When added internally, sequence models with complex gate structures (such as LSTM) may lose their original functions of filtering and preserving sequence information. Adding the basis expansion matrix between cell units neither affects the state inside the cell nor imposes a computational burden, thus producing a stable lifting effect.
Experimental results on both synthetic and real datasets demonstrated that ETV-RNN and ETV-LSTM have better performance in accuracy and convergence rates compared with the original RNN and LSTM, respectively. We also found that time-varying sequence models are highly effective for long sequence data. By using basis expansion matrices to generate dynamic weights for long sequence data, we can better illustrate the dynamic relationship between inputs and outputs, and the time complexity remains almost the same.
Author Contributions
Conceptualization, methodology, software, and writing (review and editing): S.J., J.Z., Y.F., J.L., H.L., C.Y. and M.C. All authors have read and agreed to the published version of the manuscript.
Funding
This research received no external funding.
Institutional Review Board Statement
Not applicable.
Informed Consent Statement
Not applicable.
Data Availability Statement
The data presented in this study are openly available in https://github.com/chenm19/TimeVaryingSeqModel (accessed on 15 November 2022).
Conflicts of Interest
The authors declare no conflict of interest.
References
- Bengio, Y.; LeCun, Y. Scaling learning algorithms towards AI. Large-Scale Kernel Mach. 2007, 34, 1–41. [Google Scholar]
- Bartlett, P.L.; Montanari, A.; Rakhlin, A. Deep learning: A statistical viewpoint. Acta Numer. 2021, 30, 87–201. [Google Scholar] [CrossRef]
- Rumelhart, D.E.; Hinton, G.E.; McClelland, J.L. A general framework for parallel distributed processing. Parallel Distrib. Process. Explor. Microstruct. Cogn. 1986, 1, 26. [Google Scholar]
- Cho, K.; Van Merriënboer, B.; Gulcehre, C.; Bahdanau, D.; Bougares, F.; Schwenk, H.; Bengio, Y. Learning phrase representations using RNN encoder-decoder for statistical machine translation. arXiv 2014, arXiv:1406.1078. [Google Scholar]
- Bahdanau, D.; Cho, K.; Bengio, Y. Neural machine translation by jointly learning to align and translate. arXiv 2014, arXiv:1409.0473. [Google Scholar]
- Ravuri, S.; Stolcke, A. A comparative study of recurrent neural network models for lexical domain classification. In Proceedings of the 2016 IEEE International Conference on Acoustics, Speech and Signal Processing (ICASSP), Shanghai, China, 20–25 March 2016; IEEE: New York, NY, USA, 2016; pp. 6075–6079. [Google Scholar]
- Chan, W.; Jaitly, N.; Le, Q.; Vinyals, O. Listen, attend and spell: A neural network for large vocabulary conversational speech recognition. In Proceedings of the 2016 IEEE International Conference on Acoustics, Speech and Signal Processing (ICASSP), Shanghai, China, 20–25 March 2016; IEEE: New York, NY, USA, 2016; pp. 4960–4964. [Google Scholar]
- Pascanu, R.; Mikolov, T.; Bengio, Y. On the difficulty of training recurrent neural networks. In Proceedings of the 2013 International Conference on Machine Learning, Miami, FL, USA, 4–7 December 2013; pp. 1310–1318. [Google Scholar]
- Bengio, Y.; Simard, P.; Frasconi, P. Learning long-term dependencies with gradient descent is difficult. IEEE Trans. Neural Netw. 1994, 5, 157–166. [Google Scholar] [CrossRef] [PubMed]
- Hochreiter, S.; Schmidhuber, J. Long short-term memory. Neural Comput. 1997, 9, 1735–1780. [Google Scholar] [CrossRef] [PubMed]
- Yao, J.; Mueller, J.; Wang, J.L. Deep Learning for Functional Data Analysis with Adaptive Basis Layers. In Proceedings of the 2021 International Conference on Machine Learning, Brisbane, Australia, 26–27 June 2021; pp. 11898–11908. [Google Scholar]
- Ramsay, J.O. When the data are functions. Psychometrika 1982, 47, 379–396. [Google Scholar] [CrossRef]
- Ramsay, J.O.; Dalzell, C.J. Some Tools for Functional Data Analysis. J. R. Stat. Soc. Ser. B (Methodol.) 1991, 53, 539–561. [Google Scholar] [CrossRef]
- Bickel, P.; Diggle, P.; Fienberg, S.; Gather, U. Springer Series in Statistics; Springer: Berlin/Heidelberg, Germany, 2005. [Google Scholar]
- Levitin, D.J.; Nuzzo, R.L.; Vines, B.W.; Ramsay, J. Introduction to functional data analysis. Can. Psychol./Psychol. Can. 2007, 48, 135. [Google Scholar] [CrossRef]
- Zhang, Y.; Dai, H.; Xu, C.; Feng, J.; Wang, T.; Bian, J.; Wang, B.; Liu, T.Y. Sequential click prediction for sponsored search with recurrent neural networks. In Proceedings of the 2014 AAAI Conference on Artificial Intelligence, Québec City, QC, Canada, 27–31 July 2014; Volume 28. [Google Scholar]
- Mnih, A.; Hinton, G. Three new graphical models for statistical language modelling. In Proceedings of the 24th International Conference on Machine Learning, Corvalis, OR, USA, 20–24 June 2007; pp. 641–648. [Google Scholar]
- Hochreiter, S. The vanishing gradient problem during learning recurrent neural nets and problem solutions. Int. J. Uncertain. Fuzziness Knowl.-Based Syst. 1998, 6, 107–116. [Google Scholar] [CrossRef]
- Chung, J.; Gulcehre, C.; Cho, K.; Bengio, Y. Empirical evaluation of gated recurrent neural networks on sequence modeling. arXiv 2014, arXiv:1412.3555. [Google Scholar]
- Zhang, Y.; Chen, G.; Yu, D.; Yao, K.; Khudanpur, S.; Glass, J. Highway long short-term memory rnns for distant speech recognition. In Proceedings of the 2016 IEEE International Conference on Acoustics, Speech and Signal Processing (ICASSP), Shanghai, China, 20–25 March 2016; IEEE: New York, NY, USA, 2016; pp. 5755–5759. [Google Scholar]
- Mikolov, T.; Deoras, A.; Povey, D.; Burget, L.; Černockỳ, J. Strategies for training large scale neural network language models. In Proceedings of the 2011 IEEE Workshop on Automatic Speech Recognition & Understanding, Waikoloa, HI, USA, 11–15 December 2011; IEEE: New York, NY, USA, 2011; pp. 196–201. [Google Scholar]
- Kim, J.; El-Khamy, M.; Lee, J. Residual LSTM: Design of a deep recurrent architecture for distant speech recognition. arXiv 2017, arXiv:1701.03360. [Google Scholar]
- Koutnik, J.; Greff, K.; Gomez, F.; Schmidhuber, J. A clockwork rnn. In Proceedings of the 2014 International Conference on Machine Learning, Beijing, China, 21–26 June 2014; pp. 1863–1871. [Google Scholar]
- Scargle, J.D. Studies in astronomical time series analysis. III-Fourier transforms, autocorrelation functions, and cross-correlation functions of unevenly spaced data. Astrophys. J. 1989, 343, 874–887. [Google Scholar] [CrossRef]
- Zhang, Y.Q.; Chan, L.W. ForeNet: Fourier Recurrent Networks for Time bleries Prediction. In Proceedings of the 7th International Conference on Neural Information Processing, Taejon, Korea, 14–18 November 2000. [Google Scholar]
- Wei, W.W. Time Series Analysis. 2013. Available online: https://academic.oup.com/edited-volume/41363/chapter-abstract/352586926?redirectedFrom=fulltext&login=false (accessed on 15 November 2022).
- Zhang, J.; Lin, Y.; Song, Z.; Dhillon, I. Learning long term dependencies via fourier recurrent units. In Proceedings of the 2018 International Conference on Machine Learning, Jinan, China, 26–28 May 2018; pp. 5815–5823. [Google Scholar]
- Oliva, J.B.; Póczos, B.; Schneider, J. The statistical recurrent unit. In Proceedings of the 2017 International Conference on Machine Learning, Sydney, Australia, 6–11 August 2017; pp. 2671–2680. [Google Scholar]
- Ramsay, J.O. Multilevel modeling of longitudinal and functional data. In Modeling Intraindividual Variability with Repeated Measures Data: Methods and Applications; Psychology Press: London, UK, 2002; pp. 87–102. [Google Scholar]
- Oreshkin, B.N.; Carpov, D.; Chapados, N.; Bengio, Y. N-BEATS: Neural basis expansion analysis for interpretable time series forecasting. arXiv 2019, arXiv:1905.10437. [Google Scholar]
- Shan, P.; Wang, Y.; Fu, C.; Song, W.; Chen, J. Automatic skin lesion segmentation based on FC-DPN. Comput. Biol. Med. 2020, 123, 103762. [Google Scholar] [CrossRef] [PubMed]
- Rossi, F.; Conan-Guez, B. Functional multi-layer perceptron: A non-linear tool for functional data analysis. Neural Netw. 2005, 18, 45–60. [Google Scholar] [CrossRef] [PubMed]
- Rice, J.A.; Wu, C.O. Nonparametric mixed effects models for unequally sampled noisy curves. Biometrics 2001, 57, 253–259. [Google Scholar] [CrossRef] [PubMed]
- Cardot, H.; Ferraty, F.; Sarda, P. Spline estimators for the functional linear model. Stat. Sin. 2003, 13, 571–591. [Google Scholar]
- Yu, Y.; Si, X.; Hu, C.; Zhang, J. A review of recurrent neural networks: LSTM cells and network architectures. Neural Comput. 2019, 31, 1235–1270. [Google Scholar] [CrossRef] [PubMed]
Disclaimer/Publisher’s Note: The statements, opinions and data contained in all publications are solely those of the individual author(s) and contributor(s) and not of MDPI and/or the editor(s). MDPI and/or the editor(s) disclaim responsibility for any injury to people or property resulting from any ideas, methods, instructions or products referred to in the content. |
© 2023 by the authors. Licensee MDPI, Basel, Switzerland. This article is an open access article distributed under the terms and conditions of the Creative Commons Attribution (CC BY) license (https://creativecommons.org/licenses/by/4.0/).