Abstract
The rapidly increasing trend of retinal diseases needs serious attention, worldwide. Glaucoma is a critical ophthalmic disease that can cause permanent vision impairment. Typically, ophthalmologists diagnose glaucoma using manual assessments which is an error-prone, subjective, and time-consuming approach. Therefore, the development of automated methods is crucial to strengthen and assist the existing diagnostic methods. In fundus imaging, optic cup (OC) and optic disc (OD) segmentation are widely accepted by researchers for glaucoma screening assistance. Many research studies proposed artificial intelligence (AI) based decision support systems for glaucoma diagnosis. However, existing AI-based methods show serious limitations in terms of accuracy and efficiency. Variations in backgrounds, pixel intensity values, and object size make the segmentation challenging. Particularly, OC size is usually very small with unclear boundaries which makes its segmentation even more difficult. To effectively address these problems, a novel feature excitation-based dense segmentation network (FEDS-Net) is developed to provide accurate OD and OC segmentation. FEDS-Net employs feature excitation and information aggregation (IA) mechanisms for enhancing the OC and OD segmentation performance. FEDS-Net also uses rapid feature downsampling and efficient convolutional depth for diverse and efficient learning of the network, respectively. The proposed framework is comprehensively evaluated on three open databases: REFUGE, Drishti-GS, and Rim-One-r3. FEDS-Net achieved outperforming segmentation performance compared with state-of-the-art methods. A small number of required trainable parameters (2.73 million) also confirms the superior computational efficiency of our proposed method.
Keywords:
assisting glaucoma screening; convolutional neural network; deep learning; fundus image analysis; information aggregation MSC:
68T07
1. Introduction
Ophthalmic diseases have a significant impact on the well-being of human lives. Retinal diseases are increasing at a rapid pace, worldwide [1]. Therefore, modern diagnostic solutions need to be introduced for fast and accurate ophthalmic diagnosis. Glaucoma is a publicly very common neurodegenerative disease that can cause permanent vision loss [2]. Early and accurate glaucoma screening is highly desirable for its effective treatment [2]. Typically, manual procedures and assessments are carried out by ophthalmologists for glaucoma diagnosis. These manual procedures are usually time-consuming, subjective, tedious, and error-prone. Hence, automatic methods are crucially required to assist the existing approaches.
Artificial intelligence (AI) is providing robust automation solutions to automate manual procedures [3]. AI-based models significantly contributed to the biomedical and diagnostic industry by introducing intelligent methods for delivering computer-assisted diagnosis [4]. Deep learning solved many complex diagnostic problems using convolutional neural networks (CNNs). Specifically, CNN-based semantic segmentation has a proven record in ophthalmic diagnostic support [5]. Fundus imaging is widely accepted by experts for glaucoma screening [6]. Optic cup (OC) and optic disc (OD) segmentation are performed for glaucoma detection. Glaucoma produces some morphological and structural changes in OC and OD. Segmentation of both OC and OD provides exact area and boundaries which consequently helps in glaucoma screening. Vertical cup-to-disc-ratio (V-CDR) is also a widely accepted biomarker by researchers to help in glaucoma diagnosis [7]. The ratio between the vertical diameter of OC and OD is calculated for computing V-CDR. Higher values of V-CDR refer to a high chance of glaucoma occurrence. A high-performance OC and OD segmentation is the preliminary step to obtain accurate V-CDR measures. Similarly, enlargement in the OC size which is termed cupping is also a biomarker for glaucoma diagnosis. Areas of OC and OD are computed to provide area-cup-to-disc-ratio (A-CDR) [8]. A-CDR computations also assist ophthalmologists in the glaucoma screening process. Pixel-wise segmentation of OC and OD enables the frameworks to obtain all the above-mentioned computations for assisting the glaucoma diagnosis process. Hence, accurate segmentation of OC and OD provides a solid foundation for supporting medical experts in glaucoma screening.
Many research studies proposed OC and OD segmentation for glaucoma screening. However, OC and OD segmentation is challenging because of the extensive variations in the images. This variation includes different background effects, pixel intensity values, sizes, and shapes. Specifically, the size of OC is usually quite small with unclear boundaries that make its segmentation much more challenging. Therefore, existing methods exhibited serious limitations in OC boundary predictions. Lastly, the OC and OD regions are very small compared with those of the background class and it creates a class imbalance problem that negatively impacts the learning of the network. To mitigate these challenges, a novel feature excitation-based dense segmentation network (FEDS-Net) is developed for the semantic segmentation of OC and OD. FEDS-Net is a novel development and it is not based on any other network. FEDS-Net uses feature excitation and aggregation to obtain accurate predictions for OC and OD classes. FEDS-Net also introduced abrupt feature downsampling and aggregation mechanism for expanded learning.
Many research works proposed CNNs for glaucoma diagnosis using OC and OD segmentation. Nevertheless, most of the methods employ expensive frameworks which use a large number of parameters for training. A large number of parameters’ requirements not only increases the training time but also enhances the memory requirements. To address this problem, FEDS-Net designed an efficient depth mechanism to minimize the number of parameters. FEDS-Net is evaluated using three open databases namely; REFUGE, Drishti-GS, and Rim-One-r3. The proposed network showed excellent segmentation without leveraging computational efficiency. FEDS-Net needs only 2.73 million parameters for its training.
The contribution of this work is summarized as follows:
- A novel architecture, FEDS-Net, is developed for accurate OC and OD segmentation to assist the existing glaucoma screening procedures. FEDS-Net uses feature excitation and information aggregation (IA) to significantly improve prediction accuracy.
- In FEDS-Net, rapid feature downsampling (RFD) and efficient convolutional depth (ECD) are also introduced for diverse and efficient learning, respectively.
- The proposed architecture is evaluated using three open databases: REFUGE1, Drishti-GS2, and Rim-One-r33. FEDS-Net showed excellent performance compared with state-of-the-art methods. In addition, outperforming results are obtained with a superior computational efficiency having a requirement of only 2.73 million parameters for full training.
2. Related Work
Automatic glaucoma screening is a topic of vast interest. Many research studies conducted to automate and assist the glaucoma diagnosis procedure. Existing studies can be broadly divided into handcrafted and deep feature-based methods.
2.1. Methods Based on Handcrafted Features
Many research studies used handcrafted feature-based methods for automatic glaucoma screening purposes. In this study [9], OD pixel-wise segmentation is performed using the blood vessels inpainting mechanism. Initially, a region growing approach is used and then a blood inpainting scheme is employed to detect OD region. Evaluation of the proposed model is performed using multiple databases to analyze the effectiveness of the method. Preprocessing employed in this method can be attributed as the limitation of this study [9].
Similarly, another method [10] uses texture features for the glaucoma assessment. Features were selected based using a proper feature selection structure. The proposed method of this study includes preprocessing to obtain the region of interest (ROI) [10]. In a work [11], pixels belonging to OD are detected by combining edge detection with a deformable model and Hough transform [11]. Preprocessing requirements to remove retinal vessels can be considered the limitation of this work [11].
In a study [12], pixels of OD boundary were predicted by reconstructing the morphology in fundus images. A convex hull estimation was carried out as the final step to extract the boundary of OD [12]. A dataset that needs to be used for the preprocessing of this method can be attributed as the limitation of this work [12]. Another method [13] uses principal component analysis (PCA) for the conversion of original images to a grayscale images. In this method, OD is automatically detected using mathematical morphology in combination with PCA [13]. The proposed method in [14] eliminated peripapillary atrophy for segmenting the OD area. A three-stage process pipeline based on ROI detection, edge filtering, and Hough transform is used for eliminating peripapillary atrophy [14]. Approaching the obtained results using this method requires postprocessing [14].
In [15], OD region candidates are first selected using k-means clustering. Secondly, OD area selection is finalized based on the maximum saliency. Preprocessing requirements can be attributed as the limitation of this method [15]. Similarly in [16], an expert system using an active contour approach is proposed for the OC and OD segmentation. Although this method achieves a high sensitivity in performance, however, it needs preprocessing [16]. Another study [17] proposes a combination of level set and clustering for pixel-wise OC and OD segmentation. At first, OD boundaries are roughly predicted using clustering, and segmentation results were refined with the help of a level set approach [17].
2.2. Methods Based on Deep Features
Deep learning has a vital contribution to providing robust and intelligent solutions. In many research works, deep feature-based solutions are presented almost in every field of life [18]. Deep learning-based methods are usually accepted as an effective and efficient choice for dealing with complex patterns in images and videos. Several methods are also introduced for performing segmentation tasks to detect desired features or patterns from medical images [19]. Segmentation networks provide pixel-wise predictions that help in pixel-level image analysis. Deep feature-based segmentation algorithms are extensively applied to retinal images for different disease quantification [20]. A recent study [5] presented a prompt deep light-weight vessel segmentation network (PLVS-Net) to diagnose diabetic retinopathy. PLVS-Net is based on prompt blocks that contain separable, standard, and asymmetric convolutional layers. These prompt blocks ensure improved retinal vessels segmentation with enhanced computational efficiency [5]. However, the evaluation of their method with datasets having less number of images can be attributed as the limitation of this work. Subsequently, many image processing-based automated methods used OC and OD segmentation to assist the glaucoma screening process [6]. In this work [6], a double threshold method is employed; initially, background and retinal vessels are removed and then super intensity pixels in OC and OD are segmented. Preprocessing requirements of this method can be considered as the weakness of their proposed method [6]. In ref [7], several deep feature-based methods associated with glaucoma are discussed. Along with glaucoma screening, this study also emphasizes detecting glaucoma progression [7].
Although OC and OD segmentation is considered a gold standard for computer-aided glaucoma diagnosis. Nevertheless, few methods use other features of fundus imaging to strengthen the automated diagnosis [8]. In this work [8], OD and OC segmentation process is followed by focal notch analysis of the neural rim to aid glaucoma screening. Evaluation of the proposed method with a single dataset can be attributed as the limitation of this work [8]. In a study [21], an encoder-decoder fashion architecture is used for segmenting OC and OD, simultaneously. The framework used in this study provides both image classification and segmentation outputs [21]. Comparatively poor segmentation performance for OC can be attributed as the limitation of this study [21]. Similarly in [22], optic disc segmentation is performed using a particle swarm optimization network. The segmentation performance of mask R-CNN is improved using transfer learning combined with optimization frameworks [22]. This method is limited to OD (not OC) segmentation only [22].
The method proposed in [23] refers to an attention-based mechanism for the efficient training process of the network. In this method, OD and OC refined segmentation is also achieved using a cascading approach [23]. Cascading itself can be the limitation of this method considering the case of transferring false prediction to the next stage [23]. Similarly in [24], a combination of DenseNet and a fully convolutional network is employed for segmenting fundus images for glaucoma screening. The computational efficiency of this framework is also enhanced using the feature reuse approach [24]. Limitation of this method includes preprocessing requirement and inefficient training [24]. Another method [25] employed different CNNs with DeepLabv3+ at the encoder end for segmenting OD pixels. Moreover, image-level predictions (classification) are also generated using transfer learning and pre-trained models [25]. This work shows several limitations in terms of prior requirements such as transfer learning, preprocessing, and pretrained models [25].
A few methods also used adversarial learning for assisting the glaucoma screening process [26]. In this method, the domain-shifting problem is addressed using a patch-based adversarial framework [26]. The limitation of this study can be attributed to its preprocessing and postprocessing requirements [26]. Subsequently, another method [27] based on adversarial learning is used to segment retinal vessels and OD. In this study, the famous U-Net [28] is used as the generator whereas multiple models serve for discrimination purposes in adversarial learning [27]. In another study [29], a recurrent fully convolutional mechanism is developed to overcome the problem of feature loss in CNNs. High-level information along with edge information is processed to improve the pixel-wise OC and OD segmentation performance [29]. Evaluation with a single database can be considered the limitation of this study [29].
U-Net [28] is considered a benchmark architecture, especially for medical image segmentation. Few studies reproduced and implemented U-Net on a computer for performing OC and OD segmentation [30]. The effectiveness of U-Net with limited time was analyzed in OC and OD segmentation tasks. Subsequently, another method [31] made some modifications to the standard U-Net [28] and evaluated for OC and OD segmentation. Channels used in the convolutional layers of this network were optimized for an efficient training process [31]. Preprocessing requirements can be attributed as the limitation of this work [31].
3. Material and Methods
3.1. Datasets
In our work, the proposed method is evaluated using three datasets containing fundus images for OC and OD segmentation. All three datasets, namely; REFUGE1, Drishti-GS2, and Rim-One-r33 [26] have original images with corresponding expert annotations. Sample images for the REFUGE dataset are shown in Figure 1. Rows 1 and 2 in Figure 1 represent original and groundtruth images, respectively. Pixels shown in black and gray colors of groundtruth images represent OD and OC whereas white color shows the background class. REFUGE has equally divided (400 images for each category) images for training, validation, and testing purposes. REFUGE is among the latest and most challenging datasets because of the extensive intra-dataset variations.
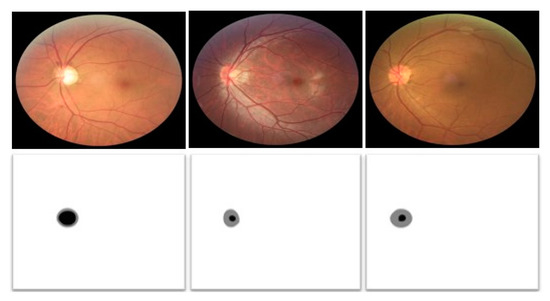
Figure 1.
Sample images from the REFUGE dataset along with expert annotation images.
In Figure 2, sample images from Rim-One-r3 and Drishti-GS datasets are shown in rows 1 and 2, respectively. Rim-One-r3 is collected by MIAG group (Spain) and it has a total of 159 fundus images with expert annotations. The Drishti-GS dataset is also one of the benchmark datasets for OC and OD segmentation. It has a total of 101 images with 50 training and 51 testing images. The OD and OC annotations for both Rim-One-r3 and Drishti-GS are provided in Figure 2b,c. Black pixels in the groundtruth images represent the background class whereas white pixels refer to desired classes (OC and OD). It is worth noting that all three datasets have extensive variations in background effects, pixel intensity values, objects (OC and OD) sizes, and illumination effects which makes its segmentation challenging. In addition, most of the images have a small-sized OC with unclear boundaries; therefore, accurate segmentation becomes even more challenging.
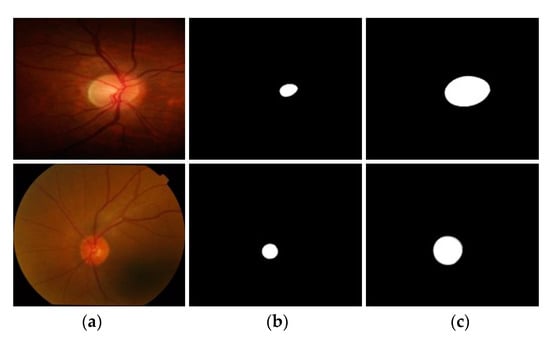
Figure 2.
Sample images from row 1: Rim-One-r3; row 2: Drishti-GS databases. (a) Original image (b) groundtruth image with OD annotation (c) groundtruth image with the OC annotation.
3.2. Proposed Method
3.2.1. Overview of the Proposed Method
OC and OD pixel-wise segmentation provides valuable analysis for glaucoma diagnosis and prognosis. Accurate segmentation of OC and OD is challenging because of the high inter and intra-datasets variations along with an indistinct area of OC. A novel architecture, FEDS-Net, is developed to overcome these challenges. An overview of the proposed framework is shown in Figure 3. Input images are fed to the network and after feature processing, the network provides a prediction mask for OC and/or OD at the output. Networks usually require a large amount of training data for optimal learning of the network. To fulfill this need, training images are resized and augmented to produce a sufficient amount of training data. FEDS-Net uses feature excitation and IA mechanism to boost the segmentation accuracy. Moreover, RFD and ECD ensure a diversified and efficient learning of the network (details are provided in the subsequent subsection). The trained model of FEDS-Net generates a prediction mask and predictions are compared with groundtruth images for results generation. Resizing the prediction mask back to the original size is carried out for a valid evaluation. Training images are used for training purposes whereas testing is performed only for unseen test split. In the prediction mask, white and black pixels represent desired (OC and/or OD) and undesired (background) classes, respectively, whereas FEDS-Net provides segmented OC and/or OD at the output.
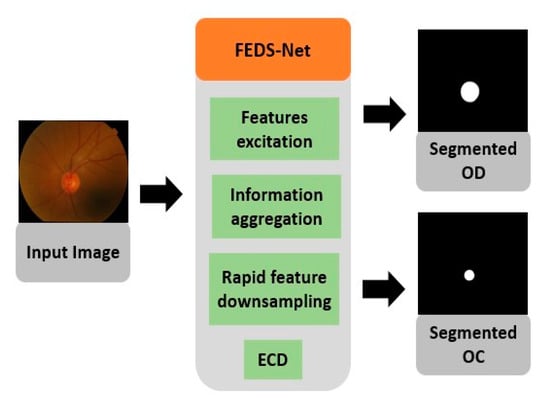
Figure 3.
The overview diagram of the proposed method.
3.2.2. Explanation of the Proposed Method
Existing methods are usually based on some famous networks or use pre-trained models as a backbone. In the case of OD and OC segmentation, famous segmentation architectures such as U-Net [28] and SegNet [32] cannot deliver convincing results because of the small object size with unclear boundaries. Both U-Net and SegNet architectures exhibit vanishing gradient problems because of the excessively small final featuremap size. FEDS-Net is developed from scratch, and it is not based on other architecture. The detailed network architecture of FEDS-Net is shown in Figure 4. Training images from the training split are resized for an efficient training process. Input images are provided to the network using the image input layer. Image features are extracted and activations are produced using convolutional layers. In FEDS-Net, spatial information from different stages of the network is aggregated with spatial features at different IA points. FEDS-Net has a total of five IA points almost at every stage of the network.
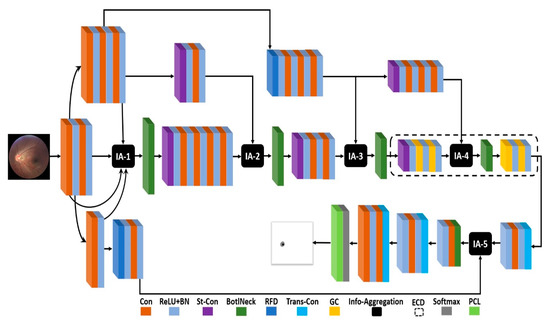
Figure 4.
The architecture of the proposed FEDS-Net (Con: Convolutional layer; BN: Batch normalization layer; St-Con: Strided convolutional layer; BotlNeck: Bottleneck layer; RFD: Rapid feature downsampling; Trans-Con: Transposed convolutional layer; GC: Grouped convolutional layer; ECD: Efficient convolutional depth; PCL: Pixel classification layer; IA: Information aggregation).
In CNNs, the initial spatial feature has the potential to improve the prediction accuracy of the network [33]. Therefore, initial spatial feature excitation is obtained by aggregating features with different process levels and channels at IA-1. In IA-1, initial spatial features from three different convolutional effects along with identity mapping from the first convolutional layer are aggregated for initial feature excitation. The output of IA-1 is provided to the strided convolutional (St-Con) layer via a bottleneck (BotlNeck) layer. Furthermore, St-Con reduces the featuremap size and processes the spatial information from a series of four convolution layers for further activations. Activated information from the series of convolutional layers is further aggregated with the downsampled spatial feature using St-Con at IA-2. It is notable that FEDS-Net architecture does not include maximum pooling or unpooling layers to change the featuremap dimensions to avoid spatial loss caused by these layers. Instead, FEDS-Net uses St-Con and transposed convolutional (Trans-Con) layers to reduce and increase the featuremap size, respectively.
In CNNs, a relatively high stride value of St-Con results in more efficient learning of the network [34]. Therefore, FEDS-Net uses RFD using a high stride of 4 in two St-Con layers. The spatial information from IA-2 is further activated through a couple of convolutional layers via a BotlNeck layer followed by a Str-Con. In IA-3, rapid downsampled features are aggregated with spatial information from a couple of convolutional layers. This aggregated information is provided to ECD. The ECD has valuable semantic information with the maximum number of channels and minimum featuremap dimension. ECD is based on one St-Con, four grouped convolutional layers, one IA point, and a BotlNeck layer. In CNNs, the maximum depth of the network is the most expensive part of the network which strongly hit the computational efficiency of the network. Nevertheless, FEDS-Net used four grouped convolutional layers to contain the required number of parameters in maximum depth. In ECD (IA-4), aggregated spatial information is further aggregated with downsampled and activated spatial features through three convolutional layers. Feature aggregation in ECD helps in learning semantics and consequently enhance prediction accuracy.
Subsequently, the spatial information dimension is increased using a Trans-Con layer and fed to IA-5 via a single convolutional layer. As earlier mentioned, initial features have the potential to improve the overall learning of the network. These initial features underwent RFD and were provided to IA-5 for aggregation with upsampled features from ECD. The spatial dimension of final aggregated features, from IA-5, is increased using two Trans-Con layers one after the other. The final spatial feature from the last Trans-Con layer is refined using a couple of convolutional layers before providing to the softmax and pixel classification layers (PCL) for pixel-wise predictions. PCL produces a prediction mask with the marking of each pixel belonging to the respective class.
Key parts of the aggregation process are further explained using a schematic diagram in Figure 5. Spatial information is fed to via convolutional layers and it becomes . Similarly, initial features are represented with and after undergoing RFD become the rapid downsampled initial features ). In , is aggregated with and it provides aggregated spatial features , as follows.
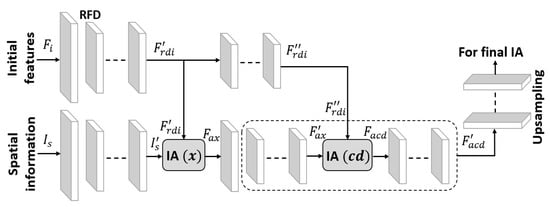
Figure 5.
Schematic diagram showing information aggregation in FEDS-Net.
Because information aggregation is based on concatenation; therefore, aggregation is represented with symbol ©. after activations through convolutional layers become . Subsequently, is further refined through a series of convolutional layers and it is represented with . In convolutional depth, is aggregated with and finally, it provides aggregated features from convolutional depth as given below
are further activated using convolution layers and final features out of convolution depth ) are provided for upsampling before the prediction stage. This feature aggregation in general and in the maximum depth, in particular, improves the overall segmentation performance.
3.2.3. Training, Testing, and the Experimental Environment of the Proposed Method
In this study, experimentation is performed on three publicly available databases. The data split of REFUGE and Drishti-GS databases are pre-defined by the dataset providers and we followed the same official splits in our experiments. For the experimental work of Rim-One-r3, the same data split used by [26] is followed for a fair comparison. Images from the training split are resized using nearest neighbor interpolation for fast training of the network. The limited availability of annotated medical data is a common limitation, worldwide. Therefore, training images are augmented to create artificial images. In this work, arithmetic and geometric operations such as cropping, flipping, and rotation are randomly used for augmentation. No preprocessing is involved for the training of FEDS-Net.
As shown in sample images (Figure 1 and Figure 2), pixels of desired classes (OC and OD) are significantly dominated by undesired class (background) pixels and this scenario triggers a class-imbalance problem. In the experimental work of this study, dice loss (DL) is employed as the loss function for the training of the network. DL mitigates the class-imbalance problem and minimizes the metric while backpropagation and ensures convergence of the network for effective training. Mathematically, DL is expressed as follows
In the above mathematical expression, symbolizes all pixels which are available whereas represents the current pixel. The probability of prediction for pixel is referred by and the true groundtruth label is represented by . P represents generated label after prediction whereas G denotes the groundtruth.
The proposed method is comprehensively evaluated on three publicly available databases. Testing was conducted only on the unseen testing split of the respective database for a fair evaluation. A trained model by FEDS-Net is applied to the testing images and a pixels-level prediction mask is generated for each image. The pixels of the prediction mask are compared with those of the groundtruth pixels to compute results on the bases of evaluation measures. In semantic segmentation, accuracy (AC), sensitivity (S), specificity (SPE), dice similarity coefficient (DSC), and Jaccard index (JCI) are the commonly accepted measures for evaluation [35]. In evaluation measures, true positive , true negative , false positive , and false negative pixels are computed for the evaluation purposes. Mathematically evaluation measures can be given, as follows
FEDS-Net is developed from scratch and all the experimental work is performed using MATLAB 2021a [36] framework. In addition, Intel ® Core™ i7 CPU950@3.7 GHz processor (Intel Corporation, Seoul, Republic of Korea) with an NVIDIA GeForce GTX 1080 graphics processing unit (GPU) [37] (NVIDIA Corporation, Seoul, Republic of Korea) having 8 GB graphics memory is used for experiments. Computational details related to trainable parameters and inference time are presented in Tables 4 and 5, respectively in Section 5.
4. Results
The proposed method is evaluated using three open databases containing retinal fundus images. FEDS-Net delivered excellent segmentation results. Both qualitative and quantitative results for all three databases are given in subsequent subsections.
4.1. FEDS-Net Evaluation Using REFUGE Database
REFUGE is one of the latest and most challenging datasets for OD and OC segmentation. Images in REFUGE datasets are entirely different from the other two databases. Nonetheless, FEDS-Net provided superior segmentation performance for both OC and OD classes. Many images in the testing split have a very small OC area with indistinct boundaries. However, FEDS-Net delivered a better segmentation accuracy even for such challenging cases. Qualitative good and poor segmentation results using FEDS-Net on the REFUGE database are shown in Figure 6 and Figure 7, respectively. Poor results are perhaps because of the unclear objects’ boundaries along with the small size of OC.
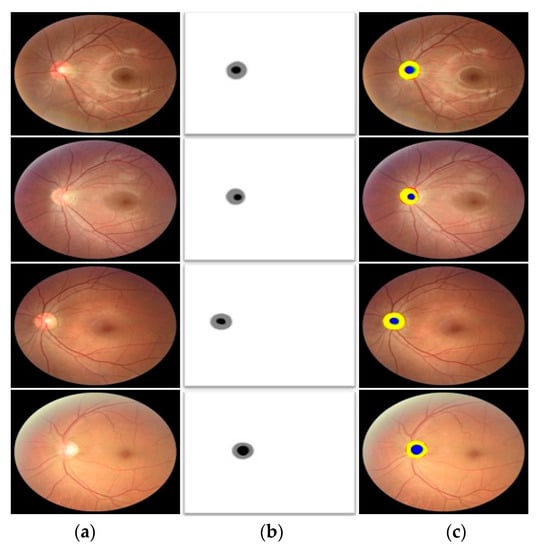
Figure 6.
Good OC and OD segmentation qualitative results on the REFUGE database, attained by applying FEDS-Net. (a) Input image, (b) corresponding groundtruth image, and (c) segmented output images (tp pixels for OD and OC are indicated in yellow and blue, respectively. Likewise, red and green show fn and fp pixels, respectively).
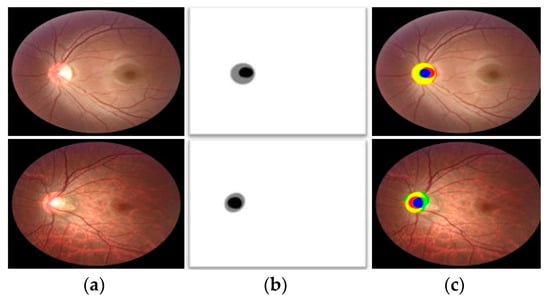
Figure 7.
Poor OC and OD segmentation qualitative sample results on the REFUGE database, attained by applying FEDS-Net. (a) Input image, (b) corresponding groundtruth image, and (c) segmented output images (tp pixels for OD and OC are indicated in yellow and blue, respectively. Likewise, red and green show fn and fp pixels, respectively).
Quantitative OC and OD segmentation results are further compared with those of the state-of-the-art methods to confirm the effectiveness of the proposed method. The listed results in Table 1 show a better segmentation performance of FEDS-Net compared with existing methods. It is worth notable that most of the methods require extensive preprocessing to achieve the desired performance. Instead, the proposed method did not employ any preprocessing to keep the method straightforward.

Table 1.
Segmentation quantitative results comparison of FEDS-Net with state-of-the-art methods using the REFUGE database. “-“ indicates that no result is available (unit: %). (OC: optic cup; OD: optic disc; AC: accuracy; S: sensitivity; SPE: specificity; DSC: dice similarity coefficient; JCI: jaccard index).
4.2. FEDS-Net Evaluation Using Drishti-GS Database
Evaluation of FEDS-Net is extended to benchmark Drishti-GS database. Images in the Drishti-GS database are entirely different from those of the other two databases of this study. Nevertheless, the proposed method provided superior segmentation accuracies for the Drishti-GS database too. Qualitative results of OD and OC segmentation on the Drishti-GS database are presented in Figure 8 and Figure 9, respectively. Figure 8 (rows 1–3), shows good OD segmentation visual results whereas Figure 8 (row 4) shows sample visual result of relatively poor segmentation. Similarly, good segmentation qualitative results for OC segmentation of the Drishti-GS database are shown in Figure 9 (rows 1–3) whereas the relatively poor visual result is shown in Figure 9 (row 4). Poor segmentation cases can be attributed to indistinct object boundaries.
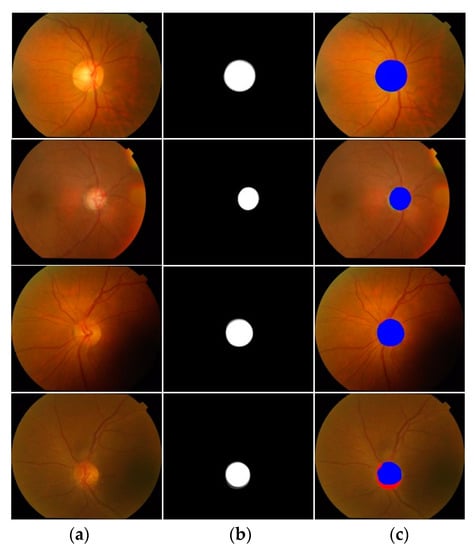
Figure 8.
Good OD segmentation qualitative results on the Drishti-GS database, attained by applying FEDS-Net. (a) Input image, (b) corresponding groundtruth image, and (c) segmented output images (tp and fn pixels for OD are indicated in blue and red, respectively. Whereas, fp pixels are presented with green color) (Rows 1–3: good segmentation results; Row 4: poor segmentation result).
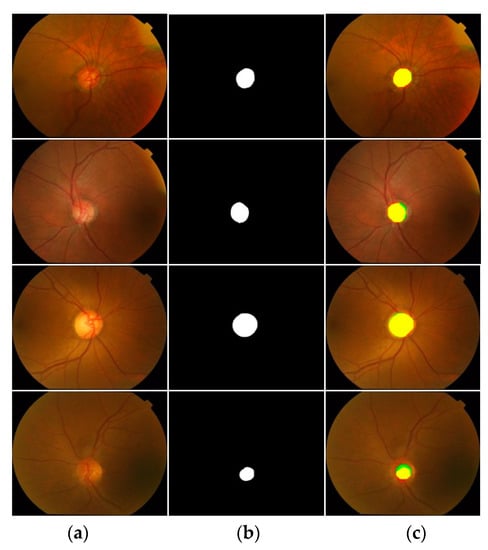
Figure 9.
Good OC segmentation qualitative results on the Drishti-GS database, attained by applying FEDS-Net. (a) Input image, (b) corresponding groundtruth image, and (c) segmented output images (tp and fn pixels for OD are indicated in yellow and red, respectively, whereas fp pixels are presented in green color) (Rows 1–3: good segmentation results; Row 4: poor segmentation result).
In Table 2, quantitative results produced by FEDS-Net are compared with state-of-the-art methods on the Drishti-GS database. Results confirm a convincing performance by FEDS-Net using its feature excitation and IA mechanism. FEDS-Net ensures a high segmentation performance without disregarding the training parameters’ overheads. FEDS-Net used a small number of training parameters to achieve outperforming results.
Table 2.
Segmentation quantitative results comparison of FEDS-Net with state-of-the-art methods using the Drishti-GS database. “-” indicates that no result is available (unit: %). (OC: optic cup; OD: optic disc; AC: accuracy; S: sensitivity; SPE: specificity; DSC: dice similarity coefficient; JCI: jaccard index).
4.3. FEDS-Net Evaluation Using Rim-One-r3 Database
The proposed method is further evaluated using the Rim-One-r3 database with challenging pixel intensity variations. FEDS-Net effectively deals with these variations using its architectural strengths. Qualitative results produced by FEDS-Net for the OD and OC segmentation are provided in Figure 10 and Figure 11, respectively. Qualitative results confirm that FEDS-Net provides excellent segmentation accuracy for different pixel intensity variations and illumination effects. Good segmentation performance’s qualitative results are presented in Figure 10 and Figure 11 (rows 1–3) whereas relatively poor segmentation is shown in Figure 10 and Figure 11 (row 4). Poor segmentation cases can be attributed to indistinct objects’ boundaries along with variations in pixel intensity values and illumination effects.
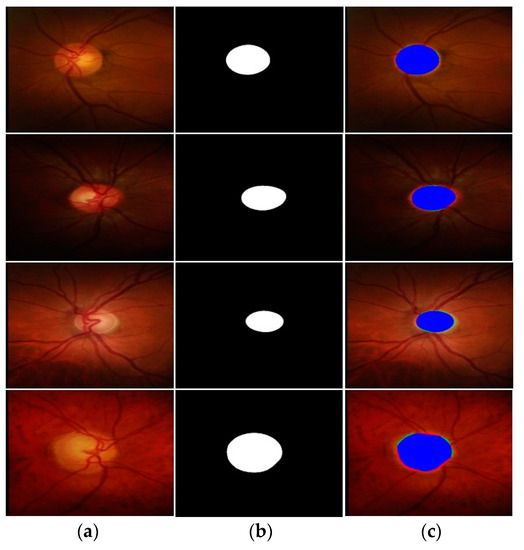
Figure 10.
Good OD segmentation qualitative results on the Rim-One-r3 database, attained by applying FEDS-Net. (a) Input image, (b) corresponding groundtruth image, and (c) segmented output images (tp and fn pixels for OD are indicated in blue and red, respectively. Whereas fp pixels are presented with green color) (Rows 1–3: good segmentation results; Row 4: poor segmentation result).
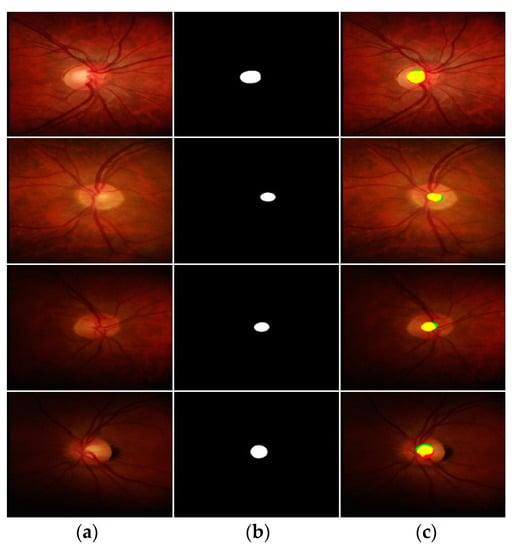
Figure 11.
Good OC segmentation qualitative results on the Rim-One-r3 database, attained by applying FEDS-Net. (a) Input image, (b) corresponding groundtruth image, and (c) segmented output images (tp and fn pixels for OD are indicated in yellow and red, respectively. Whereas fp pixels are presented in green color) (Rows 1–3: good segmentation results; Row 4: poor segmentation result).
FEDS-Net quantitative results are listed in Table 3 for comparison with existing methods. Results exhibit a competitive and convincing performance by the proposed method. Aggregation of features results in effective training; therefore, FEDS-net maintains its better performance even dealing with challenging variations.
Table 3.
Segmentation quantitative results comparison of FEDS-Net with state-of-the-art methods using Rim-One-r3 database. “-” indicates that no result is available (unit: %). (OC: optic cup; OD: optic disc; AC: accuracy; S: sensitivity; SPE: specificity; DSC: dice similarity coefficient; JCI: jaccard index).
5. Discussion
The trend of ophthalmic diseases is on the rise, worldwide. Ophthalmologists have to examine many glaucoma-suspected patients daily. Typically, glaucoma-related examinations are conducted manually which is subjective, time-consuming, and prone to error procedure. Therefore, the need of the time is to assist ophthalmologists with AI-based automated solutions. Hundreds of research studies accepted that OC and OD segmentation can assist the glaucoma diagnosis process. However, OC and OD segmentation task has many associated challenges. Fundus images have a high variation in pixel intensity values, backgrounds, OC/OD sizes, and illuminations that makes the segmentation tricky. In addition, OC size is usually very small and its boundary is too indistinct to accurately segment. Nevertheless, FEDS-Net overcomes these challenges using feature excitation, IA, RFD, and ECD in its architecture. Computational efficiency is another serious criterion for modern AI-based frameworks. In most cases, existing methods show serious limitations in computational efficiency and require a large number of parameters for the complete training of their model. FEDS-Net not only provides excellent segmentation accuracies but also maintains computational efficiency. FEDS-Net requires only 2.73 million parameters which turns out to confirm its computational strength. The comparison of FEDS-Net with existing methods in terms of required trainable parameters is listed in Table 4. Parameters’ comparison exhibits that the proposed method requires a smaller number of parameters compared with those of the state-of-the-art methods. In addition, inference time (per image) for all three datasets using FEDS-Net is also computed and presented in Table 5. A considerably less inference time is also because of the computational effectiveness of the proposed method.
Table 4.
Comparison of trainable parameters with those of the existing methods. (OC: optic cup; OD: optic disc; DSC: dice similarity coefficient).
Table 5.
Inference time (per image) computation using FEDS-Net.
5.1. Assisting the Glaucoma Screening Process
Automated glaucoma diagnosis methods are required to strengthen existing traditional glaucoma screening methods. The OC and OD segmentation can provide valuable computational and morphological details that can work as parallel support for ophthalmologists [26]. Accurate OC and OD segmentation can lead to providing precise V-CDR value and V-CDR is an important biomarker for ophthalmologists in glaucoma diagnosis and prognosis. Glaucoma usually causes cupping, which refers to an increase in the size of OC. The increased size of OC increases the V-CDR value which consequently reflects a high risk of glaucoma [53]. V-CDR is mathematically expressed as
In the above mathematical expression, represents the vertical diameter of the cup area whereas symbolizes disc area. The ratio between both vertical diameters of the cup and disc provides a V-CDR value. A sample V-CDR computation from the REFUGE database is presented in Figure 12. The CDR value of groundtruth image is represented by whereas predicted CDR by FEDS-Net is shown with . The computed CDR by FEDS-Net is quite closer to that of the value that confirms the effectiveness of FEDS-Net in accurately segmenting the OC and OD.
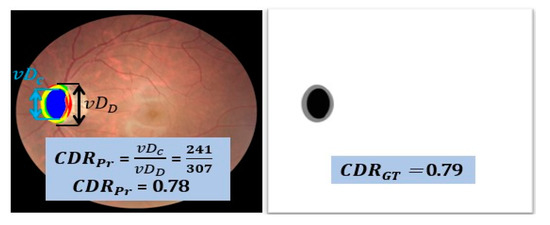
Figure 12.
Sample CDR computation using the REFUGE dataset.
Although V-CDR computation provides potential insight for assisting the glaucoma screening process, nevertheless; segmentation-based glaucoma screening is not limited to only V-CDR computations. The area-cup-to-disc-ratio (Ar-CDR) is another measure to assess the glaucoma occurrence [8]. Ar-CDR is the ratio between the area of the cup region and the disc region. Glaucoma occurrence and progression bring changes in the area of OC and OD (mainly OC); therefore; Ar-CDR can also provide considerable assistance in glaucoma diagnosis and prognosis [8]. V-CDR has a limitation in selecting a reference center point for calculating vertical diameters whereas Ar-CDR is an area-based approach and does not require any reference point. Moreover, glaucoma progression can also be assessed by analyzing the change in the area of only OC during patients’ multiple visits [17]. The rim area between OD and OC is termed a neural rim. The notching phenomenon is the shrinkage of the neural rim, it can be also analyzed for glaucoma screening. Similarly, the disc damage likelihood scale (DDLS) is calculated for the estimation and quantification of this disease [59]. The DDLS can be computed by taking the ratio between the thinnest part of the neural rim and disc diameter [59]. Subsequently, the inferior superior nasal and temporal (ISNT) rule also provides a solid basis to discriminate between glaucomatous and non-glaucomatous cases [60]. According to the ISNT rule, the width of the neural rim should be biggest to smallest for the inferior, superior, nasal, and temporal regions, respectively [60]. Cases satisfying the ISNT rule are classified as non-glaucomatous cases otherwise vice-versa.
5.2. OC and OD Segmentation for the Diagnosis of Other Diseases
Accurate segmentation of OC and OD not only assists in glaucoma screening but also helps in the diagnosis of some other diseases. Alzheimer’s disease (AD) is a neurodegenerative problem that can be assessed using OC and OD segmentation [61]. Similar to glaucoma suspects, a high V-CDR value refers to a high risk of AD. Subsequently, poor cognitive function is common among postmenopausal women [62]. Medical experts consider V-CDR for cognitive assessment of the patient. Hence, accurate OC and OD segmentation is also crucial for assisting in the diagnosis of numerous diseases.
5.3. Demonstrating Learning of the Network using Heat Activation Maps
Understanding the learning process or feature selection of a CNN is very hard to visually explain. Gradient-weighted class activation mapping (Grad-CAM) [63] is used for the visual demonstration of network learning. In Figure 13, heat activation maps of OD and OC using the Rim-One-r3 database are presented in rows 1 and 2, respectively. As shown in Figure 13c–f, heat activation maps are extracted from different layers of the network to assess the learning process. Grad-CAM refers to the main features selected by the CNN during training and marks them with distinguished colors. Figure 13 (last column) is taken from the last layers of the network, and it confirms that FEDS-net rightfully focuses on desired classes without any biases.
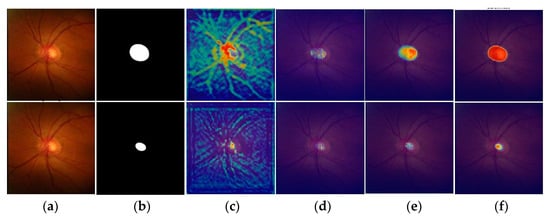
Figure 13.
Visual explanation of FEDS-Net learning process using heat activation maps with Rim-One-r3 database. Activation maps for the OD and OC are provided in rows 1 and 2, respectively. (a) Input image. (b) groundtruth image. Heat activation maps extracted from (c) Initial layer, (d) first convolutional layer after IA-2, (e) convolutional layer after ECD, and (f) final convolutional layer of the network.
6. Conclusions
Glaucoma is one of the most critical ophthalmic diseases that can lead to irreversible vision loss. Glaucoma is typically diagnosed with manual assessments which is a time-consuming, error-prone, and inefficient procedure. Therefore, AI-based automatic methods are desirable to assist ophthalmologists in glaucoma diagnosis. Most of the existing AI-based methods require complex preprocessing, lack segmentation performance, and show serious limitations in terms of computational efficiency. To address all these problems, a novel architecture FEDS-Net is developed for accurate segmentation of OC and OD. FEDS-Net uses feature excitation and IA mechanism to enhance the prediction accuracies. Moreover, FEDS-Net employs ECD and RFD blocks for diverse and efficient learning of the network. The proposed method is evaluated on three challenging databases; REFUGE, Drishti-GS, and Rim-One-r3. FEDS-Net showed outperforming segmentation performance without disregarding the computational requirements of the network. FEDS-Net requires only 2.73 million training parameters for its complete training. FEDS-Net produced better results compared with those of state-of-the-art methods. Hence, the proposed method can be used as second-level support for ophthalmologists in glaucoma diagnosis and prognosis.
Relatively low segmentation accuracies for OC because of its indistinct boundaries can be attributed as the common limitation for all methods. Although FEDS-Net delivered a better performance for OC, still more techniques can be researched for further improvement. In the future, we intend to explore more techniques for enhancing OC segmentation performance.
Author Contributions
A.R., S.A. and M.I. Conceptualization, Methodology, Software, Visualization, Writing Original Draft.; H.S.K. and R.A.N. Data Curation, Resources, Software, Editing; R.A.N. Resources, Validation, Methodology; S.-W.L. Project administration. Investigation, Funding acquisition, Supervision. All authors have read and agreed to the published version of the manuscript.
Funding
This work was supported by a national research foundation (NRF) grant funded by the Ministry of Science and ICT (MSIT), Republic of Korea through the Development Research Program (NRF2022R1G1A1010226) and (NRF2021R1I1A2059735).
Institutional Review Board Statement
This study is based on publicly available datasets mentioned in Section 3.1. The datasets are public for research purposes, therefore it is not applicable. Weblinks for used datasets of this study are as follows. REFUGE: https://ai.baidu.com/broad/download?dataset=gon. (accessed on 10 August 2022) Drishti-GS: http://cvit.iiit.ac.in/projects/mip/drishti-gs/mip-dataset2/Home.php. (accessed on 10 August 2022) Rim-One-r3: http://medimrg.webs.ull.es/rim-one-release-3-is-finally-here/ (accessed on 10 August 2022).
Informed Consent Statement
Not applicable.
Data Availability Statement
Not applicable.
Conflicts of Interest
The authors declare no conflict of interest.
References
- Troy, J.B. Visual prostheses: Technological and socioeconomic challenges. Engineering 2015, 1, 288–291. [Google Scholar] [CrossRef]
- Shanmugam, P.; Raja, J.; Pitchai, R. An automatic recognition of glaucoma in fundus images using deep learning and random forest classifier. Appl. Soft Comput. 2021, 109, 107512. [Google Scholar] [CrossRef]
- Haider, A.; Arsalan, M.; Choi, J.; Sultan, H.; Park, K.R. Robust segmentation of underwater fish based on multi-level feature accumulation. Front. Mar. Sci. 2022, 9, 1010565. [Google Scholar] [CrossRef]
- Arsalan, M.; Haider, A.; Cho, S.W.; Kim, Y.H.; Park, K.R. Human blastocyst components detection using multiscale aggregation semantic segmentation network for embryonic analysis. Biomedicines 2022, 10, 1717. [Google Scholar] [CrossRef]
- Arsalan, M.; Khan, T.M.; Naqvi, S.S.; Nawaz, M.; Razzak, I. Prompt deep light-weight vessel segmentation network (PLVS-Net). IEEE/ACM Trans. Comput. Biol. Bioinform. 2022, 1–9. [Google Scholar] [CrossRef]
- Dutta, M.K.; Mourya, A.K.; Singh, A.; Parthasarathi, M.; Burget, R.; Riha, K. Glaucoma detection by segmenting the super pixels from fundus colour retinal images. In Proceedings of the International Conference on Medical Imaging, m-Health, and Emerging Communication Systems, Greater Noida, India, 7–8 November 2014; pp. 86–90. [Google Scholar]
- Thompson, A.C.; Jammal, A.A.; Medeiros, F.A. A review of deep learning for screening, diagnosis, and detection of glaucoma progression. Transl. Vis. Sci. Technol. 2020, 9, 42. [Google Scholar] [CrossRef]
- Dasgupta, S.; Mukherjee, R.; Dutta, K.; Sen, A. Deep learning based framework for automatic diagnosis of glaucoma based on analysis of focal notching in the optic nerve head. arXiv 2021, arXiv:2112.05748. [Google Scholar]
- Sarathi, M.P.; Dutta, M.K.; Singh, A.; Travieso, C.M. Blood Vessel inpainting based technique for efficient localization and segmentation of optic disc in digital fundus images. Biomed. Signal Process. Control 2016, 25, 108–117. [Google Scholar] [CrossRef]
- Septiarini, A.; Harjoko, A.; Pulungan, R.; Ekantini, R. Automated detection of retinal nerve fiber layer by texture-based analysis for glaucoma evaluation. Healthc. Inf. Res 2018, 24, 335–345. [Google Scholar] [CrossRef]
- Yin, F.; Liu, J.; Ong, S.H.; Sun, Y.; Wong, D.W.K.; Tan, N.M.; Cheung, C.; Baskaran, M.; Aung, T.; Wong, T.Y. Model-based optic nerve head segmentation on retinal fundus images. In Proceedings of the IEEE on International Conference on IEEE Engineering in Medicine and Biology Society, Boston, MA, USA, 30 August–3 September 2011; pp. 2626–2629. [Google Scholar]
- Roychowdhury, S.; Koozekanani, D.D.; Kuchinka, S.N.; Parhi, K.K. Optic disc boundary and vessel origin segmentation of fundus images. IEEE J. Biomed. Health Inform. 2016, 20, 1562–1574. [Google Scholar] [CrossRef]
- Morales, S.; Naranjo, V.; Angulo, J.; Alcañiz, M. Automatic detection of optic disc based on PCA and mathematical morphology. IEEE Trans. Med. Imaging 2013, 32, 786–796. [Google Scholar] [CrossRef] [PubMed]
- Cheng, J.; Liu, J.; Wong, D.W.K.; Yin, F.; Cheung, C.; Baskaran, M.; Aung, T.; Wong, T.Y. Automatic optic disc segmentation with peripapillary atrophy elimination. In Proceedings of the IEEE International Conference on IEEE Engineering in Medicine and Biology Society, Boston, MA, USA, 30 August–3 September 2011; pp. 6224–6227. [Google Scholar]
- Xue, L.-Y.; Lin, J.-W.; Cao, X.-R.; Zheng, S.-H.; Yu, L. Optic disk detection and segmentation for retinal images using saliency model based on clustering. J. Comput. 2018, 29, 66–79. [Google Scholar] [CrossRef]
- Mittapalli, P.S.; Kande, G.B. Segmentation of optic disk and optic cup from digital fundus images for the assessment of glaucoma. Biomed. Signal Process. Control 2016, 24, 34–46. [Google Scholar] [CrossRef]
- Thakur, N.; Juneja, M. Optic disc and optic cup segmentation from retinal images using hybrid approach. Expert Syst. Appl. 2019, 127, 308–322. [Google Scholar] [CrossRef]
- Arsalan, M.; Haider, A.; Choi, J.; Park, K.R. detecting blastocyst components by artificial intelligence for human embryological analysis to improve success rate of in vitro fertilization. J. Pers. Med. 2022, 12, 124. [Google Scholar] [CrossRef]
- Haider, A.; Arsalan, M.; Lee, Y.W.; Park, K.R. Deep features aggregation-based joint segmentation of cytoplasm and nuclei in white blood cells. IEEE J. Biomed. Health Inform. 2022, 26, 3685–3696. [Google Scholar] [CrossRef]
- Arsalan, M.; Haider, A.; Koo, J.H.; Park, K.R. Segmenting retinal vessels using a shallow segmentation network to aid ophthalmic analysis. Mathematics 2022, 10, 1536. [Google Scholar] [CrossRef]
- Hervella, Á.S.; Rouco, J.; Novo, J.; Ortega, M. End-to-end multi-task learning for simultaneous optic disc and cup segmentation and glaucoma classification in eye fundus images. Appl. Soft Comput. 2022, 116, 108347. [Google Scholar] [CrossRef]
- Zhang, L.; Lim, C.P. Intelligent optic disc segmentation using improved particle swarm optimization and evolving ensemble models. Appl. Soft Comput. 2020, 92, 106328. [Google Scholar] [CrossRef]
- Bian, X.; Luo, X.; Wang, C.; Liu, W.; Lin, X. Optic disc and optic cup segmentation based on anatomy guided cascade network. Comput. Methods Programs Biomed. 2020, 197, 105717. [Google Scholar] [CrossRef]
- Al-Bander, B.; Williams, B.M.; Al-Nuaimy, W.; Al-Taee, M.A.; Pratt, H.; Zheng, Y. Dense fully convolutional segmentation of the optic disc and cup in colour fundus for glaucoma diagnosis. Symmetry 2018, 10, 87. [Google Scholar] [CrossRef]
- Sreng, S.; Maneerat, N.; Hamamoto, K.; Win, K.Y. Deep learning for optic disc segmentation and glaucoma diagnosis on retinal images. Appl. Sci. 2020, 10, 4916. [Google Scholar] [CrossRef]
- Wang, S.; Yu, L.; Yang, X.; Fu, C.-W.; Heng, P.-A. Patch-based output space adversarial learning for joint optic disc and cup segmentation. IEEE Trans. Med. Imaging 2019, 38, 2485–2495. [Google Scholar] [CrossRef] [PubMed]
- Son, J.; Park, S.J.; Jung, K.-H. Towards accurate segmentation of retinal vessels and the optic disc in fundoscopic images with generative adversarial networks. J. Digit. Imaging 2019, 32, 499–512. [Google Scholar] [CrossRef]
- Ronneberger, O.; Fischer, P.; Brox, T. U-Net: Convolutional networks for biomedical image segmentation. In Proceedings of the International Conference on Medical Image Computing and Computer-Assisted Intervention, Munich, Germany, 5–9 October 2015; pp. 234–241. [Google Scholar]
- Gao, J.; Jiang, Y.; Zhang, H.; Wang, F. Joint disc and cup segmentation based on recurrent fully convolutional network. PLoS ONE 2020, 15, e0238983. [Google Scholar] [CrossRef]
- Civit-Masot, J.; Luna-Perejón, F.; Corral, J.M.R.; Domínguez-Morales, M.; Morgado-Estévez, A.; Civit, A. A study on the use of edge TPUs for eye fundus image segmentation. Eng. Appl. Artif. Intell. 2021, 104, 104384. [Google Scholar] [CrossRef]
- Sevastopolsky, A. Optic disc and cup segmentation methods for glaucoma detection with modification of U-net convolutional neural network. Pattern Recognit. Image Anal. 2017, 27, 618–624. [Google Scholar] [CrossRef]
- Badrinarayanan, V.; Kendall, A.; Cipolla, R. SegNet: A deep convolutional encoder-decoder architecture for image segmentation. IEEE Trans. Pattern Anal. Mach. Intell. 2017, 39, 2481–2495. [Google Scholar] [CrossRef] [PubMed]
- Hosseinzadeh Kassani, S.; Hosseinzadeh Kassani, P.; Wesolowski, M.J.; Schneider, K.A.; Deters, R. Deep transfer learning based model for colorectal cancer histopathology segmentation: A comparative study of deep pre-trained models. Int. J. Med. Inform. 2022, 159, 104669. [Google Scholar] [CrossRef] [PubMed]
- Kong, C.; Lucey, S. Take it in your stride: Do we need striding in CNNs? arXiv 2017, arXiv:1712.02502. [Google Scholar] [CrossRef]
- Bengani, S.; Jothi, J.A.A.J.; Vadivel, S. Automatic segmentation of optic disc in retinal fundus images using semi-supervised deep learning. Multimed. Tools Appl. 2021, 80, 3443–3468. [Google Scholar] [CrossRef]
- MATLAB R2021a. Available online: https://www.mathworks.com/products/matlab.html (accessed on 5 March 2022).
- GeForce GTX. Available online: https://www.nvidia.com/en-gb/geforce/products/10series/geforce-gtx-1070/ (accessed on 5 March 2022).
- Cheng, P.; Lyu, J.; Huang, Y.; Tang, X. Probability distribution guided optic disc and cup segmentation from fundus images. In Proceedings of the IEEE International Conference in Medicine & Biology Society, Montreal, QC, Canada, 20–24 July 2020; pp. 1976–1979. [Google Scholar]
- Haider, A.; Arsalan, M.; Lee, M.B.; Owais, M.; Mahmood, T.; Sultan, H.; Park, K.R. Artificial Intelligence-based computer-aided diagnosis of glaucoma using retinal fundus images. Expert Syst. Appl. 2022, 207, 117968. [Google Scholar] [CrossRef]
- Sarhan, A.; Al-KhazÁly, A.; Gorner, A.; Swift, A.; Rokne, J.; Alhajj, R.; Crichton, A. Utilizing transfer learning and a customized loss function for optic disc segmentation from retinal images. arXiv 2020, arXiv:2010.00583. [Google Scholar]
- Almubarak, H.; Bazi, Y.; Alajlan, N. Two-stage mask-RCNN approach for detecting and segmenting the optic nerve head, optic disc, and optic cup in fundus images. Appl. Sci. 2020, 10, 3833. [Google Scholar] [CrossRef]
- Zhang, Z.; Fu, H.; Dai, H.; Shen, J.; Pang, Y.; Shao, L. ET-Net: A generic edge-attention guidance network for medical image segmentation. In Proceedings of the Medical Image Computing and Computer Assisted Intervention, Shenzhen, China, 13–17 October 2019; pp. 442–450. [Google Scholar]
- Orlando, J.I.; Fu, H.; Barbosa Breda, J.; van Keer, K.; Bathula, D.R.; Diaz-Pinto, A.; Fang, R.; Heng, P.-A.; Kim, J.; Lee, J.; et al. REFUGE challenge: A unified framework for evaluating automated methods for glaucoma assessment from fundus photographs. Med. Image Anal. 2020, 59, 101570. [Google Scholar] [CrossRef] [PubMed]
- Li, S.; Sui, X.; Luo, X.; Xu, X.; Liu, Y.; Goh, R. Medical image segmentation using squeeze-and-expansion transformers. arXiv 2021, arXiv:2105.09511. [Google Scholar]
- Hervella, Á.S.; Ramos, L.; Rouco, J.; Novo, J.; Ortega, M. Multi-modal self-supervised pre-training for joint optic disc and cup segmentation in eye fundus images. In Proceedings of the IEEE International Conference on Acoustics, Speech and Signal Processing, Barcelona, Spain, 4–9 May 2020; pp. 961–965. [Google Scholar]
- Liu, S.; Hong, J.; Lu, X.; Jia, X.; Lin, Z.; Zhou, Y.; Liu, Y.; Zhang, H. Joint optic disc and cup segmentation using semi-supervised conditional GANs. Comput. Biol. Med. 2019, 115, 103485. [Google Scholar] [CrossRef]
- Yu, S.; Xiao, D.; Frost, S.; Kanagasingam, Y. Robust optic disc and cup segmentation with deep learning for glaucoma detection. Comput. Med. Imaging Graph. 2019, 74, 61–71. [Google Scholar] [CrossRef]
- Chakravarty, A.; Sivaswamy, J. RACE-Net: A recurrent neural network for biomedical image segmentation. IEEE J. Biomed. Health Inform. 2019, 23, 1151–1162. [Google Scholar] [CrossRef]
- Zilly, J.; Buhmann, J.M.; Mahapatra, D. Glaucoma detection using entropy sampling and ensemble learning for automatic optic cup and disc segmentation. Comput. Med. Imaging Graph. 2017, 55, 28–41. [Google Scholar] [CrossRef]
- Chakravarty, A.; Sivaswamy, J. Joint optic disc and cup boundary extraction from monocular fundus images. Comput. Methods Programs Biomed. 2017, 147, 51–61. [Google Scholar] [CrossRef] [PubMed]
- Shankaranarayana, S.M.; Ram, K.; Mitra, K.; Sivaprakasam, M. Joint optic disc and cup segmentation using fully convolutional and adversarial networks. In Proceedings of the International Workshop on Fetal and Infant Image Analysis, Québec City, QC, Canada, 10 September 2017; pp. 168–176. [Google Scholar]
- Haleem, M.S.; Han, L.; van Hemert, J.; Li, B.; Fleming, A.; Pasquale, L.R.; Song, B.J. A novel adaptive deformable model for automated optic disc and cup segmentation to aid glaucoma diagnosis. J. Med. Syst. 2017, 42, 20. [Google Scholar] [CrossRef] [PubMed]
- Sedai, S.; Roy, P.K.; Mahapatra, D.; Garnavi, R. Segmentation of optic disc and optic cup in retinal fundus images using shape regression. In Proceedings of the International Conference of the IEEE Engineering on Medicine and Biology Society, Orlando, FL, USA, 16–20 August 2016; pp. 3260–3264. [Google Scholar]
- Joshi, G.D.; Sivaswamy, J.; Krishnadas, S.R. Optic disk and cup segmentation from monocular color retinal images for glaucoma assessment. IEEE Trans. Med. Imaging 2011, 30, 1192–1205. [Google Scholar] [CrossRef] [PubMed]
- Sivaswamy, J.; Krishnadas, S.R.; Datt Joshi, G.; Jain, M.; Syed Tabish, A.U. Drishti-GS: Retinal image dataset for optic nerve head (ONH) segmentation. In Proceedings of the IEEE International Symposium on Biomedical Imaging, Beijing, China, 29 April–2 May 2014; pp. 53–56. [Google Scholar]
- Sun, J.-D.; Yao, C.; Liu, J.; Liu, W.; Yu, Z.-K. GNAS-U2Net: A new optic cup and optic disc segmentation architecture with genetic neural architecture search. IEEE Signal Process. Lett. 2022, 29, 697–701. [Google Scholar] [CrossRef]
- Maninis, K.-K.; Pont-Tuset, J.; Arbeláez, P.; Van Gool, L. Deep retinal image understanding. In Proceedings of the Medical Image Computing and Computer-Assisted Intervention, Athens, Greece, 17–21 October 2016; pp. 140–148. [Google Scholar]
- Salehi, S.S.M.; Erdogmus, D.; Gholipour, A. Tversky loss function for image segmentation using 3d fully convolutional deep networks. In Proceedings of the International Workshop on Machine Learning in Medical Imaging, Québec City, QC, Canada, 10 September 2017; pp. 379–387. [Google Scholar]
- Thakur, N.; Juneja, M. Survey on segmentation and classification approaches of optic cup and optic disc for diagnosis of glaucoma. Biomed. Signal Process. Control 2018, 42, 162–189. [Google Scholar] [CrossRef]
- Pathan, S.; Kumar, P.; Pai, R.M.; Bhandary, S.V. Automated segmentation and classifcation of retinal features for glaucoma diagnosis. Biomed. Signal Process. Control 2021, 63, 102244. [Google Scholar] [CrossRef]
- Malik, F.H.; Batool, F.; Rubab, A.; Chaudhary, N.A.; Khan, K.B.; Qureshi, M.A. Retinal disorder as a biomarker for detection of human diseases. In Proceedings of the IEEE International Conference on Multitopic, Bahawalpur, Pakistan, 5–7 November 2020; pp. 1–6. [Google Scholar]
- Vajaranant, T.S.; Hallak, J.; Espeland, M.A.; Pasquale, L.R.; Klein, B.E.; Meuer, S.M.; Rapp, S.R.; Haan, M.N.; Maki, P.M. An association between large optic nerve cupping and cognitive function. Am. J. Ophthalmol. 2019, 206, 40–47. [Google Scholar] [CrossRef]
- Selvaraju, R.R.; Cogswell, M.; Das, A.; Vedantam, R.; Parikh, D.; Batra, D. Grad-CAM: Visual explanations from deep networks via gradient-based localization. In Proceedings of the IEEE International Conference on Computer Vision, Venice, Italy, 22–29 October 2017; pp. 618–626. [Google Scholar]
Disclaimer/Publisher’s Note: The statements, opinions and data contained in all publications are solely those of the individual author(s) and contributor(s) and not of MDPI and/or the editor(s). MDPI and/or the editor(s) disclaim responsibility for any injury to people or property resulting from any ideas, methods, instructions or products referred to in the content. |
© 2023 by the authors. Licensee MDPI, Basel, Switzerland. This article is an open access article distributed under the terms and conditions of the Creative Commons Attribution (CC BY) license (https://creativecommons.org/licenses/by/4.0/).