1. Introduction
In 2002, Richard Florida published his famous work, The Rise of the Creative Class [
1]. In this book, the author put forward the idea that the key driver of urban economic development is the creative class, and the diversity of creative activities generates a unique environment of economic growth. However, in his 2017 book, The New Urban Crisis, he points out that only the creative class itself will benefit from the economic growth of the creative economy, and that economic growth transfers the problems of cities to the periphery, increasing spatial inequalities. Nevertheless, as of 2020, using the UAE as an example, the contribution of creative industries to the Gross domestic product (GDP) of individual countries has already reached 12% [
2].
The concept of the creative class is still considered unsettled. On the one hand, the concept of “class” does not imply class in the classical sense [
3], while the rhetoric itself leads to confusion [
4]. On the other hand, creativity is more of a character trait, a component of human capital, than a certain profession, which makes it difficult to form a unified methodology for assessing the creative class [
5]. In this study, the creative class is proposed to be understood as a set of persons engaged in professions related to creative and intellectual activity [
6], which include art, clubs and performing arts, music, cinema and animation, photography, publishing, television and video games, advertisement, architecture, design, fashion, jewelry, museums, libraries, archives, heritage and education.
In the pre-pandemic period, the contribution of the creative industries to global GDP was estimated to be 3%, with a further increase to 10% by 2023 expected. But it was the creative industries that were among the most affected by COVID-19 [
7]. The resolution of the United Nations General Assembly (UNGA) declared 2021 the Year of Creative Industries [
8]. The largest megacities in the world have developed strategies for the development of creative cities: creative London, creative New York, creative Berlin, creative Toronto, and others [
9]. In Russia, according to various estimates, the contribution of creative industries to the country’s GDP is 4–6%.
The growth of creative industries in recent years, as well as global trends, laid the foundation for the approval of the Concept for the Development of Creative Industries in 2021. This raises an extremely relevant issue: the question of whether in Russia—under the conditions of extreme spatial inequality [
10], polarization, and strong centripetal forces [
11]—the development of the creative economy in economically developed cities (cities of federal significance, administrative centers of regions), will increase the spatial inequality of the country.
The theory of spatial development assumes the transfer of the accumulated potential of creative industries from the center of their concentration to the periphery. However, the prospects, mechanisms, and potential of such development are poorly studied, and models of formation and development in the dynamics of creative industries’ concentration in cities have not been proposed. The largest Russian cities—Moscow and St. Petersburg—are becoming the centers of localization of creative industries [
12], which reflects the general trend and international experience. The practice of creative industry development testifies to the possibility of implementing creative projects in “second-tier cities”, which in a broad sense, is generally accepted to include the whole set of cities on the periphery of a large administrative center of a region [
13]. A unique example of second-tier cities are single-industry towns (monotowns), for which the issue of concentration of economic activity is most relevant. Single-industry towns, being centers of high concentration of industry in the spatial system, belong to the periphery of regional development. Therefore, the issue of rethinking the industrial concentration of single-industry towns is especially important in the context of new industrialization and reindustrialization in the EU and USA [
14,
15].
The most important feature of a mathematical model is its universality [
16]. The regional economy faces the problem of reliable mathematical models in the empirical substantiation of economic processes. Fundamental classical models underlying empirical calculations (which include Cobb-Douglas, Kuznets, Dixie-ta-Stiglitz-Krugman, Mankiw–Romer–Weil, among others) describe patterns occurring at the macro level. To describe patterns at the regional level (due to the complexity of data collection from the micro and local levels), their decomposition is carried out from the macro to the meso (regional) level [
17]. However, when it comes to cities, this decomposition shows obvious discrepancies between the results of decomposition and the economy at the municipal level. In such conditions, macroeconomic mathematical models are ineffective. Therefore, scientists are trying to develop mathematical models based on local data, in particular at the NUTS 3 level (in French, nomenclature des unités ter-ritoriales statistiques, NUTS) [
18], which is, in most cases, “higher” than the city level. However, the studies [
18,
19,
20] that find it possible to painstakingly collect enough data to build a model do not take into account a number of important features, including:
- -
The development (adaptation) of indicators for local and micro data;
- -
The different significances of models with fixed, random effects, as well as OLS models;
- -
The assessment of the possibility of spatial data displacement;
- -
The probability of spatial autocorrelation of residues.
Thus, the problem of the study is the lack of a universal algorithm for testing hypotheses on the example of data on cities collected at the local and micro level.
The objective of this study is to improve the algorithm for constructing a mathematical data model at the local level, taking into account the factors of diversity, efficiency, and digital transformation of creative industries. The novelty of this study is (1) system of spatial and economic indicators for localities; (2) the substantiation of factors and the formation of a model of diversity, efficiency, digital transformation of a new driver of economic growth in the context of creative industries; (3) a reliability assessment, taking into account spatial heterogeneity.
Our research comprises the following sections: The introduction describes the topic of the research.
Section 2 presents a scientific review of the literature on the topic, development factors, and the prospects for the development of single-industry towns through creative industries.
Section 3 proposes five regression models for assessing the concentration of creative industries and the factors affecting it, as well as methods for selecting the most preferable ones. In developing the regression models, we tried to pay special attention to justifying the choice between cross-sectional, random-effect and fixed-effect models.
Section 4 presents the results of the parameter estimation of the regression models, supported by the dynamics of the concentration index in space, and justifies the choice of fixed-effect models.
Section 5 compares the results with the existing state of knowledge in the field.
Section 6 draws conclusions.
2. Literature Review
Creative industries have been identified as a key driver of urban economic development over the past two decades [
1,
21,
22,
23,
24,
25]. Florida reasoned that neither industry nor operating businesses attracts human capital, but rather, creative people themselves and their concentration are key attracting factors in the placement and localization of business [
1]. The creative class is impressed by the “atmosphere”, “coolness”, prospects, and conditions of a city. The concentration of the creative class in a city develops the prerequisites for a diversity of activities, triggering the development process of a particular city. In this regard, the creation of jobs and the involvement of creative people simultaneously with the creation of a favorable environment becomes a tool of modern urban policy.
The problem of concentration in creative industries is a new area of research with an old basis consisting of the unity and opposition of two types of agglomeration effects: MAR-localization (MAR, deriving from the first letters of the surnames of the scientists, Marshall, Arrow, Romer) effects and Jacobs effects of urbanization in cities, which are confirmed to varying degrees in various studies [
26]. It is accepted that the total effect of urbanization and localization determines the level of concentration of productive territories, with centripetal and centrifugal forces at work. Knowledge, culture, communication, and creativity have a significant impact on the development of the territory [
27]. Despite the fact that in recent years, there has been a growing interest in studying the spatial development of cultural and creative industries [
28], their contribution to economic development, as well as their impact on spatial planning and urban reconstruction, the mechanisms of such development are not fully understood. In particular, the mechanisms of concentration and diversification of creative industries and their determining factors require investigation. On the one hand, there is a scientific opinion that culture is one of the main tools for regional development and reducing regional disparity, creating jobs with social unity effects, as well as a catalyst for economic growth [
29]. On the other hand, Boal-San Miguel and Herrero-Prieto [
18] conclude that creative industries are concentrated in megacities, while the spillover effects are felt by adjacent regions, due to the untimeliness of the spatial dependency process. The latter becomes a source of regional imbalances as a result of the implementation of the technological gap model by creative industries.
Concentration in traditionally large cities is a characteristic of the music professions, particularly in the case of the spatial center of Germany (Thuringia, Saxony, and Bavaria) [
30]. Spatial heterogeneity is inherent in the mobility processes of celebrity chefs in China [
31]. The spatial heterogeneity of publishing activity was revealed in the case of European regions [
32]. These studies open a new research avenue, though they do not fill the gap in research, which is to establish the factors of creative industry concentration and its impact on urban development, which is especially relevant in modern conditions for single-industry towns in Russia.
The relevance of returning to the development of single-industry towns for the international context of research is associated with the emerging patterns of reindustrialization of European cities after a long period of deindustrialization that lasted two decades [
9]. In turn, urban reindustrialization will become a driver of increasing industrial concentration, the patterns of which have not been definitively identified in the context of new industrialization. New industrialized cities are expected to develop with smart specialization, ESG (Environment, Social, Governance), and digital technologies, forming the concept of a smart city [
33]. Under such conditions, the development of a single-industry town requires complete scientific rethinking, taking into account the current issues of the development of creative industries and new specializations.
Russia is experiencing a crisis of industrialized cities with a half-century lag. Monotowns are becoming key centers of spatial disproportions in Russia, and the dominant strategy of their development is the diversification of economic structure [
34]. The current trend of research into the prospects of creating a favorable environment, as well as the diversification of a city’s economy through creative industries, forms the prerequisites for the development of new directions of monotown transformation. The development of creative industries in single-industry towns could become the basis of the diversification strategy, implemented to varying degrees over the last decade by the administrations of single-industry towns. However, the potential for the development of creative industries has not been fully assessed in modern scientific literature.
Despite the diversity of forms and content of the single-industry town (monotown) concept in international and Russian theory, in general, monotowns include such settlements that are characterized by a significant concentration of industry of the same profile, remote from the main markets [
35]. In Russian practice, “significance” is usually interpreted through the level of criteria, the number and size of which changes in practice and over time. Thus, in modern Russian conditions, monotowns include urban districts and urban settlements with the level of employment at one or a group of related enterprises not less than 20%. There are also exceptions to this rule: oil and gas towns and rural settlements, which received the status of a single-industry town before the introduction of these criteria. In modern conditions, there are officially 322 single-industry towns in Russia [
36]. Foreign experience of single-industry towns is less rigid in tracking certain criteria of monoprofile. Monotowns are defined according to the specialization of the city on a certain type of activity: mining towns in Germany, resource towns in South Africa and Scandinavia, railway and mill towns in the USA, etc.
For comparison, there are over 2500 small industrial cities in the USA, 112 in Norway, and single-industry towns are also found in South Africa and China [
37,
38,
39]. The general pattern of the development of such cities is obvious—a high concentration of a particular type of activity, which influences other auxiliary processes in the economy and society, creating a special culture of a single-profile city [
40]. Single-industry towns are characterized by the problems of the influence of the institutional path dependence [
41], which is formed as a result of lagging behind the placement of production forces from the emerging agglomeration effects [
26]. They are characterized by the so-called “resource curse” or “paradox of abundance” [
28]. However, the essence of the problems of single-industry towns is that although the concentration of productive forces in them is maximum, but contrary to the laws of the market economy it is formed far from under the influence of maximum agglomeration effects.
Scientific literature presents only separate, disjointed studies devoted to creative industries in conditions of monospecialization. First of all, the authors identify the regularities of the development of digital transformation and the prospects for the formation of a smart city [
42]. The fact is that the information technology (IT) sector in the modern sense refers to creative industries, in some cases, forming the trend of creative reindustrialization. The authors note that “smart” solutions are considered as a promising direction of development of modern Russian single-industry towns on a par with other settlements. It should be noted that “smart” solutions require a new model of development, which will be based on improving the efficiency of the economic mechanism for the introduction of digital technologies and platform solutions in the economy and urban management.
The research of Antonova and Maleeva shows that more diversified single-industry towns generate a higher level of IT services, which is due to higher urbanization, lower unemployment, and high attraction of investments in fixed assets of single-industry enterprises [
34]. Thus, economic diversity produces the best basis for digital transformations in the direction of “smart cities” [
43]. Nevertheless, the development of the IT sector in single-industry towns does not allow us to form a comprehensive view of the creative sector of the economy of single-industry towns. Moreover, a search for the keywords, “creative industries” and “single-industry towns”, in the scientometric system, SciVal, did not reveal any such publications, which allow us to conclude that this issue is insufficiently studied. However, the conditions of high industrial concentrations of single-industry towns seem to become a condition for a different process of the creative industry development than in a diversified city and, correspondingly, for the creative industry-based development of the cities themselves. In particular, as shown by Boix Domenech et al., creative industries are a powerful resource for improving the well-being of rich and poor places at all geographical scales, but they also act as a double-edged sword, as they increase inequalities between territories [
24]. This is why blindly replicating the experience of diversified cities to single-industry towns can lead to the reverse processes of increasing spatial inequalities.
Thus, the analysis of the current level of knowledge in the field of development of creative industries in single-industry towns allows us to focus on the following gap in the literature. Being a direct instrument of diversification of the economy of single-industry towns or monotowns, creative industries apparently assume unknown mechanisms and development factors that allow single-industry towns to develop, while directly copying and replicating the practices of diversified cities can play a cruel joke on a single-industry town, whereas under the conditions of the new industrialization and deindustrialization of cities, identifying the factors of the development of creative industries seems to be an extremely urgent issue. In this study, we propose to eliminate this gap by analyzing the dynamics and identifying the key factors of the concentration of creative industries in single-industry towns within Siberia and the Urals in Russia. This study will help to form an idea of the potential of replication of the best practices for the development of creative industries under the conditions of high industrial specialization of cities.
3. Data and Methods
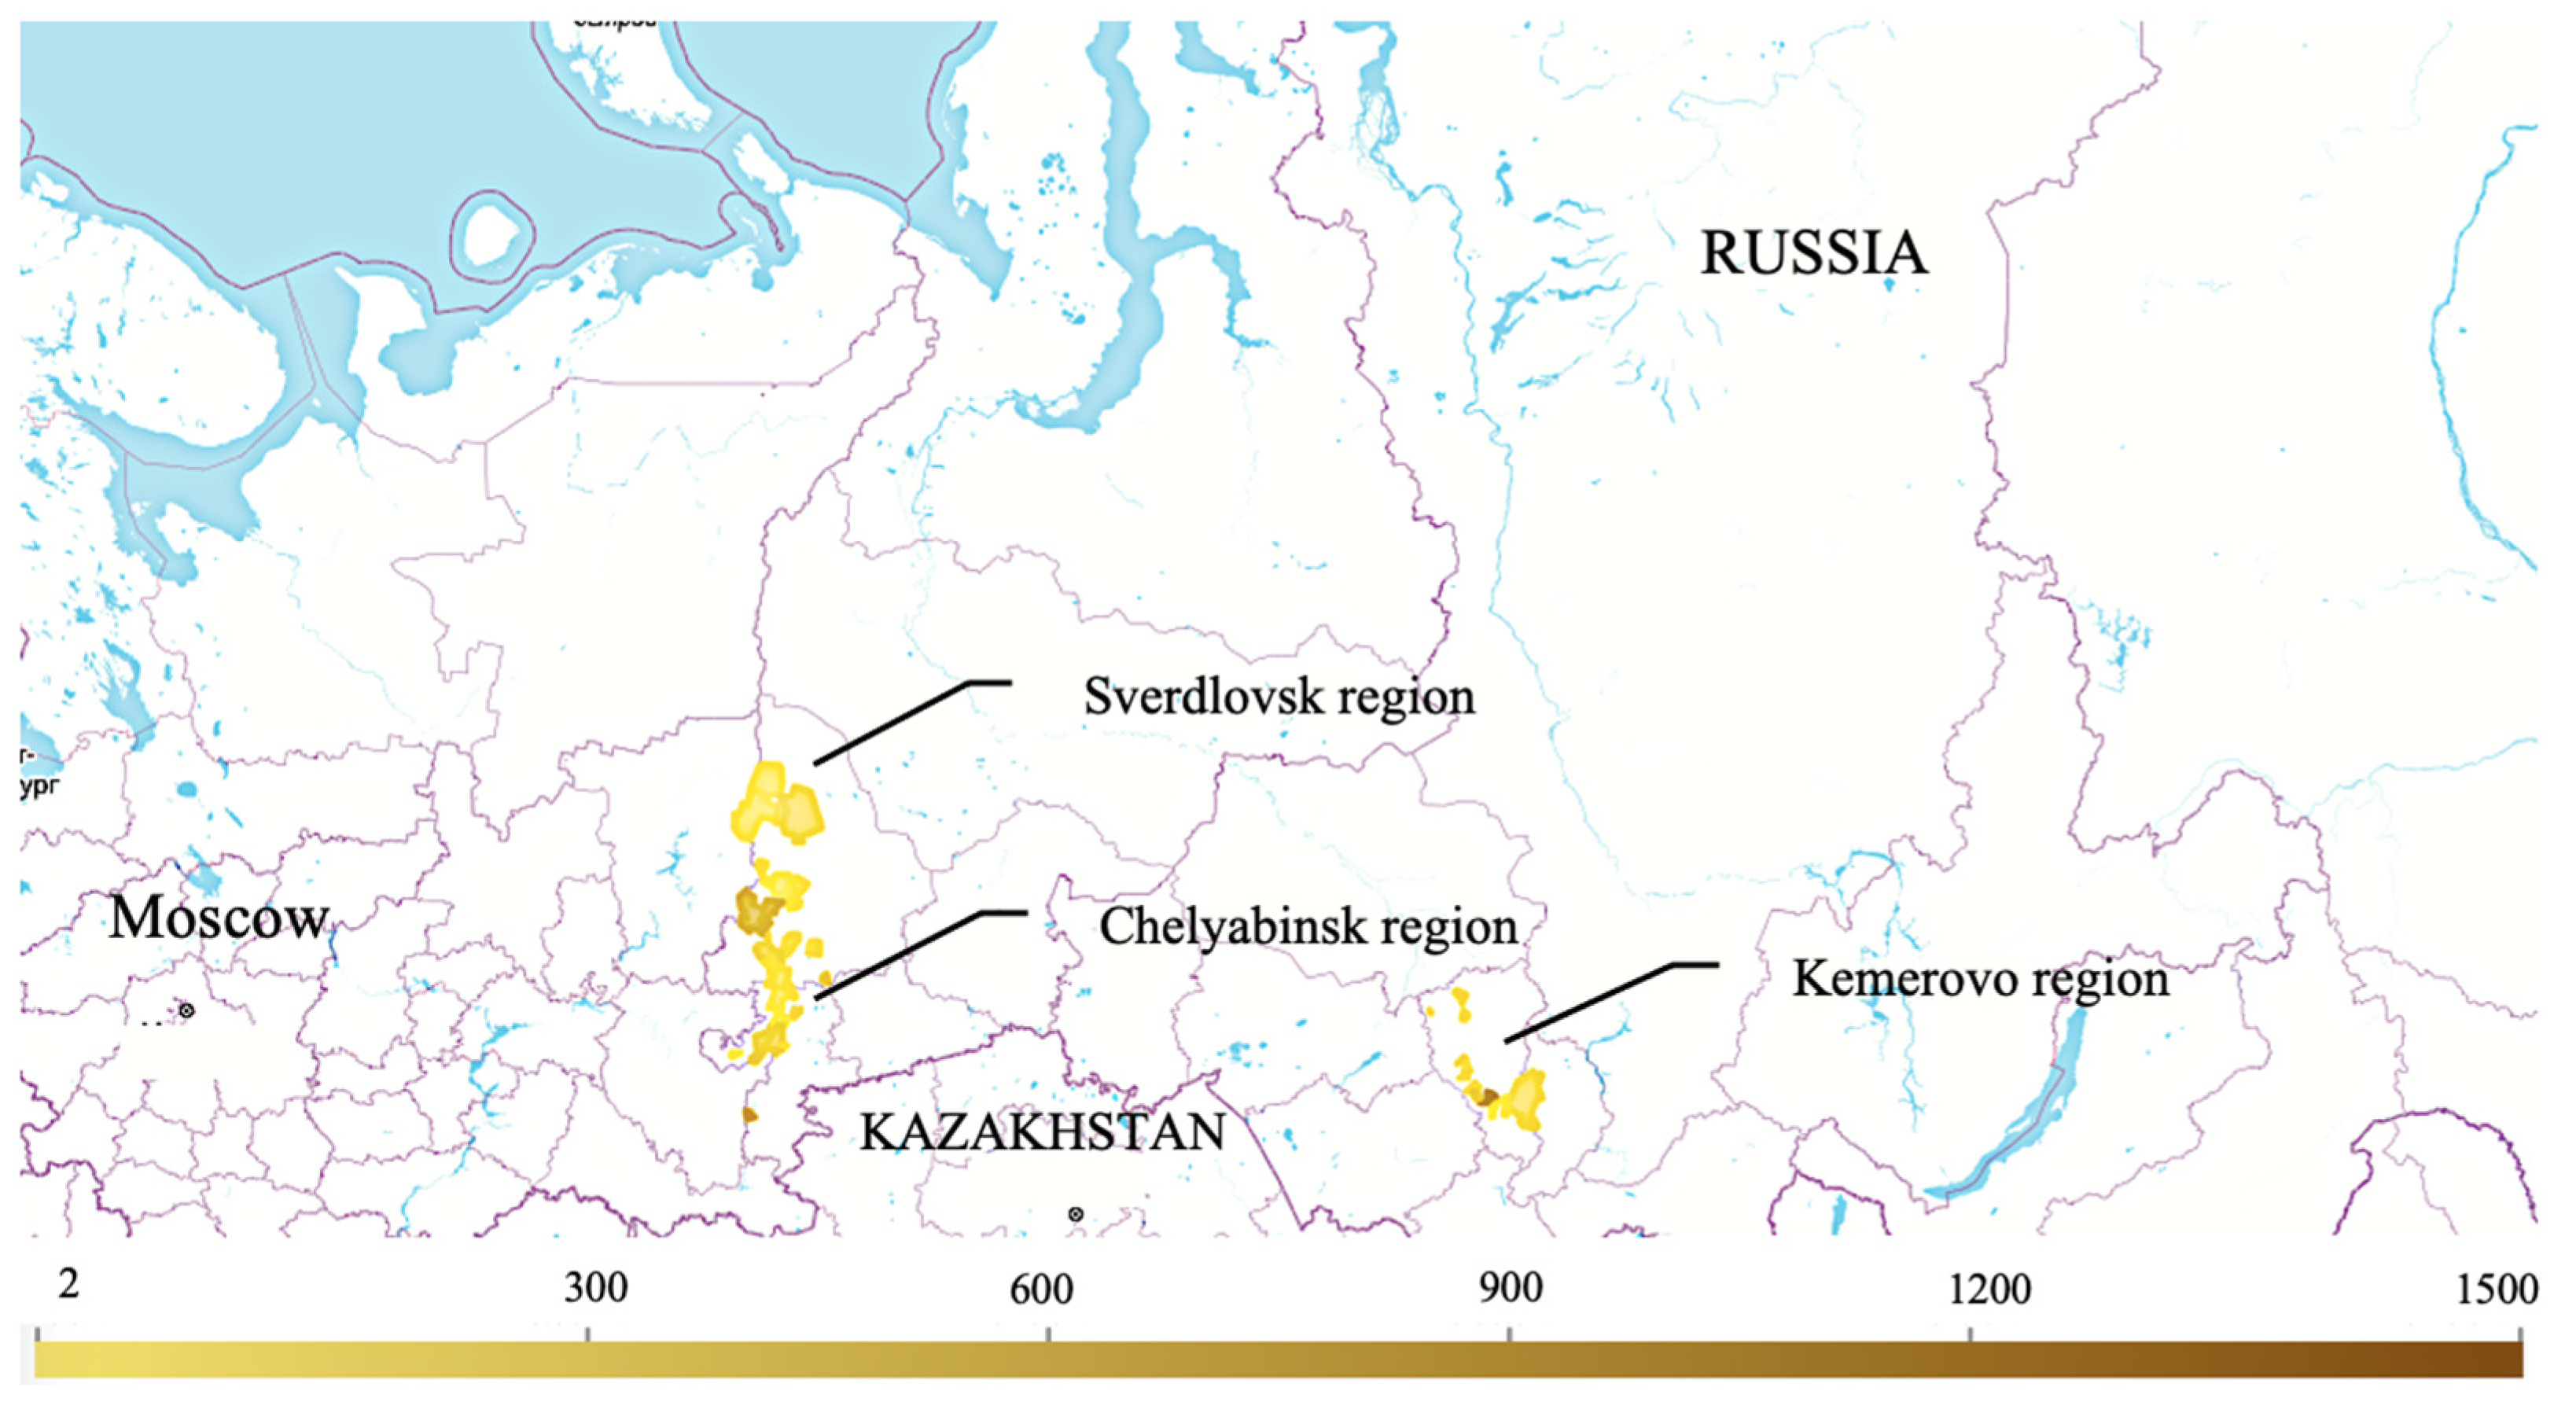
This study contains unique data on single-industry towns in the Kemerovo, Sverdlovsk, and Chelyabinsk regions. The choice of these regions is determined by an extremely high concentration of single-industry towns. Kemerovo Region covers 24 single–industry towns, Sverdlovsk Region includes 17, Chelyabinsk—16 single-industry towns. The total number of single–industry towns—57—consists of urban districts and urban settlements. Urban settlements under the current legislation of the Russian Federation are included in municipal districts, which, in turn, may include other urban settlements. An urban district is a separate municipality that is not included in a municipal district. The key problem of municipal statistics data is their binding to municipalities, so there are no data on urban settlements in the municipal statistics of the Russian Federation. For this reason, it was decided to assess only urban districts from among single-industry towns. The depth of panel data is 5 years—2013–2017. Thus, the total panel sample is 190 observations (38 cities × 5 years). Spatial placement of single-industry towns and regions is shown in
Figure 1. The map shows the population by city in accordance with the data on the municipality (urban district).
In addition to municipal statistics, we carried through extensive work to collect data on creative industries, based on the financial statements of enterprises in the SPARK-Interfax information and analytical system (Interfax News Agency JSC, Moscow, Russia). The collection of data on creative industries was particularly difficult. Thus, the main method of identification of creative industry enterprises is the All-Russian Classifier of Types of Economic Activities (ARCTEA, in Russian—OKVED) or a similar foreign classifier—Activity Codes NACE Rev.2 [
20].
The novelty of this methodology for selecting creative industries according to ARCTEA, taking into account the possibility of being included in the list of enterprises that do not belong to creative industries, lies in the two-stage selection of enterprises. At the first stage, comparing ARCTEA codes according to the two most widespread methodologies in Russia—the Agency for Strategic Initiatives and the Higher School of Economics—it was decided to implement the widest possible list of ARCTEA. This was due to the fact that small towns are more likely to miss the presence of creative industries, which will distort the spatial patterns of development of creative industries in single-industry towns. At the second stage, in order to eliminate the list of enterprises that do not belong to creative industries, an additional control of the first 20 enterprises for each type of creative industry was introduced. General characteristics of ARCTEA codes and types of creative activities are given in
Table 1.
3.1. Dependent Variable
The dependent variable was the level of concentration of creative industries in a city, calculated on the basis of the Herfindahl–Hirschman index as follows:
where
HHICIbyR is the index of concentration of revenue of creative organizations. This index is determined in the context of cities annually, in the period of 2013–2017;
Ri—revenue of the
i creative organization in a city;
RCI—aggregate revenue of creative organizations in the city. This indicator includes values from 0 to 1 and reflects the degree of concentration or, inverse to it, the degree of diversification of creative industries enterprises, where 1 is the presence of only one enterprise in the creative industry and values close to zero are the situation of maximum diversity of creative industries enterprises by revenue.
It should be pointed out that currently, scientific research uses different indexes of defining the concentration, including Gini [
44,
45], entropy [
46], localization and Theil [
47]. But empirical testing reveals that all concentration indexes have strong correlation [
48].
3.2. Independent Variables
The key factor of concentration in the cities under consideration is mono-industry, which acts as the basis of an institutional path dependence that does not allow diversification of the city’s economy. We propose to test the extent to which mono-industry affects the concentration processes of creative industries. The working hypothesis in this case is that:
Hypothesis 1 (H1). The development of single-industry towns is subject to the effect of the institutional path dependence, which consists of the fact that the mono-industry acts as a key factor in the development of creative industries, determining the level and diversity of existing creative organizations in the city.
To test this hypothesis, we use the CR1 indicator, which reflects the share of the mono-industry in the aggregated revenue of the city. The regression analysis is supplemented by an analysis of the dynamics of creative industry concentration for the period of 2013–2017, with the results represented on maps.
In addition to mono-industry, the development of creative industries is influenced by the level of socio-economic development of a city, which is proposed to be assessed through a set of instrumental variables: investment in fixed assets (Invs); the unemployment rate (Unempl); the number of operating enterprises (ExEnt); and the level of aggregate revenue of the city (SIAR), reflecting the impact of the scale of the city on the concentration of creative industries. In this case, the following hypothesis is tested:
Hypothesis 2 (H2). Single-industry towns, due to the effect of institutional path dependence, show specific patterns of development, different from the development of diversified cities.
The concentration of creative industries is directly influenced by the entrepreneurial performance of creative organizations [
49]. The scientific novelty and practical significance of this study is emphasized by the application of data not only on the number of established creative organizations (CrCIEnt) reporting on the revenue generated, but also on the number of established individual enterprises. We expect to reveal how differently individual entrepreneurs and organizations influence the concentration of creative industries and try to answer the question of which organizational and legal form of the enterprise is preferable for the creative industries of the city. In this case, the following hypothesis is being tested:
Hypothesis 3 (H3). Creative industries enter the market of single-industry towns mainly by establishing individual enterprises, which acts as a factor of diversification and spatial alignment of creative industries.
In this case, in addition to regression analysis, it is relevant to use cartographic material on the number of established enterprises and individual entrepreneurs in the creative industries.
The impact of digitalization on the concentration of creative industries, expressed in the level of revenue of IT companies (ITR), is being tested separately, while we do not expect significant results from this factor, due to the low levels of digitalization of single-industry towns as a whole [
50,
51].
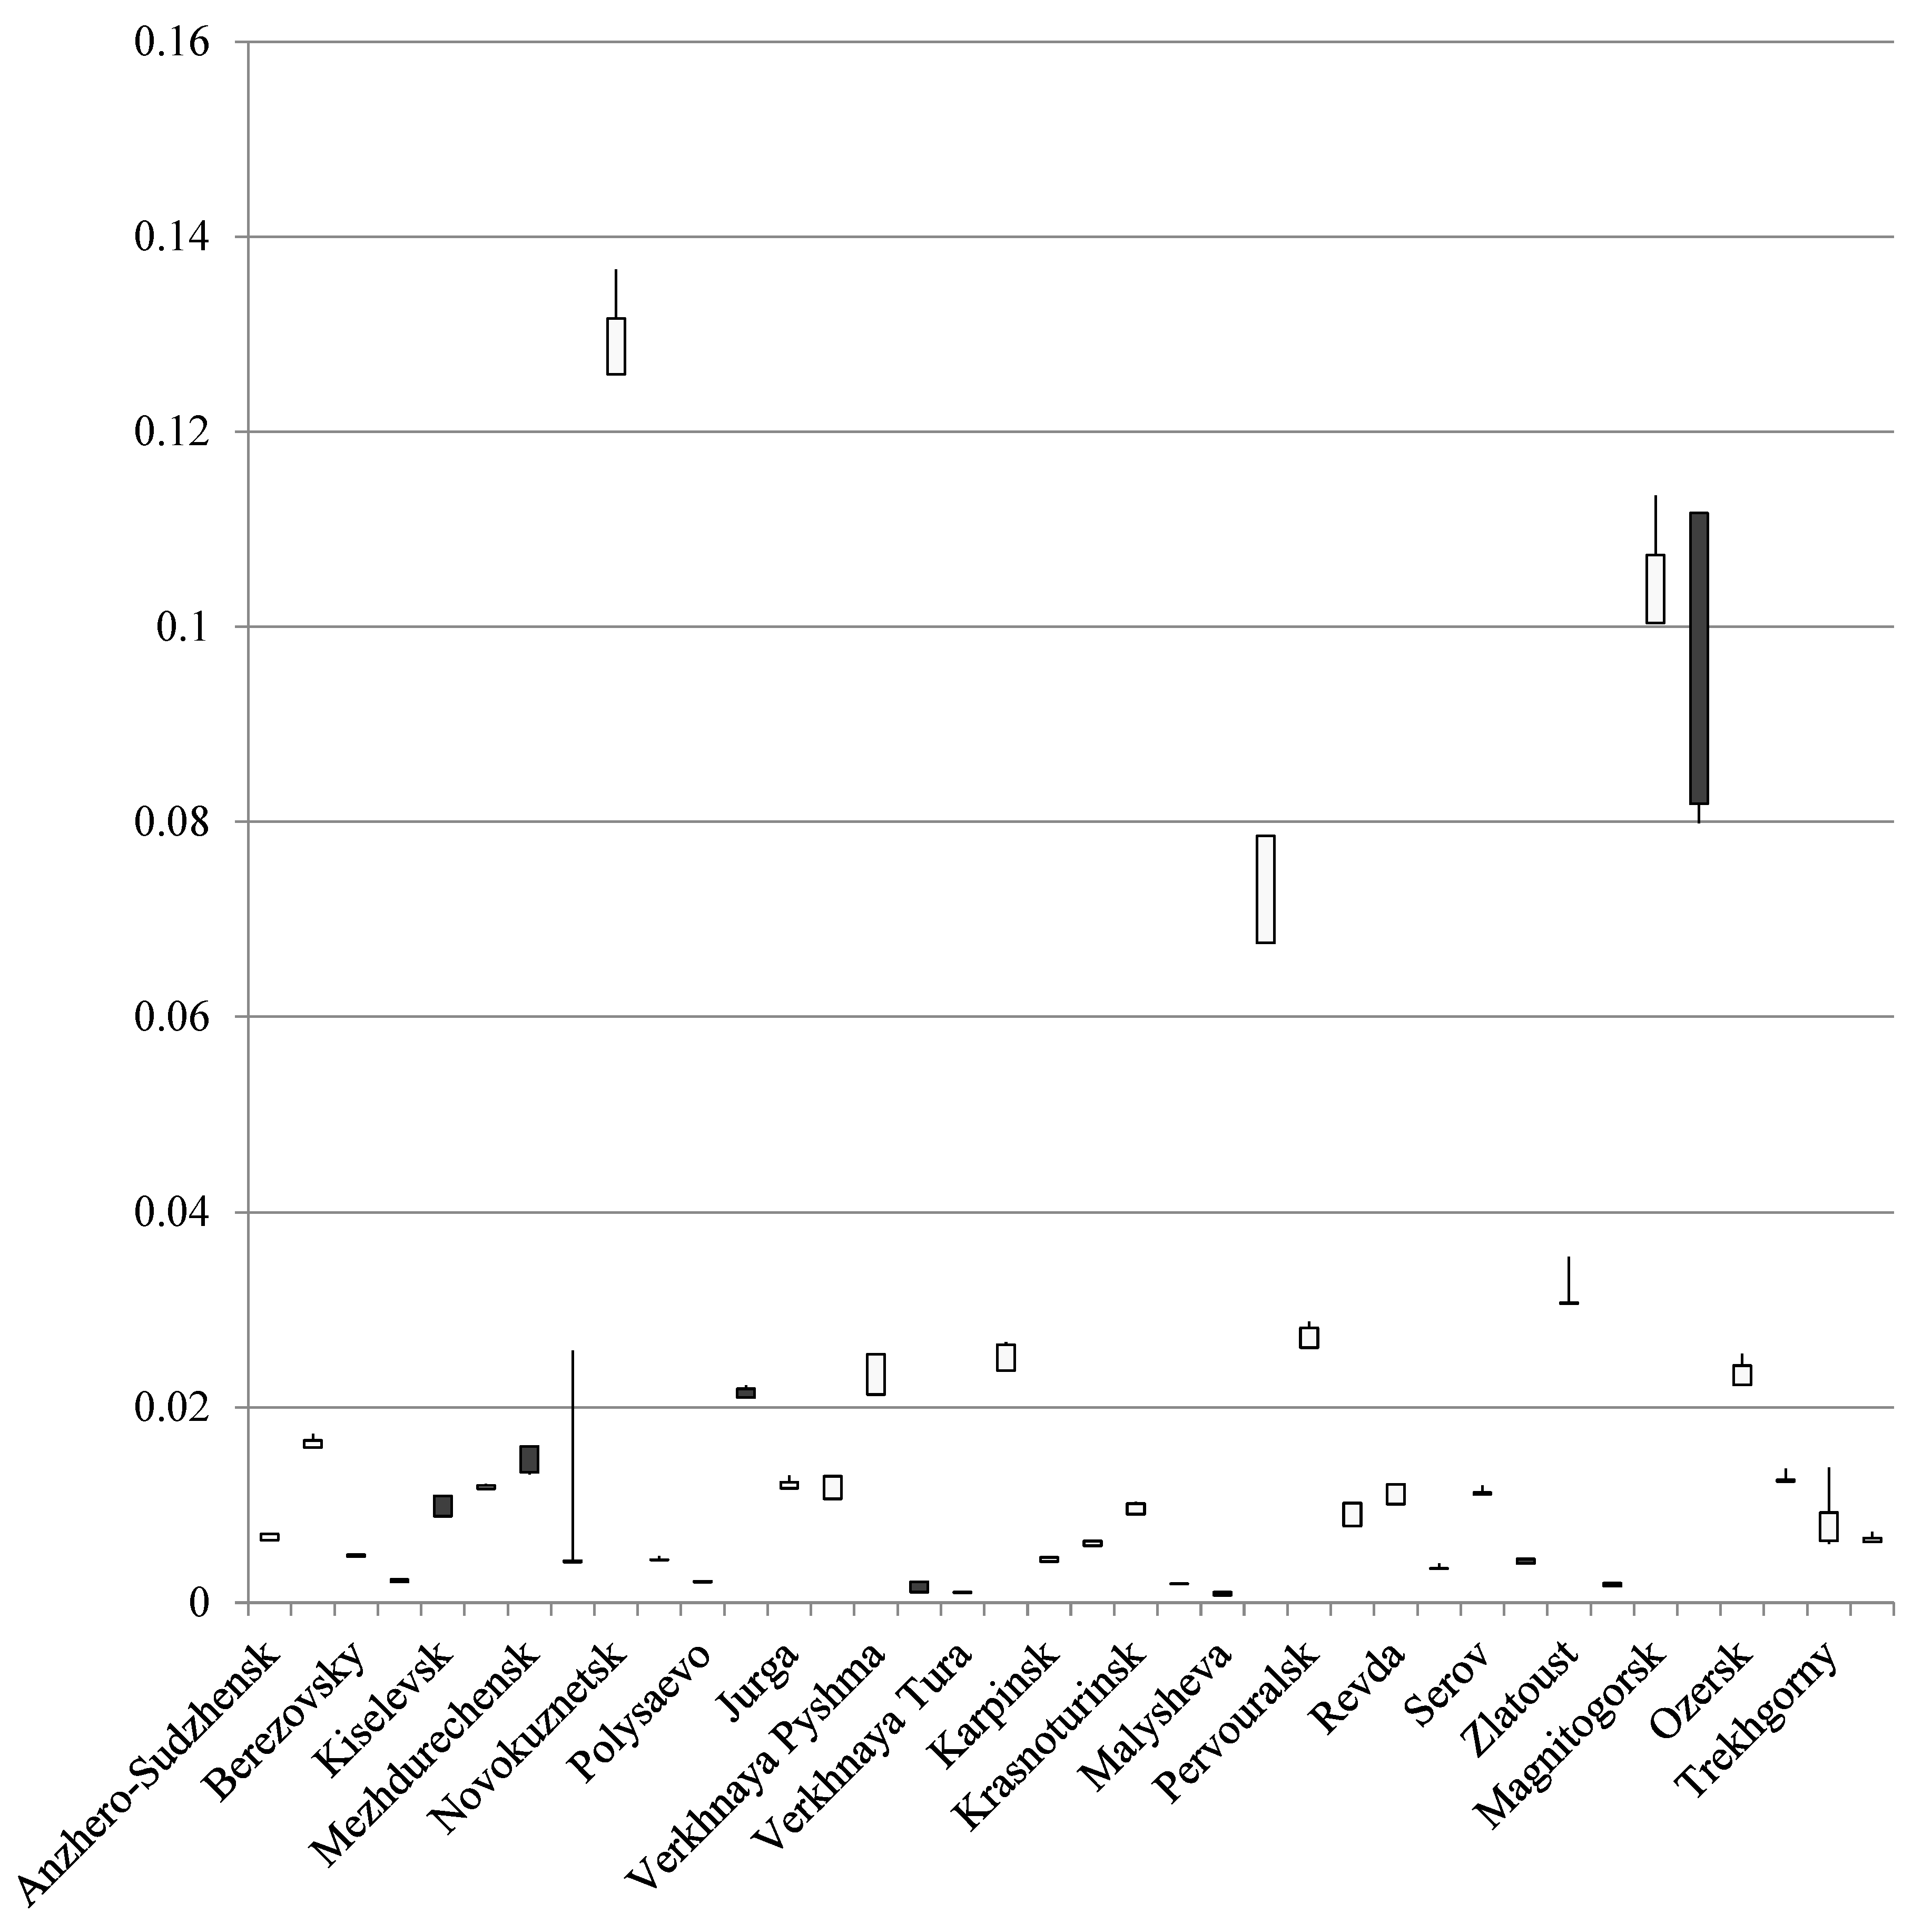
In addition to entrepreneurial activity, it is proposed to introduce the creative industries efficiency indicator (DEA
cr) as an independent variable. We calculated the creative industries efficiency indicators based on the DEA method (data envelope analysis), which reflects the relative efficiency of the inputs and outputs of all the Decision-Making Units (DMU) under consideration. In this paper, we use an output-oriented CCR-model with a constant scale effect when the output parameter changes in proportion to the input parameter and BCC with variable scale effect when the change in the input parameter is disproportionate to the change in the output parameter, Equations (2) and (3).
where
X is the input parameters,
Y is the output parameters,
ϕ is the obtained measure of the efficiency of the
i-th object in solving the problem,
λ is the vector of constants. The input units were revenue and the number of established enterprises and fixed assets of creative industries; the output was taken as 1. Calculations were made in the free software, Open-Source DEA (Free Software Foundation, Inc., Boston, MA, USA). The results of the DEA calculations are shown in
Figure 2; the figure also shows a list of single-industry towns included in the panel data.
3.3. Regional Spatial Differentiation
The Theil index is estimated separately for three regions, which allows us to assess the degree of differentiation of organizations’ revenues in the region, in order to assess whether concerns about the growth of spatial inequalities are justified in the current conditions of single-industry towns. The growth of this indicator will indicate an increase in spatial differentiation within the region (4).
where
Tj—Theil index of organizations revenues in region
j;
Rij—the revenue of a firm
i in the region
j;
N—the number of organizations in a region;
ARj—the aggregated revenues in region
j.
The tail index has the property of separability, that is, the decomposition of the general inequality into components, which is presented in Formula (5):
where
Tjm—the Theil index, used to evaluate city
m in region
j;
M—the number of cities in the region
j;
ARmj—the aggregated revenues of the city
m in the region
j;
Rmj—the aggregated revenues of the city
m in the region
j;
Kjm—the number of companies in the city
m in the region
j.
Following the traditional approach of the Theil index evaluation [
37], we develop this method in case of organization—city—region spatial disparity differentiation. The results allow us to consider the lower level of estimation at the country and region levels.
3.4. Models and Estimation
To test hypotheses, we used panel data and applied appropriate econometric methods. To select variables for models, the Spearman correlation coefficient was calculated (see
Table A1). To estimate and analyze the models based on panel data we used the methodology from [
52,
53]. In all, we developed five models to test our hypotheses. Model 1 is OLS model of considered variables. Model 2 is the model with random effects (RE) and the Model 3 with fixed effects of time (years)—FE. The model 4—is the fixed effect model as well but we fixed the type of region as the factor of creative industry concentration (ReRegion). Model 5 (OLSDUMRegion) controls the regional factor. These models can be written as the multiple linear regression equation for individual
i = 1, …,
N who is observed at several time periods
t = 1, …,
T
where
is the dependent variable (in our case, it is
,
is a
k-dimensional row vector of time-varying explanatory variables (
k = 9, independent variables) and
is a
m-dimensional row vector of time-invariant explanatory variables excluding the constant (
m = 3),
is the intercept (
,
is a
k-dimensional column vector of parameters,
is a
m-dimensional column vector of parameters,
ci is an individual-specific effect, and
is an idiosyncratic error term. One notes that for pooled OLS models (1 and 5)
ci = 0, for the model with fixed effects (5)
, and for the models with random effects (2 and 4) the individual-specific effect is a random variable that is uncorrelated with the explanatory variables, i.e., random term is
. The pooled OLS models and the FE model are estimated via least squares method. The random effects estimator is the feasible generalized least squares estimator.
The choice of the model is based on the statistical analysis of the residuals, including statistical hypothesis testing (model 3 (FE) is preferable to OLS; model 2 (RE) is preferable to model 3 (FE); model 3 (FE) is preferable to model 4 (ReRegion); model 4 (ReRegion) is preferable to model 1 (OLS); model 4 (ReRegion) is significant according to the following criteria: F test for individual effects, Hausman test and Lagrange multiplier test (Breusch–Pagan) at the significance level of alpha 0.05. It should also be noted that the use of regression models with lag variables with data on the SME is not required, since the generation of income of small and micro enterprises occurs in the short term, and therefore, 2–5-year lags will exceed the “response” period of the dependent variable.
The novelty of this study is the combination of the assessment of the significance of models with the control of spatial effects, which accumulate in connection with the “reduction” of the research level to local. To achieve this, firstly, we control the significance factor of the region (Model 4 and 5), and additionally evaluate the spatial autocorrelation of residues based on the global Moran index I [
45,
54].
where
n is the number of units, wij is the weight of the spatial relationship between the
i—th and
j—th units,
yi is the value in the
i-th unit,
y is the sample average for all units.
3.5. Algorithm
We offer the following algorithm for the local data empirical evaluation:
Step 1—Economic problem formulation;
Step 2—Data gathering on the local and micro level;
Step 3—Contracting and transforming formulae for the local and micro data level.
Step 4—Substantiation of the casual relationships between variables;
Step 5—Testing fixed effect, random effect and OLS models;
Step 6—Testing the regional fixed effects separately (fixed effect model and OLS with dummy variables);
Step 7—F test, Hausman test, and Lagrange multiplier test (Breusch–Pagan);
Step 8—Moran I rest for errors.
4. Results
The study results in the parameter estimates of regression models 1–5 presented in
Table 2. The calculations have been carried out in Open-source R project (The R Foundation for Statistical Computing, Vienna, Austria).
The application of F-test, Hausman, Lagrange multiplier and Breusch–Pagan tests allows us to identify two fixed effects models with the difference in accounting for the regional factor (
Table 3).
Thus, the random effects model (2) is the best model. Further we will diagnose this model, using more statistical tests. The results we write in
Table 4. The descriptive statistics for model residuals is given in
Table A2.
After substantiating the most significant research model, we also propose to test the spatial autocorrelation of residues based on the global Moran I index separately for each year. We use Open-source GeoDA for calculations (GeoDa Center, University of Chicago, Chicago, IL, USA). The results are presented in
Table 5.
As can be seen from
Table 4, the hypothesis of the absence of spatial autocorrelation is not rejected; therefore, the tested model is significant. Spatial autocorrelation of residues is increasing by 2017, but does not exceed critical levels. One of the reasons for this may be the formation of the effect of the flow of creative industries from relatively central, single-industry towns to peripheral areas. This circumstance may indicate that the period under consideration is probably subject to spatial displacement, the factors of which can be further investigated, taking into account COVID-19, sanctions, and other factors.
The results show that there is a negative, statistically significant dependence of the level of concentration of creative industries on the proportion of mono-industry. We consider [
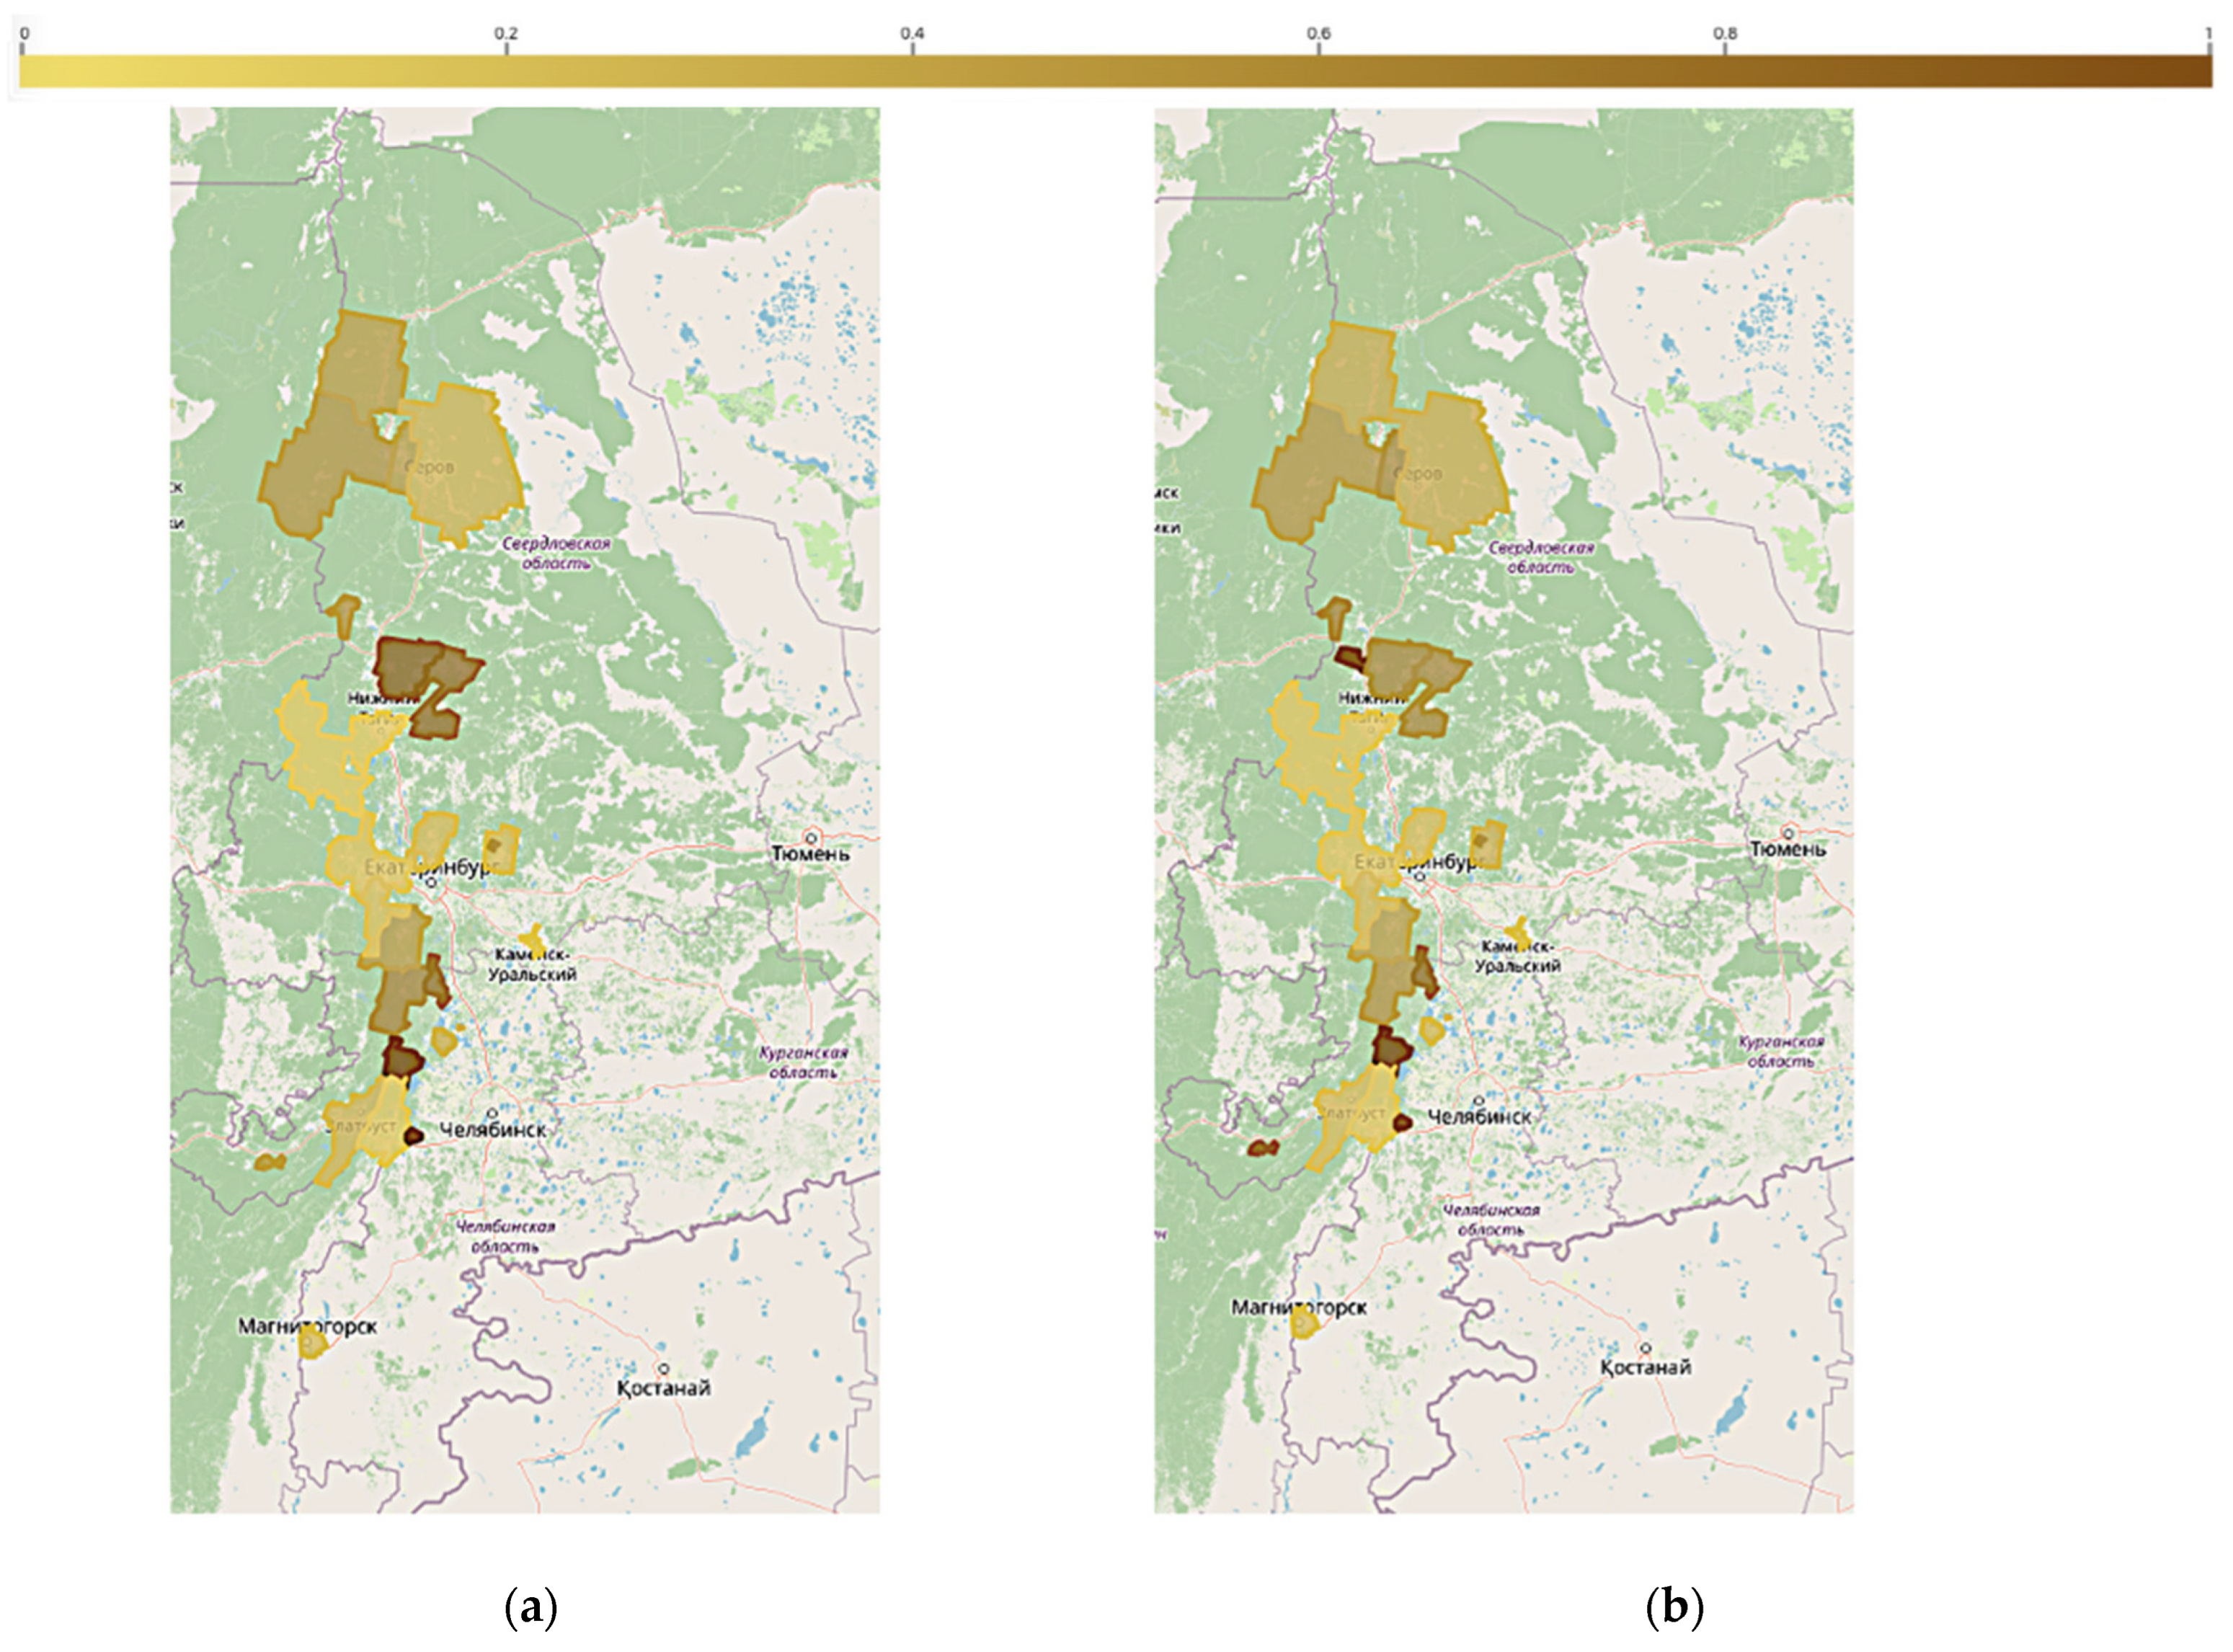
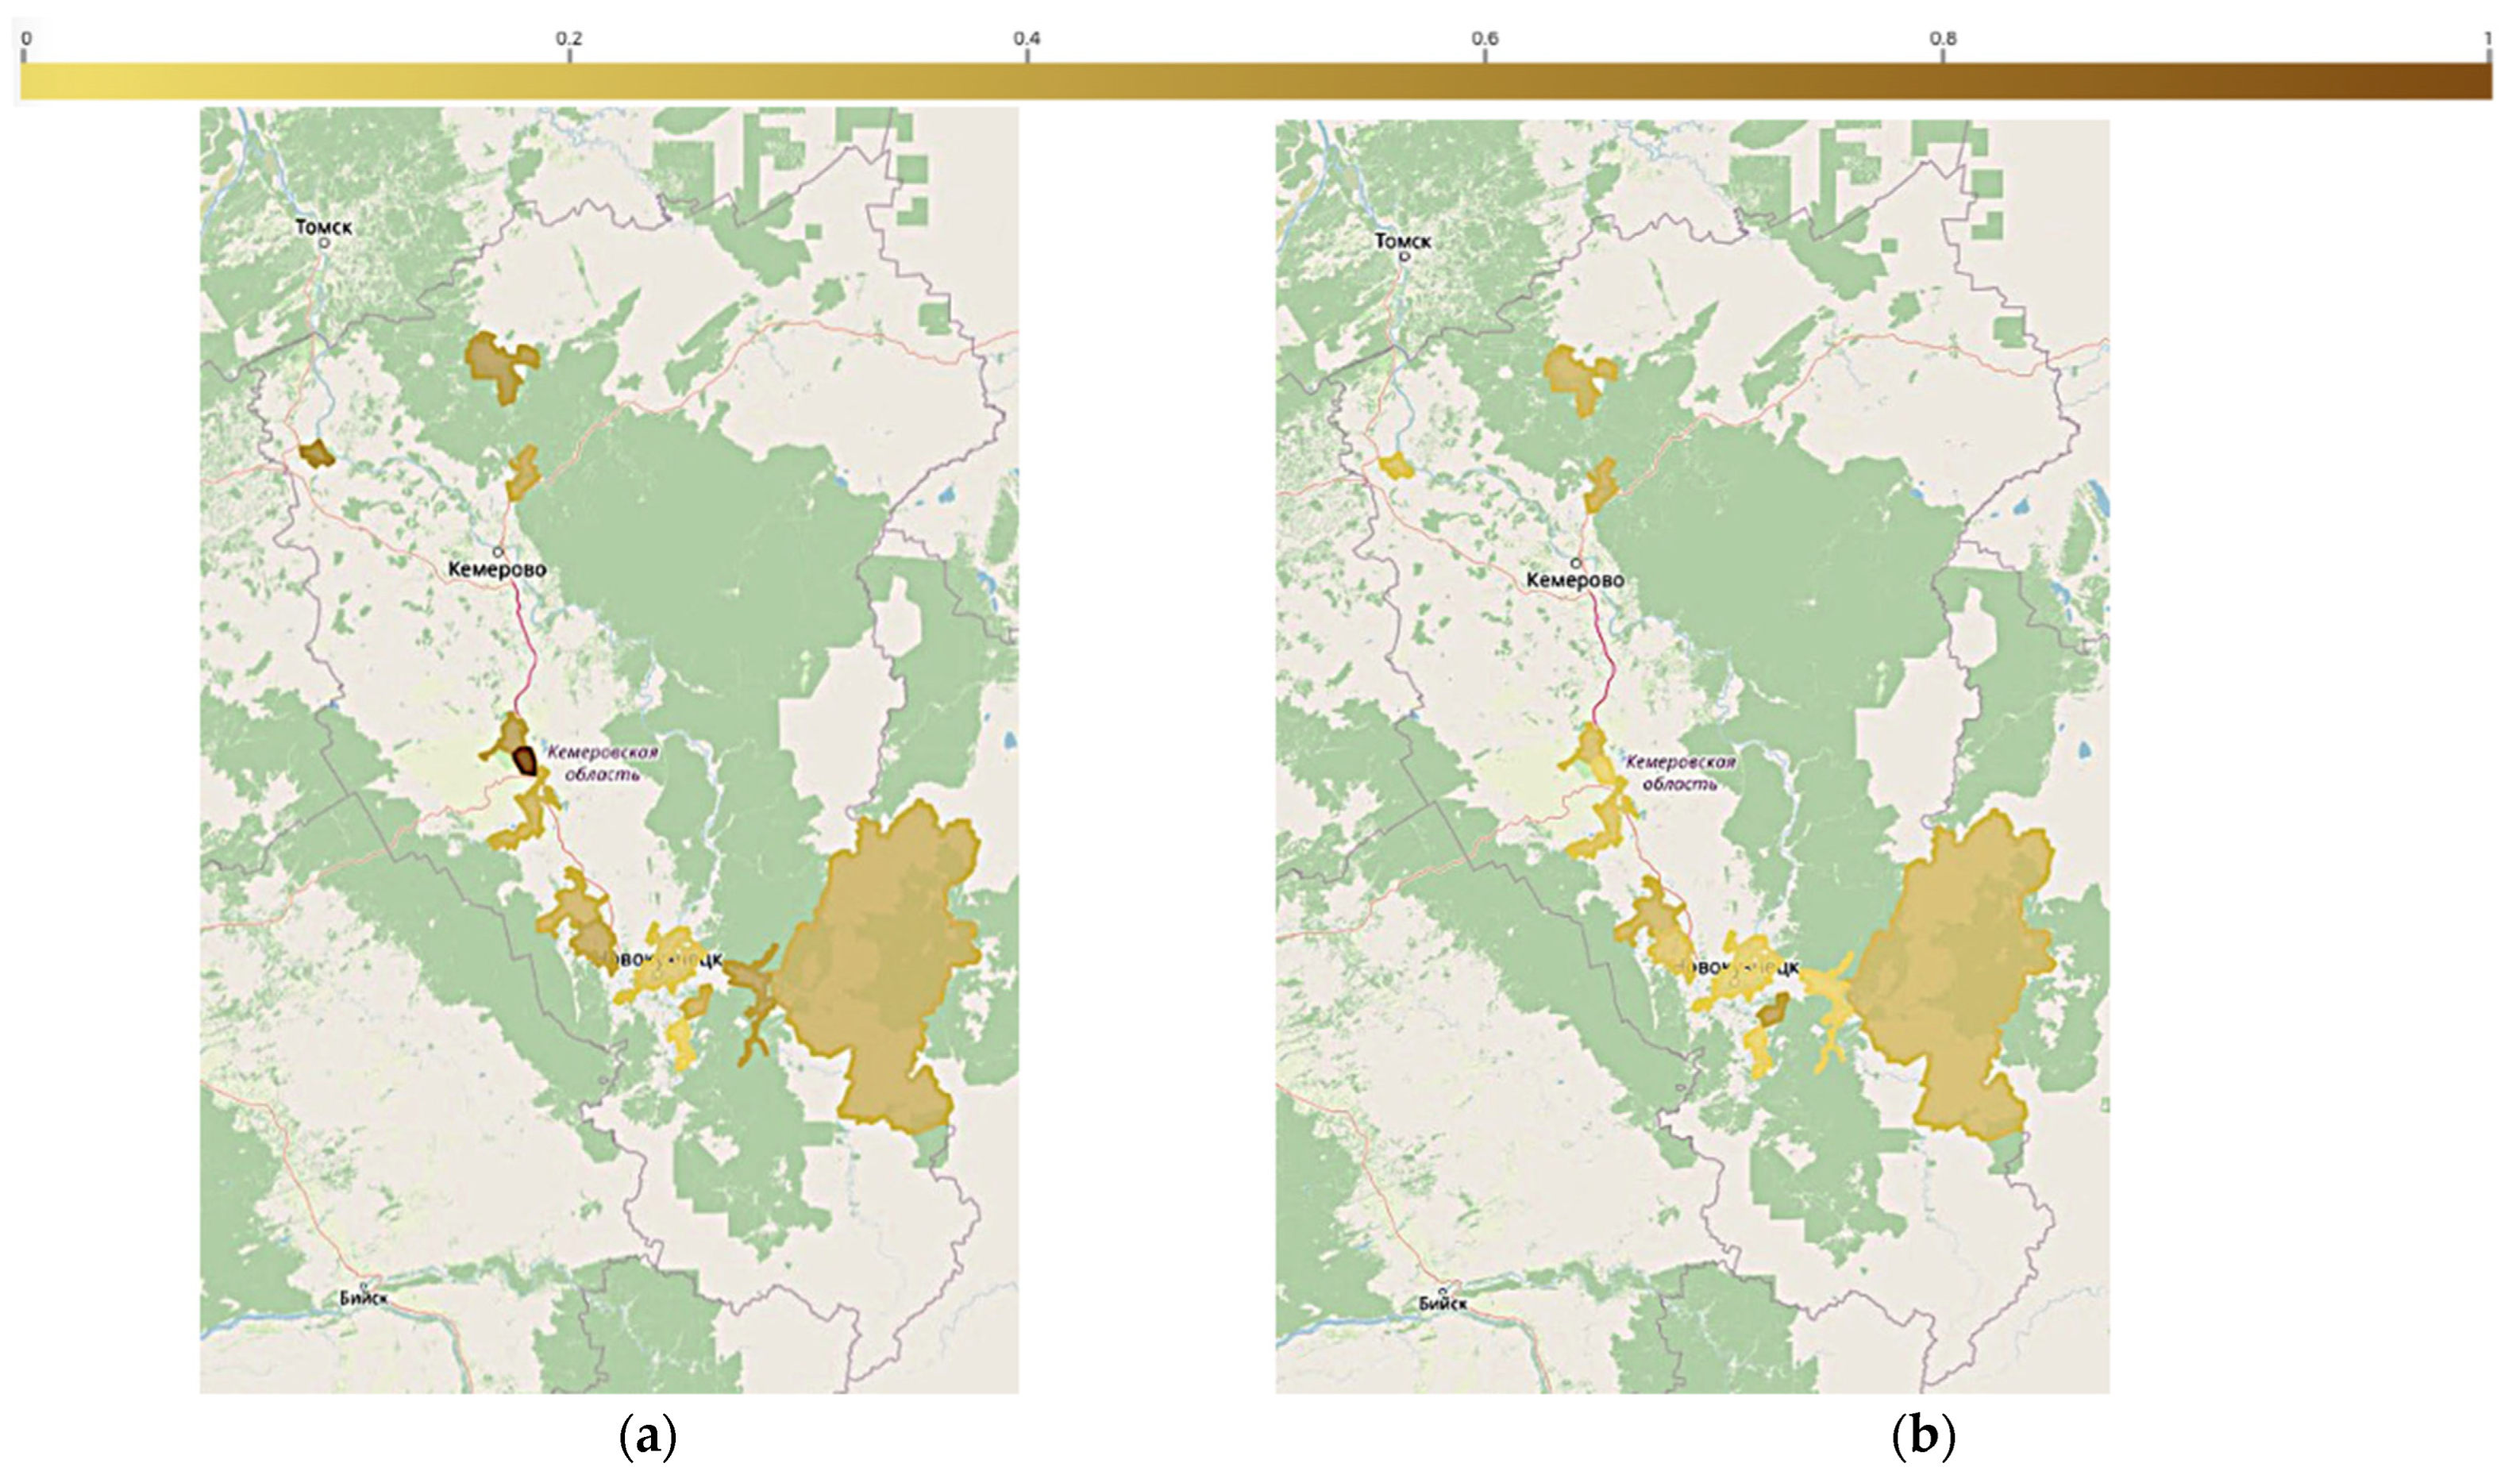
44], which showed that in panel data, all variables exceeded by the modulation of its root-mean-square error are significant. While the as the proportion of mono-industry increases, the diversification of creative industries occurs. There are no resources left in the city economy for the formation of the second economic center, so the creative economy of the city turns into a larger number of small enterprises, relatively equal in terms of revenue. The dynamics of the concentration level from a more to a less concentrated state, which can be seen, confirms the fact of the development of creative industries in general (
Figure 3 and
Figure 4). We use QGIS to visualize it (Open Source Geospatial Foundation, Chicago, IL, USA). In the period from 2013 to 2017, there is a general decrease in the concentration of creative industries in the case of single-industry towns in the Sverdlovsk, Chelyabinsk, and Kemerovo regions. All this supports hypothesis 1: that it is the concentration of mono-industry that acts as an endogenous factor in the development of creative industries of single-industry towns, diversifying the creative industries themselves, but not the city as a whole.
The results of estimating the parameters of regression models show that an increase in the unemployment rate (by 1 standard deviation point) increases the concentration of creative industries (by 0.25–0.33 standard deviation points). Accordingly, a higher level of employment in single-industry towns leads to diversification of creative industries. It also happens because people find themselves in creative industries and obtain employment. This reflects general patterns of development and diversified cities. The traditional evidence of the growth of diversification level includes the number of operating enterprises, as the increase in this indicator (ExEnt) by one unit leads to an increase in diversification (decrease in concentration) by more than one standard deviation (1.21). This pattern is statistically significant in model 4, with fixed effects of regions (ReRegion), as well as in model 2 (RE) and model 5 (OLSDUM Region).
The next conclusion from the estimation results of regression model parameters is that the efficiency of creative industries positively affects the concentration of the latter. A more efficient creative sector in a single-industry city increases the concentration of creative industries, as evidenced by the estimation of parameters of regression model 3 with time fixed effects, model 4 with fixed effects of regions, as well as model 2 with random effects. Higher efficiencies of creative industries in the city determines higher level of creative industry concentration (1 standard deviation point increase) determines a 0.73–1.02 standard deviation increase in concentration. This pattern indicates that the development of creative industries occurs through the stage of monopolization in the market, which in the context of single-industry towns is not a positive trend that contradicts the diversification strategy. Thus, the growth of efficiency of creative industries, contributing to market monopolization, does not allow for a solution to the problems of single-industry towns development, manifesting the effect of institutional path dependence. Investments in fixed assets (Invs), primarily in mono-industries, increase their concentration. In addition, we can make a cautious conclusion about the specifics of the impact of the scale of a single-industry town on the concentration of creative industries—a larger city in terms of revenue concentrates creative industries to a greater extent (Model 1 and 5). However, taking into account the time factor or fixed effects (regions), we do not unambiguously confirm this conclusion. Thus, single-industry towns in particular, due to the effect of institutional path dependence in the process of their development, experience the manifestation of secondary concentration (as we see in the example of creative industries), that is, developing, single-industry towns acquire a second concentrated center, which is unable to fight against mono-industry. This creates a vicious cycle that limits the development of single-industry towns. For further development and provided that a certain scale is reached (when agglomeration effects are involved), the new source of concentration, having defeated the mono-industry, will become a new mono-industry, bringing everything “back to normal”. A single-industry town, therefore, is “stuck” in dynamics between the stages of concentration and attempts at diversification. The latter reasoning confirms hypothesis 2, that it is the single-industry owns due to the effect of institutional path dependence show specific patterns of development which are different from the development of diversified cities.
Creative entrepreneurial activity of the position of organizational-legal form is represented by various organizations, but to a greater extent by individual enterprises, which is established for all studied 38 single-industry towns. However, the financial indicators reflect only the data of organizations, which is a shortcoming of the methodology for assessing creative industries by ARCTEA. We try to eliminate this problem by including an independent variable—the number of established creative individual enterprises (CrIPCI) separately from the number of established creative organizations, represented predominantly by LLCs (CrCIEnt). We were able to identify statistically significant results in models 1 and 4 only for individual enterprises. Cities with higher activity of creative individual enterprises have a more diversified structure of creative industries. However, fixed and random effects models do not support this statistical significance. Thus, hypothesis 3 is partially confirmed. In general, we should note the growth of the overwhelming efficiency of the creative sector of single-industry towns in the period 2013–2017 in the overwhelming number of single-industry towns, which can be seen in
Figure 1 (in green). It should also be noted that testing the impact of IT—sector on the concentration of creative industries did not show statistically significant results. Thus, the development of the IT—sector is not a flagship determining the development of creative industries, which is not in favor of the development of the latter.
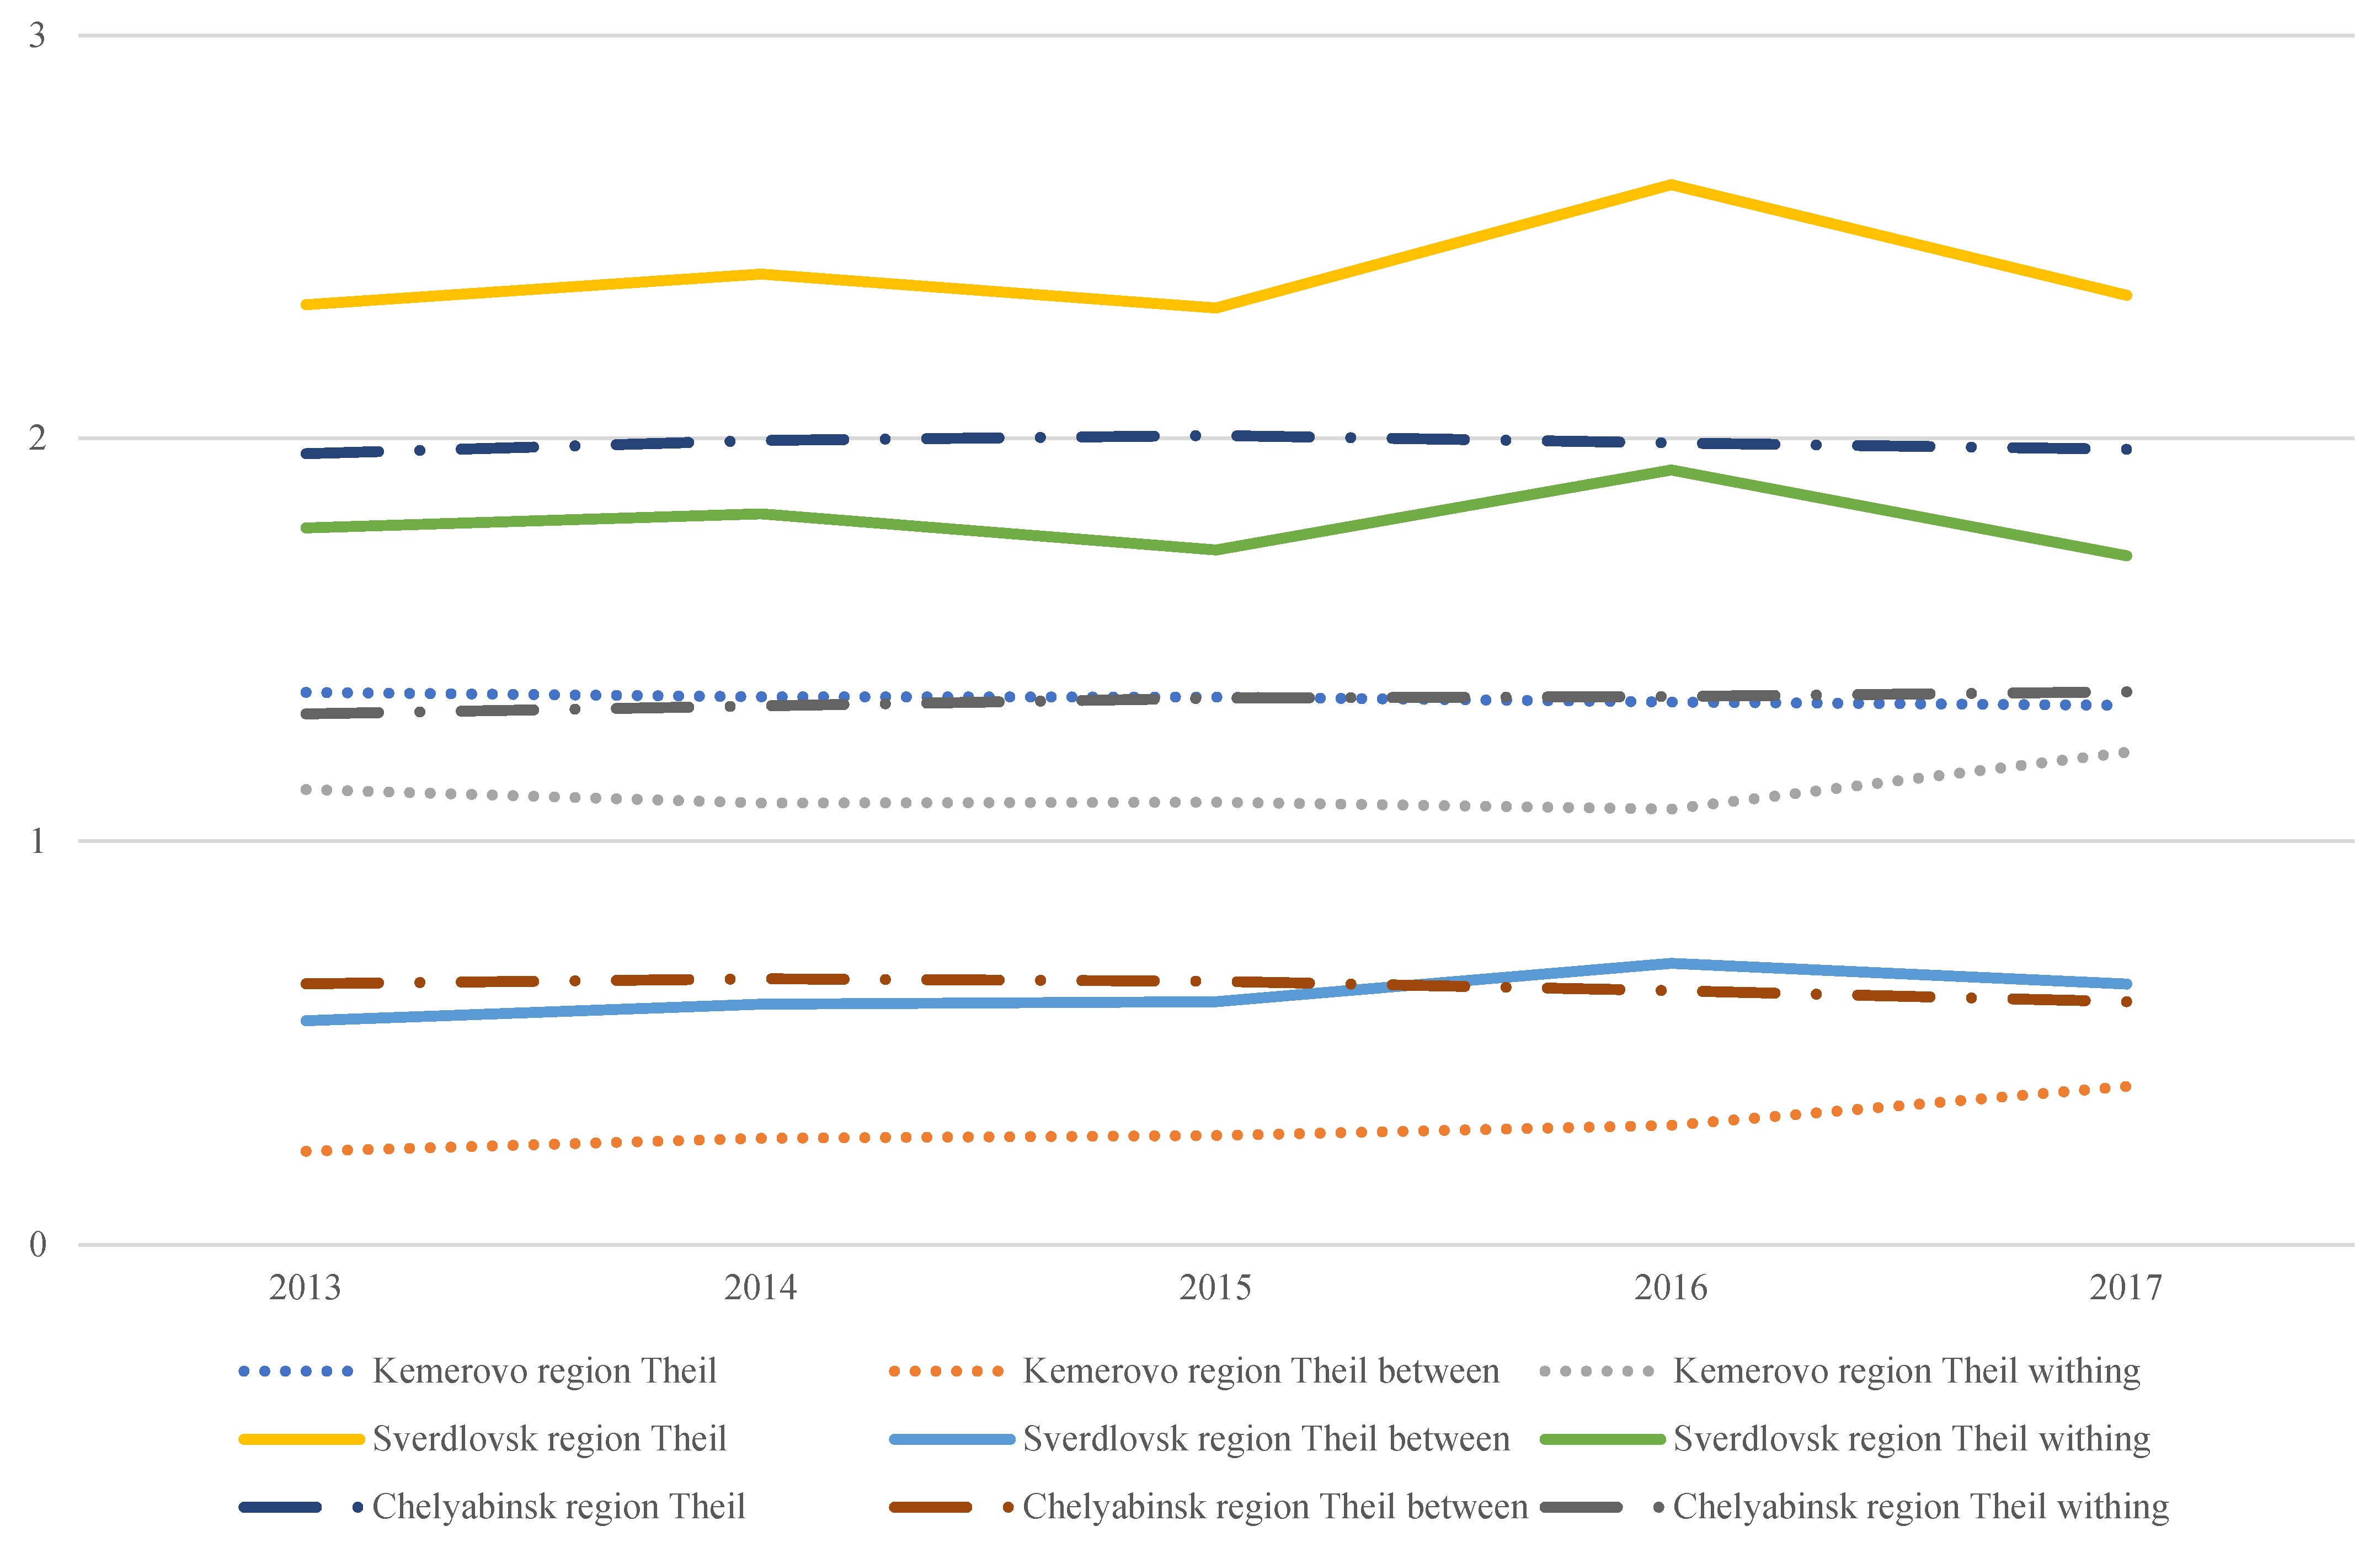
Comparing the results obtained with the Theil index in the regional context, it should be noted that there is no significant index decrease in all three regions—Kemerovo, Sverdlovsk and Chelyabinsk regions, except for a separate decrease in the diversification of organizations activities in 2015 (
Figure 5).
The decomposition of the Theil index showed that the current level of differentiation of enterprises revenue in each of the three regions under consideration is caused to a greater extent by the differences of the enterprises themselves within the regions (Theil within), while the differences between cities explain a relatively smaller part of the variation of enterprises revenue (Theil between). The latter indicates that in the economy of cities and regions under current conditions, there is no shift towards the accumulation of spatial differentiation. Nevertheless, we can see slight growth of spatial heterogeneity of companies in 2016 through all considered companies in three regions, including creative industries.
5. Discussion
This study, in comparison with others, suggests the following. Firstly, a system of methods for assessing diversity and concentration, efficiency and digital development, aggregated from the micro level and assessing the local level of development of a new growth driver—creative industries. The latter is being implemented for the first time, namely, the concentration index is proposed only for the list of creative industries enterprises (HHI
CI), the tail index is proposed and evaluated, taking into account the contribution of enterprises and cities to the level of diversity of the region. Moreover, the model for evaluating the effectiveness of the creative industries through the DEA model is proposed. Comparing with the results of other studies, it should be noted that HHI is applied either in the context of economic activities of cities [
10], or according to the full list of objects of assessment [
20]. The Theil index is calculated based on the data of the region and is calculated at the level of the country and macro-regions [
10]. In our study, it becomes possible to propose reducing the data level to enterprises—towns—regions.
Secondly, we propose the modified algorithm forming the basic model for the development of diversity of the new growth driver at the city level. This algorithm takes into account, on the one hand, the methods for choosing the type of the mathematical model (random, fixed effects, OLS); on the other hand, taking into account possible spatial heterogeneity (control of the significance of the region, Moran I). The totality of the works we have studied does not have a comprehensive approach to the study of cities [
18,
19,
20]. Thus, we offer a reliable basic model for the development of a variety of creative industries at the local level.
Thirdly, the causal relationship of concentration (diversity of creative industries) is logically justified on the efficiency, as well as the concentration of the mono-industry. Thus, offering a more complete algorithm for conducting econometric research for data at the local level. By implementing this algorithm on the example of the creative industries of single–industry towns, we solve the most urgent problem of the regional economy—how to diversify the economy of single-industry towns through creative industries.
The study of the concentration patterns of creative industries in single industry towns allows us to distinguish both traditional models of MAR and Jacobs effects, and specifically, to explain the influence of the institutional dimension. The key factors of concentration of creative industries (MAR—effect localization) are the scale of the single-industry town, the level of unemployment, and the effectiveness of creative industries in the city.
Jacobs effects appear in the case of a larger proportion of mono-industry and the number of operating enterprises. It is assumed that for new high-tech activities, the urbanization effect, which implies a highly diversified urban environment, is more significant, while in the process of maturation, there is a standardization and formalization of knowledge, leading to clustering [
26]. The specialization industries of single-industry towns are at the stage of decline from the position of life cycle stages of the technological mode, while creative industries, on the contrary, including the IT-sector, are at the stage of standardization—as evidenced by the increasing concentration of more efficient creative industries. However, a higher proportion of mono-industries and the number of operating companies, on the contrary, diversify creative industries towards greater variety. This creates an institutional path dependence effect, the essence of which is the discontinuity between the life cycle stages of the mono-industry and emerging creative industries.
At the initial stage of the development of creative industries, their entrepreneurial activity depends on the level of socio-economic development of the city, rather than acts as a driver for the development of the city’s economy.
Institutional path dependence and lock-in mechanisms are usually associated with local peculiarities [
55]. However, in this case we see common patterns in the three largest regions of single-industry towns clustering—Kemerovo, Sverdlovsk, and Chelyabinsk regions. Moreover, the model with fixed effects of regions does not confirm the significance of the contribution of a single region to the level of concentration, which confirms a certain pattern of development of creative industries in single-industry towns. In particular, the fact that the diversification of creative industries is accompanied by a higher share of mono-industry at a smaller scale of single-industry towns, as a result of which, agglomeration effects cannot act as a traditional development factor. First, all this counts in favor of the development of specific policies for the development of creative industries in single-industry towns. And second, it shows the ineffectiveness of direct replication of development practices of relatively diversified cities.
Boix-Domènech and Rausell-Köster use the example of European countries to show that, on the one hand, creative industries have a direct impact on employment, production, technological progress and long-term development [
7]. On the other hand, most of this contribution comes from creative services, while the direct contribution of creative industries is smaller. In single-industry towns this regularity is only intensified, creative industries turn into a new form of creating favorable conditions for people employed in the mono-industry, which is also a lock-in mechanism.
Modern information technologies are now key factors in increasing the efficiency of creative project realization, while creating new areas of activity—VR, AR, the metaverse, IT design, etc. [
56]. However, in the case of single-industry towns, it is not possible to identify statistically significant correlations with the level of concentration of creative industries. This fact indicates the weak embeddedness of IT and the digital immaturity of single-industry towns. Perhaps, it is the gravitation to an earlier technological mode, which the mono-industry belongs to, that does not allow these processes to develop.
Thus, despite the fact that creative industries are considered one of the main tools for regional development, job creation, formation of social unity, as well as a catalyst for economic growth [
28], single-industry towns nevertheless create conditions for blocking the development of these activities. Foreign experience allows one to conclude that the process of “unblocking” includes the development of intermediate institutions [
57,
58].
The key limitation of the developed basic model is the time period of 2013–2017. Under conditions where the basic laws of the development of new drivers at the local level are not defined, diversity and efficiency factors are not insufficiently studied, it is too early to discuss the impact of external macroeconomic factors on them. We deliberately have chosen this period for the basic mathematical model elaboration due to absence of the consequences of COVID-19, sanctions, as well as other external macro factors of the Russian economy. These factors represent a complex plexus and “overlaps” with each other with a time lag, which can be evaluated in the future, with this model taken as a base. This circumstance made it possible to identify an increase in the spatial autocorrelation of residues, which may indicate the formation of the effect of the spillover effect of creative industries. Thus, this study lays the foundations for a new direction of empirical substantiation of the effects of overflow. In addition, knowing the basic factors of the diversity of creative industries, prospects open up for assessing the impact of external factors (COVID-19, sanctions, etc.) on the spatial inequality of cities and regions.
As a field of practical application, we propose a model for the formation of a variety of creative industries in single–industry towns—the most problematic settlements in the Russian Federation, whose problems still have not been officially resolved. In our opinion, a new wave of development, driven by creative industries, can become a tool for diversifying and improving the living conditions of the population of single-industry towns. To achieve this, it is necessary to focus on maintaining the efficiency of the industries themselves in the city, the main actor of which should be the city-forming enterprise through the tools of corporate social responsibility. In view of the latter, it is proposed to develop tools for corporate creative responsibility of single-industry organizations to the city and region.
6. Conclusions
In this study, we have presented eight stages of the algorithm for the complex elaboration of the regression model for local-level data. At the third step, we offered the system of indicators of concentration and diversity; additionally, efficiency and digitalization at the local level, including specific Herfindahl-Hirschman, Teil, DEA-efficiency, revenue of IT companies, were proposed. Based on the system of indicators, a basic model for the development of the diversity of creative industries in the most problematic municipalities—single-industry towns—has been developed. The mathematical novelty of the model formation is the combination of step 5 (testing the fixed effect, random effect and OLS models), step 6 (testing the regional fixed effects separately (the fixed effect model and OLS with dummy variables), step 7 and 8 (the F test, Hausman Test, and Lagrange multiplier test (Breusch-Pagan); Moran I). It allows us to take the more comprehensive approach to the empirical justification of the model in the case of single-industry towns. This algorithm allows us prove the data period and identify the tendency of spatial heterogeneity growth. We suppose it to be the growing spillover effect in creative industries.
The results show that despite the positive dynamics of reduction in the concentration of creative industries in single-industry towns, mono-industry continues to have a significant impact on their development, which forms the basis of the institutional path dependence. The general concern about the issue of strengthening spatial differentiations during the period under review was not confirmed. The spatial differentiation of the revenues of enterprises exists, but its growth was not observed; rather, individual decreases were observed. Creative industries in the majority of single-industry towns in general show an increase in efficiency, as well as entrepreneurial activity, which counts in favor of the development of tools and intermediate institutions to overcome the institutional path dependence. The main driver of development in a town is a city-forming enterprise utilizing the tools of corporate social responsibility. Considering this, it is recommended to devise mechanisms for single-industry organizations to exhibit corporate creative responsibility towards the city and region. Ultimately, the overall apprehension regarding the rise of spatial disparities at the urban and regional level is currently not substantial.


