
Combined Framework of Multicriteria Methods to Identify Quality Attributes in Augmented Reality Applications

 ,
,  ,
,  ,
,  ,
,  ,
,  and
and
Abstract
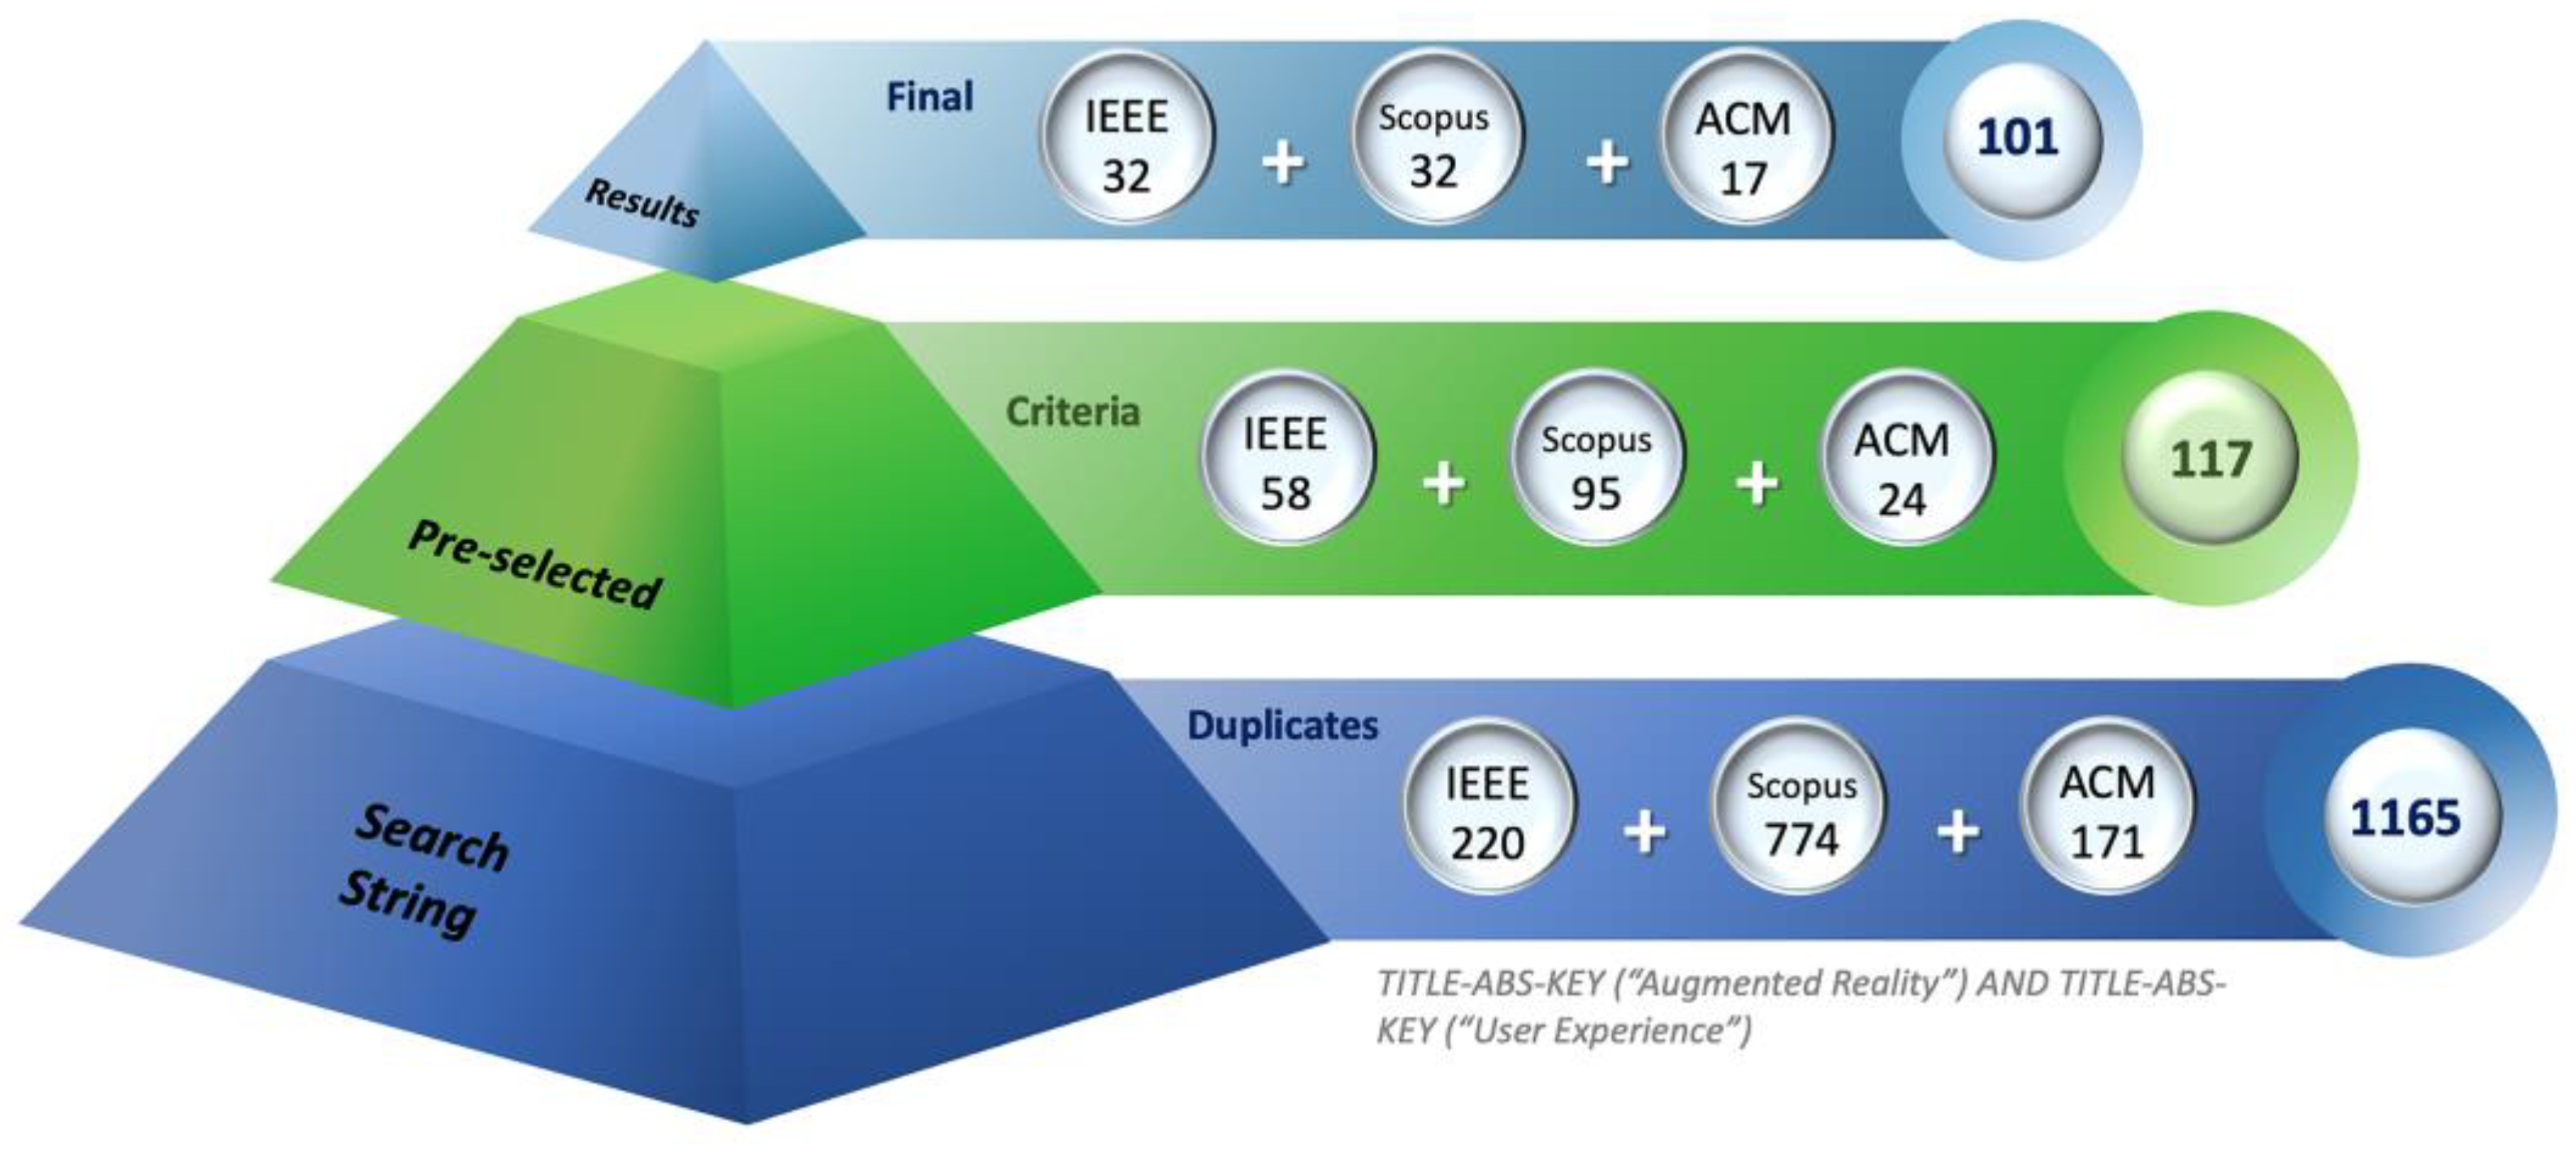
1. Introduction
2. Literature Review
2.1. UX Attributes in AR Applications
- ▪
- AR research focus has been oriented toward the definition and measurement of quality indicators of user experience [24]. However, there is no general consensus on what elements should be analyzed when fully evaluating an AR solution;
- ▪
- There are studies on evaluations of the use of AR applications where they use tools such as surveys, interviews, evaluation by experts, and biometric measurements. However, they are mechanisms external to the application and have a high degree of subjectivity;
- ▪
- No tools were identified that evaluate augmented reality applications in industrial contexts with quantitative techniques or methods integrated into the industrial prototype;
- ▪
- Interest in the industrial sector in conducting training through AR applications. In the works by [25,26,27], training with AR applications is carried out, resulting in improvements in the time for completing a task (task completion time), and in the reduction in the number of errors (error counts).
2.2. Importance of Multicriteria Decision Methods
2.2.1. Analytic Hierarchy Process (AHP)
2.2.2. Analytic Network Process (ANP)
2.2.3. Clustering
- Hierarchical Methods: These types of algorithms do not require the user to specify the cluster number in advance (agglomerative clustering, divisive clustering);
- Non-Hierarchical Method: These types of algorithms require the user to specify in advance the number of clusters to be created (K-means, K-medoids, CLARA);
- Other methods: Methods that combine or modify the previous ones (hierarchical K means, fuzzy clustering, model-based clustering, and density-based clustering).
2.2.4. DEMATEL
2.2.5. Fuzzy Cognitive Map (FCM)
2.2.6. Multi-Attributive Border Approximation Area Comparison (MABAC)
2.2.7. TODIM
2.2.8. Technique for Order Performance by Similarity to Ideal Solution (TOPSIS)
2.2.9. VIKOR
2.3. Use of Multicriteria Decision Methods in AR
3. Methodology
3.1. Phase 1. Selection of Quality Attributes to Include in the Study
- Q1: How is the user experience measured in AR applications?
- Q2: What are the user experience quality metrics used in augmented reality applications?
3.2. Phase 2. Selection of Multi-Criteria Methods for the Construction of the Ranking
3.2.1. MCDM Analysis
3.2.2. Construction of the Instruments to Be Evaluated by Experts
- Very Low: The attribute does not contribute significantly to the user experience using augmented reality applications.
- Very High: The contribution of the attribute is essential to improve the user experience using augmented reality applications.
3.2.3. Expert Panel Selection Process
- Review of profiles in academic and business platforms. The selected profiles were those who met: (1) two-year experience or more in software development with AR, (2) two-year experience or more in the productive sector projects with AR, and (3) one-year experience or more in the academic environment;
- Sending an email where the investigation is presented, inquiring if the person was interested in joining the panel of experts;
- Review of the people who gave an affirmative answer by the researchers;
- Sending an email with the Qualitative Level of Influence instrument;
- In the second phase of the investigation, the DEMATEL assessment instrument is sent.
3.3. Phase 3. Identification of Causality and Clustering between Attributes
3.3.1. Stage 1: FCM Method
- Step 1: Generation of the initial matrix of success IMS.
- Step 2: Obtaining the fuzzified matrix of success FZMS.
- Step 3: Obtaining the strength of relationships matrix of success SRMS.
- Step 4: Indicators assessment.
- The outdegree indicator is the sum of the values in the adjacent array associated with the connectors leaving a node or variable. A transmitter variable presents a high outdegree.
- The indegree indicator is the sum of the values of the adjacent matrix associated with the connections entering a node. This indicator shows the degree of dependence of the variable. A receiving variable has a high indegree.
- The centrality indicator is the sum of the outdegree and indegree indicators. This indicator shows the degree of participation or importance of the variable in the system.
3.3.2. Stage 2: Clustering Method
- Step 1: Defining the number of clusters.
- Step 2: SRMS matrix processing.
3.4. Phase 4. Attribute Prioritization and Cause-Effect Analysis by DEMATEL Method
- Step 1: Generation of the direct relationship matrix A.
- Step 2: Normalization of the direct relationship matrix.
- Step 3: Obtaining the total relationship matrix.
- Step 4: Determine the cause group and effect group.
- Step 5: Weighting of the attributes.
4. Case Study
4.1. Selected Quality Attributes
4.2. Selected Multicriteria Methods
4.2.1. Analysis of the Selected Multicriteria Methods
4.2.2. Applied Instruments and Experts Profiles
4.3. FCM Method Application
4.3.1. Indicator Analysis of the IMS and SRMS Matrices
4.3.2. Analysis of the FZMS Matrix Importance
4.3.3. Analysis of the SRMS Matrix Results
| Algorithm 1 Implementation of matrix SRMS | |
| 1: | Enter the FZMS matrix. |
| 2: | The size of the FZMS matrix is calculated. |
| 3: | k = 1 |
| 4: | while (k n) |
| 5: | for (j = 1, m) |
| 6: | for (i = 1, n) |
| 7: | if (FZMS ((k, j) − FZMS (i, j)) < 0) |
| 8: | B(i, j) = FZMS (i, j) − FZMS ((k, j) |
| 9: | else |
| 10: | B(i, j) = FZMS ((k, j) − FZMS (i, j) |
| 11: | end if |
| 12: | end for |
| 13: | end for |
| 14: | for (i = 1, n) |
| 15: | accumulated = 0 |
| 16: | for (j = 1, m) |
| 17: | accumulated = accumulated + B(i, j) |
| 18: | end for |
| 19: | Average = accumulated/m |
| 20: | P(i) = Average |
| 21: | D(i) = 1 − P(i) |
| 22: | end for |
| 23: | for (j = 1, n) |
| 24: | S(k, j) = D(j) |
| 25: | if (k = j) |
| 26: | S(k, j) = 0 |
| 27: | end if |
| 28: | end for |
| 29: | k = k + 1 |
| 30: | end while |
4.3.4. Indicators Analysis
4.3.5. Weighting of Attributes Based on the Centrality Criterium
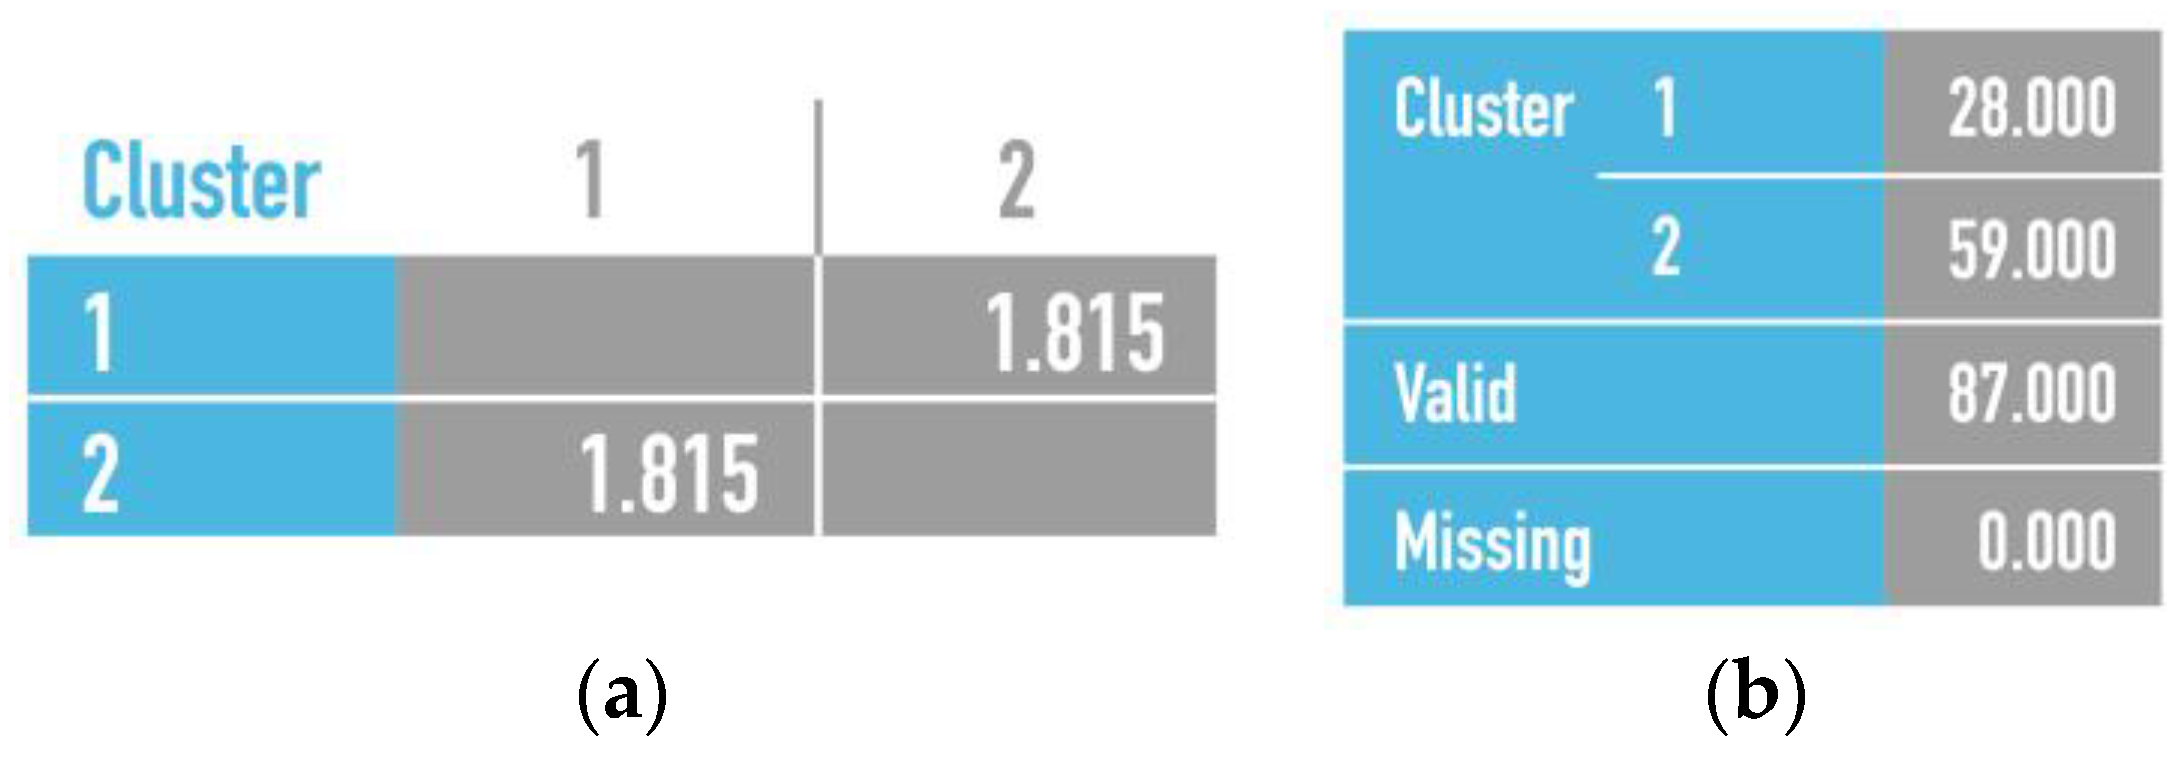
4.4. Clustering Method Application
4.4.1. Distances and Cases by Clusters
4.4.2. Clustering Method Results
4.5. DEMATEL Method Application
4.5.1. Results Matrices
4.5.2. Ranking by DEMATEL
4.5.3. Influence Relationships among Attributes
5. Discussion
6. Conclusions, Limitations, and Future Work
6.1. Conclusions
6.2. Limitations and Future Work
Supplementary Materials
Author Contributions
Funding
Data Availability Statement
Acknowledgments
Conflicts of Interest
References
- Azuma, R.T. A Survey of Augmented Reality. Presence Teleoper. Virtual Environ. 1997, 6, 355–385. [Google Scholar] [CrossRef]
- Brown, M.; Mccormack, M.; Reeves, J.; Brooks, D.C.; Grajek, S.; Bali, M.; Bulger, S.; Dark, S.; Engelbert, N.; Gannon, K.; et al. 2020 EDUCAUSE Horizon Report. Teaching and Learning Edition; Educause: Louisville, CO, USA, 2020. [Google Scholar]
- Dey, A.; Billinghurst, M.; Lindeman, R.W.; Swan, J.E. A Systematic Review of 10 Years of Augmented Reality Usability Studies: 2005 to 2014. Front. Robot. AI 2018, 5, 16–17. [Google Scholar] [CrossRef] [PubMed]
- Tatwany, L.; Ouertani, H.C. A Review on Using Augmented Reality in Text Translation. In Proceedings of the 2017 6th International Conference on Information and Communication Technology and Accessibility (ICTA), Muscat, Oman, 19–21 December 2017; pp. 1–6. [Google Scholar]
- Kim, S.K.; Kang, S.J.; Choi, Y.J.; Choi, M.H.; Hong, M. Augmented-Reality Survey: From Concept to Application. KSII Trans. Internet Inf. Syst. 2017, 11, 982–1004. [Google Scholar] [CrossRef]
- ABIresearch AR and VR Solutions Are Key Enablers for a New Normal in Human Resources, Training, and Collaboration. Available online: https://www.abiresearch.com/press/ar-remote-expertise-and-training-applications-have-almost-60-million-active-users-2025/ (accessed on 6 April 2021).
- Wang, L.; Lv, M. Study on Assessing User Experience of Augmented Reality Applications. In HCII 2020: Virtual, Augmented and Mixed Reality. Design and Interaction; Springer: Berlin/Heidelberg, Germany, 2020; pp. 208–222. [Google Scholar]
- Bueno, S.; Gallego, M.D.; Noyes, J. Uses and Gratifications on Augmented Reality Games: An Examination of Pokémon Go. Appl. Sci. 2020, 10, 1644. [Google Scholar] [CrossRef]
- Satti, F.A.; Hussain, J.; Muhammad Bilal, H.S.; Khan, W.A.; Khattak, A.M.; Yeon, J.E.; Lee, S. Holistic User EXperience in Mobile Augmented Reality Using User EXperience Measurement Index. In Proceedings of the 2019 Conference on Next Generation Computing Applications (NextComp), Mauritius, 19–21 September 2019; pp. 1–6. [Google Scholar]
- Lovos, E.N. Augmented Educational Material. User Experience Analysis. Edutec. Rev. Electrónica de Tecnol. Educ. 2019, 57–67. [Google Scholar] [CrossRef]
- Pringle, A.; Hutka, S.; Mom, J.; van Esch, R.; Heffernan, N.; Chen, P. Ethnographic Study of a Commercially Available Augmented Reality HMD App for Industry Work Instruction. In Proceedings of the 12th ACM International Conference on PErvasive Technologies Related to Assistive Environments, Rhodes, Greece, 5–7 June 2019; ACM: New York, NY, USA, 2019; pp. 389–397. [Google Scholar]
- Greenfeld, A.; Lugmayr, A.; Lamont, W. Comparative Reality: Measuring User Experience and Emotion in Immersive Virtual Environments. In Proceedings of the 2018 IEEE International Conference on Artificial Intelligence and Virtual Reality (AIVR), Taichung, Taiwan, 10–12 December 2018; pp. 204–209. [Google Scholar]
- Irshad, S.; Awang Rambli, D.R.; Muhamad Nazri, N.I.A.; binti Mohd Shukri, S.R.; Omar, Y. Measuring User Experience of Mobile Augmented Reality Systems Through Non-Instrumental Quality Attributes. In Communications in Computer and Information Science; Abdullah, N., Wan Adnan, W.A., Foth, M., Eds.; Springer: Singapore, 2018; Volume 886, pp. 349–357. ISBN 978-981-13-1627-2. [Google Scholar]
- Heo, M.-H.; Kim, D.; Lee, J. Evaluating User Experience of Augmented Reality-Based Automobile Maintenance Content -Mobile Device and HoloLens Comparison-. Int. J. Control. Autom. 2018, 11, 187–196. [Google Scholar] [CrossRef]
- Werrlich, S.; Daniel, A.; Ginger, A.; Nguyen, P.-A.; Notni, G. Comparing HMD-Based and Paper-Based Training. In Proceedings of the 2018 IEEE International Symposium on Mixed and Augmented Reality (ISMAR), Munich, Germany, 16–20 October 2018; pp. 134–142. [Google Scholar]
- Sekhavat, Y.A.; Parsons, J. The Effect of Tracking Technique on the Quality of User Experience for Augmented Reality Mobile Navigation. Multimed. Tools Appl. 2018, 77, 11635–11668. [Google Scholar] [CrossRef]
- Han, D.I.; tom Dieck, M.C.; Jung, T. User Experience Model for Augmented Reality Applications in Urban Heritage Tourism. J. Herit. Tour. 2018, 13, 46–61. [Google Scholar] [CrossRef]
- Cheng, K.H. Parents’ User Experiences of Augmented Reality Book Reading: Perceptions, Expectations, and Intentions. Educ. Technol. Res. Dev. 2019, 67, 303–315. [Google Scholar] [CrossRef]
- Xu, W.; Liang, H.-N.; Zhao, Y.; Yu, D.; Monteiro, D. DMove: Directional Motion-Based Interaction for Augmented Reality Head-Mounted Displays. In Proceedings of the Proceedings of the 2019 CHI Conference on Human Factors in Computing Systems, Glasgow, UK, 4–9 May 2019; ACM: New York, NY, USA, 2019; pp. 1–14. [Google Scholar]
- Hamacher, A.; Hafeez, J.; Csizmazia, R.; Whangbo, T.K. Augmented Reality User Interface Evaluation—Performance Measurement of Hololens, Moverio and Mouse Input. Int. J. Interact. Mob. Technol. 2019, 13, 95. [Google Scholar] [CrossRef]
- Montuwy, A.; Cahour, B.; Dommes, A. Older Pedestrians Navigating With AR Glasses and Bone Conduction Headset. In Proceedings of the Extended Abstracts of the 2018 CHI Conference on Human Factors in Computing Systems, Montreal, QC, Canada, 21–26 April 2018; ACM: New York, NY, USA, 2018; pp. 1–6. [Google Scholar]
- Merino, L.; Bergel, A.; Nierstrasz, O. Overcoming Issues of 3D Software Visualization through Immersive Augmented Reality. In Proceedings of the 2018 IEEE Working Conference on Software Visualization (VISSOFT), Madrid, Spain, 24–25 September 2018; pp. 54–64. [Google Scholar]
- Seok, A.; Choi, Y. A Study on User Experience Evaluation of Glasses-Type Wearable Device with Built-in Bone Conduction Speaker. In Proceedings of the 2018 ACM International Conference on Interactive Experiences for TV and Online Video, Seoul, Republic of Korea, 26–28 June 2018; ACM: New York, NY, USA, 2018; pp. 203–208. [Google Scholar]
- Dünser, A.; Grasset, R.; Billinghurst, M. A Survey of Evaluation Techniques Used in Augmented Reality Studies. In Proceedings of the ACM SIGGRAPH ASIA 2008 Courses on—SIGGRAPH Asia ’08; ACM Press: New York, New York, USA, 2008; pp. 1–27. [Google Scholar]
- Westerfield, G.; Mitrovic, A.; Billinghurst, M. Intelligent Augmented Reality Training for Motherboard Assembly. Int. J. Artif. Intell. Educ. 2015, 25, 157–172. [Google Scholar] [CrossRef]
- Randeniya, N.; Ranjha, S.; Kulkarni, A.; Lu, G. Virtual Reality Based Maintenance Training Effectiveness Measures—A Novel Approach for Rail Industry. In Proceedings of the 2019 IEEE 28th International Symposium on Industrial Electronics (ISIE), Vancouver, BC, Canada, 12–14 June 2019; pp. 1605–1610. [Google Scholar]
- Webel, S.; Bockholt, U.; Engelke, T.; Gavish, N.; Olbrich, M.; Preusche, C. An Augmented Reality Training Platform for Assembly and Maintenance Skills. Robot. Auton. Syst. 2013, 61, 398–403. [Google Scholar] [CrossRef]
- Jahantigh, F.F.; Khanmohammadi, E.; Sarafrazi, A. Crisis Management Model Using Fuzzy Cognitive Map. Int. J. Bus. Excell. 2018, 16, 177. [Google Scholar] [CrossRef]
- Bakhtavar, E.; Shirvand, Y. Designing a Fuzzy Cognitive Map to Evaluate Drilling and Blasting Problems of the Tunneling Projects in Iran. Eng. Comput. 2019, 35, 35–45. [Google Scholar] [CrossRef]
- Kazemi, F.; Bahrami, A.; Abdolahi Sharif, J. Mineral Processing Plant Site Selection Using Integrated Fuzzy Cognitive Map and Fuzzy Analytical Hierarchy Process Approach: A Case Study of Gilsonite Mines in Iran. Miner. Eng. 2020, 147, 106143. [Google Scholar] [CrossRef]
- Infante-Moro, A.; Infante-Moro, J.C.; Gallardo-Pérez, J. Los Mapas Cognitivos Difusos y Su Aplicación En La Investigación de Las Ciencias Sociales: Estudio de Sus Principales Problemáticas. Educ. Knowl. Soc. (EKS) 2021, 22, e26380. [Google Scholar] [CrossRef]
- Malakoutikhah, M.; Alimohammadlou, M.; Jahangiri, M.; Rabiei, H.; Faghihi, S.A.; Kamalinia, M. Modeling the Factors Affecting Unsafe Behaviors Using the Fuzzy Best-Worst Method and Fuzzy Cognitive Map. Appl. Soft Comput. 2022, 114, 108119. [Google Scholar] [CrossRef]
- Gutiérrez, L.E.; Guerrero, C.A.; López-Ospina, H.A. Ranking of Problems and Solutions in the Teaching and Learning of Object-Oriented Programming. Educ. Inf. Technol. 2022, 27, 7205–7239. [Google Scholar] [CrossRef] [PubMed]
- Izzo, F.; Camminatiello, I.; Sasso, P.; Solima, L.; Lombardo, R. Creating Customer, Museum and Social Value through Digital Technologies: Evidence from the MANN Assiri Project. Socio-Econ. Plan. Sci. 2023, 85, 101502. [Google Scholar] [CrossRef]
- Bouksim, M.; Zakani, F.; Arhid, K.; Aboulfatah, M.; Gadi, T. New Approach for 3D Mesh Retrieval Using Data Envelopment Analysis. Int. J. Intell. Eng. Syst. 2018, 11, 1–10. [Google Scholar] [CrossRef]
- Saaty, T.L. Decision Making—The Analytic Hierarchy and Network Processes (AHP/ANP). J. Syst. Sci. Syst. Eng. 2004, 13, 1–35. [Google Scholar] [CrossRef]
- Saaty, T.L. Fundamentals of the Analytic Network Process—Dependence and Feedback in Decision-Making with a Single Network. J. Syst. Sci. Syst. Eng. 2004, 13, 129–157. [Google Scholar] [CrossRef]
- Rodríguez, M.D.; Ariza, Á.L.G.; Pérez, A.H.; Mora, M.E.D. Introducción Al Análisis Estadístico Multivariado Aplicado. Experiencia y Casos En El Caribe Colombiano; Editorial Universidad del Norte: Barranquilla, Colombia, 2016; ISBN 9789587419269. [Google Scholar]
- Wu, H.-H.; Chang, S.-Y. A Case Study of Using DEMATEL Method to Identify Critical Factors in Green Supply Chain Management. Appl. Math. Comput. 2015, 256, 394–403. [Google Scholar] [CrossRef]
- Sharifpour, H.; Ghaseminezhad, Y.; Hashemi-Tabatabaei, M.; Amiri, M. Investigating Cause-and-Effect Relationships between Supply Chain 4.0 Technologies. Eng. Manag. Prod. Serv. 2022, 14, 22–46. [Google Scholar] [CrossRef]
- Rodriguez-Repiso, L.; Setchi, R.; Salmeron, J.L. Modelling IT Projects Success with Fuzzy Cognitive Maps. Expert Syst. Appl. 2007, 32, 543–559. [Google Scholar] [CrossRef]
- Kotsopoulos, K.I.; Papadopoulos, A.; Babathanasis, A.; Axiotopoulos, S. A Research in the Design of Augmented Reality Gamified Mobile Applications for Promoting Traditional Products Implemented in Ambient Intelligence Environment of Small Shops. In Proceedings of the 2020 11th International Conference on Information, Intelligence, Systems and Applications (IISA), Piraeus, Greece, 15–17 July 2020; pp. 1–8. [Google Scholar]
- Pamučar, D.; Ćirović, G. The Selection of Transport and Handling Resources in Logistics Centers Using Multi-Attributive Border Approximation Area Comparison (MABAC). Expert Syst. Appl. 2015, 42, 3016–3028. [Google Scholar] [CrossRef]
- Roy, J.; Ranjan, A.; Debnath, A.; Kar, S. An Extended MABAC for Multi-Attribute Decision Making Using Trapezoidal Interval Type-2 Fuzzy Numbers. arXiv 2016, arXiv:1607.01254. [Google Scholar]
- Lourenzutti, R.; Krohling, R.A. TODIM Based Method to Process Heterogeneous Information. Procedia Comput. Sci. 2015, 55, 318–327. [Google Scholar] [CrossRef]
- Opricovic, S.; Tzeng, G.-H. Compromise Solution by MCDM Methods: A Comparative Analysis of VIKOR and TOPSIS. Eur. J. Oper. Res. 2004, 156, 445–455. [Google Scholar] [CrossRef]
- Shekhovtsov, A.; Sałabun, W. A Comparative Case Study of the VIKOR and TOPSIS Rankings Similarity. Procedia Comput. Sci. 2020, 176, 3730–3740. [Google Scholar] [CrossRef]
- Touami, O.; Djekoune, O.; Benbelkacem, S.; Mellah, R.; Guerroudji, M.A.; Zenati-Henda, N. An Application of a Fuzzy TOPSIS Multi-Criteria Decision Analysis Algorithm for Augmented Reality Maintenance Aid Systems Selection. In Proceedings of the 2022 2nd International Conference on Advanced Electrical Engineering (ICAEE), Constantine, Algeria, 29–31 October 2022; pp. 1–6. [Google Scholar]
- Touami, O.; Djekoune, O.; Benbelkacem, S.; Mellah, R.; Guerroudji, M.A.; Zenati-Henda, N. Evaluation of Augmented Reality Maintenance Assistance Systems: An Integrated AHP and Fuzzy-Topsis Model. In Proceedings of the 2022 International Conference on Advanced Aspects of Software Engineering (ICAASE), Constantine, Algeria, 17–18 September 2022; pp. 1–8. [Google Scholar]
- Kitchenham, B.; Charters, S. Guidelines for Performing Systematic Literature Reviews in Software Engineering; ResearchGate: Erlin, Germany, 2007. [Google Scholar]
- Brereton, P.; Kitchenham, B.A.; Budgen, D.; Turner, M.; Khalil, M. Lessons from Applying the Systematic Literature Review Process within the Software Engineering Domain. J. Syst. Softw. 2007, 80, 571–583. [Google Scholar] [CrossRef]
- Bidel, M.J.; Safari, H.; Amoozad Mahdiraji, H.; Zavadskas, E.K.; Antucheviciene, J. A Framework for Project Delivery Systems via Hybrid Fuzzy Risk Analysis: Application and Extension in ICT. Mathematics 2022, 10, 3185. [Google Scholar] [CrossRef]
- Huang, S.-F. Using Linguistic VIKOR and Fuzzy Cognitive Maps to Select Virtual Reality Games Development Project. Mathematics 2021, 9, 1253. [Google Scholar] [CrossRef]
- Poczeta, K.; Papageorgiou, E.I.; Gerogiannis, V.C. Fuzzy Cognitive Maps Optimization for Decision Making and Prediction. Mathematics 2020, 8, 2059. [Google Scholar] [CrossRef]
- Jeong, J.S.; Ramírez-Gómez, Á. Optimizing the Location of a Biomass Plant with a Fuzzy-DEcision-MAking Trial and Evaluation Laboratory (F-DEMATEL) and Multi-Criteria Spatial Decision Assessment for Renewable Energy Management and Long-Term Sustainability. J. Clean. Prod. 2018, 182, 509–520. [Google Scholar] [CrossRef]
- Alzahrani, A.I.; Al-Samarraie, H.; Eldenfria, A.; Alalwan, N. A DEMATEL Method in Identifying Design Requirements for Mobile Environments: Students’ Perspectives. J. Comput. High. Educ. 2018, 30, 466–488. [Google Scholar] [CrossRef]
- Aldowah, H.; Al-Samarraie, H.; Alzahrani, A.I.; Alalwan, N. Factors Affecting Student Dropout in MOOCs: A Cause and Effect Decision-making Model. J. Comput. High. Educ. 2020, 32, 429–454. [Google Scholar] [CrossRef]
- Tseng, S.H.; Chen, H.C.; Nguyen, T.S. Key Success Factors of Sustainable Organization for Traditional Manufacturing Industries: A Case Study in Taiwan. Mathematics 2022, 10, 4389. [Google Scholar] [CrossRef]
- Kao, Y.C.; Shen, K.Y.; Lee, S.T.; Shieh, J.C.P. Selecting the Fintech Strategy for Supply Chain Finance: A Hybrid Decision Approach for Banks. Mathematics 2022, 10, 2393. [Google Scholar] [CrossRef]
- Nguyen, P. A Fully Completed Spherical Fuzzy Data-Driven Model for Analyzing Employee Satisfaction in Logistics Service Industry. Mathematics 2023, 11, 2235. [Google Scholar] [CrossRef]
- Chang, J.J.; Lin, C.L. Determining the Sustainable Development Strategies and Adoption Paths for Public Bike-Sharing Service Systems (PBSSSs) under Various Users’ Considerations. Mathematics 2023, 11, 1196. [Google Scholar] [CrossRef]
- Matas, A. Diseño Del Formato de Escalas Tipo Likert: Un Estado de La Cuestión. Rev. Electrónica de Investig. Educ. 2018, 20, 38–47. [Google Scholar] [CrossRef]
- Li, Q. A Novel Likert Scale Based on Fuzzy Sets Theory. Expert Syst. Appl. 2013, 40, 1609–1618. [Google Scholar] [CrossRef]
- Gutierrez, L.E.; Betts, M.M.; Wightman, P.; Salazar, A.; Jabba, D.; Nieto, W. Characterization of Quality Attributes to Evaluate the User Experience in Augmented Reality. IEEE Access 2022, 10, 112639–112656. [Google Scholar] [CrossRef]
- IBM Software IBM SPSS. Available online: https://www.ibm.com/co-es/analytics/spss-statistics-software (accessed on 14 April 2022).
- ANSI/NISO. Guidelines for the Construction, Format and Management of Monolingual Controlled Vocabularies; National Information Standards Organization Location: Baltimore, MD, USA, 2010; Volume 2003. [Google Scholar]
- Hietanen, A.; Pieters, R.; Lanz, M.; Latokartano, J.; Kämäräinen, J.-K. AR-Based Interaction for Human-Robot Collaborative Manufacturing. Robot. Comput. -Integr. Manuf. 2020, 63, 101891. [Google Scholar] [CrossRef]
- Lee, J.G.; Seo, J.O.; Abbas, A.; Choi, M. End-Users’ Augmented Reality Utilization for Architectural Design Review. Appl. Sci. 2020, 10, 5363. [Google Scholar] [CrossRef]
- Düwel, T.; Herbig, N.; Kahl, D.; Krüger, A. Combining Embedded Computation and Image Tracking for Composing Tangible Augmented Reality. In Proceedings of the Extended Abstracts of the 2020 CHI Conference on Human Factors in Computing Systems, Honolulu, HI, USA, 25–30 April 2020; ACM: New York, NY, USA, 2020; pp. 1–7. [Google Scholar]
- Keskinen, T.; Makela, V.; Kallionierni, P.; Hakulinen, J.; Karhu, J.; Ronkainen, K.; Makela, J.; Turunen, M. The Effect of Camera Height, Actor Behavior, and Viewer Position on the User Experience of 360° Videos. In Proceedings of the 26th IEEE Conference on Virtual Reality and 3D User Interfaces, VR 2019—Proceedings 2019, Osaka, Japan, 23–27 March 2019; pp. 423–430. [Google Scholar] [CrossRef]
- Lee, G.A.; Park, H.S.; Billinghurst, M. Optical-Reflection Type 3D Augmented Reality Mirrors. In Proceedings of the 25th ACM Symposium on Virtual Reality Software and Technology, Parramatta, NSW, Australia, 12–15 November 2019; pp. 2–3. [Google Scholar]
- Seeling, P. Visual User Experience Difference: Image Compression Impacts on the Quality of Experience in Augmented Binocular Vision. In Proceedings of the 2016 13th IEEE Annual Consumer Communications & Networking Conference (CCNC), Las Vegas, NV, USA, 9–12 January 2016; IEEE: Piscataway, NJ, USA, 2016; pp. 924–929. [Google Scholar]
- Zhang, J. Emotions Detection of User EXperience (UX) for Mobile Augmented Reality (MAR) Applications. Int. J. Adv. Trends Comput. Sci. Eng. 2019, 8, 63–67. [Google Scholar] [CrossRef]
- Grzegorczyk, T.; Sliwinski, R.; Kaczmarek, J. Attractiveness of Augmented Reality to Consumers. Technol. Anal. Strateg. Manag. 2019, 31, 1257–1269. [Google Scholar] [CrossRef]
- Chen, Y.-P.; Ko, J.-C. CryptoAR Wallet: A Blockchain Cryptocurrency Wallet Application That Uses Augmented Reality for On-Chain User Data Display. In Proceedings of the 21st International Conference on Human-Computer Interaction with Mobile Devices and Services, Taipei, Taiwan, 1–4 October 2019; ACM: New York, NY, USA, 2019; pp. 1–5. [Google Scholar]
- Kang, S.; Choi, H.; Park, S.; Park, C.; Lee, J.; Lee, U.; Lee, S.-J. Fire in Your Hands. In Proceedings of the 25th Annual International Conference on Mobile Computing and Networking, Los Cabos, Mexico, 21–25 October 2019; ACM: New York, NY, USA, 2019; pp. 1–16. [Google Scholar]
- Forte, J.L.B.; Vela, F.L.G.; Rodríguez, P.P. User Experience Problems in Immersive Virtual Environments. ACM Int. Conf. Proc. Ser. 2019, 1–4. [Google Scholar] [CrossRef]
- Aromaa, S.; Väätänen, A.; Hakkarainen, M.; Kaasinen, E. User Experience and User Acceptance of an Augmented Reality Based Knowledge-Sharing Solution in Industrial Maintenance Work. In Advances in Intelligent Systems and Computing; Springer: Berlin/Heidelberg, Germany, 2018; Volume 607, pp. 145–156. [Google Scholar]
- Dirin, A.; Laine, T.H. User Experience in Mobile Augmented Reality: Emotions, Challenges, Opportunities and Best Practices. Computers 2018, 7, 33. [Google Scholar] [CrossRef]
- Chakravorty, A.; Rowe, A. UX Design Principles for Mobile Augmented Reality Applications. In Proceedings of the MCCSIS 2018—Multi Conference on Computer Science and Information Systems and Proceedings of the International Conferences on Interfaces and Human Computer Interaction 2018, Game and Entertainment Technologies 2018 and Computer Graphics, Visualization, Comp, Madrid, Spain, 17–20 July 2018; pp. 319–323. [Google Scholar]
- Irshad, S.; Awang Rambli, D.R. Multi-Layered Mobile Augmented Reality Framework for Positive User Experience. In Proceedings of the 2nd International Conference in HCI and UX Indonesia 2016, Jakarta, Indonesia, 13–15 April 2016; ACM: New York, NY, USA, 2016; pp. 21–26. [Google Scholar]
- Nivedha, S.; Hemalatha, S. Enhancing User Experience through Physical Interaction in Handheld Augmented Reality. In Proceedings of the 2015 International Conference on Computer Communication and Informatics (ICCCI), Coimbatore, India, 8–10 January 2015; pp. 1–7. [Google Scholar]
- Singh, M.; Singh, M.P. Augmented Reality Interfaces. IEEE Internet Comput. 2013, 17, 66–70. [Google Scholar] [CrossRef]
- Dhir, A.; Al-Kahtani, M. A Case Study on User Experience (UX) Evaluation of Mobile Augmented Reality Prototypes. J. Univ. Comput. Sci. 2013, 19, 1175–1196. [Google Scholar]
- Stutzman, B.; Nilsen, D.; Broderick, T.; Neubert, J. MARTI: Mobile Augmented Reality Tool for Industry. In Proceedings of the 2009 WRI World Congress on Computer Science and Information Engineering, Washington, DC, USA, 31 March–2 April 2009; Volume 5, pp. 425–429. [Google Scholar]
- Neumann, A.; Strenge, B.; Uhlich, J.C.; Schlicher, K.D.; Maier, G.W.; Schalkwijk, L.; Waßmuth, J.; Essig, K.; Schack, T. AVIKOM—Towards a Mobile Audiovisual Cognitive Assistance System for Modern Manufacturing and Logistics. In Proceedings of the 13th ACM International Conference on PErvasive Technologies Related to Assistive Environments, New York, NY, USA, 30 June–3 July 2020; ACM: New York, NY, USA, 2020; pp. 1–8. [Google Scholar]
- Faust, F.G.; Catecati, T.; de Souza Sierra, I.; Araujo, F.S.; Ramírez, A.R.G.; Nickel, E.M.; Gomes Ferreira, M.G. Mixed Prototypes for the Evaluation of Usability and User Experience: Simulating an Interactive Electronic Device. Virtual Real. 2019, 23, 197–211. [Google Scholar] [CrossRef]
- Fuste, A.; Reynolds, B.; Hobin, J.; Heun, V. Kinetic AR: A Framework for Robotic Motion Systems in Spatial Computing. In Proceedings of the Extended Abstracts of the 2020 CHI Conference on Human Factors in Computing Systems, Honolulu, HI, USA, 25–30 April 2020; ACM: New York, NY, USA, 2020; pp. 1–8. [Google Scholar]
- Materna, Z.; Kapinus, M.; Beran, V.; Smrž, P.; Zemčík, P. Interactive Spatial Augmented Reality in Collaborative Robot Programming: User Experience Evaluation. In Proceedings of the RO-MAN 2018—27th IEEE International Symposium on Robot and Human Interactive Communication, Tai’an, China, 27–31 August 2018; pp. 80–87. [Google Scholar] [CrossRef]
- Siriborvornratanakul, T. Enhancing User Experiences of Mobile-Based Augmented Reality via Spatial Augmented Reality: Designs and Architectures of Projector-Camera Devices. Adv. Multimed. 2018, 2018, 8194726. [Google Scholar] [CrossRef]
- Braitmaier, M.; Kyriazis, D. Virtual and Augmented Reality: Improved User Experience through a Service Oriented Infrastructure. In Proceedings of the 2011 Third International Conference on Games and Virtual Worlds for Serious Applications, Athens, Greece, 4–6 May 2011; pp. 40–46. [Google Scholar]
- Marques, M.; Elvas, F.; Nunes, I.L.; Lobo, V.; Correia, A. Augmented Reality in the Context of Naval Operations. In International Conference on Human Systems Engineering and Design; Ahram, T., Karwowski, W., Taiar, R., Eds.; Advances in Intelligent Systems and Computing; Springer International Publishing: Cham, Switzerland, 2019; Volume 876, pp. 307–313. ISBN 978-3-030-02052-1. [Google Scholar]
- Helin, K.; Kuula, T.; Vizzi, C.; Karjalainen, J.; Vovk, A. User Experience of Augmented Reality System for Astronaut’s Manual Work Support. Front. Robot. AI 2018, 5, 1–10. [Google Scholar] [CrossRef]
- Ramli, R.; Duriraju, N.; Rozzani, N. Augmented Reality for Improved User Experience: Himalayan Wildlife Tour Book. In Proceedings of the 2019 IEEE 9th International Conference on System Engineering and Technology (ICSET), Shah Alam, Malaysia, 7 October 2019; Volume 6, pp. 56–61. [Google Scholar]
- Kim, K.; Norouzi, N.; Losekamp, T.; Bruder, G.; Anderson, M.; Welch, G. Effects of Patient Care Assistant Embodiment and Computer Mediation on User Experience. In Proceedings of the 2019 IEEE International Conference on Artificial Intelligence and Virtual Reality (AIVR), San Diego, CA, USA, 9–11 December 2019; pp. 17–177. [Google Scholar]
- Hammady, R.; Ma, M.; Powell, A. User Experience of Markerless Augmented Reality Applications in Cultural Heritage Museums: ‘MuseumEye’ as a Case Study. In Lecture Notes in Computer Science (Including Subseries Lecture Notes in Artificial Intelligence and Lecture Notes in Bioinformatics); Springer: Berlin/Heidelberg, Germany, 2018; Volume 10851, LNCS; pp. 349–369. ISBN 9783319952819. [Google Scholar]
- Jakobsen, C.L.; Larsen, J.B.; Nørlem, M.L.; Kraus, M. Improving User Experience for Lost Heritage Sites with a User-Centered Indirect Augmented Reality Application. In Lecture Notes of the Institute for Computer Sciences, Social-Informatics and Telecommunications Engineering, LNICST; Springer: Berlin/Heidelberg, Germany, 2018; Volume 229, pp. 54–63. [Google Scholar]
- Seppälä, K.; Heimo, O.I.; Korkalainen, T.; Pääkylä, J.; Latvala, J.; Helle, S.; Härkänen, L.; Jokela, S.; Järvenpää, L.; Saukko, F.; et al. Examining User Experience in an Augmented Reality Adventure Game: Case Luostarinmäki Handicrafts Museum. In IFIP Advances in Information and Communication Technology; Springer: Berlin/Heidelberg, Germany, 2016; Volume 474, pp. 257–276. ISBN 9783319448046. [Google Scholar]
- Kerr, S.J.; Rice, M.D.; Teo, Y.; Wan, M.; Cheong, Y.L.; Ng, J.; Ng-Thamrin, L.; Thura-Myo, T.; Wren, D. Wearable Mobile Augmented Reality. In Proceedings of the 10th International Conference on Virtual Reality Continuum and Its Applications in Industry, Hong Kong, China, 11–12 December 2011; ACM: New York, NY, USA, 2011; pp. 209–216. [Google Scholar]
- Romli, R.; Razali, A.F.; Ghazali, N.H.; Hanin, N.A.; Ibrahim, S.Z. Mobile Augmented Reality (AR) Marker-Based for Indoor Library Navigation. IOP Conf. Ser. Mater. Sci. Eng. 2020, 767, 012062. [Google Scholar] [CrossRef]
- Nunes, I.L.; Lucas, R.; Simões-Marques, M.; Correia, N. An Augmented Reality Application to Support Deployed Emergency Teams. In Proceedings of the 20th Congress of the International Ergonomics Association (IEA 2018), Florence, Italy, 26–30 August 2019; pp. 195–204. [Google Scholar]
- Kohler, C.; Weidner, F.; Broll, W. AR Training for Paragliding Pilots: An Investigation of User Experience and Requirements. In Proceedings of the 2019 21st Symposium on Virtual and Augmented Reality (SVR), Rio de Janeiro, Brazil, 28–31 October 2019; pp. 92–101. [Google Scholar]
- Sánchez, A.; Redondo, E.; Fonseca, D. Developing an Augmented Reality Application in the Framework of Architecture Degree. In Proceedings of the 2012 ACM Workshop on User Experience in e-Learning and Augmented Technologies in Education, Nara, Japan, 2 November 2012; ACM: New York, NY, USA, 2012; pp. 37–42. [Google Scholar]
- Smaragdina, A.A.; Ningrum, G.D.K.; Nidhom, A.M.; Rahmawati, N.S.Y.; Rusdiansyah, M.R.; Putra, A.B.N.R. The User Experience Analysis of Computer Graphics Educational Comics (GRAFMIC) Based on Markerless Augmented Reality. In Proceedings of the 2019 International Conference on Electrical, Electronics and Information Engineering (ICEEIE), Denpasar, Indonesia, 3–4 October 2019; pp. 220–225. [Google Scholar]
- Lindemann, P.; Eisl, D.; Rigoll, G. Acceptance and User Experience of Driving with a See-Through Cockpit in a Narrow-Space Overtaking Scenario. In Proceedings of the 2019 IEEE Conference on Virtual Reality and 3D User Interfaces (VR), Osaka, Japan, 23–27 March 2019; pp. 1040–1041. [Google Scholar]
- Brata, K.C.; Liang, D. Comparative Study of User Experience on Mobile Pedestrian Navigation between Digital Map Interface and Location-Based Augmented Reality. Int. J. Electr. Comput. Eng. (IJECE) 2020, 10, 2037. [Google Scholar] [CrossRef]
- Rehrl, K.; Häusler, E.; Leitinger, S.; Bell, D. Pedestrian Navigation with Augmented Reality, Voice and Digital Map: Final Results from an in Situ Field Study Assessing Performance and User Experience. J. Locat. Based Serv. 2014, 8, 75–96. [Google Scholar] [CrossRef]
- Davidavičienė, V.; Raudeliūnienė, J.; Viršilaitė, R. User Experience Evaluation and Creativity Stimulation with Augmented Reality Mobile Applications. Creat. Stud. 2019, 12, 34–48. [Google Scholar] [CrossRef]
- Andri, C.; Alkawaz, M.H.; Waheed, S.R. Examining Effectiveness and User Experiences in 3D Mobile Based Augmented Reality for MSU Virtual Tour. In Proceedings of the 2019 IEEE International Conference on Automatic Control and Intelligent Systems (I2CACIS), Selangor, Malaysia, 29 June 2019; pp. 161–167. [Google Scholar]
- Contreras, P.; Chimbo, D.; Tello, A.; Espinoza, M. Semantic Web and Augmented Reality for Searching People, Events and Points of Interest within of a University Campus. In Proceedings of the 2017 XLIII Latin American Computer Conference (CLEI), Córdoba, Argentina, 4–8 September 2017; pp. 1–10. [Google Scholar]
- Skinner, P.; Ventura, J.; Zollmann, S. Indirect Augmented Reality Browser for GIS Data. In Proceedings of the 2018 IEEE International Symposium on Mixed and Augmented Reality Adjunct (ISMAR-Adjunct), Munich, Germany, 16–20 October 2018; pp. 145–150. [Google Scholar]
- Patkar, N.; Merino, L.; Nierstrasz, O. Towards Requirements Engineering with Immersive Augmented Reality. In Proceedings of the Conference Companion of the 4th International Conference on Art, Science, and Engineering of Programming, Porto, Portugal, 23–26 March 2020; ACM: New York, NY, USA, 2020; pp. 55–60. [Google Scholar]
- Giloth, C.F.; Tanant, J. User Experiences in Three Approaches to a Visit to a 3D Labyrinthe of Versailles. In Proceedings of the 2015 Digital Heritage, Granada, Spain, 28 September–2 October 2015; pp. 403–404. [Google Scholar]
- Unal, M.; Bostanci, E.; Sertalp, E. Distant Augmented Reality: Bringing a New Dimension to User Experience Using Drones. Digit. Appl. Archaeol. Cult. Herit. 2020, 17, e00140. [Google Scholar] [CrossRef]
- Ocampo, A.J.T. TourMAR: Designing Tourism Mobile Augmented Reality Architecture with Data Integration to Improve User Experience. In Proceedings of the 2019 4th International Conference on Multimedia Systems and Signal Processing, Guangzhou, China, 10–12 May 2019; ACM: New York, NY, USA, 2019; pp. 79–83. [Google Scholar]
- Thi Minh Tran, T.; Parker, C. Designing Exocentric Pedestrian Navigation for AR Head Mounted Displays. In Proceedings of the Extended Abstracts of the 2020 CHI Conference on Human Factors in Computing Systems, Honolulu, HI, USA, 25–30 April 2020; ACM: New York, NY, USA, 2020; pp. 1–8. [Google Scholar]
- Ader, L.G.M.; McManus, K.; Greene, B.R.; Caulfield, B. How Many Steps to Represent Individual Gait? In Proceedings of the Companion Proceedings of the 12th ACM SIGCHI Symposium on Engineering Interactive Computing Systems, Sophia Antipolis, France, 23–26 June 2020; ACM: New York, NY, USA, 2020; pp. 1–4. [Google Scholar]
- Kim, M.J.; Wang, X.; Han, S.; Wang, Y. Implementing an Augmented Reality-Enabled Wayfinding System through Studying User Experience and Requirements in Complex Environments. Vis. Eng. 2015, 3, 14. [Google Scholar] [CrossRef]
- Arifin, Y.; Sastria, T.G.; Barlian, E. User Experience Metric for Augmented Reality Application: A Review. Procedia Comput. Sci. 2018, 135, 648–656. [Google Scholar] [CrossRef]
- Müller, J.; Zagermann, J.; Wieland, J.; Pfeil, U.; Reiterer, H. A Qualitative Comparison Between Augmented and Virtual Reality Collaboration with Handheld Devices. In Proceedings of the Proceedings of Mensch und Computer 2019, Hamburg, Germany, 8–11 September 2019; ACM: New York, NY, USA, 2019; pp. 399–410. [Google Scholar]
- Střelák, D.; Škola, F.; Liarokapis, F. Examining User Experiences in a Mobile Augmented Reality Tourist Guide. In Proceedings of the 9th ACM International Conference on PErvasive Technologies Related to Assistive Environments, Corfu Island, Greece, 29 June–1 July 2016; ACM: New York, NY, USA, 2016; pp. 1–8. [Google Scholar]
- Seo, D.W.; Lee, J.Y. Direct Hand Touchable Interactions in Augmented Reality Environments for Natural and Intuitive User Experiences. Expert Syst. Appl. 2013, 40, 3784–3793. [Google Scholar] [CrossRef]
- Brancati, N.; Caggianese, G.; Frucci, M.; Gallo, L.; Neroni, P. Experiencing Touchless Interaction with Augmented Content on Wearable Head-Mounted Displays in Cultural Heritage Applications. Pers. Ubiquitous Comput. 2017, 21, 203–217. [Google Scholar] [CrossRef]
- Lamberti, F.; Manuri, F.; Paravati, G.; Piumatti, G.; Sanna, A. Using Semantics to Automatically Generate Speech Interfaces for Wearable Virtual and Augmented Reality Applications. IEEE Trans. Hum. Mach. Syst. 2017, 47, 152–164. [Google Scholar] [CrossRef]
- Olsson, T.; Lagerstam, E.; Kärkkäinen, T.; Väänänen-Vainio-Mattila, K. Expected User Experience of Mobile Augmented Reality Services: A User Study in the Context of Shopping Centres. Pers. Ubiquitous Comput. 2013, 17, 287–304. [Google Scholar] [CrossRef]
- Lyons, N.; Smith, M.; McCabe, H. Sensory Seduction & Narrative Pull. In Proceedings of the 2018 IEEE Games, Entertainment, Media Conference (GEM), Galway, Ireland, 15–17 August 2018; pp. 1–56. [Google Scholar]
- Grubert, J.; Langlotz, T.; Zollmann, S.; Regenbrecht, H. Towards Pervasive Augmented Reality: Context-Awareness in Augmented Reality. IEEE Trans. Vis. Comput. Graph. 2017, 23, 1706–1724. [Google Scholar] [CrossRef]
- Okimoto, M.L.L.R.; Okimoto, P.C.; Goldbach, C.E. User Experience in Augmented Reality Applied to the Welding Education. Procedia Manuf. 2015, 3, 6223–6227. [Google Scholar] [CrossRef]
- Rajappa, S.; Raj, G. Application and Scope Analysis of Augmented Reality in Marketing Using Image Processing Technique. In Proceedings of the 2016 6th International Conference—Cloud System and Big Data Engineering, Confluence, Noida, India, 14–15 January 2016; pp. 435–440. [Google Scholar] [CrossRef]
- Bauman, B.; Seeling, P. Evaluation of EEG-Based Predictions of Image QoE in Augmented Reality Scenarios. In Proceedings of the IEEE Vehicular Technology Conference, Chicago, IL, USA, 27–30 August 2018; pp. 1–5. [Google Scholar] [CrossRef]
- Bauman, B.; Seeling, P. Spherical Image QoE Approximations for Vision Augmentation Scenarios. Multimed. Tools Appl. 2019, 78, 18113–18135. [Google Scholar] [CrossRef]
- Riegler, A.; Wintersberger, P.; Riener, A.; Holzmann, C. Augmented Reality Windshield Displays and Their Potential to Enhance User Experience in Automated Driving. I-Com 2019, 18, 127–149. [Google Scholar] [CrossRef]
- Xue, H.; Sharma, P.; Wild, F. User Satisfaction in Augmented Reality-Based Training Using Microsoft HoloLens. Computers 2019, 8, 9. [Google Scholar] [CrossRef]
- Irshad, S.; Awang, D.R.B. A UX Oriented Evaluation Approach for Mobile Augmented Reality Applications. In Proceedings of the 16th International Conference on Advances in Mobile Computing and Multimedia, Singapore, 28–30 November 2016; pp. 108–112. [Google Scholar] [CrossRef]
- Kim, H.C.; Jin, S.; Jo, S.; Lee, J.H. A Naturalistic Viewing Paradigm Using 360° Panoramic Video Clips and Real-Time Field-of-View Changes with Eye-Gaze Tracking: Naturalistic Viewing Paradigm Based on 360° Panoramic Video and Real-Time Eye Gaze. NeuroImage 2020, 216, 116617. [Google Scholar] [CrossRef]
- Pittarello, F. Designing AR Enhanced Art Exhibitions: A Methodology and a Case Study. In Proceedings of the 13th Biannual Conference of the Italian SIGCHI Chapter: Designing the Next Interaction, Padova, Italy, 23–25 September 2019. [Google Scholar] [CrossRef]
- Sánchez-Francisco, M.; Díaz, P.; Fabiano, F.; Aedo, I. Engaging Users with an AR Pervasive Game for Personal Urban Awareness. In Proceedings of the ACM International Conference Proceeding Series, Gipuzkoa, Spain, 25–28 June 2019. [Google Scholar] [CrossRef]
- Savela, N.; Oksanen, A.; Kaakinen, M.; Noreikis, M.; Xiao, Y. Does Augmented Reality Affect Sociability, Entertainment, and Learning? A Field Experiment. Appl. Sci. 2020, 10, 1392. [Google Scholar] [CrossRef]
- Bellei, E.A.; Biduski, D.; Brock, L.A.; Patricio, D.I.; Souza, J.D.L.; De Marchi, A.C.B.; De Rieder, R. Prior Experience as an Influencer in the Momentary User Experience: An Assessment in Immersive Virtual Reality Game Context. In Proceedings of the 2018 20th Symposium on Virtual and Augmented Reality (SVR), Foz do Iguaçu, Brazil, 29 October–1 November 2018; pp. 1–9. [Google Scholar]
- Kusumaningsih, A.; Kurniawati, A.; Angkoso, C.V.; Yuniarno, E.M.; Hariadi, M. User Experience Measurement on Virtual Dressing Room of Madura Batik Clothes. In Proceedings of the 2017 International Conference on Sustainable Information Engineering and Technology, SIET 2017, Batu, Indonesia, 24–25 November 2017; pp. 203–208. [Google Scholar] [CrossRef]
- Irshad, S.; Rambli, D.R.A. Preliminary User Experience Framework for Designing Mobile Augmented Reality Technologies. In Proceedings of the 2015 4th International Conference on Interactive Digital Media (ICIDM), Bandung, Indonesia, 1–5 December 2015; pp. 1–4. [Google Scholar] [CrossRef]
- Ghazwani, Y.; Smith, S. Interaction in Augmented Reality: Challenges to Enhance User Experience. In Proceedings of the 2020 4th International Conference on Virtual and Augmented Reality Simulations, Sydney, NSW, Australia, 14–16 February 2020; ACM: New York, NY, USA, 2020; pp. 39–44. [Google Scholar]
- Kim, S.J.; Dey, A.K. Augmenting Human Senses to Improve the User Experience in Cars: Applying Augmented Reality and Haptics Approaches to Reduce Cognitive Distances. Multimed. Tools Appl. 2016, 75, 9587–9607. [Google Scholar] [CrossRef]
- Parmaxi, A.; Demetriou, A.A. Augmented Reality in Language Learning: A State-of-the-art Review of 2014–2019. J. Comput. Assist. Learn. 2020, 36, 861–875. [Google Scholar] [CrossRef]
- Trista, S.; Rusli, A. Historiar: Experience Indonesian History through Interactive Game and Augmented Reality. Bull. Electr. Eng. Inform. 2020, 9, 1518–1524. [Google Scholar] [CrossRef]
- Mulloni, A.; Seichter, H.; Schmalstieg, D. User Experiences with Augmented Reality Aided Navigation on Phones. In Proceedings of the 2011 10th IEEE International Symposium on Mixed and Augmented Reality, ISMAR 2011, Basel, Switzerland, 26–29 October 2011; pp. 229–230. [Google Scholar] [CrossRef]
- Li, X.; Xu, B.; Teng, Y.; Ren, Y.; Hu, Z. Comparative Research of AR and VR Technology Based on User Experience. In Proceedings of the 2014 International Conference on Management Science & Engineering 21th Annual Conference Proceedings, Helsinki, Finland, 17–19 August 2014; pp. 1820–1827. [Google Scholar]
- Nielsen, J.; Budiu, R.; Riders, N. Mobile Usability; New Riders: Berkeley, CA, USA, 2013; ISBN 9780321884480. [Google Scholar]
- Krug, S. Don’t Make Me Think, Revisited: A Common Sense Approach to Web Usability. Choice Rev. Online 2014, 51, 51–6218. [Google Scholar] [CrossRef]
- Lóbach, B. Diseño Industrial Bases Para La Configuración De Los Productos Industriales; Gustavo Gili, S.A.: Barcelona, Spain, 1981; ISBN 8425210321. [Google Scholar]
- Kramer, L.J.; Bailey, R.E.; Prinzel, L.J. Commercial Flight Crew Decision Making During Low-Visibility Approach Operations Using Fused Synthetic and Enhanced Vision Systems. Int. J. Aviat. Psychol. 2009, 19, 131–157. [Google Scholar] [CrossRef]
- Bonin-Font, F.; Massot Campos, M.; Burguera, A.B. ARSEA: A Virtual Reality Subsea Exploration Assistant. IFAC-PapersOnLine 2018, 51, 26–31. [Google Scholar] [CrossRef]
- Merenda, C.; Kim, H.; Tanous, K.; Gabbard, J.L.; Feichtl, B.; Misu, T.; Suga, C. Augmented Reality Interface Design Approaches for Goal-Directed and Stimulus-Driven Driving Tasks. IEEE Trans. Vis. Comput. Graph. 2018, 24, 2875–2885. [Google Scholar] [CrossRef] [PubMed]
- HO, C.; Spence, C. The Multisensory Driver. Implications for Ergonomic Car Interface Design; TAYLOR & FRANCIS GROUP: London, UK, 2017; ISBN 9780754670681. [Google Scholar]
- Haas, M.W. Virtually-Augmented Interfaces for Tactical Aircraft. Biol. Psychol. 1995, 40, 229–238. [Google Scholar] [CrossRef]
- Sanchez Riera, A. Evaluación de La Tecnología de Realidad Aumentada Móvil En Entornos Educativos Del Ámbito de La Arquitectura y La Edificación; Universidad Politécnica de Calalunya: Barcelona, Spain, 2013. [Google Scholar]
- Stübl, G.; Heindl, C.; Ebenhofer, G.; Bauer, H.; Pichler, A. Lessons Learned from Human Pose Interaction in an Industrial Spatial Augmented Reality Application. Procedia Comput. Sci. 2023, 217, 912–917. [Google Scholar] [CrossRef]
- van Lopik, K.; Schnieder, M.; Sharpe, R.; Sinclair, M.; Hinde, C.; Conway, P.; West, A.; Maguire, M. Comparison of In-Sight and Handheld Navigation Devices toward Supporting Industry 4.0 Supply Chains: First and Last Mile Deliveries at the Human Level. Appl. Ergon. 2020, 82, 102928. [Google Scholar] [CrossRef] [PubMed]
- Liu, Y.; Sathishkumar, V.; Manickam, A. Augmented Reality Technology Based on School Physical Education Training. Comput. Electr. Eng. 2022, 99, 107807. [Google Scholar] [CrossRef]
- Rusli, R.; Nalanda, D.A.; Tarmidi, A.D.V.; Suryaningrum, K.M.; Yunanda, R. Augmented Reality for Studying Hands on the Human Body for Elementary School Students. Procedia Comput. Sci. 2023, 216, 237–244. [Google Scholar] [CrossRef]
- Khoong, Y.M.; Luo, S.; Huang, X.; Li, M.; Gu, S.; Jiang, T.; Liang, H.; Liu, Y.; Zan, T. The Application of Augmented Reality in Plastic Surgery Training and Education: A Narrative Review. J. Plast. Reconstr. Aesthetic Surg. 2023, 82, 255–263. [Google Scholar] [CrossRef]
- Schlick, C.; Daude, R.; Luczak, H.; Weck, M.; Springer, J. Head-Mounted Display for Supervisory Control in Autonomous Production Cells. Displays 1997, 17, 199–206. [Google Scholar] [CrossRef]
- Rohling, A.J.; Neto, V.V.G.; Ferreira, M.G.V.; Dos Santos, W.A.; Nakagawa, E.Y. A Reference Architecture for Satellite Control Systems. Innov. Syst. Softw. Eng. 2019, 15, 139–153. [Google Scholar] [CrossRef]
- Garcés, L.; Martínez-Fernández, S.; Oliveira, L.; Valle, P.; Ayala, C.; Franch, X.; Nakagawa, E.Y. Three Decades of Software Reference Architectures: A Systematic Mapping Study. J. Syst. Softw. 2021, 179, 111004. [Google Scholar] [CrossRef]
- Nakagawa, E.Y.; Guessi, M.; Maldonado, J.C.; Feitosa, D.; Oquendo, F. Consolidating a Process for the Design, Representation, and Evaluation of Reference Architectures. In Proceedings of the 2014 IEEE/IFIP Conference on Software Architecture, Sydney, Australia, 7–11 April 2014; pp. 143–152. [Google Scholar]
- Rossi, M.; Papetti, A.; Germani, M.; Marconi, M. An Augmented Reality System for Operator Training in the Footwear Sector. Comput. -Aided Des. Appl. 2020, 18, 692–703. [Google Scholar] [CrossRef]
- Guest, W.; Wild, F.; Di Mitri, D.; Klemke, R.; Karjalainen, J.; Helin, K. Architecture and Design Patterns for Distributed, Scalable Augmented Reality and Wearable Technology Systems. In Proceedings of the 2019 IEEE International Conference on Engineering, Technology and Education (TALE), Yogyakarta, Indonesia, 10–13 December 2019; pp. 1–8. [Google Scholar]
- Tkachuk, M.; Vekshyn, O.; Gamzayev, R. Architecting for Adaptive Resource Management in Mobile Augmented Reality Systems: Models, Metrics and Prototype Software Solutions; Springer: Berlin/Heidelberg, Germany, 2017; pp. 17–35. ISBN 9783319699646. [Google Scholar]
- Villanueva, I.; Clemente, O. Arquitectura de Software Para El Desarrollo de Aplicaciones Sensibles Al Contexto, Universidad Nacional Francisco Villarreal. 2017. Available online: http://repositorio.unfv.edu.pe/handle/20.500.13084/1669 (accessed on 14 August 2021).


| Scale | Abbreviation | Value |
|---|---|---|
| Very high | VH | 9 |
| High | H | 7 |
| Medium | M | 5 |
| Low | L | 3 |
| Very low | VL | 1 |
| Scale | Value |
|---|---|
| No influence | 0 |
| Low influence | 1 |
| Medium influence | 2 |
| High influence | 3 |
| Very high influence | 4 |
| Study | Identified Attributes | Type of AR |
|---|---|---|
| AR-based interaction for human-robot collaborative manufacturing [67] | Safety, Information Processing, Ergonomics, Autonomy, Competence, Relatedness | HMD |
| End-Users’ augmented reality utilization for architectural design review [68] | Satisfaction, Physical Demand, Perceived usefulness, Perceived ease of use | |
| Combining Embedded Computation and Image Tracking for Composing Tangible Augmented Reality [69] | Usability | |
| The Effect of Camera Height, Actor Behavior, and Viewer Position on the User Experience of 360° Videos [70] | Camera height, Actor behavior, Viewer position | |
| Augmented reality user interface evaluation performance measurement of HoloLens, Moverio and mouse input [20] | Performance, Satisfaction, Cognitive demand | |
| Optical-Reflection Type 3D Augmented Reality Mirrors [71] | Space perception | |
| Ethnographic study of a commercially available augmented reality HMD app for industry work instruction [11] | Task Performance: Accuracy, Task completion, Consistency, Time taken | |
| DMove: Directional Motion-based Interaction for Augmented Reality Head-Mounted Displays [19] | Correctness | |
| Comparing HMD-Based and Paper-Based Training [15] | Performance, Task completion, Cognitive demand | |
| Comparative Reality: Measuring User Experience and Emotion in Immersive Virtual Environments [12] | Mental effort, Engagement, Task Difficulty, Comfortability, Biofeedback | |
| Overcoming Issues of 3D Software Visualization through Immersive Augmented Reality [22] | Navigability, Task completion, Correctness, Space Perception, Engagement | |
| A study on user experience evaluation of glasses-type wearable device with built-in bone conduction speaker: Focus on the Zungle Panther [23] | Usability, Aesthetic | |
| Visual User Experience Difference: Image compression impacts on the quality of experience in augmented binocular vision [72] | Image quality metrics | |
| Study on assessing user experience of augmented reality applications [7] | Performance | Mobile |
| Holistic User eXperience in Mobile Augmented Reality Using User eXperience Measurement Index [9] | Attractiveness, Efficiency, Perspicuity Dependability, Stimulation, Novelty | |
| Emotions detection of user experience (UX) for mobile augmented reality (mar) applications [73] | Engagement | |
| Attractiveness of augmented reality to consumers [74] | Engagement | |
| CryptoAR Wallet: A Blockchain Cryptocurrency Wallet Application that Uses Augmented Reality for On-chain User Data Display [75] | Usability | |
| Fire in Your Hands: Understanding Thermal Behavior of Smartphones [76] | Coefficient of thermal spreading | |
| User experience problems in immersive virtual environments [77] | Immersion, Satisfaction, Credibility, Naturalness | |
| User experience and user acceptance of an augmented reality based knowledge-sharing solution in industrial maintenance work [78] | Satisfaction, Usability, Usefulness | |
| Measuring user experience of mobile augmented reality systems through non-instrumental quality attributes [13] | Aesthetics | |
| User experience in mobile augmented reality: Emotions, challenges, opportunities and best practices [79] | Engagement, Cognitive demand | |
| UX design principles for mobile augmented reality applications [80] | Space Perception | |
| Multi-layered mobile augmented reality framework for positive user experience [81] | Ergonomics, Usability | |
| Enhancing user experience through physical interaction in handheld Augmented Reality [82] | Task completion | |
| Augmented Reality Interfaces [83] | Usability | |
| A case study on user experience (UX) evaluation of mobile augmented reality prototypes [84] | Ease of use, Naturalness, Novelty | |
| MARTI: Mobile Augmented Reality Tool for Industry [85] | Space Perception, Aesthetics, Ergonomics | |
| AVIKOM: towards a mobile audiovisual cognitive assistance system for modern manufacturing and logistics [86] | Usability, Ergonomics | |
| Mixed prototypes for the evaluation of usability and user experience: simulating an interactive electronic device [87] | Usability, Performance, Task completion, Satisfaction, Ergonomics | PAR |
| Kinetic AR: A Framework for Robotic Motion Systems in Spatial Computing [88] | Usability | SAR |
| Interactive Spatial Augmented Reality in Collaborative Robot Programming: User Experience Evaluation [89] | Space Perception | |
| Enhancing user experiences of mobile-based augmented reality via spatial augmented reality: Designs and architectures of projector-camera devices [90] | Novelty, Practicality |
| Academic Degrees | Software Development with AR | Experience in the Productive Sector with AR | Academic Experience | ||
|---|---|---|---|---|---|
| Eng. | Master | PhD | Average | Average | Average |
| 20% | 20% | 60% | 13.4 years | 12.2 years | 13.4 years |
| ID | Attribute | IMS | SRMS | ||||
|---|---|---|---|---|---|---|---|
| Average | Score Max | Score Min | Outdegree | Indegree | Centrality | ||
| A01 | Usability [14,16,23,69,75,78,81,83,87,91,92,93,94,95,96,97,98,99] | 9.0 | 9 | 9 | 53.40 | 53.40 | 106.80 |
| A02 | Usefulness [78,100] | 7.0 | 9 | 3 | 67.52 | 67.52 | 135.04 |
| A03 | Efficiency [9,101,102,103,104,105,106,107,108] | 7.8 | 9 | 5 | 52.46 | 52.46 | 104.92 |
| A04 | Effectiveness [103,107,109] | 8.6 | 9 | 7 | 44.96 | 44.96 | 89.92 |
| A05 | Navigability [16,21,102,107,110,111,112,113,114,115,116,117] | 8.2 | 9 | 7 | 39.64 | 39.64 | 79.28 |
| A06 | Accessibility [118] | 6.2 | 9 | 1 | 66.72 | 66.72 | 133.44 |
| A07 | Perspicuity [9,101,102,104,105,106] | 6.6 | 9 | 1 | 67.64 | 67.64 | 135.28 |
| A08 | Dependability [9,101,102,104,105,106] | 7.4 | 9 | 5 | 46.12 | 46.12 | 92.24 |
| A09 | Coefficient of thermal spreading [76] | 3.4 | 5 | 1 | 66.40 | 66.40 | 132.80 |
| A10 | Interactivity [118] | 7.8 | 9 | 5 | 63.10 | 63.10 | 126.20 |
| A11 | Safety [67] | 7.0 | 9 | 3 | 67.52 | 67.52 | 135.04 |
| A12 | Practicality [90] | 5.0 | 9 | 1 | 64.88 | 64.88 | 129.76 |
| A13 | Performance [7,11,15,16,20,87,107,119,120,121] | 7.4 | 9 | 5 | 49.20 | 49.20 | 98.40 |
| A14 | Accuracy [11,122] | 7.8 | 9 | 7 | 56.56 | 56.56 | 113.12 |
| A15 | Task completion [11,12,15,16,22,82,87,107,116,119,120] | 5.8 | 9 | 1 | 68.14 | 68.14 | 136.28 |
| A16 | Consistency [11] | 6.6 | 9 | 1 | 67.64 | 67.64 | 135.28 |
| A17 | Time taken/task completion time [11,120] | 6.6 | 9 | 3 | 56.22 | 56.22 | 112.44 |
| A18 | Accomplish the task [93,120] | 6.6 | 9 | 1 | 67.82 | 67.82 | 135.64 |
| A19 | Correctness [16,19,21,22,103,111,123,124] | 7.4 | 9 | 3 | 67.22 | 67.22 | 134.44 |
| A20 | Reliability [108,118,125] | 6.2 | 9 | 1 | 51.54 | 51.54 | 103.08 |
| A21 | Space Perception [12,14,22,71,80,85,89,126,127,128] | 5.8 | 9 | 1 | 66.46 | 66.46 | 132.92 |
| A22 | Image quality [72,129,130,131] | 7.0 | 9 | 3 | 52.56 | 52.56 | 105.12 |
| A23 | Visual clarity [118] | 7.4 | 9 | 5 | 66.40 | 66.40 | 132.80 |
| A24 | Camera height [70] | 7.8 | 9 | 7 | 50.76 | 50.76 | 101.52 |
| A25 | Actor behavior [70] | 8.2 | 9 | 7 | 65.00 | 65.00 | 130.00 |
| A26 | Viewer position [70] | 6.6 | 9 | 1 | 67.64 | 67.64 | 135.28 |
| A27 | Identifiability [17,118] | 7.4 | 9 | 7 | 45.84 | 45.84 | 91.68 |
| A28 | Representation [100] | 5.4 | 9 | 1 | 64.08 | 64.08 | 128.16 |
| A29 | Transparency [132] | 4.2 | 7 | 1 | 65.90 | 65.90 | 131.80 |
| A30 | Comprehensibility [108] | 8.6 | 9 | 7 | 53.88 | 53.88 | 107.76 |
| A31 | Comprehensivity [118] | 7.4 | 9 | 5 | 58.48 | 58.48 | 116.96 |
| A32 | Memorability [118] | 5.8 | 9 | 3 | 59.46 | 59.46 | 118.92 |
| A33 | Information Processing [67] | 5.8 | 9 | 1 | 68.14 | 68.14 | 136.28 |
| A34 | Engagement [12,22,73,74,79,95,103,119,127,133,134,135,136,137] | 7.0 | 9 | 1 | 66.72 | 66.72 | 133.44 |
| A35 | Satisfaction [20,68,77,78,87,95,100,103,107,109,119,133,134] | 7.0 | 9 | 1 | 66.72 | 66.72 | 133.44 |
| A36 | Perceived satisfaction [138] | 6.6 | 9 | 1 | 67.64 | 67.64 | 135.28 |
| A37 | Enjoyment [8,138,139] | 7.4 | 9 | 1 | 64.52 | 64.52 | 129.04 |
| A38 | Enjoy [140] | 7.0 | 9 | 1 | 66.72 | 66.72 | 133.44 |
| A39 | Stimulation [9,17,101,102,104,105,106,108] | 5.8 | 9 | 1 | 64.56 | 64.56 | 129.12 |
| A40 | Pleasant [98] | 8.6 | 9 | 7 | 64.52 | 64.52 | 129.04 |
| A41 | Frustration [107,121,139] | 6.2 | 9 | 1 | 43.38 | 43.38 | 86.76 |
| A42 | Valence [135,140] | 5.4 | 9 | 1 | 62.40 | 62.40 | 124.80 |
| A43 | Importance [132,140] | 6.2 | 9 | 1 | 63.46 | 63.46 | 126.92 |
| A44 | Arousal [135,140] | 5.4 | 7 | 1 | 60.94 | 60.94 | 121.88 |
| A45 | Impressed [140] | 6.6 | 9 | 1 | 64.52 | 64.52 | 129.04 |
| A46 | Connectedness [125] | 5.0 | 9 | 1 | 64.88 | 64.88 | 129.76 |
| A47 | Comfortability [12] | 7.8 | 9 | 5 | 59.90 | 59.90 | 119.80 |
| A48 | Biofeedback, [12,18,119,127] | 5.0 | 9 | 1 | 64.88 | 64.88 | 129.76 |
| A49 | Competence [67] | 5.4 | 9 | 1 | 65.48 | 65.48 | 130.96 |
| A50 | Continuance intention [8] | 4.6 | 9 | 1 | 62.54 | 62.54 | 125.08 |
| A51 | Aesthetics [13,141] | 7.4 | 9 | 3 | 67.22 | 67.22 | 134.44 |
| A52 | Attractiveness [9,101,102,104,105,106,108] | 5.0 | 9 | 1 | 65.00 | 65.00 | 130.00 |
| A53 | Ergonomics [67,81,85,87] | 7.4 | 9 | 1 | 64.52 | 64.52 | 129.04 |
| A54 | Ease-of-Interaction [142] | 7.8 | 9 | 5 | 67.82 | 67.82 | 135.64 |
| A55 | Cognitive demand [12,15,20,79,107,121,124,139] | 6.6 | 9 | 1 | 67.64 | 67.64 | 135.28 |
| A56 | Cognitive load [143] | 6.6 | 9 | 1 | 67.64 | 67.64 | 135.28 |
| A57 | Physical Demand [68,107,121] | 7.8 | 9 | 7 | 56.56 | 56.56 | 113.12 |
| A58 | Temporal demand [107] | 6.2 | 9 | 5 | 52.86 | 52.86 | 105.72 |
| A59 | Effort [107,121] | 5.8 | 9 | 1 | 66.46 | 66.46 | 132.92 |
| A60 | Learning performance [92,138,144] | 7.8 | 9 | 7 | 56.56 | 56.56 | 113.12 |
| A61 | Novelty [9,90,101,102,104,105,106] | 7.0 | 9 | 5 | 55.22 | 55.22 | 110.44 |
| A62 | Innovation [84,108] | 7.8 | 9 | 7 | 54.28 | 54.28 | 108.56 |
| A63 | Perceived usefulness [68,145] | 8.2 | 9 | 7 | 45.44 | 45.44 | 90.88 |
| A64 | Perceived ease of use [68,145] | 9.0 | 9 | 9 | 53.40 | 53.40 | 106.80 |
| A65 | Easy to use [84,100] | 8.2 | 9 | 7 | 65.00 | 65.00 | 130.00 |
| A66 | Willingness to Use [95] | 6.2 | 9 | 1 | 63.46 | 63.46 | 126.92 |
| A67 | Affordance [146] | 7.4 | 9 | 5 | 58.48 | 58.48 | 116.96 |
| A68 | Price Value [16,147] | 5.0 | 9 | 1 | 64.88 | 64.88 | 129.76 |
| A69 | Social interaction [95] | 5.0 | 9 | 1 | 64.88 | 64.88 | 129.76 |
| A70 | Social presence [8,95] | 5.4 | 9 | 1 | 65.48 | 65.48 | 130.96 |
| A71 | Social behavior [138] | 5.4 | 9 | 1 | 65.48 | 65.48 | 130.96 |
| A72 | Social Richness [95] | 6.2 | 9 | 3 | 61.42 | 61.42 | 122.84 |
| A73 | Social Realism [95] | 5.8 | 9 | 1 | 64.38 | 64.38 | 128.76 |
| A74 | Achievement [8] | 6.6 | 9 | 5 | 45.36 | 45.36 | 90.72 |
| A75 | Self-presentation [8] | 5.4 | 9 | 1 | 65.48 | 65.48 | 130.96 |
| A76 | Captivation [125] | 7.8 | 9 | 5 | 58.18 | 58.18 | 116.36 |
| A77 | Immersion [77] | 6.2 | 9 | 1 | 58.42 | 58.42 | 116.84 |
| A78 | Immersion aspect [96] | 5.8 | 9 | 1 | 60.62 | 60.62 | 121.24 |
| A79 | Fantasy [8] | 5.4 | 9 | 1 | 65.86 | 65.86 | 131.72 |
| A80 | Escapism [8] | 5.8 | 9 | 1 | 66.46 | 66.46 | 132.92 |
| A81 | Attention [140,143] | 6.6 | 9 | 5 | 53.04 | 53.04 | 106.08 |
| A82 | Intuitiveness [121] | 8.2 | 9 | 7 | 50.28 | 50.28 | 100.56 |
| A83 | Naturalness [77,84] | 5.8 | 7 | 1 | 64.52 | 64.52 | 129.04 |
| A84 | Sense of realism [122] | 7.8 | 9 | 5 | 58.18 | 58.18 | 116.36 |
| A85 | Autonomy [67] | 6.2 | 7 | 3 | 42.68 | 42.68 | 85.36 |
| A86 | Relatedness [67] | 6.6 | 9 | 1 | 67.64 | 67.64 | 135.28 |
| A87 | Credibility [77] | 8.2 | 9 | 7 | 65.00 | 65.00 | 130.00 |
| Importance: 1.0 | Importance: 0.8 | Importance: 0.7 | Importance: 0.6 | Importance: 0.5 | Importance: 0.4 | Importance: 0.3 | Importance: 0.2 |
|---|---|---|---|---|---|---|---|
| ID | Attribute |
|---|---|
| A01 | Usability |
| A03 | Efficiency |
| A05 | Navigability |
| A07 | Perspicuity |
| A08 | Dependability |
| A13 | Performance |
| A15 | Task completion |
| A19 | Correctness |
| A21 | Space Perception |
| A22 | Image quality |
| A34 | Engagement |
| A35 | Satisfaction |
| A39 | Stimulation |
| A48 | Biofeedback |
| A51 | Aesthetics |
| A52 | Attractiveness |
| A55 | Cognitive demand |
| A53 | Ergonomics |
| A61 | Novelty |
| A01 | A03 | A05 | A07 | A08 | A13 | A15 | A19 | A21 | A22 | A34 | A35 | A39 | A48 | A51 | A52 | A53 | A55 | A61 | |
|---|---|---|---|---|---|---|---|---|---|---|---|---|---|---|---|---|---|---|---|
| A01 | 0.0 | 3.6 | 3.8 | 3.0 | 3.2 | 2.8 | 3.2 | 3.6 | 2.6 | 1.6 | 3.4 | 3.2 | 3.6 | 2.4 | 3.2 | 3.0 | 3.0 | 3.6 | 2.0 |
| A03 | 3.6 | 0.0 | 2.6 | 3.2 | 3.4 | 3.0 | 3.2 | 2.8 | 1.8 | 1.4 | 2.6 | 3.0 | 2.6 | 3.2 | 2.4 | 1.8 | 2.2 | 4.0 | 1.6 |
| A05 | 3.8 | 3.6 | 0.0 | 3.2 | 2.4 | 3.2 | 3.0 | 3.4 | 2.2 | 2.6 | 3.6 | 3.4 | 3.4 | 2.0 | 3.2 | 2.8 | 3.2 | 3.6 | 1.6 |
| A07 | 3.6 | 3.0 | 3.2 | 0.0 | 3.0 | 1.6 | 3.2 | 3.2 | 2.2 | 1.2 | 2.8 | 3.4 | 3.2 | 2.4 | 2.8 | 2.8 | 2.6 | 3.2 | 2.0 |
| A08 | 3.8 | 3.2 | 2.6 | 3.2 | 0.0 | 2.4 | 2.8 | 3.0 | 2.0 | 1.0 | 3.2 | 3.2 | 2.6 | 2.0 | 2.8 | 2.8 | 2.4 | 2.6 | 2.2 |
| A13 | 3.2 | 4.0 | 3.0 | 1.8 | 3.0 | 0.0 | 2.6 | 3.0 | 1.6 | 2.0 | 3.6 | 3.4 | 2.6 | 2.0 | 1.8 | 1.8 | 2.2 | 3.2 | 1.4 |
| A15 | 3.0 | 3.0 | 2.6 | 2.0 | 2.4 | 2.4 | 0.0 | 2.2 | 1.6 | 1.0 | 2.2 | 2.8 | 3.0 | 2.6 | 1.2 | 1.6 | 2.6 | 2.8 | 1.4 |
| A19 | 3.6 | 3.2 | 2.8 | 3.2 | 3.2 | 2.0 | 2.8 | 0.0 | 1.8 | 1.2 | 3.4 | 3.4 | 3.0 | 2.6 | 3.4 | 3.2 | 2.4 | 3.0 | 1.8 |
| A21 | 3.0 | 2.6 | 2.8 | 1.8 | 2.6 | 1.6 | 1.8 | 2.6 | 0.0 | 1.2 | 2.4 | 2.4 | 3.2 | 2.4 | 3.2 | 2.4 | 2.2 | 3.0 | 2.0 |
| A22 | 3.4 | 2.4 | 2.6 | 2.6 | 1.6 | 2.6 | 1.6 | 2.8 | 1.4 | 0.0 | 4.0 | 2.8 | 3.8 | 2.6 | 4.0 | 4.0 | 1.6 | 3.4 | 1.4 |
| A34 | 3.0 | 1.8 | 1.8 | 2.2 | 3.0 | 2.0 | 2.4 | 3.2 | 1.6 | 2.4 | 0.0 | 3.6 | 3.2 | 2.4 | 2.6 | 3.4 | 2.8 | 3.0 | 2.2 |
| A35 | 3.4 | 3.0 | 3.0 | 2.4 | 2.8 | 1.8 | 2.8 | 2.8 | 2.2 | 1.8 | 4.0 | 0.0 | 3.8 | 2.8 | 3.0 | 2.2 | 2.8 | 3.2 | 2.0 |
| A39 | 3.6 | 2.0 | 2.2 | 2.4 | 2.6 | 1.4 | 2.8 | 2.8 | 2.2 | 2.4 | 3.4 | 3.4 | 0.0 | 3.0 | 2.4 | 2.4 | 2.6 | 3.8 | 2.2 |
| A48 | 2.4 | 2.0 | 1.2 | 2.2 | 1.4 | 1.4 | 2.2 | 2.2 | 1.8 | 1.6 | 1.8 | 2.6 | 2.6 | 0.0 | 1.6 | 2.4 | 2.0 | 2.6 | 2.0 |
| A51 | 3.2 | 2.6 | 1.8 | 3.0 | 2.4 | 2.0 | 2.2 | 2.8 | 3.4 | 3.2 | 3.8 | 3.2 | 4.0 | 2.4 | 0.0 | 4.0 | 3.0 | 2.6 | 1.6 |
| A52 | 3.0 | 2.4 | 2.2 | 3.6 | 2.8 | 1.8 | 3.0 | 2.2 | 3.0 | 2.4 | 4.0 | 4.0 | 4.0 | 2.8 | 4.0 | 0.0 | 3.0 | 2.8 | 2.0 |
| A53 | 3.2 | 2.8 | 3.2 | 2.6 | 2.0 | 3.2 | 2.6 | 2.6 | 2.6 | 1.6 | 3.0 | 3.6 | 3.4 | 3.2 | 2.4 | 2.2 | 0.0 | 3.0 | 1.6 |
| A55 | 2.8 | 2.8 | 2.0 | 2.6 | 1.6 | 1.6 | 2.2 | 2.8 | 2.2 | 1.4 | 2.6 | 2.6 | 2.8 | 2.6 | 3.2 | 2.4 | 2.6 | 0.0 | 2.2 |
| A61 | 2.4 | 2.2 | 2.4 | 1.8 | 3.4 | 1.6 | 1.8 | 2.0 | 2.0 | 2.4 | 3.4 | 2.8 | 3.0 | 2.6 | 2.6 | 2.6 | 2.0 | 2.6 | 0.0 |
| A01 | A15 | A34 | A35 | A39 | A51 | A53 | |
|---|---|---|---|---|---|---|---|
| A01 | 0.00 | 0.06 | 0.06 | 0.06 | 0.07 | 0.06 | 0.05 |
| A15 | 0.05 | 0.00 | 0.04 | 0.05 | 0.05 | 0.02 | 0.05 |
| A34 | 0.05 | 0.04 | 0.00 | 0.07 | 0.06 | 0.05 | 0.05 |
| A35 | 0.06 | 0.05 | 0.07 | 0.00 | 0.07 | 0.05 | 0.05 |
| A39 | 0.07 | 0.05 | 0.06 | 0.06 | 0.00 | 0.04 | 0.05 |
| A51 | 0.06 | 0.04 | 0.07 | 0.06 | 0.07 | 0.00 | 0.05 |
| A53 | 0.06 | 0.05 | 0.05 | 0.07 | 0.06 | 0.04 | 0.00 |
| A01 | A15 | A34 | A35 | A39 | A51 | A53 | |
|---|---|---|---|---|---|---|---|
| A01 | 0.43 | 0.40 | 0.48 | 0.47 | 0.49 | 0.42 | 0.39 |
| A15 | 0.37 | 0.26 | 0.35 | 0.36 | 0.37 | 0.29 | 0.30 |
| A34 | 0.42 | 0.34 | 0.36 | 0.42 | 0.42 | 0.36 | 0.34 |
| A35 | 0.45 | 0.37 | 0.45 | 0.38 | 0.45 | 0.39 | 0.36 |
| A39 | 0.43 | 0.35 | 0.42 | 0.42 | 0.37 | 0.36 | 0.34 |
| A51 | 0.46 | 0.36 | 0.46 | 0.45 | 0.47 | 0.35 | 0.37 |
| A53 | 0.44 | 0.36 | 0.43 | 0.44 | 0.44 | 0.37 | 0.30 |
| ID | Attribute | D + R | D − R | Group |
|---|---|---|---|---|
| A22 | Image quality | 11.48 | 2.26 | CAUSE |
| A61 | Novelty | 10.90 | 1.37 | |
| A05 | Navigability | 14.01 | 1.18 | |
| A13 | Performance | 11.92 | 1.10 | |
| A52 | Attractiveness | 14.08 | 0.71 | |
| A21 | Space Perception | 11.55 | 0.66 | |
| A53 | Cognitive demand | 13.26 | 0.39 | |
| A07 | Perspicuity | 13.56 | 0.32 | |
| A51 | Aesthetics | 14.13 | 0.23 | |
| A08 | Dependability | 13.32 | 0.16 | |
| A19 | Correctness | 14.07 | −0.01 | EFFECT |
| A03 | Efficiency | 13.76 | −0.25 | |
| A01 | Usability | 15.72 | −0.41 | |
| A15 | Task completion | 12.26 | −0.88 | |
| A35 | Satisfaction | 14.89 | −0.95 | |
| A34 | Engagement | 14.49 | −1.37 | |
| A39 | Stimulation | 14.68 | −1.37 | |
| A48 | Biofeedback | 11.57 | −1.39 | |
| A55 | Ergonomics | 13.87 | −1.76 |
| A01 | A03 | A05 | A07 | A08 | A13 | A15 | A19 | A21 | A22 | A34 | A35 | A39 | A48 | A51 | A52 | A53 | A55 | A61 |
|---|---|---|---|---|---|---|---|---|---|---|---|---|---|---|---|---|---|---|
| 15.73 | 13.76 | 14.06 | 13.56 | 13.32 | 11.97 | 12.30 | 14.07 | 11.57 | 11.70 | 14.55 | 14.92 | 14.75 | 11.65 | 14.14 | 14.09 | 13.26 | 13.98 | 10.99 |
| A01 | A03 | A05 | A07 | A08 | A13 | A15 | A19 | A21 | A22 | A34 | A35 | A39 | A48 | A51 | A52 | A53 | A55 | A61 |
|---|---|---|---|---|---|---|---|---|---|---|---|---|---|---|---|---|---|---|
| 0.0618 | 0.0541 | 0.0553 | 0.0533 | 0.0524 | 0.0471 | 0.0483 | 0.0553 | 0.0455 | 0.0460 | 0.0572 | 0.0587 | 0.0580 | 0.0458 | 0.0556 | 0.0554 | 0.0521 | 0.0550 | 0.0432 |
Disclaimer/Publisher’s Note: The statements, opinions and data contained in all publications are solely those of the individual author(s) and contributor(s) and not of MDPI and/or the editor(s). MDPI and/or the editor(s) disclaim responsibility for any injury to people or property resulting from any ideas, methods, instructions or products referred to in the content. |
© 2023 by the authors. Licensee MDPI, Basel, Switzerland. This article is an open access article distributed under the terms and conditions of the Creative Commons Attribution (CC BY) license (https://creativecommons.org/licenses/by/4.0/).
Share and Cite
Gutiérrez, L.E.; Samper, J.J.; Jabba, D.; Nieto, W.; Guerrero, C.A.; Betts, M.M.; López-Ospina, H.A. Combined Framework of Multicriteria Methods to Identify Quality Attributes in Augmented Reality Applications. Mathematics 2023, 11, 2834. https://doi.org/10.3390/math11132834
Gutiérrez LE, Samper JJ, Jabba D, Nieto W, Guerrero CA, Betts MM, López-Ospina HA. Combined Framework of Multicriteria Methods to Identify Quality Attributes in Augmented Reality Applications. Mathematics. 2023; 11(13):2834. https://doi.org/10.3390/math11132834
Chicago/Turabian StyleGutiérrez, Luz E., José Javier Samper, Daladier Jabba, Wilson Nieto, Carlos A. Guerrero, Mark M. Betts, and Héctor A. López-Ospina. 2023. "Combined Framework of Multicriteria Methods to Identify Quality Attributes in Augmented Reality Applications" Mathematics 11, no. 13: 2834. https://doi.org/10.3390/math11132834
APA StyleGutiérrez, L. E., Samper, J. J., Jabba, D., Nieto, W., Guerrero, C. A., Betts, M. M., & López-Ospina, H. A. (2023). Combined Framework of Multicriteria Methods to Identify Quality Attributes in Augmented Reality Applications. Mathematics, 11(13), 2834. https://doi.org/10.3390/math11132834