Abstract
The classic E-Bayesian estimation methods can only derive point estimation of the reliability parameters. In this paper, an improved E-Bayesian estimation method is proposed to evaluate product reliability under heavily censored data, which can achieve both point and confidence interval estimation for the reliability parameters. Firstly, by analyzing the concavity & convexity and function characteristics of the Weibull distribution, the value of product failure probability is limited to a certain range. Secondly, an improved weighted least squares method is utilized to construct the confidence interval estimation model of reliability parameters. Simulation results show that the proposed approach can significantly improve the calculation speed and estimation accuracy with just very few robustness reductions. Finally, a real-world case study of the sun gear transmission mechanism is used to validate the effectiveness of the presented method.
MSC:
90B25
1. Introduction
The reliability evaluation method of the product is essentially a mathematical statistical method of specific censored data under specific distribution occasions. Normal distribution, exponential distribution and Weibull distribution are often used to describe the life distribution of products. Among them, Weibull distribution is the most flexible one. Weibull distribution was first proposed by Swedish scientist Weibull. The Weibull distribution model can be regarded as a generalization of the exponential distribution model. The introduction of shape parameters makes it more accurate than the exponential distribution model in describing the products whose failure rate increases or decreases with time. In addition, by adjusting the shape parameters, Weibull distribution is also capable of describing the normal distribution approximately. Many studies show that the life distribution of most mechanical products approximately follows Weibull distribution. Wang [1] proposed a new inference for constant-stress accelerated life tests with Weibull distribution. Wang [2], Joarder [3] and Kundu [4] proposed MLE methods for Weibull parameters. Denecke [5], Tan [6] and Krishnamoorthy [7] studied the method of solving lower confidence limit for Weibull distribution.
Reliability life test is an important way to collect life data. If a test stops before all samples fail, we call it censoring test, and the corresponding test data is truncated sample. The censoring test can be classified into four types, namely conventional Type-II censoring, progressive Type-II censoring [8], conventional Type-I censoring and progressive Type-I censoring [9].
With the rapid development of science and technology, products with long lifetime and high reliability are emerging. As a result, in many life tests only the heavily censored data are available for reliability estimation. Under some special conditions, including products with high reliability and very few test samples, no test data or only very few failure data can be obtained, which challenges the traditional reliability evaluation methods [10,11].
Jiang [12] studied the problem of reliability estimation with zero failure data, in which the Bayesian prior distribution model was constructed by using the “kernel” idea. Jiang [13] developed a hybrid censoring index to quantitatively describe censoring characteristics of a data set, proposed a novel parameter estimation method based on information extracted from censored observations, and evaluated the accuracy and robustness of the proposed method through a numerical experiment. Han [14,15,16] reviewed the reliability assessment methods under zero-failure data conditions, and summarized the corresponding advantages, disadvantages and application ranges. Li [17,18] proposed a reliability assessment method with revised confidence limits. It can effectively avoid the aggressive phenomenon of reliability estimation results. The hierarchical Bayesian method generalizes the current Bayesian method to provide the ability to perform parameter point estimation and confidence interval estimation at the same time, which effectively improves the credibility of the results [19]. Based on the modification of the hierarchical Bayesian estimation method, the E-Bayesian estimation method was proposed. Compared with the hierarchical Bayesian method, the E-Bayesian estimation method simplifies the mathematical model and improves the calculation efficiency [20,21,22]. Jia [23] proposed an improved method based on the Bayesian inference and least-squares method, and the four existing methods were com-pared with this method in terms of applicability, precision, efficiency, robustness, and simplicity.
The current E-Bayesian estimation methods mainly focus on point estimation of parameters, which do not solve the problem of confidence interval estimation. If the calculation method of confidence interval estimation is different from point estimation, the credibility of the results will reduce [24,25]. In addition, most E-Bayesian estimation methods assume that the range of failure probability is (0, 1), it does not consider the relationship between the failure probability of each truncation time, which causes the range of failure probability values to be too large, and affects the accuracy. Furthermore, in the process of solving the distribution parameters by using the distribution curve, the weight of the weighted least square method used does not consider the role of the failure sample, which makes the obtained reliability higher. In order to overcome the above problems, we propose a new reliability assessment method based on the E-Bayesian. Firstly, based on the E-Bayesian estimation and the distribution curve method, we develop a confidence interval method. Secondly, we use the unevenness of the distribution function and the function characteristics to determine the value range of the failure probability. Thirdly, improve the original weighted least square method with a new weight function, which consider the number of failed samples.
2. Heavily Censored Data Model
Due to time and cost constraints, for many products their life tests are often terminated before all units fail, and thus produce the so-called censored data. In the test, due to the high reliability of the product and the large number of units, the test observation time is relatively short. Therefore, in the collected data, the ratio of faults to the entire unit is usually less than 0.5 or very small. This collected data is called heavily censored data [13]. A model for heavily censored data is established, and it is the foundation for subsequent product reliability index evaluation.
The Weibull distribution is a common random distribution and widely used in modeling lifetime distribution for machinery and electronic products [26,27]. If we set the shape parameter of Weibull distribution to be 1, it reduces to an exponential distribution, which is only suitable to model electronic lifetime with the property of memoryless. Under the condition of heavily censored data, it is assumed that the product life follows a distribution function , where there are () samples in the timing truncation test, a total of time timing truncation tests are performed, and the end time of each timing truncation test is used to indicate, there are samples that terminate the test at , and .
Let be the number of failed samples during , and be the corresponding failure time. Here, and . Thus indicates the total number of failed samples in the test. The samples are numbered from 1 to at each end of the timing truncation test. After all timing truncation tests are completed, the life number data are collected corresponding to the sample number . Apparently, reduces to the special case of zero-failure life test.
In addition, , where consist of two parts, the first part is the number of samples still participating in the test at , the second part is failure samples at the internal . Setting as the failure probability at each censoring moment. It is obvious that at time t = 0, .
Here, the distribution curve method is used to estimate the distribution parameters. The estimator of the failure probability at each truncation moment is the precondition, and it is the core link used by the distribution curve method.
3. E-Bayesian Estimation of under Heavily Censored Data
The E-Bayesian parameter estimation method can be regarded as the modified Bayesian estimation method [28,29].
Definition 1:
Let the hyperparameter. If the Bayesian point estimateis continuous, the E-Bayesian point estimation of the parametersis
whereexists,,is a constant,is the density function of the hyperparameteron the interval, andis Bayesian estimation of.
Equation (1) indicates that the E-Bayesian point estimation of is the expectation of the Bayesian estimate about the hyperparameter , where .
3.1. Prior Distribution of
In the case of heavily censored data, it is evident that the prior distribution density function of the failure probability is a decreasing function. Some common distribution functions in constructing the failure probability prior distribution are: Beta distribution, Gamma distribution, Exponential distribution, and Logarithmic distribution, where Beta (a, b) is a conjugate prior distribution of parameter . The conjugate prior distribution can conveniently integrate historical information and provide a reasonable premise for future test data analysis. Some parameters can also be better explained simultaneously [30]. This study uses the Beta (a, b) distribution as the prior distribution of , and adjusts the Beta (a, b) value range according to the change of the failure probability value range.
where,
As this paper focuses on the case of heavily censored data in the timing data in the timing truncation test, the failure probability is more likely to be small value in [0, 1]. And the prior distribution density function is derived:
Equation (3) is established when and . According to the property of the probability density of the Beta distribution function, when , the larger the value of , the thinner the right tail of the probability density function. From the perspective of the robustness of the Bayesian estimation, the thinner the right tail of the prior distribution, the worse is the robustness of the Bayesian estimation. Therefore, there must be an upper limit on the value of , which is . In practical applications, is generally selected in an interval [2, 8]. It is very difficult to further determine the exact value of and . Rather than using expert experience to determine a uniquely determined value, it is better to assume that and are uniformly distributed within their respective values, so the prior distribution density function of and is
3.2. E-Bayesian Estimation of Failure Probability
In the model of heavily censored data, the likelihood function of the failure probability is
Taking the prior distribution function of the failure probability in Equation (2) and the likelihood function in Equation (5) into the Bayesian formula, the poster distribution density function of failure probability can be obtained
With the squared loss function, the Bayesian point estimation of the failure probability is calculated as
when and , Equation (6) becomes
Equation (7) becomes
Taking the prior distribution density function of and in Equation (4) into Equation (1), the E-Bayesian estimation of failure probability is
3.3. Value Range of Failure Probability
Motivated by reference [31], the distribution function of the life obeying the Weibull distribution is
where , is the shape parameter, and is the scale parameter. The corresponding reliability function is
Regarding the determination of the failure probability , the value range are , and , the current research is mainly divided into two methods. The first method takes and . The second method uses the unevenness of the distribution function and the function characteristics to determine the value range of the failure probability. The method of setting the failure probability value range and is too conservative, and the characteristics of heavily censored data are not considered, so the calculation accuracy is poor. In order to improve the accuracy of the failure probability value range, this study uses method two to set the value range of the failure probability.
The second derivative of the Weibull distribution function is
when , it is easy to prove that by Equation (13), and thus the distribution function is a convex function. According to the properties of the convex function, we can obtain
Because , we can get the interval of as follows
The first step is to limit the value range of is , where is the upper limit of . The value of is based on the actual situation and the experience of an expert. For heavily censored data [13], is usually set to be less than 0.5.
When , it is difficult to determine the concavity and convexity of distribution function . Transforming the Weibull distribution function according to the function characteristics, Equation (16) is obtained
Taking and into Equation (16), we have
Then, Equation (17) is transformed into
From Equation (18), , it is known that is the lower limit of and is the upper limit of . The value of is based on the actual situation. According to the unevenness and function characteristics of the distribution function, the value range of can be determined as follow
4. E-Bayesian Point Estimation of Reliability
In order to obtain distribution parameter estimates, points first need to be obtained, and then a distribution curve based on the points needs to be assigned. As the exact value of the failure probability cannot be obtained during the calculation, the estimation value is used to describe the failure probability . After all the are obtained, the distribution curve method is used to form a distribution curve based on these points . The current commonly used method for fitting a distribution curve is the weighted least square method. Reference [19] using the weighted least squares method to fit the distribution curve, the weight is . This method only considers the influence of the number of test samples and test time on the estimated value of the distribution parameter, and ignores the role of failed samples in the value of the test, so the method can only be used to estimate the distribution parameter of the sample without failure data. For test samples containing failure data, the method has obvious shortcomings. In order to consider the number of test samples, test time, and number of failed samples in the distribution curve, the original weighted least square method is improved. An improved least square method is proposed, the improved weight is , and the method is used to fit the distribution curve.
Let , , , and then Equation (11) is transformed into
With the improved weighted least squares method, the point estimates of distribution parameters and are obtained by fitting , and then the point estimate of reliability is obtained. By minimizing the square of fitting errors, we have
where , .
For the derivative calculation of Equation (21), let , , , and , giving
Taking the estimated value of the distribution parameters obtained from Equation (22) into Equation (19), the point estimation under the Weibull distribution can be obtained
5. E-Bayesian Confidence Interval Estimation
Currently, all applications of the E-Bayesian estimation method focus on the point estimation of parameters, and no further research about parameter confidence interval calculations on this basis. For the estimation of parameter confidence intervals, the other methods should be used, such as the optimal confidence limit method [32] and bootstrap method [33]. Because the methods used for the parameter confidence interval estimation and the point estimation are different, the result will have “disjointed” problem. In fact, on the basis of the E-Bayesian estimation method and the distribution curve method, the confidence interval of the parameters can be obtained.
Under the confidence level value , the first step is to estimate upper confidence value of the failure probability . Based on the poster distribution density function of in Equation (6) and the E-Bayesian estimate of the failure probability in Equation (10), is defined as
Similar to the estimation of upper confidence limit for the hierarchical Bayesian estimation method, Based on the definition of the upper confidence limit, we have
Since and , Equation (25) is solved by the binary search method, and then the upper confidence limit of failure probability is obtained. Based on the linearization process to Equation (18), and are obtained.
According to the improved weighted least square method, the failure probability upper confidence limit curve can be obtained by fitting points . From Equation (21), we have
As has a limited value range and it has a small effect on the reliability index, so the confidence interval of is not assumed. is the point estimation value of , and then taking into fitting the curve with , obtaining the point estimation value . The next step is to obtain the lower confidence limit of the estimation value . Taking into Equation (26), we have
The lower confidence limit of can be obtained when have the smallest value:
The point estimation value and lower confidence limit are taken into the Weibull reliability calculation formula, and then the lower confidence limit of reliability at confidence level can be obtained at any time , it is
Similarly, the upper confidence limit of the failure probability is
The upper confidence limit of the failure rate function is
6. Simulation Verification
In order to verify the accuracy of the proposed method, simulation experiments were used to generate simulation samples. Based on the generated simulation samples, the classic estimation method [34], the hierarchical Bayesian estimation method [19], and the E-Bayesian estimation method are used to evaluate the reliability of the sample. The results are compared from multiple aspects such as robustness, average time consumption and distance from the true value. Zhang [35] describes the process of generating simulation samples:
(1) Setting the true value of the shape parameter and scale parameter in the Weibull distribution, and then the failure time is randomly generated through MATLAB, that is, there are experimental samples from the simulation experiment.
(2) uniformly distributed random numbers , .
(3) The truncation level CL is determined, based on that, () failure times from all are arbitrarily selected, denoted as . The remaining failure time is represented by .
(4) is replaced by , which is used to indicate zero-failure truncation time .
(5) Based on the value of and , the truncation time is grouped and the minimum truncation time is taken as the truncation time of the censored experiment of the group.
For this simulation, 11 samples were selected for 5 censored experiments. In the Weibull distribution, the shape parameter and scale parameter . Taking the truncation level CL = 0.1, the simulation samples were generated, they were shown in Table 1.

Table 1.
Simulation samples.
From Equation (14), when , the upper limit of needs to be determined, since even in a censored test, the value of will continuously change with time . It will increase the calculation complexity and cumulative error, so generally the value of is set to 1 and the value range of failure probability is .
Based on the data in Table 1, the classical estimation method [34], the hierarchical Bayesian estimation method [19], and the E-Bayesian estimation method proposed in this study were used to solve the failure probability estimates. The calculation results of the failure probability at time are shown in Table 2.
Table 2.
The failure probability at c.
Table 2 gives the failure probability estimation results of three different methods. The estimation range under different values and average running time are also compared in the table. Compared with [19], although the robustness of the proposed method is slightly lower, and the algorithm efficiency is significantly improved. Furthermore, compared with [19,34], our method has higher calculation accuracy due to modify the value range of failure probability.
is used in subsequent calculation, and reliability calculated by the method proposed in this study is compared with and which are calculated by methods proposed in [19,34] respectively, the results are shown in Figure 1.
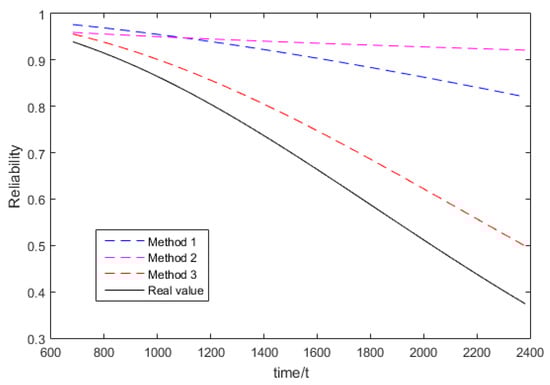
Figure 1.
Reliability comparison.
In the Figure 1, Method 1 is the hierarchical Bayesian estimation method [19], Method 2 is the classic estimation method [34], and Method 3 is the E-Bayesian reliability evaluation method proposed in this study. From Figure 1, it can be seen that E-Bayesian reliability assessment methods with heavily censored data have the closest estimated results to the true values. The classic estimation method [34] does not consider the effect of censored time on the failure probability in the timing truncation test, which makes the reliability overestimated. In the process of determining the failure probability value range, the hierarchical Bayesian estimation method [19] fixed the interval to [0, 1], without considering the sequence relationship between the failure probability values. The determination of the failure probability value range is too conservative. In addition, in the process of solving the distribution parameters using the weighted least squares method, the weight model does not consider the effect of the number of failed samples on the weight value. Due to the above reasons, the obtained reliability estimation value is too large.
In order to solve the lower confidence limit of reliability, the first step is to calculate the upper confidence limit of failure probability under the confidence level of 0.9, and then getting the lower confidence limit of the reliability parameter. As reference [34] does not further analyze the confidence interval of the reliability parameter, the method proposed in this study is only compared with the method in [19]. The corresponding lower confidence limit (LFM) comparison results are shown in Figure 2.
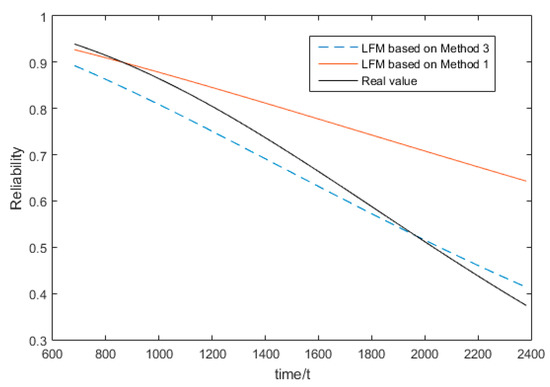
Figure 2.
Reliability confidence lower limit comparison.
In Figure 2, Method 1 is the hierarchical Bayesian estimation method [19] and Method 3 is the E-Bayesian reliability evaluation method proposed in this study. From the comparison results, it can be seen that the method proposed in this study is better than the hierarchical Bayesian method proposed in [19].
7. Case Study
7.1. Transmission Mechanisms
Most of the transmission mechanisms in the integrated transmission are planetary transmission mechanisms. This type of planetary transmission mechanism refers to a transmission mechanism in which the structure includes a planetary gear that rotates around a central axis. Planetary gears are internally connected parts, which are connected to the various elements that rotate around the central axis, including the sun gear, ring gear, and planet carrier, forming various planetary differentials (planetary rows). It can be used alone as a differential, reducer, or power splitting and converging mechanism in the drive train, or it can be used in series to form a speed increasing and reducing mechanism in the drive train. The flexible application of planetary mechanisms has changed a lot and has become the basis for many new developments in transmissions. Among them, the sun gear is a key component of the planetary transmission mechanism, which affects whether the planetary transmission mechanism can be normally used.
In this study, the sun gear of a transmission mechanism is used as the research object, and the timing truncation test is carried out under its normal working conditions. The test data is shown in Table 3.
Table 3.
Sun Gear Test Data.
Where , the failure probability E-Bayesian point estimate value at every censored moment is calculated, and the results are shown in Table 4.
Table 4.
Failure probability and upper confidence limit point estimation.
Then, the point estimation (solid line in Figure 3) curve of the reliability under the Weibull distribution is obtained.
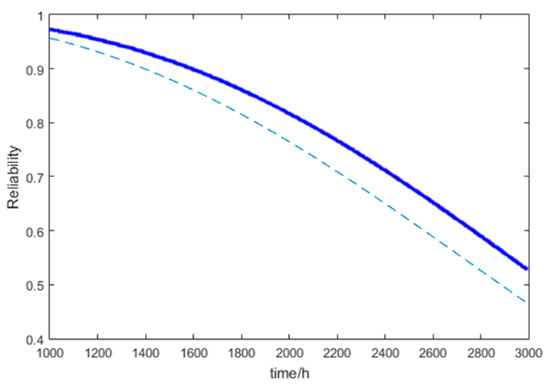
Figure 3.
Reliability Estimation Curve.
In this study, we set the confidence level . With Equation (25), the upper confidence point estimation value (dash line in Figure 3) of failure probability is obtained. The results are shown in Table 4.
The lower confidence limit can be obtained at any moment when the reliability at the confidence level 0.8, and the results are shown in Figure 3.
With Equation (31), the upper confidence limit of the failure rate function is obtained, and the result is shown in Figure 4.
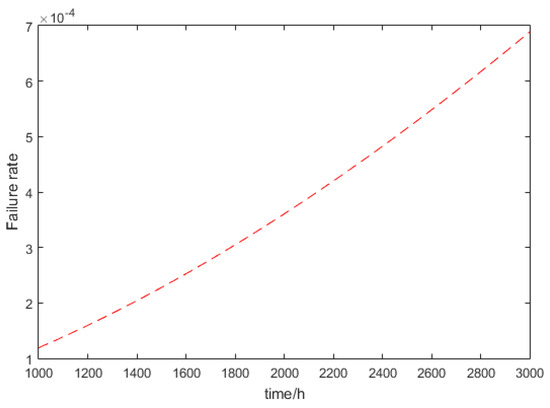
Figure 4.
Failure rate upper confidence limit point estimation curve.
7.2. GPS Receiver
The measurement and control subsystem, it is an important subsystem of the satellite platform. It cooperates with the ground measurement and control system to realize the speed, distance and angle measurement of a satellite. In addition, this subsystem is also used to collect relevant parameters inside the satellite. GPS receiver is one of the components of measurement and control subsystem.
We collected 10 times telemetry data, and there are no failure data of all GPS receivers. The receiving times are shown in Figure 5.
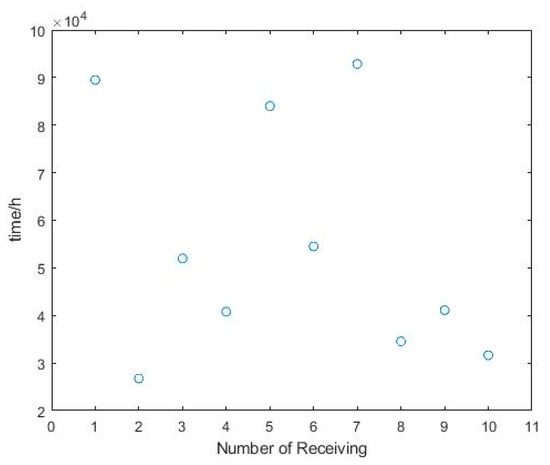
Figure 5.
GPS receiver test data.
Firstly, sort the samples in descending order, namely ,
With the GPS receiver data, we can obtain the reliability point estimation and remaining samples . Set the confidence level to be . Finally, the reliability point estimation and lower confidence limit of GPS receiver for 1 to 8 years are calculated in Figure 6.
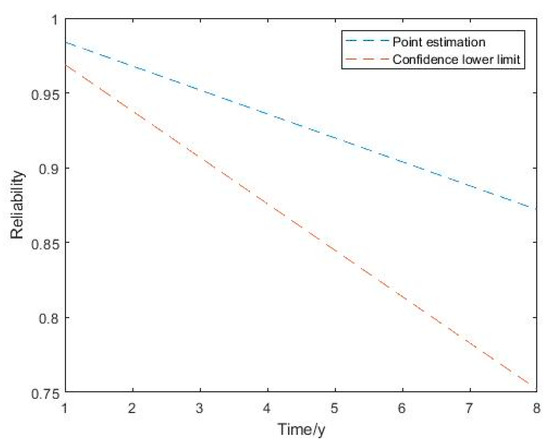
Figure 6.
GPS receiver reliability point estimation and confidence lower limit.
8. Conclusions
In this paper, an improved E-Bayesian estimation method based on Weibull distribution is proposed. Compared with the traditional ones, the main contribution is twofold: (1) We extend the application range of E-Bayesian estimation from zero failure data to extreme few failure data; (2) A novel confidence interval estimation approach for E-Bayesian is provided.
Simulation results show that although the proposed method sacrifices few robustness, it outperforms the traditional ones in the following aspects: (1) Compared with the hierarchical Bayesian estimation method, the E-Bayesian estimation method proposed in this study has simpler mathematical models and calculations. The efficiency is significantly improved. (2) The value range of the failure probability is improved by using the unevenness and function characteristics of the distribution function, and the improved weighted least square method is used to solve the distribution parameters. Compared with the hierarchical Bayesian estimation method, the E-Bayesian estimation method proposed in this study has higher calculation accuracy.
Finally, the method proposed in this study is applied to the data analysis of the sun gear timing truncation test of a transmission mechanism and GPS receiver. It further verified that the method proposed in the study is more conducive to practical application in engineering. The results show that the heavily censored data based on E-Bayesian estimation method can solve the reliability evaluation problem under the condition of non-failure data and few failure data. Therefore, the method proposed in this paper has a wider range of engineering applications.
Reliability assessment methods for heavily censored data has not been studied thoroughly and there are still many issues to be resolved. In practice, we can only have very few failure data of products, it is difficult to collect product performance data. In addition, due to the limited test time and samples, it is generally impossible to collect sufficient life data. In the future, we will pay more attention to the combination of life data and other reliability data, as well as the utilization of historical data.
Author Contributions
Conceptualization, T.L. and L.Z.; methodology, L.Z.; validation, Z.P. and T.L.; formal analysis, G.J.; writing—original draft preparation, L.Z.; writing—review and editing, T.L.; supervision, T.L. and G.J.; funding acquisition, T.L. All authors have read and agreed to the published version of the manuscript.
Funding
This work supported by Research Program supported by the projects of National Natural Science Foundation of China (72001210), and the Science and Technology Innovation Program of Hunan Province (2022RC1243).
Data Availability Statement
Not applicable.
Acknowledgments
The authors would like to acknowledge the authors of the referenced literature, and we wish to express our sincere thanks to the anonymous referee and the Editorial office for their thorough and constructive review.
Conflicts of Interest
The authors declare no conflict of interest.
References
- Wang, B.X.; Yu, K.; Sheng, Z. New inference for constant-stress accelerated life tests with Weibull distribution and progressively Type-II censoring. IEEE Trans. Reliab. 2014, 63, 807–815. [Google Scholar] [CrossRef]
- Wang, G.; Niu, Z.; He, Z. Bias reduction of MLEs for Weibull distributions under grouped lifetime data. Qual. Eng. 2015, 27, 341–352. [Google Scholar] [CrossRef]
- Joarder, A.; Krishna, H.; Kundu, D. Inferences on Weibull parameters with conventional Type-I censoring. Comput. Stat. Data Anal. 2011, 55, 1–11. [Google Scholar] [CrossRef]
- Kundu, D. On hybrid censored Weibull distribution. J. Stat. Plan. Inference 2007, 137, 2127–2142. [Google Scholar] [CrossRef]
- Denecke, L.; Müller, C.H. New robust tests for the parameters of the Weibull distribution for complete and censored data. Metrika 2014, 77, 585–607. [Google Scholar] [CrossRef]
- Tan, Z. A new approach to MLE of Weibull distribution with interval data. Reliab. Eng. Syst. Saf. 2009, 94, 394–403. [Google Scholar] [CrossRef]
- Krishnamoorthy, K.; Lin, Y.; Xia, Y. Confidence limits and prediction limits for a Weibull distribution based on the generalized variable approach. J. Stat. Plan. Inference 2009, 139, 2675–2684. [Google Scholar] [CrossRef]
- Kumar, K.; Garg, R.; Krishna, H. Nakagami distribution as a reliability model under progressive censoring. Int. J. Syst. Assur. Eng. Manag. 2016, 8, 109–122. [Google Scholar] [CrossRef]
- Kumar, I.; Kumar, K. On estimation of P(V < U) for inverse Pareto distribution under progressively censored data. Int. J. Syst. Assur. Eng. Manag. 2021, 13, 189–202. [Google Scholar]
- Martz, H.F.; Waller, R.A. A Bayesian Zero-failure (BAZE) reliability demonstration testing procedure. J. Qual. Technol. 1979, 11, 128–138. [Google Scholar] [CrossRef]
- Quigley, J.; Bedford, T.; Walls, L. Estimating rate of occurrence of rare events with empirical bayes: A railway application. Reliab. Eng. Syst. Saf. 2017, 92, 619–627. [Google Scholar] [CrossRef]
- Jiang, P.; Lin, J.H.; Zuo, M.J.; Guo, B. Reliability estimation in a Weibull lifetime distribution with zero-failure field data. Qual. Reliab. Eng. Int. 2010, 26, 691–701. [Google Scholar] [CrossRef]
- Jiang, R.Y. A novel parameter estimation method for Weibull distribution on heavily censored data. J. Risk Reliab. 2019, 236, 1–10. [Google Scholar] [CrossRef]
- Han, M. Bayesian estimation and hierarchical Bayesian estimation of zero-failure data. Chin. Q. J. Math. 2001, 16, 65–70. [Google Scholar]
- Han, M. Confidence limits of Reliability Parameters for Weibull Distribution. J. Mech. Strength 2009, 31, 59–62. [Google Scholar]
- Han, M. Synthesized process for zero-failure data of the products. Chin. J. Mech. Eng. 2003, 39, 129–132. [Google Scholar] [CrossRef]
- Li, H.Y.; Xie, L.Y.; Li, M. Research on a New Reliability Assessment Method for Zero-failure data. Acta Armamentarii 2018, 39, 1622–1631. [Google Scholar]
- Li, H.Y.; Xie, L.Y.; Li, M. Reliability assessment of high-quality and long-life products based on zero-failure data. Qual. Reliab. Eng. Int. 2019, 35, 470–482. [Google Scholar] [CrossRef]
- Jia, X.; Wang, X.L.; Guo, B. Reliability Assessment for Very Few Failure Data and Zero-failure Data. J. Mech. Eng. 2016, 52, 182–188. [Google Scholar] [CrossRef]
- Jaheen, Z.F.; Okasha, H.M. E-Bayesian estimation for the Burr type XII model based on type-2 censoring. Appl. Math. Model. 2011, 35, 4730–4737. [Google Scholar] [CrossRef]
- Yin, Y.-C.; Huang, H.-Z.; Peng, W.; Li, Y.-F. An E-Bayesian method for reliability analysis distributed products with zero-failure data. Eksploat. I Niezawodn.-Maint. Reliab. 2016, 18, 445–449. [Google Scholar] [CrossRef]
- Yousefzadeh, F. E-Bayesian and hierarchical Bayesian estimations for the system reliability parameter based on asymmetric loss function. Commun. Stat.-Theory Methods 2017, 46, 1–8. [Google Scholar] [CrossRef]
- Jia, X. Reliability analysis for Weibull distribution with homogeneous heavily censored data based on Bayesian and least-squares methods. Appl. Math. Model. 2020, 83, 169–188. [Google Scholar] [CrossRef]
- Han, M. E-Bayesian estimation of failure probability and its application. Math. Comput. Model. 2007, 45, 1272–1279. [Google Scholar] [CrossRef]
- Zhao, Q.; Ge, H.J.; Zhang, L.; Chen, S.; Xue, J. Reliability analysis of equipment for zero-failure of type-I censoring test with replacement. J. Beijing Univ. Aeronaut. Astronaut. 2018, 44, 1246–1252. [Google Scholar]
- Fang, Z.Q.; Gao, L.H. Estimation of Parameters of Three-parameter Weibull Distribution in Life Analysis. J. Armored Force Eng. Inst. 1999, 13, 70–74. [Google Scholar]
- Balamurali, S.; Jeyadurga, P.; Usha, M. Optimal designing of quick switching sampling system assuring percentile life under Weibull distribution. Commun. Stat. 2018, 47, 1550–1563. [Google Scholar] [CrossRef]
- Tang, Y.Z. E-Bayesian estimation of failure probability and hierarchical Bayesian estimation. J. Fujian Univ. Technol. 2012, 10, 523–528. [Google Scholar]
- Rabie, A.; Li, J.P. E-Bayesian estimation based on Burr-X generalized Type-II Hybrid censored data. Symmetry 2019, 11, 626. [Google Scholar] [CrossRef]
- Mao, S.S.; Xia, J.F.; Guan, W.Q. The reliability analysis of zero-failure data for bearing life test. Chin. J. Appl. Probab. Stat. 1993, 9, 326–331. [Google Scholar]
- Jiang, P.; Xing, Y.; Jia, X.; Guo, B. Weibull failure probability estimation based on zero-failure data. Math. Probl. Eng. 2015, 2015, 1–8. [Google Scholar] [CrossRef]
- Chen, J.D.; Sun, W.L.; Li, B.X. On the confidence limits in the case of no failure data. Acta Math. Appl. Sin. 1995, 18, 90–100. [Google Scholar]
- Bae, S.; Kim, N.H.; Park, C.; Kim, Z. Confidence interval of Bayesian network and global sensitivity analysis. AIAA J. 2017, 55, 3916–3924. [Google Scholar] [CrossRef]
- Xia, X.T. Reliability analysis of zero-failure data with poor information. Qual. Reliab. Eng. Int. 2012, 28, 981–990. [Google Scholar] [CrossRef]
- Zhang, L.F.; Xie, M.; Tang, L.C. A Study of Two Estimation Approaches for Parameter of Weibull Distribution Based on WPP. Reliab. Eng. Syst. Saf. 2007, 92, 360–368. [Google Scholar] [CrossRef]
Publisher’s Note: MDPI stays neutral with regard to jurisdictional claims in published maps and institutional affiliations. |
© 2022 by the authors. Licensee MDPI, Basel, Switzerland. This article is an open access article distributed under the terms and conditions of the Creative Commons Attribution (CC BY) license (https://creativecommons.org/licenses/by/4.0/).