Abstract
A new life performance index is proposed for evaluating the quality of lifetime products. The maximum likelihood estimation method and the Bayesian approaches using informative and non-informative prior distributions are utilized to infer the parameters of the Weibull distribution and the proposed new life performance index under a Type-I hybrid censoring scheme. Monte Carlo simulation results show that two Bayesian approaches outperform the maximum likelihood estimation method in terms of the measures of relative bias, relative mean square error, and coverage probability for the point and confidence interval estimators, respectively. The Bayesian approach using a non-informative prior distribution is recommended if the knowledge of setting up the hyper-parameters in the informative prior distribution is not available. Two real data sets are provided for illustration.
Keywords:
life performance index; maximum likelihood estimation; Bayesian estimation; Monte Carlo simulation MSC:
62F10; 62P30
1. Introduction
Process capability analysis is one of the important issues during the statistical quality control applications. It allows the producer to know whether the product meets the specification and quality requirements. Process capability index (PCI) is a method to quantify process capability. The concept of PCI is to measure the degree of the quality characteristic meeting the requirements of a given specification limit. At present, many commonly used PCIs have been suggested in the literature to improve product quality, such as , , , and (Juran [1], Kane [2], Hsiang and Taguchi [3], Pearn et al. [4] and Montgomery [5]), which are, respectively, defined as follows,
where U, L, T, and are the upper, lower specification limits, target value, and process standard deviation and mean, respectively. The aforementioned PCIs have two specification limits to quantify the product quality. Practically, producers and customers could only consider the quality of products to meet above the lower specification limit. Kane [2] proposed a PCI, named , which only considers the lower limit of the specification and is defined by
The process performance index based on the version of is expressed by
Readers can refer to the work of Montgomery [5] for more comprehensive discussions. It is worth noting that the premise of using these traditional PCIs is the normality assumption. If lifetime data do not follow a normal distribution, reliable results could not be achieved. For example, measurement data for drilling processes, coating processes, and chemical processes often follow an asymmetric distribution. For improving the quality of traditional PCIs for asymmetrically distributed data, Clements [6] proposed to replace the and by and , respectively. The two new PCIs for asymmetric distributions are, respectively, defined by
and
where , , and M are, respectively, the -quantile, -quantile, and median of quality characteristic measurements. Similarly, should be modified for asymmetric distributions. A new modification will be proposed in the study for the Weibull distribution.
The manufacturing technology advancing has successfully prolonged the lifetime of products. In order to save the time and cost of life testing, Type-I and Type-II censoring schemes have been popular for implementing life tests. Type-I censoring uses a time censoring scheme, and the life test is terminated at the predetermined time T, then the failure times less than or equal to T are recorded as a type-I censoring sample. Type-II censoring scheme is also called failed number censoring scheme. r failed lifetimes are collected as a Type-II censored sample in which the positive integer, r, is predetermined by engineers before the life test. To make the censoring scheme more flexible, Epstein [7] introduced a Type-I hybrid censoring scheme. The life test can be terminated at the minimal termination time of the Type-I and Type-II censoring schemes. When the life test is terminated at the maximal termination time of the Type-I and Type-II censoring schemes, the censoring scheme is named Type-II hybrid censoring scheme, see Childs et al. [8].
At present, many researchers have made contributions to the life performance index for non-normal distribution. For example, the life performance index based on random sample from Rayleigh distribution by Lee [9], based on type II censored sample from Pareto distribution by Hong et al. [10], based on progressively type II censored sample from exponential distribution by Lee et al. [11], and based on progressively type I interval censored sample from the Weibull distribution by Wu and Lin [12]. Although these studies have insight contributions into the life performance index for asymmetric distributions, it still needs to be improved for reflecting the Weibull distribution data with the traditional life performance index. Hence, a new life performance index is proposed to evaluate the life quality of the Weibull distribution data. Based on our knowledge, no one has studied the inference method for the new proposed life performance index using a Type-I hybrid censoring scheme. In this study, we proposed the maximum likelihood estimation and Bayesian inference methods to obtain the point estimates of the parameters and the new proposed life performance index based on Type-I hybrid censored sample from Weibull distribution. Because the Type-I hybrid censoring scheme is used for life testing to save testing time, the Fisher information matrix is difficult to obtain because the number of failures and stopping time of the life testing are random variables. The facts of the number of failures and stopping time of the life testing are random variables that also have an impact on the quality of the observed Fisher information matrix. The second derivatives of the log-likelihood function based on Type-I hybrid censored samples from the Weibull distribution are complicated, and the Fisher information matrix exists only if some regular conditions are true, see Wang and He [13]. Hence, we suggest using a bootstrap method to find a confidence interval based on the maximum likelihood estimation method. The highest posterior density interval (HPDI) is used to develop a Bayesian credible interval for the new proposed life performance index. Some studies have also investigated the parameter estimation methods based on Type-I hybrid censored samples. For example, Kundu and Pradhan [14] for the generalized exponential distribution paramters; Lin et al. [15] for the Weibull distribution with a progressive hybrid censoring scheme; Cho et al. [16] for the estimate of Weibull distribution entropy with a generalized progressive hybrid censoring scheme; and Okasha and Mustafa [17] for the E-Bayesian estimation of rate parameter based on adaptive Type-I progressive hybrid censored sample from the Weibull distribution assuming the shape parameter as a constant. However, these four works do not deal with the life performance index.
The rest of this paper is organized as follows. In Section 2, a new life performance index is proposed and its properties are discussed. Section 3 introduces the parameter estimation methods based on a Type-I hybrid censored sample from the Weibull distribution by utilizing the maximum likelihood estimation and Bayesian inference methods. Section 4 reports the results of an intensive simulation study for the evaluation of two proposed estimation methods. Two real examples are illustrated in Section 5. Finally, some concluding remarks will be made in Section 6.
2. Proposed Life Performance Index
Let X be an asymmetrically distributed random variable that has a finite second moment. In this case, the mean, , in Equation (5) is less suitable to be the center representative for the distribution. A new life performance index is proposed and expressed by
where M is the median of X and
The relationship between the proposed and the is stated in Theorem 1.
Theorem 1.
For any distribution that has the finite second moment,
- (a)
- If , then .
- (b)
- If , then .
- (c)
- If , then .
The proof of Theorem 1 is addressed in Appendix A. Because the condition of
is difficult to hold for an asymmetric distribution, cannot easily be equal to . This fact indicates that when the lifetimes follow an asymmetric distribution, can better characterize the quality of lifetime products.
When X has the Weibull distribution with the probability density, cumulative distribution, survival, and quantile functions that are, respectively, expressed by
and
where , is the shape parameter and is scale parameter. With the wide range of shape parameter, , the Weibull distribution is a flexible and skewed one for lifetime modeling. The Weibull distribution has another form, which can be obtained via using reparameterization of . The probability density function of the Weibull distribution with parameters and was represented by Kundu [18] to be
3. Parameter Estimation Methods Based on Hybrid Censored Data
Let be independent random lifetimes from the Weibull distribution with the parameter . Denote as the order statistics of . The life test stops immediately when the rth ordered failed time is observed or the predetermined T is up. The realization of the failure time sample can be presented by , where
and m is the number of failure times by T. Let
Then, the Type-I hybrid censored sample can be expressed by , which contains repetitions of c. We only use one c in for simplification.
3.1. Maximum Likelihood Estimation
According to the expression of Kundu [19], the log-likelihood function can be expressed by
The partial derivatives of with respect to and can be derived as follows,
and
Let
and
Under the condition of , the maximum likelihood estimator (MLE), , of can be obtained by Equations (20) and (21),
and
where and
Since Equations (20) and (21) indicate the MLEs have no closed form, can only be obtained by using numerical method through R function optim to Equation (17). Replacing with in Equation (8), the MLE of is given by
where
and
The parametric bootstrap method with the following steps is suggested to obtain an approximate confidence interval of :
- Step 1:
- Step 2:
- Generate a new Type-I hybrid censored data from the Weibull distribution with parameter, , where is MLE of from Step 1.
- Step 3:
- Compute MLEs of and based on Type-I hybrid censored data and denote the obtained MLEs by and , respectively.
- Step 4:
- Repeat Step 2 to Step 3 times to obtain the bootstrap sample . Denote the empirical distribution based on the obtained bootstrap sample, by .
- Step 5:
- Given a significance level , find the th and th empirical quantiles of as the lower and upper limits of the confidence interval of , respectively.
3.2. Bayesian Estimation
Let the prior distribution of be the inverse Gamma, denoted by and the prior distribution of be a non-informative prior distribution, denoted by . Thus, the joint prior distribution of can be expressed by
where
and
Then, the joint posterior distribution of can be expressed by
where
Using Equation (29), we can obtain the conditional posterior distributions of given and of given , which are presented by
and
respectively. Notably, if we lack knowledge to set up the prior of , a non-informative prior distribution can be used for . Then, the joint posterior distribution of can be given by
where
Using Equation (32), we can derive the conditional post distributions of given and given by
and
respectively. Because the closed form of the marginal posterior distributions and (or and ) cannot be obtained, the Markov chain Monte Carlo (MCMC) approach with mixing Gibbs sampling technique and Metropolis–Hastings algorithm is used to obtain the Bayesian estimators. The implementation steps of the MCMC approach are presented as follows:
- Step 1:
- Give initial values and propose the transition probability distributions, and , where and are the updates of and for the next step.
- Step 2:
- Implement Step 3 for , where B is a huge number.
- Step 3:
- (a)
- Generate and , where is the uniform distribution over the interval . Update according to the condition,
- (b)
- Generate and . Update according to the condition:
- (c)
- Step 4:
- Remove the first Markov chains for the burn-in operation. Re-coding the Markov chains of , , and . Considering the squared loss function for Bayesian estimation, the Bayes estimates , and can be, respectively, obtained by the sample means of the Markov chains of and , .
The HPDI of can be obtained via using the following steps proposed by Chen and Shao [20].
- Step 1:
- Sorting to obtain an ordered sequence of by , where for . The ordered sequence of is used to construct the empirical distribution of the Bayes estimator .
- Step 2:
- Find all intervals of that are labeled by , , where is the largest integer smaller or equal to y.
- Step 3:
- Find the interval that has the shortest length among all intervals in Step 2. The obtained interval is the HPDI.
Similarly, if we consider that follows a non-informative prior distribution, the Bayes estimators of , and can be obtained through of using the above proposed MCMC approach with replacing by . The HPDI of can also be obtained by using the aforementioned steps proposed by Chen and Shao [20].
4. Simulation Study
Monte Carlo simulations were carried out to examine the performance of the MLEs and Bayes estimators of the model parameters and the proposed life performance index. In practical applications, one often evaluates the quality of lifetime products under a limited sample resource. It is important to evaluate the quality of the proposed maximum likelihood estimation method and Bayesian inference approach under small sample cases. In the simulation study, we consider using and 25 for the sample of size and using and 40 for the sample of size . Moreover, we use the parameters of and for the Weibull distribution. When , we consider using , and . When , we consider using , and . The Type-I hybrid censoring schemes can be obtained based on the aforementioned parameter information used for the simulation study. For each combination of parameters mentioned above, simulation study has been conducted for 5000 runs.
For each simulation run, the numbers of B = 10,000 and = 1000 are used to implement the MCMC for the Bayesian posterior distribution approximation and the number of is used for the bootstrap sampling distribution approximation of MLE estimator. Two HPDIs of for both Bayesian credible intervals and the bootstrap approximated confidence interval of for MLE are obtained at the confidence level of 0.95; that is, = 0.05. The Baysian point estimate is obtained by using the posterior mean under the squared error loss, and the MLE is obtained via a procedure described in Section 3.
The measures of relative bias (rBias) and relative mean squared error (rMSE) will be used to measure the accuracies of MLE and two Bayesian estimators. Assume the target parameter is and its estimator is , the rBias and rMSE can be defined, respectively, by
and
where Bias and MSE can be evaluated based on 5000 estimates, , by
and
respectively. Please note that the rBias and rMSE are scale-free measures. Meanwhile the coverage probability (coverage) of confidence or credible interval is evaluated as the percentage of intervals covering the true parameter based on 5000 simulation runs. All obtained simulation results of coverage listed in the most right side columns of Table 1 and Table 2 are for all the interval estimators of under study and the next three left columns contain rMSE and rBias for each point estimator, respectively. The symbols “Non-info.” and “Info.” in the tables denote the Bayesian estimation results through using a non-informative and informative prior distributions, respectively.

Table 1.
The rBias and rMSE (in parentheses) for .
Table 2.
The rBias and rMSE (in parentheses) for .
In scan of Table 1 and Table 2, we find that the rBias and rMSE for all parameters are decreased when the sample size and the number of failed products are increased. We also find that the values of rBias and rMSE of the MLE of are larger than those of the two Bayes estimators. The Bayesian approach outperforms the maximum likelihood estimation method in terms of rBias and rMSE. In summary, we can also find that the Bayesian approach using an informative prior distribution performs better than the Bayesian inference approach using a non-informative prior distribution. However, the users could not have knowledge to set up the hyper-parameters of the prior distribution. In practical applications, the Bayesian approach with an non-informative prior distribution can be used to infer the life performance index of for the Weibull distribution with a Type-I hybrid censoring scheme if the users do not have knowledge to set up the hyper-parameters of the prior distribution.
5. Examples
In this section, two examples from the literature will be provided for the illustrative purpose. Because no goodness-of-fit method is available for model fitting based on a Type-I hybrid censored sample. The data sets in two examples are complete samples. Firstly, we use Kolmogorov–Smirnov (K-S) testing method to confirm that these two data sets follow Weibull distributions. Then, reducing these two data sets into two Type-I hybrid censored samples to illustrate the applications of the proposed methods. The Type-I hybrid censoring scheme is a generalized scheme that includes the Type-I censoring and Type-II censoring schemes as special cases. Many lifetime applications, using a Type-I censoring scheme or Type-II censoring scheme to generate censored sample from a complete random one published, can be found in the literature. For example, Bain and Engelhardt [21] and Joarder et al. [22] presented data analysis based on a Type-I censored sample about 22 remission times of leukemia. The data set was collected through an experiment for 210 days scheme on a complete random sample published. Dodson [23] and Balakrishnan and Kateri [24] presented data analysis based on a Type-II censored sample about grinders testing, in which twenty grinders were tested and twelve failure times were observed. The Type-I hybrid censoring scheme can be a more efficient scheme for life testing to save testing time.
Example 1.
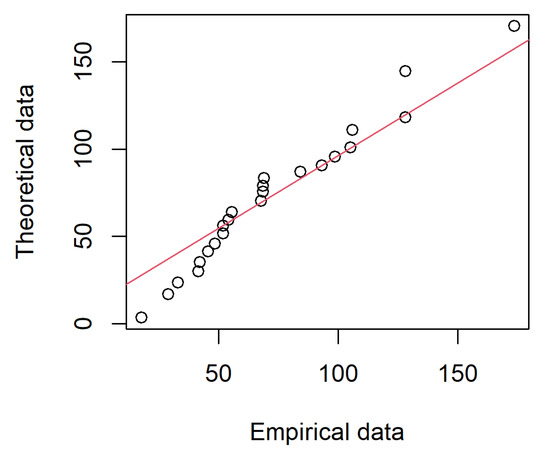
The example regarding the endurance of deep groove bearings in the life test is considered for illustrating the applications of the proposed estimation methods. This data set contains millions of revolutions before the failure of 23 ball bearings in the life test and is reported in Lieblein and Zelen [25] and listed in Table 3. Fatigue is a key factor which is highly related to the life of ball bearings. The experience of ball bearing manufacturers had led to relating the fatigue life L to the number of balls, ball diameter, number of rows, constant angle, and bearing load. L is the number of million revolutions that a specified percentage of bearing will fail to survive on account of fatigue causes. Using this complete random sample and K-S test to check the Weibull distribution modeling, the MLEs by utilizing R function optim is and , and the K-S test statistic for the data set is 0.17391. The corresponding p-value = 0.8775. The K-S testing results indicate that the Weibull distribution with and can well characterize this complete sample. Figure 1 is the quantile-to-quantile plot based on the complete sample of Example 1. In view of Figure 1, we see that the points form a line that is roughly straight. The quantile-to-quantile plot also shows that the Weibull distribution can well model the complete sample of Example 1.
Table 3.
The endurance life of deep groove ball bearings (in million revolutions) will fail to survive.
Figure 1.
The quantile-to-quantile plot based on the complete sample of Example 1.
The manufacturer wants to ensure the endurance yield of the deep groove ball bearing is 0.9975 with , and the target process performance index is . Assume that the manufacturer would like to save the test time and budget of the life testing, the Type-I hybrid censoring scheme can be a good option. Firstly, we can convert the current complete random sample to a Type-I hybrid censored sample. In this example, let and and 23. The hyper-parameters of and are used to set up the informative-prior Bayesian approaches. We would like to compare the estimation results based on the obtained Type-I hybrid censored sample via our proposed methods and based on the complete sample in Table 3 via the typical maximum likelihood estimation method. The estimation results by using the maximum likelihood estimation method with the complete sample can be a reference for performance comparison. If the likelihood function is complicated, it is known that the Bayesian estimation method outperforms typical maximum likelihood estimation method for small sample cases, the proposed Bayesian estimation method for the case of can be anther reference method because the sample is a Type-I censored sample.
The MLEs, Bayes estimates, and 95% confidence intervals of the model parameters and process performance index were obtained and given in Table 4. The MLEs based on complete sample are and , and . The Bayes estimates using non-informative prior distribution based on the Type-I censored sample are , , and . The Bayes estimates using informative prior distribution based on the Type-I censored sample are , , and . Moreover, it shows that the confidence interval widths obtained using the two proposed Bayesian methods in Table 4 are shorter than that based on the maximum likelihood estimation method. The HPDI with informative prior distribution has the shortest width among three confidence intervals. Overall, we conclude that the endurance quality of the produced deep groove ball bearings could not satisfy the requirement due to the lower bounds in two HPDIs are smaller than 1.67.
Table 4.
Estimation results based on Example 1 ( ball bearings and in million revolutions).
Example 2.
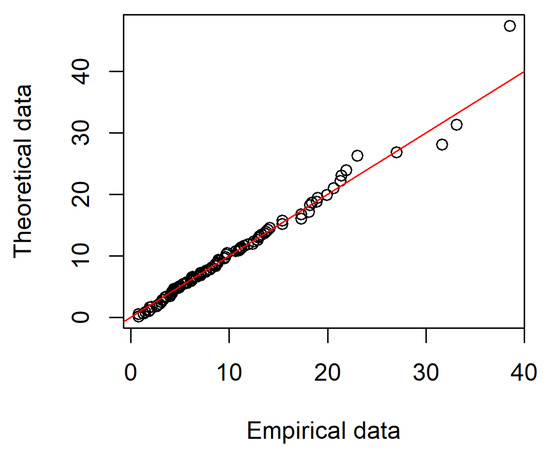
The data of the waiting time (in minutes) of 100 customers before receiving the service in the bank is used as second example. This data is the complete sample data with sample size n = 100 shown in Table 5, see Ghitany et al. [26]. The K-S test statistic with the MLEs and is 0.11. The corresponding p-value = 0.5806. The goodness-of-fit based on the K-S test indicates that the Weibull distribution with and can well model this complete sample. The quantile-to-quantile plot based on the complete sample of Example 2 is displayed by Figure 2. In view of Figure 2, we can find that Weibull distribution can well model the complete sample of Example 2.
Table 5.
Waiting time data of customers before receiving service in the bank (in minutes).
Figure 2.
The quantile-to-quantile plot based on the complete sample of Example 2.
Let . For the Weibull distribution with and , we can obtain as the target process performance index. Following the similar data transformation method for Example 1 to convert the complete sample in Table 5 into a Type-I hybrid censored sample with , and , and 100. The Type-I hybrid censored sample with is a Type-I censored sample. The hyper-parameters of and are considered for the informative prior distribution. The confidence level is set up at for interval estimation.
The obtained estimation results are reported in Table 6. From Table 6, we can see that the MLEs based on the complete sample in Table 5 are , , and . Because the sample size is large, the maximum likelihood estimation results based on the complete sample in Table 5 can be the benchmark, and we can find that the estimation results of the MLE and two proposed Bayesian methods based on the Type-I censoring sample (the case of ) are close to their benchmarks. When , the estimation results in Table 6 are close to that based on the case of . In view of the Type-I censoring scheme in the last row of Table 6, we can find that the point estimates based on two Bayesian methods are more close to their benchmarks than the maximum likelihood estimation results. Moreover, the widths of two HDPIs are shorter than the width of the corresponding confidence interval based on the maximum likelihood method. The Bayesian estimation results outperform the estimation results via using the maximum likelihood estimation method. Hence, the Type-I hybrid censoring scheme can help to save testing time, and the proposed Bayesian estimation methods can provide reliable estimation results.
Table 6.
The estimation results of Example 2 (n = 100 waiting times and T = 11 in minutes).
6. Conclusions and Remarks
A new life performance index for the Weibull distribution has been proposed, and the maximum likelihood estimation and Bayesian estimation methods have been applied to develop estimation procedures for based on Type-I hybrid censored samples. Point and interval estimation results have been obtained. The proposed life performance index was developed from the traditional life performance index by replacing the population mean with the population median, so that the proposed life performance index can also be applied to the lifetime data that follow a symmetric or asymmetric distribution.
Because no closed form available for the MLEs of the Weibull distribution parameters can be found under a Type-I hybrid censoring scheme. A numerical iterative procedure must be applied to obtained the MLEs for the model parameters and the proposed life performance index. The convergence of iterative procedure is sensitive to the initial inputs of two parameters. The Fisher information matrix under a Type-I hybrid censoring scheme is difficult to obtain due to the number of failures and the stopping time are random variables with unknown probability distribution. The observed Fisher information matrix is also less reliable. Therefore, a bootstrap procedure is proposed to find confidence interval for the MLE of the new life performance index.
The inverse Gamma distribution is used to obtain a conjugate informative prior for the scale parameter of Weibull distribution. However, there is no conjugate prior for the shape parameter that can be found. Therefore, a non-informative prior distribution is suggested for in this study. Two types of joint priors for and have been considered to implement Bayesian inference. Due to the analytic form of the posterior distribution of the model parameter is difficult to developed, the MCMC approach via using a hybrid Metropolis–Hastings algorithm and Gibbs sampling is established to draw sample from the posterior distribution to update parameter in the numerical computation procedure.
Three different estimators, the MLE and two Bayes estimators, for the target parameters have been evaluated, and the performance of the maximum likelihood estimation method and two Bayesian approaches has been evaluated through using Monte Carlo simulation method. Simulation results show that two Bayesian approaches outperform the maximum likelihood estimation method in terms of the performance metrics of rBias and rMSE. Moreover, the coverage probability of HPDI based on using two proposed Bayesian approaches outperforms the one obtained based on using the maximum likelihood estimation method and bootstrapping procedure. If users lack knowledge to set up the hyper-parameters in the prior distribution of the parameters, a non-informative prior distribution has been suggested to implement the Bayesian approach.
The Type-I hybrid censoring scheme could not produce any lifetime observation, , for highly reliable products. Hence, the maximum likelihood estimation results could not exist when no failure observed during the life testing. The proposed life performance index for the Weibull distribution could also be applied to any other widely used lifetime distributions. The current study focused on using the Type-I hybrid censoring scheme to save testing time and cost. The approximate confidence interval for the proposed life performance index by using Fisher information matrix could be available for other censoring competitive scheme. Meanwhile, the current proposed performance index could be improved by using nonparametric methods. All these topics are interesting and would be worth to investigate in the future.
Author Contributions
Conceptualization, T.-R.T. and Y.-J.H.; methodology, T.-R.T. and Y.L.; software, Y.-J.H. and T.-R.T.; validation, T.-R.T., J.-Y.C. and Y.L.; formal analysis, Y.L. and J.-Y.C.; investigation, T.-R.T., Y.L. and J.-Y.C.; resources, T.-R.T.; data curation, T.-R.T. and Y.-J.H.; writing—original draft preparation, J.-Y.C.; writing—review and editing, T.-R.T. and Y.L.; visualization, J.-Y.C.; supervision, T.-R.T., Y.L. and J.-Y.C.; project administration, T.-R.T.; funding acquisition, T.-R.T. All authors have read and agreed to the published version of the manuscript.
Funding
This research was funded by the Ministry of Science and Technology, Taiwan grant number MOST 110-2221-E-032-034-MY2.
Institutional Review Board Statement
Not applicable.
Informed Consent Statement
Not applicable.
Data Availability Statement
The data has been included in Section 5 of this article.
Acknowledgments
This study is supported by Ministry of Science and Technology, Taiwan MOST 110-2221-E-032-034-MY2. We thank you for the excellent suggestions from all reviewers to improve the quality of paper.
Conflicts of Interest
The authors declare no conflict of interest.
Appendix A. The Proof of Theorem 1
- (a)
- Based on the condition ofwe can obtain the inequality ofMinus at the two sides of Inequality (A2), we obtainInequality (A3) can be represented byDividing at the two sides of Inequality (A4), we can show thatThen we can obtain the condition ofThus,
- (b)
- Based on similar inference procedures as (a), it is easy to show thatThus,Using (A8) for Equation (A9), we can show that .(c) Based on similar inference procedures as (a), it is easy to show thatThus,Using (A10) for Equation (A11), we can show that .
References
- Juran, J.M. Juran’s Quality Control Handbook, 3rd ed.; McGraw-Hill: New York, NY, USA, 1974. [Google Scholar]
- Kane, V.E. Process capability indices. J. Qual. Technol. 1986, 18, 41–52. [Google Scholar] [CrossRef]
- Hsiang, T.C.; Taguchi, G. A tutorial on quality control and assurance-the Taguchi mthods. In Joint Meetings of the American Statistical Association; InASA Annual Meeting LA: Las Vegas, NV, USA, 1985; p. 188. [Google Scholar]
- Pearn, W.L.; Kotz, S.; Johnson, N.L. Distributional and inferential properties of process capability indices. J. Qual. Technol. 1992, 24, 216–231. [Google Scholar] [CrossRef]
- Montgomery, D.C. Introduction to Statistical Quality Control, 6th ed.; John Wiley and Sons: New York, NY, USA, 2013; pp. 374–375. [Google Scholar]
- Clements, J.A. Process capability calculations for non-normal distributions. Qual. Prog. 1989, 22, 95–100. [Google Scholar]
- Epstein, B. Truncated life tests in the exponential case. Ann. Math. Stat. 1954, 25, 555–564. [Google Scholar] [CrossRef]
- Childs, A.; Chandrasekar, B.; Balakrishnan, N.; Kundu, D. Exact likelihood inference based on Type-I and Type-II hybrid censored samples from the exponential distribution. Ann. Inst. Stat. Math. 2003, 55, 319–330. [Google Scholar] [CrossRef]
- Lee, W.C. Statistical testing for assessing lifetime performance index of the Rayleigh lifetime products. J. Chin. Inst. Ind. Eng. 2008, 25, 433–445. [Google Scholar] [CrossRef]
- Hong, C.W.; Wu, J.W.; Cheng, C.H. Computational procedure of performance assessment of lifetime index of businesses for the Pareto lifetime model with the right type II censored sample. Appl. Math. Comput. 2007, 184, 336–350. [Google Scholar] [CrossRef]
- Lee, W.C.; Wu, J.W.; Hong, C.W. Assessing the lifetime performance index of products with the exponential distribution under progressively type II right censored samples. J. Comput. Appl. Math. 2009, 231, 648–656. [Google Scholar] [CrossRef]
- Wu, S.F.; Lin, M.J. Computational testing algorithmic procedure of assessment for lifetime performance index of products with Weibull distribution under progressive type I interval censoring. J. Comput. Appl. Math. 2017, 311, 364–374. [Google Scholar] [CrossRef]
- Wang, Y.; He, S. Fisher information in censored data. Stat. Probab. Lett. 2005, 73, 199–206. [Google Scholar] [CrossRef]
- Kundu, D.; Pradhan, B. Estimating the parameters of the generalized exponential distribution in presence of hybrid censoring. Commun. Stat. Theory Methods 2009, 38, 2030–2041. [Google Scholar] [CrossRef]
- Lin, C.T.; Chou, C.C.; Huang, Y.L. Inference for the Weibull distribution with progressive hybrid censoring. Comput. Stat. Data Anal. 2012, 56, 451–467. [Google Scholar] [CrossRef]
- Cho, Y.; Sun, H.; Lee, K. Estimating the entropy of a Weibull distribution under generalized progressive hybrid censoring. Entropy 2015, 17, 102–122. [Google Scholar] [CrossRef]
- Okasha, H.; Mustafa, A. E-Bayesian estimation for the Weibull distribution under adaptive type-I progressive hybrid censored competing risks data. Entropy 2020, 22, 903. [Google Scholar] [CrossRef]
- Kundu, D. Bayesian inference and life testing plan for the Weibull distribution in presence of progressive censoring. Technometrics 2008, 50, 144–154. [Google Scholar] [CrossRef]
- Kundu, D. On hybrid censored Weibull distribution. J. Stat. Plan. Inference 2007, 137, 2127–2142. [Google Scholar] [CrossRef]
- Chen, M.H.; Shao, Q.M. Monte Carlo estimation of Bayesian credible and HPD intervals. J. Comput. Graph. Stat. 1999, 8, 69–92. [Google Scholar]
- Bain, L.J.; Engelhardt, M. Statistical Analysis of Reliability and Life-Testing Models; Marcel Dekker: New York, NY, USA, 1991. [Google Scholar]
- Joarder, A.; Krishna, H.; Kundu, D. Infrences on Weibull parameters with conventional type-I censoring. Comput. Stat. Data Anal. 2011, 55, 1–11. [Google Scholar] [CrossRef]
- Dodson, B. The Weibull Analysis Handbook, 2nd ed.; ASQ Quality Press: Milwaukee, WI, USA, 2006. [Google Scholar]
- Balakrishnan, N.; Kateri, M. On the maximum likelihood estimation of parameters of Weibull distribution based on complete and censored data. Stat. Probab. Lett. 2008, 55, 2971–2975. [Google Scholar] [CrossRef]
- Lieblein, J.; Zelen, M. Statistical investigation of the fatigue life of deep-groove ball bearings. J. Res. Natl. Bur. Stand. 1956, 57, 273–316. [Google Scholar] [CrossRef]
- Ghitany, M.E.; Atieh, B.; Nadarajah, S. Lindley distribution and its application. Math. Comput. Simul. 2008, 78, 493–506. [Google Scholar] [CrossRef]


Publisher’s Note: MDPI stays neutral with regard to jurisdictional claims in published maps and institutional affiliations. |
© 2022 by the authors. Licensee MDPI, Basel, Switzerland. This article is an open access article distributed under the terms and conditions of the Creative Commons Attribution (CC BY) license (https://creativecommons.org/licenses/by/4.0/).