Abstract
The sector of knowledge-intensive services is one of the fastest-growing sectors in the present-day economy of knowledge, which explains the scientific interest in developing methods of its quantitative assessment. The object of the research is the development of new approaches to the mathematical modeling of the efficiency of the regional knowledge-intensive services sector, based on a distance function approach to assess productivity changes. An approach was proposed to analyze the efficiency of this sector using data envelopment analysis and Malmquist productivity index and its components. The article presents the results of the assessment of indicators characterizing the development of knowledge-intensive services in education, innovation, and ICT obtained from 80 Russian regions for the period 2010–2020. To perform the analysis, the following input variables were used: volume of investments in fixed assets in ICT; share of personnel employed in the ICT; share of internal expenditures on R&D in GRP; the number of personnel engaged in R&D; share of innovative-active organizations and registered patents; funding for higher education institutions; and the number of higher education institutions graduated. Output variables were number of used advanced production technologies in the region; share of innovative goods, works, and services in GRP, and use of the intellectual property. As a result of applying the data envelopment analysis, Malmquist productivity index and its components, data were obtained on the positive dynamics of the development of the knowledge-intensive services sector in Russian regions and conclusions were drawn about the sector’s growth sources due to economies of scale.
1. Introduction
In today’s world, knowledge and information have become the main source of competitiveness and economic growth in countries and regions [1], where “knowledge economy” [2], and knowledge-intensive services and goods have come one of the leading sectors of the “new” economy of the 21st century [3]. Knowledge, as an essential component of a modern economy, has become a key asset within the service economy [4], much like fixed assets in traditional economies [5].
Knowledge-intensive services and goods (commonly known as KIS) form a special economic sector that produces and manages knowledge [6,7], increases the share of the knowledge value in GDP [8], and is the driver of future technological development [9,10]. Knowledge-intensive service activities are sources, facilitators, or carriers in innovation [11]. As sources of innovation, they initiate and develop innovation activities in organizations and regions; as facilitators, they support an organization in its innovation processes; and as carriers, they integrate and transfer existing knowledge amongst organizations [12].
The industries of knowledge-intensive services include service entities that incorporate advanced technologies in their services or service delivery such as commercially traded business, finance, and information services, services in research and development (R&D), consulting, accounting, legal services, information services, marketing related services, and information technology [12].
In developed economies, the growth rate of the knowledge-intensive services sector outstrips the growth rates of the primary and secondary sectors, and its development in the quaternary sector has a significant impact on the economic growth of countries [13].
The importance of this sector is determined by its scale and growth rates. The growth multiplier of the sector is a few times greater than the growth in traditional sectors of the economy, and by 2020, the knowledge-intensive services sector had become comparable in its contribution to GDP to commodity sectors [14,15].
Education, innovation, and ICT, which form a knowledge-intensive services segment, today have the greatest innovative potential and are the driving forces of economic growth in general. The quality of education of the population, effective mechanisms for the transfer of innovations, and the level of digital technologies implementation largely determine the efficiency of economic development in the context of the “knowledge economy”.
The “knowledge intensity” of knowledge-intensive services renders them “centers of value added” [16]. Today, they are critical to knowledge dissemination and economic growth.
Investments in the knowledge-intensive services sector in this context are an effective tool for influencing economic growth, necessitating the study of planning and regulation of the processes of developing markets for intellectual goods and services.
Since knowledge-intensive services play an important role in the regional economy as sources of competitive advantages and provide a contribution to economic growth, the formation, development, and stimulation of the knowledge-intensive services sector in the modern economy have become priority tasks, and the knowledge-intensive services sector should be considered as one of the factors for the further increase in innovation and the formation of the “knowledge economy”.
The share of knowledge-intensive services sectors in the economy can be viewed as an indicator of the economy’s ability to assimilate new knowledge and stimulate innovation and growth.
Managing the effective development of the knowledge-intensive services sector is an important task of economic policy in all countries. The conditions for their formation and the potential for development are of interest from a theoretical, methodological, and practical point of view. Therefore, the study of the specifics of the development of the knowledge-intensive services sector is of high scientific value; it is necessary to develop tools for assessing the level of development of these segments of the economy, their dynamics, and the structural changes occurring in them.
The importance of the knowledge-intensive services sector as the most essential driver of the country’s economic development determines the need for the diagnostics of development to justify its regulation policy. It is necessary to draw conclusions about the directions of the development of Russian regions in terms of the development of the knowledge-intensive services sector. An important task of our study was also to identify indicators that can be influenced to ensure the growth of the knowledge-intensive services sector from the perspective of subsequent monitoring and public administration.
The objective of this study was the application of the data envelopment analysis (DEA) and Malmquist productivity index and its components to assess the dynamics of the development of the knowledge-intensive services sector.
This article presents the analysis methods and results of assessing the dynamics of statistical indicators characterizing the development of knowledge-intensive services based on data obtained from 80 Russian regions for the period from 2010 to 2020.
The main research question was to characterize the dynamics of knowledge-intensive services in the education, innovation, and ICT sectors as a basic segment of knowledge generation and disseminating as well as to identify Russian regions, demonstrating the more intensive development of the sector and describe the factors that have led to structural changes over the last 10 years.
The purpose of this paper is to expand the use of mathematical models and methods based on DEA to assess the development of the knowledge-intensive services sector and identify trends in the efficiency of its development in Russian regions.
The study tests the following hypotheses:
Hypothesis 1 (H1).
Knowledge-intensive services sector demonstrates a positive change in its efficiency in Russian regions as a whole for the period from 2014–2020.
Hypothesis 2 (H2).
The growth of the knowledge-intensive services sector is extensive and driven by scale efficiency change.
Hypothesis 3 (H3).
The efficiency of the knowledge-intensive services sector aligns in the Russian regions.
To achieve the research objectives, the following tasks were accomplished:
- -
- methodological approaches to the analysis of the dynamics of knowledge-intensive services were defined and assessment tools developed on the basis of DEA models;
- -
- relevant indicators were sampled to estimate input and output variables characterizing the development of knowledge-intensive services in Russian regions;
- -
- the calculation of quantitative performance indicators based on the Malmquist productivity index was carried out to evaluate the dynamics of knowledge-intensive services over two periods; and
- -
- the analysis of modeling results was conducted to determine best practices and directions of balanced development of knowledge-intensive services in Russian regions.
The novelty and the academic contribution of the research compared to existing studies [17,18,19,20] are that we have deepened the analysis of knowledge-intensive services based on the DEA model by extending the assessment factors and the component-specific decomposition of the Malmquist index, which allowed us to reach new conclusions regarding the increase/decrease efficiency of the sector in the regional economies.
The research strategy includes the definition of relevant indicators and periods to assess knowledge-intensive services, pre-processing of regional data, application of DEA models, calculation of the Malmquist index and its components, creation of a regional efficiency rating for different periods as well as conducting cartographic analysis to determine the spatial balance of development of knowledge-intensive services in Russian regions.
The present work is organized as follows. The main research purposes and problems are posed in the Introduction. The theoretical framework and literature review are presented in Section 2. Section 3 introduces the methodology of the research, describes the data, variables, materials, and methods. Section 4 illustrates the empirical results. Finally, Section 5 provides a discussion on the results and their main implications.
2. Theoretical Framework and Literature Review
The sector of knowledge-intensive services is one of the pioneering areas of scientific development because the sector is relatively new, having only emerged about 30 years ago. The tradition of identifying this sector originated in the general field of research of post-industrial society, where the service sector began to play a leading role.
The study of the sectors of the knowledge-intensive services is based on the use of a symbiosis of complementary basic theories of the development of economic systems: the sectoral model, evolutionary, and institutional approaches to the development of regional innovative systems as well as the knowledge economy and the paradigm of post-industrial development. Within the framework of these approaches, the role of knowledge-intensive sectors in ensuring the acceleration of economic growth is substantiated.
In the framework of the three-sector model developed by Fischer, Clarke, and Fourastier, in the modern tendencies of post-industrialization, the fourth sector stands out, which is represented to a large extent by knowledge-intensive services [21,22,23].
Additionally, this topic is considered from the perspective of the theory of “knowledge economy”. Machlup first turned to the problem of knowledge research as a key element of modern economic development [2]. According to his approach, in the knowledge economy, the sphere of creating new knowledge is formed by fundamental and applied science, higher education, the innovation system, the patent system, research, and development. In the development of this idea, various concepts of the “knowledge economy” and approaches to its study were formed. Nelson and Phelps created one of the first models of economic growth based on the dissemination of knowledge [24].
The starting point for the formation of the “knowledge economy” can be considered to be 1991, when the volume of investments in information technologies for the first time exceeded the number of investments in production technologies [25].
The first discussion of knowledge-intensive services sector on the European Commission level was made in 1995 in the report “Knowledge-Intensive Business Services: Users, Carriers, and Sources of Innovation”, where it was called the Cinderella sector, which, with the growing role of the service sector in the modern economy and the contribution that this sector makes to innovation and competitiveness, remains poorly understood [26].
Today, this sector is characterized by a steady increase in the added value of intellectual work and knowledge-intensive services [27] and a traditionally high level of employment of highly skilled personnel [28]. Since the actors of the intellectual service sector cooperate mainly with companies from other sectors [29] through the mechanisms of the innovation spillover, their activities influence the whole economy [30], contributing to the progress in the knowledge-intensive economy.
The industry of knowledge-intensive services is the market of professional knowledge [31], which requires cognitive and creative abilities and relevant professional knowledge. Miles I. defined the sector of knowledge-intensive services as services that “involve economic activities which are intended to create, accumulate, or disseminate knowledge” [32].
The studies of knowledge-intensive services in the “knowledge economy”, the analysis of their role in the post-industrial economy are fairly multifaceted and comprehensive in modern research [33,34,35,36]. The theoretical and methodological basis of the knowledge-intensive services sector study and the detailed classification by functional purpose is implemented in [37].
Defining boundaries and segmenting knowledge-intensive services markets is currently a research issue under discussion. This includes professional business services, accounting and auditing, legal advice, recruitment, marketing services, technology, computer and engineering services, industrial design, architecture, and some other business services [38]. In addition to traditional business services, knowledge-intensive services include R&D activities, vocational education, commercialization of scientific products, property valuation, and publishing activities, and information-communication services [39].
There is a special segment of knowledge-intensive services, knowledge-intensive service activity (KISA), which is a complex of scientific, technological, organizational, financial, and commercial activities, aimed at commercializing accumulated knowledge, technology and equipment, and creating, implementing, and disseminating innovations [40]. Education, information technology, and innovation are the main sectors of this activity.
In our study, we considered problems in the development of knowledge-intensive service activity as a basic sector of knowledge generation in knowledge-intensive services. This sector implements an innovative process through the education and training of highly qualified personnel, innovation generation, commercialization, while vertical and horizontal spatial diffusion of innovation as well as spillover effects influence the associated innovation development processes and the regional economy [41].
These segments of the knowledge-intensive services sector are in the zone of active economic policy of the state and are flexibly regulated through the mechanisms of public spending and indirect incentive measures. The synergistic effect of interaction between education, ICT, and innovation in regional economies led to the growth of the knowledge economy. It is also important in the sector of knowledge-intensive services that there are objective statistics on financing from different sources and forms of ownership, information on the number of employees, and measurable quantitative results of operation, which increase the practical value of the findings of their evaluation.
To analyze the effectiveness of knowledge-intensive services, we propose using the DEA tool and the calculation of the Malmquist index. The application of the DEA methodology to the study of the efficiency of economic systems [42,43,44,45], innovative development and economic policies [46,47,48,49,50,51], and environmental management [52] has long been studied. An important issue discussed is the specificities of the DEA models with different sets of indicators that characterize certain aspects being studied. A detailed overview of input and output variables selected for analysis used by various authors in the “knowledge economy” study for DEA knowledge-intensive sector modeling is given in [8] and [53].
The large-scale study [54] on the assessment of research and innovation potential in 28 European Union countries for 2010–2015 used a super-efficient non-oriented non-radial slack-based DEA model of available R&D indicators (five input indicators and two output indicators). Input variables were R&D expenditure in the higher education and the business enterprise sector as % of GDP, human labor indicators as total researchers, human resources in science and technology as % of active population, and share of employment in service-intensive sectors. Output indicators were high-tech export as % of total export and the number of scientific publications. The results of the study consist in assessing the development of the EU innovation sector and identifying the groups of countries that are the best in terms of efficiency and trends in their efficiency changes. It is notable that the results also failed to confirm that countries with a high R&D intensity attain a high R&D efficiency.
The influence of knowledge-intensive specialization on total factor productivity (TFP) based on the data from 248 regions of the European Union at NUTS-2 level for the period 2014–2016 using the multiplicatively-complete Färe–Primont index was estimated in [8]. To calculate TFP, a set of factors was used, consisting of two inputs (employment in thousand hours worked and gross fixed capital formation) and one output (gross domestic product). Some conclusions have been drawn regarding TFP trends in EU regions and uneven distribution of employment in high-tech manufacturing and knowledge-intensive services in the EU regional space as well as the positive impact of knowledge-intensive specialization on TFP and its spillover from nearby regions.
A two-stage DEA model to evaluate the relative efficiency of knowledge innovation processes in the period of 2004–2010 in 19 EU countries, with a particular focus on differences between the old European Union countries and V4 (Visegrad group) countries was used in [55]. Knowledge innovation processes were divided into two essential sub-processes, knowledge production process, and knowledge commercialization process. Inputs in the knowledge production and commercialization process are a number of scientists and researchers employed full time, R&D expenditures of private and public sector and accumulated “knowledge stock” as the capitalized R&D expenditures with using of a perpetual inventory method, labor force out of the R&D, and accumulated “knowledge stock” in the process of commercialization. Outputs from the knowledge production and commercialization process are international scientific papers, the number of patents, added value of industries, and the export of new products in high-tech industries. The DEA assessment results show that the majority of analyzed countries reach higher relative innovation efficiency in knowledge commercialization than in knowledge production, and the most important slacks can be found in the financing of R&D. It is noteworthy that according to the data [56], for the Russian environment, the regional analysis showed a higher potential of knowledge producing and patenting than commercializing.
The estimation of the efficiency of knowledge-intensive business services on the level of 1.674 small- and medium-sized companies in Italy over the period from 2012 to 2017 was carried out in [57] by relying on the DEA-based Malmquist productivity index, which was decomposed into two components: efficiency change and technical change index. The results allowed us to determine the regions with increase or decrease in the Malmquist productivity index and arrive at the conclusion that the technological change component, as a measure of innovation, strongly limits the productivity growth behavior of knowledge intensive business industry for all Italian regions.
The growth of efficiency in technological innovation in nine highly patent-intensive industries in China for the period of 2004–2013 was identified in [58] based on the DEA-Malmquist index method. By decomposing the Malmquist index of the technological innovation efficiency of highly patent-intensive industries, we can see that level of technological efficiency change is the main factor affecting the technological innovation efficiency in patent-intensive industries.
Individual elements of knowledge-intensive services and relative efficiency of the R&D process across a group of 22 developed and developing countries were analyzed in [59], where R&D technical efficiency was estimated based on CRS and VRS models of DEA. Gross domestic expenditure on R&D and the number of researchers are inputs, and patents granted to residents are outputs. The inefficiency in the R&D resource usage highlighted by this study indicates the underlying potential that can be tapped for the development and economic growth.
A detailed assessment of the technical and scale efficiencies of the knowledge-intensive services sector based on the data from the countries of the Association of South East Asian Nations for the period 1995–2010 is given in [53]. These empirical studies used the R&D expenditure, foreign direct investment inflows, trade openness, and education expenditure as input variables, while real GDP growth, high-tech exports as a percentage of total manufacturing exports, computer users, patents, and scientific and technical journal articles have been commonly considered as output variables for assessing the performance of a country’s knowledge economy.
In general, it can be noted that there is not a large number of publications on the evaluation of the dynamics of the knowledge-intensive services sector. Despite the rate of growth and its significance for future development, research publications in this sector are rather scattered and fragmented. The existing papers have mainly used specific DEA models for variables available in the official statistics of regions and countries and described the performance of certain segments of the knowledge-intensive sector. Most of the studies are consistent with the main indicators of the knowledge-based sector.
We also used a number of the previously considered indicators, taking into account the specifics of the scientific field and patenting procedures in Russia as well as the national statistics, which influence the choice of variables for the analysis.
The present study continues the scientific discussion on the development of knowledge-intensive economics and the effectiveness of spatial development in Russian regions, contributing to the development of the DEA methodology. No such studies have been conducted for Russian regions. The study makes an academic contribution to the search for analysis tools for the dynamic structural shifts in the knowledge-intensive services sector in the data of Russian regions to identify regional technology and innovation policy measures.
3. Methodology
3.1. Data
Relevant indicators for assessing the dynamics of the knowledge-intensive services sector are indicators characterizing it in the areas of education, innovation, and ICT. The choice of indicators is largely due to their availability in open statistics. To assess the dynamics of the development of knowledge-intensive services, we defined input and output variables for these sectors.
The following indicators were identified as inputs:
1. ICT sector:
- ICT investment, ths rub.—volume of investments in fixed assets aimed at the acquisition of ICT in the region; and
- ICT personnel, %—share of people employed in the ICT sector in the total employed population in the region.
2. R&D and innovations:
- R&D finance in GRP, %—share of internal expenditures on research and development in GRP;
- R&D personnel—number of personnel engaged in research and development, pers. per 10,000 employed in the regional economy;
- Innovative activity, %—share of organizations, implementing technological, organizational, and marketing innovations in the total number of surveyed organizations in the region; and
- Registered patents, 100 unit—registered and issued patents as a result of intellectual activity.
3. Education:
- HEI finance, mln rub.—amount of funding for educational institutions of higher education; and
- HEI graduates, ths pers.—number of bachelors, specialists, and masters who graduated from higher education institutions, pers.
The following indicators were also identified as outputs:
- Used of advanced technologies, ths units—number of used advanced production technologies in the region;
- Innovative goods in GRP, %—share of innovative goods, works, and services in the total volume of goods shipped, works performed, services rendered; and
- Use of intellectual property, 100 units—used patents as intellectual property.
The effects of the interaction among inputs will occur in a few years, when investment in education, innovation, ICT, and the human capital involved start to create value added and increase the share of knowledge-intensive services in the regional economy. In our study, we assumed that input variables are transformed into the resulting output variables with a time lag of four years. Thus, input variables of 2010, 2013, and 2016 changed output variables in 2014, 2017, and 2020 (Figure 1). Therefore, to analyze the dynamics and calculate the Malmquist index, two periods were singled out and the resulting indicators were calculated for two periods: 2014–2017 and 2017–2020.
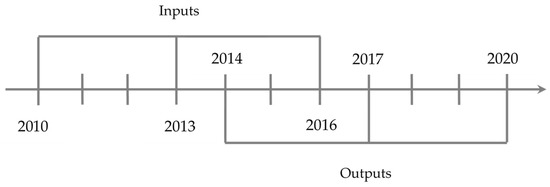
Figure 1.
Scheme of time lags in assessing the effectiveness and dynamics of the development of knowledge-intensive services sector.
3.2. Materials and Methods
Econometric methods have traditionally been used to construct frontier function as a method of estimating efficiency. DEA methods represent an alternative approach to solving the multi-factor problem of assessing efficiency in the input–output space. Efficiency in this case assumes an assessment of the ratio of the total beneficial effect of the object’s activity to the resources expended in the course of this activity. The purpose of applying DEA is to construct a piecewise linear function is that all of the objects under consideration in the feature space will be located to the right or above the resulting boundary. The frontier estimation uses linear programming methods. Objects with minimal inputs, which produce the maximum economic output, are considered efficient.
The methodology provides a composite index of relative effectiveness, taking into account a variety of factors. The advantages of this approach include the possibility of using heterogeneous factors and they do not need to be normalized. An important feature of DEA is the absence of a priori postulation of the type of function that sets the boundary. The DEA-based integrated assessment of capacity dynamics is a universal tool for assessing complex meso-level socio-economic facilities.
Nowadays, various modifications of DEA models are applied including input-oriented and output-oriented, constant return to scale (CRS) [60] and variable return to scale (VRS) [61], technical, and scale efficiency [62]. The Malmquist index is used on panel data to calculate total factor productivity (TFP) change. To assess the efficiency of objects in dynamics, the Malmquist Index was used, which evaluates the regression or progress of efficiency.
The total factor productivity (TFP) using the Malmquist index was calculated as the geometric mean between the coefficients showing changes in the input and output variables from the previous period relative to its production function at times t and t + 1. The peculiarity of the DEA method based on the Malmquist index, as opposed to independent effectiveness evaluation at time t and time t + 1, is that it also takes into account the change in the efficiency boundary itself between these periods.
Consider a set consisting of N objects called decision-making units (DMU), whose performance will be evaluated by the DEA-based method. Each DMU, i = 1,…, N, is represented by a set of P input variables and R output variables. The corresponding input values xi are a vector of dimension P, and the output values yi are a vector of dimension Q, where i = 1,…, N. Thus, we can obtain input matrix X of dimension NxP and output matrix Y of dimension NxQ for each DMU. Let Xt be inputs at time t, and Yt be outputs at time t, t = 1,…, T.
Let us consider production technology Ft for a DMU at time t:
Define the output distance function [63] as:
The distance function is used to measure efficiency over a period t, and can be represented as the reciprocal of output-oriented efficiency measure [64]. In this case, output-oriented measures are used.
The Malmquist productivity change index in the DEA model between period t and period (t + 1) is [65]:
MI0 can be represented as the geometric mean of relative productivity changes from t to (t + 1).
To calculate we need to find four components of the distance functions. At this stage, it is required to solve the following linear programming problems:
Tasks (2)–(5) must be solved for DMUi, i = 1,…, N. Hence for N DMUs and T periods, there are linear programming problems. As a result, the Malmquist productivity change index can be tabulated in DMU space or time space, and this provides the summary measures used for calculating. If there is a performance improvement from period t to t + 1, MI takes on values greater than 1. The values MI < 1 or MI = 1 indicate a decrease or constancy in DMU efficiency during the study period.
Using identity transformations, the following expression for a given index can be obtained from (1):
In (6), the EC index reflects the change in technical efficiency and shows whether the DMU is getting closer to its efficiency frontier. TC index reflects the technological change, which is the geometric mean of two ratios and characterizes the shift in the potential frontier in time (the impact of scientific and technological progress). If TC > 1, this is interpreted as the presence of technical progress.
The technical efficiency change can be decomposed using CRS and VRS DEA frontiers [66]:
where
Scale efficiency change measures the degree to which a DMU becomes closer to its most productive scale size from period t to t + 1. Pure technical efficiency change PE is relative to a variable return to scale model.
The considered index-based approach allowed us to assess the main sources of productivity changes. To identify the main source of efficiency changes, the obtained indices can be compared. In the case of PE > SE, the increase in pure technical efficiency should be indicated as the main source of efficiency change. In the case of PE < SE, the main source of efficiency is gained in the efficiency of scale.
4. Results
We tested the proposed model on the data on the development of knowledge-intensive services in Russian regions. When forming the list of DMUs, the DEA model took into account those constituent entities of the Russian Federation for which the figures on the formed list of indicators are provided in official statistical sources. These regions can have a significant influence on the location of the border.
The DEA model to analyze the dynamics of the development of the knowledge-intensive services sector included eight input and three output variables, and 66 out of 80 Russian regions were considered as DMU. The data according to these indicators and the lag model were derived from official open sources for regional statistics for 2010–2020 [67].
Descriptive statistics on knowledge-intensive services sector indicators for the selected regions are presented in Table 1, which illustrates the great variability of the data and confirms its uneven development at the regional level.

Table 1.
Descriptive statistics of DEA model variables.
In the process of applying DEA models based on the Malmquist index, reflecting the dynamics of technological progress, the regions were compared in efficiency with each other and with themselves at different times.
At the first stage of the study, the values of the Malmquist index and its components were calculated for the two periods of 2014–2017 and 2017–2020 (Table 2).
Table 2.
Malmquist productivity index for Russian regions (2014–2017 and 2017–2020).
The composition of the leading regions, in accordance with the values of the Malmquist index MI ≥ 1, changed significantly over the two periods studied. Traditional regional leaders in the knowledge-intensive services sector showed relatively low MI values. However, this does not mean that the output of these regions is reduced. These structural shifts are largely due to the fact that in the period 2017–2020, individual regions experienced an increase in output values, with the input ones remaining at the level of the previous period. However, there was a general trend toward an increase in the number of regions, which demonstrates an increase in the efficiency in the development of the knowledge-intensive services sector (Table 3). In the period from 2017 to 2020, the number of regions with a positive development performance of knowledge-intensive services increased by 22.73% compared to the period from 2014 to 2017. This supports the H1 hypothesis of positive growth in knowledge-intensive services as a whole in Russia.
Table 3.
Structural changes in the dynamics of the efficiency of regional development.
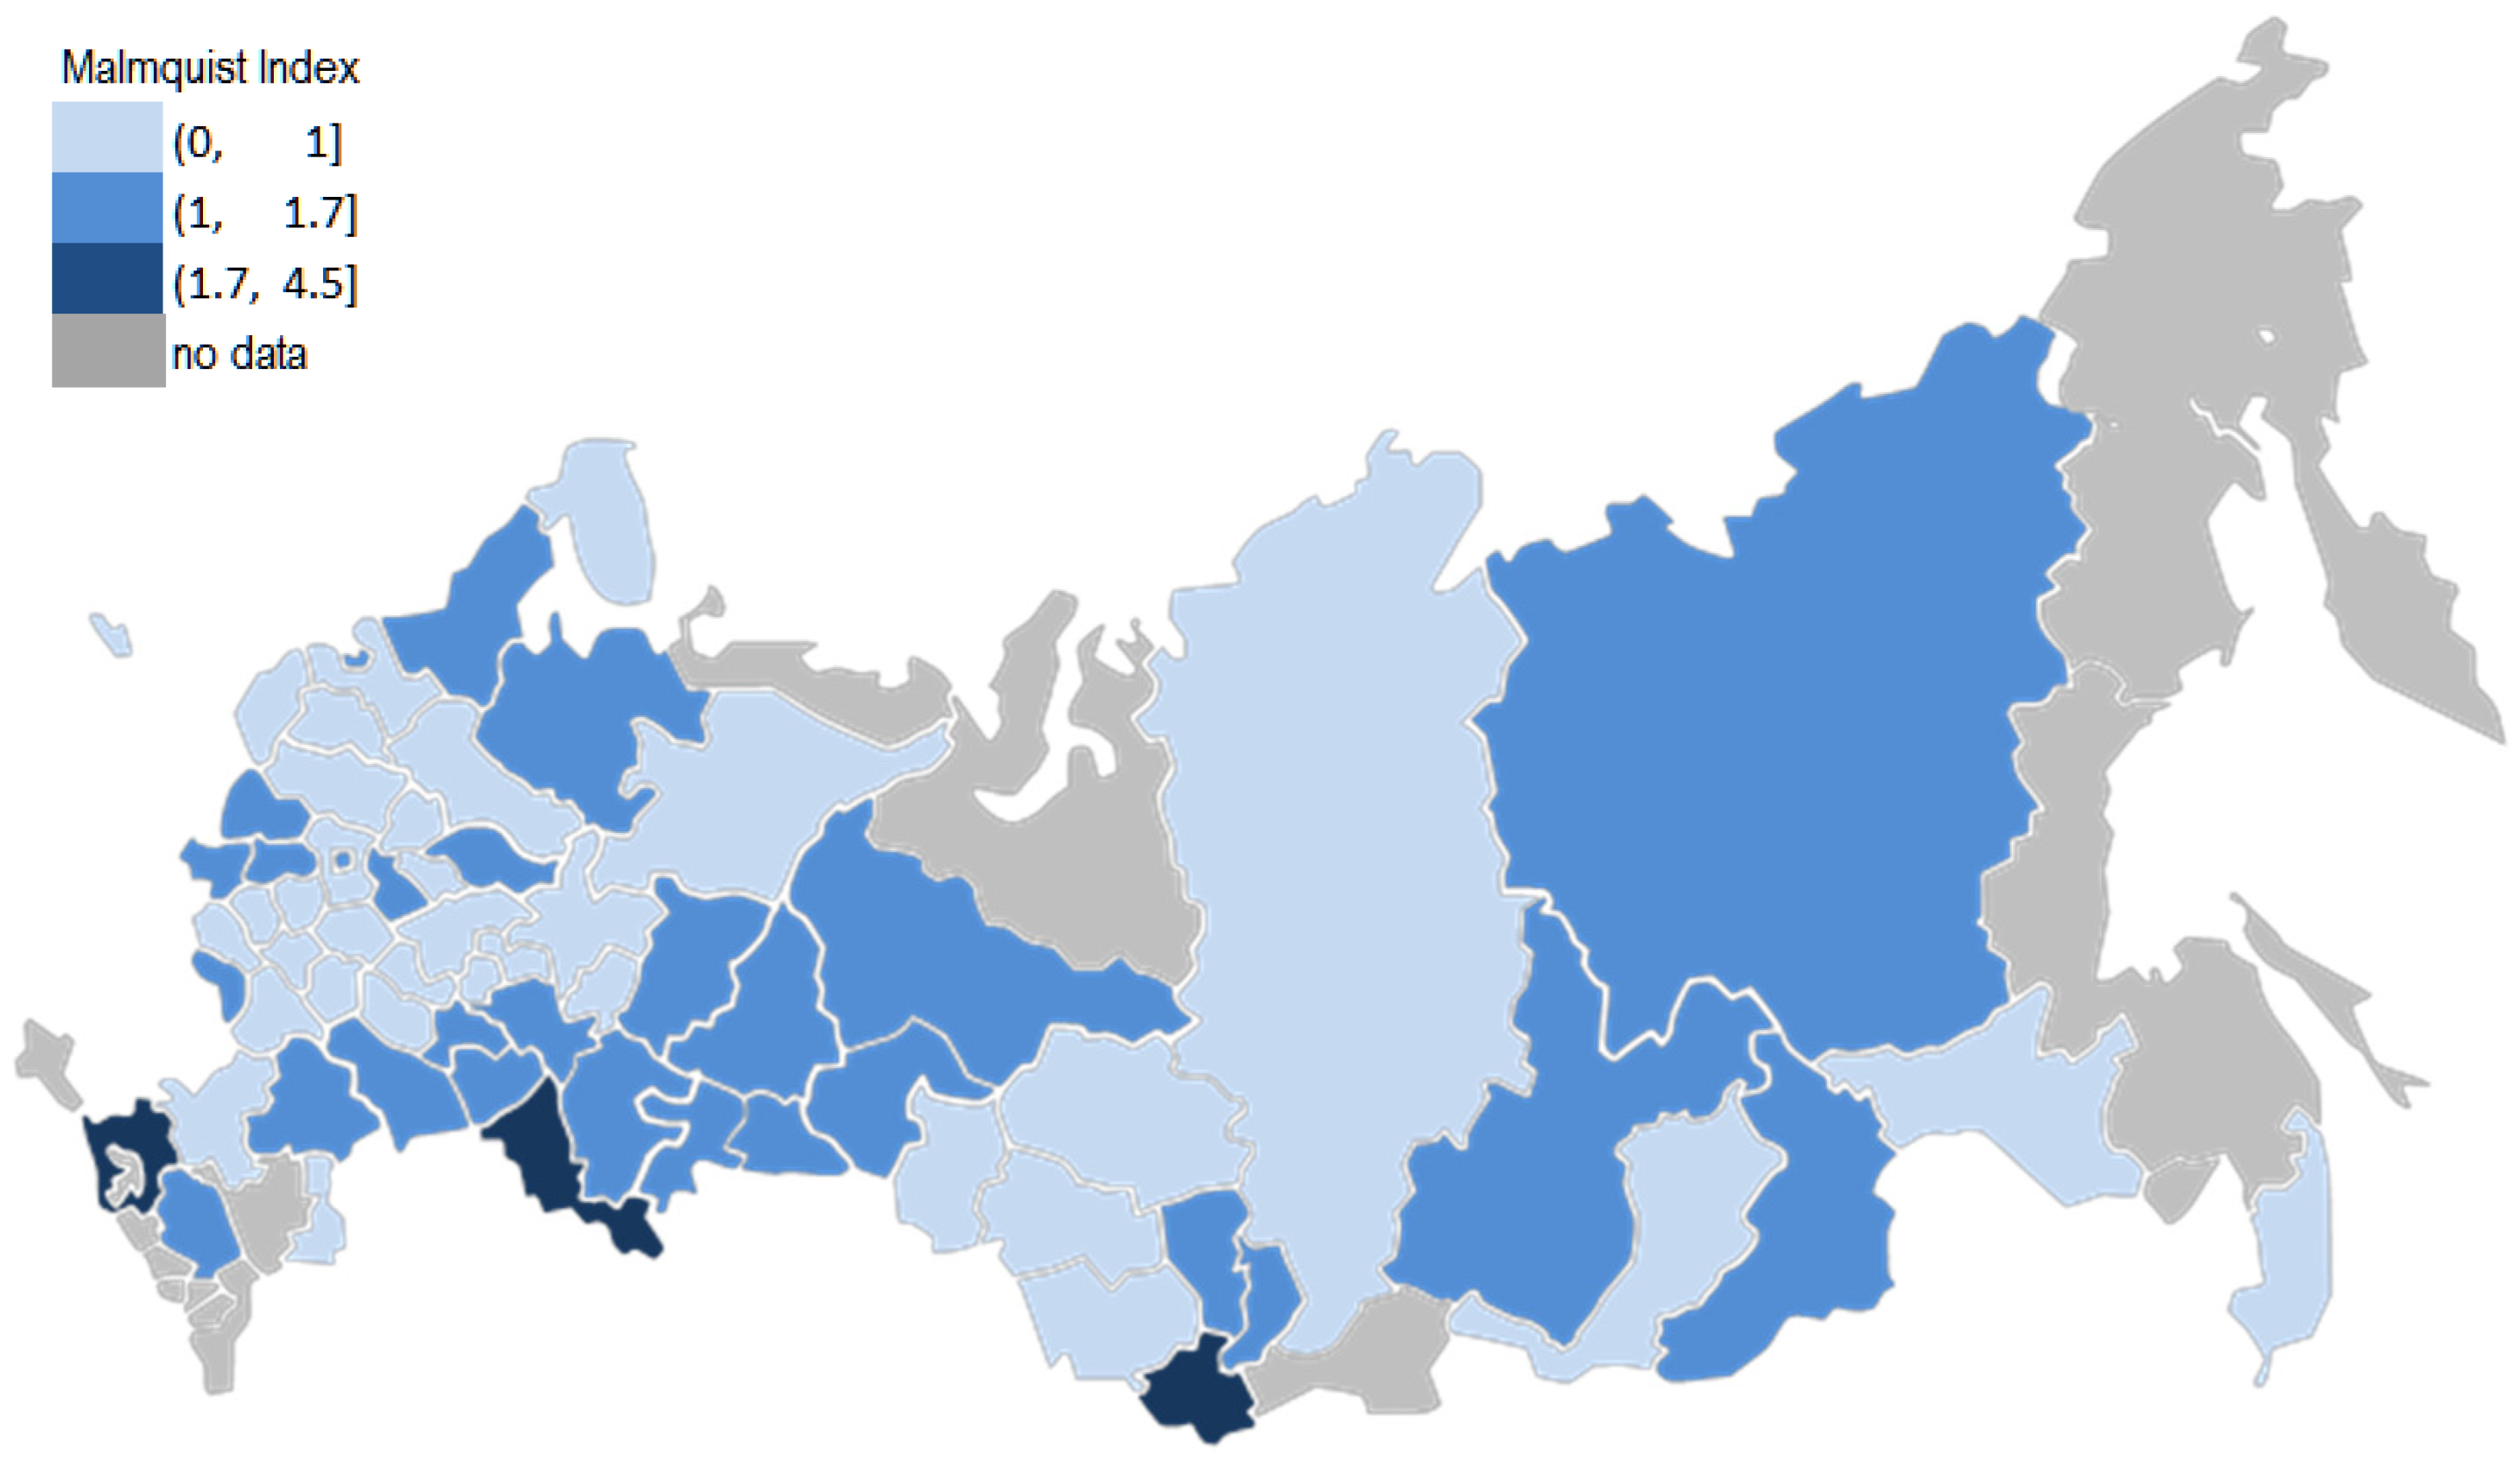
Figure 2 describes the distribution of regions by the level of the knowledge-intensive services sector efficiency from 2014 to 2017. Figure 3 shows the Malmquist index by regions of Russia from 2017 to 2020.
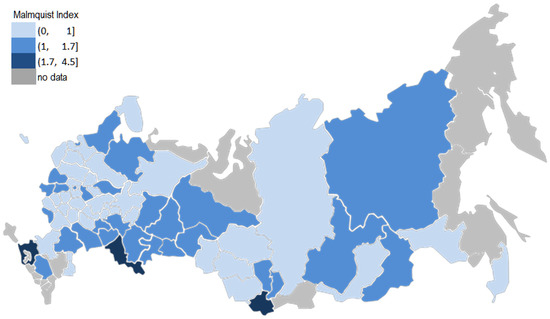
Figure 2.
Schematic map of Russian regions by the Malmquist index, 2014–2017.

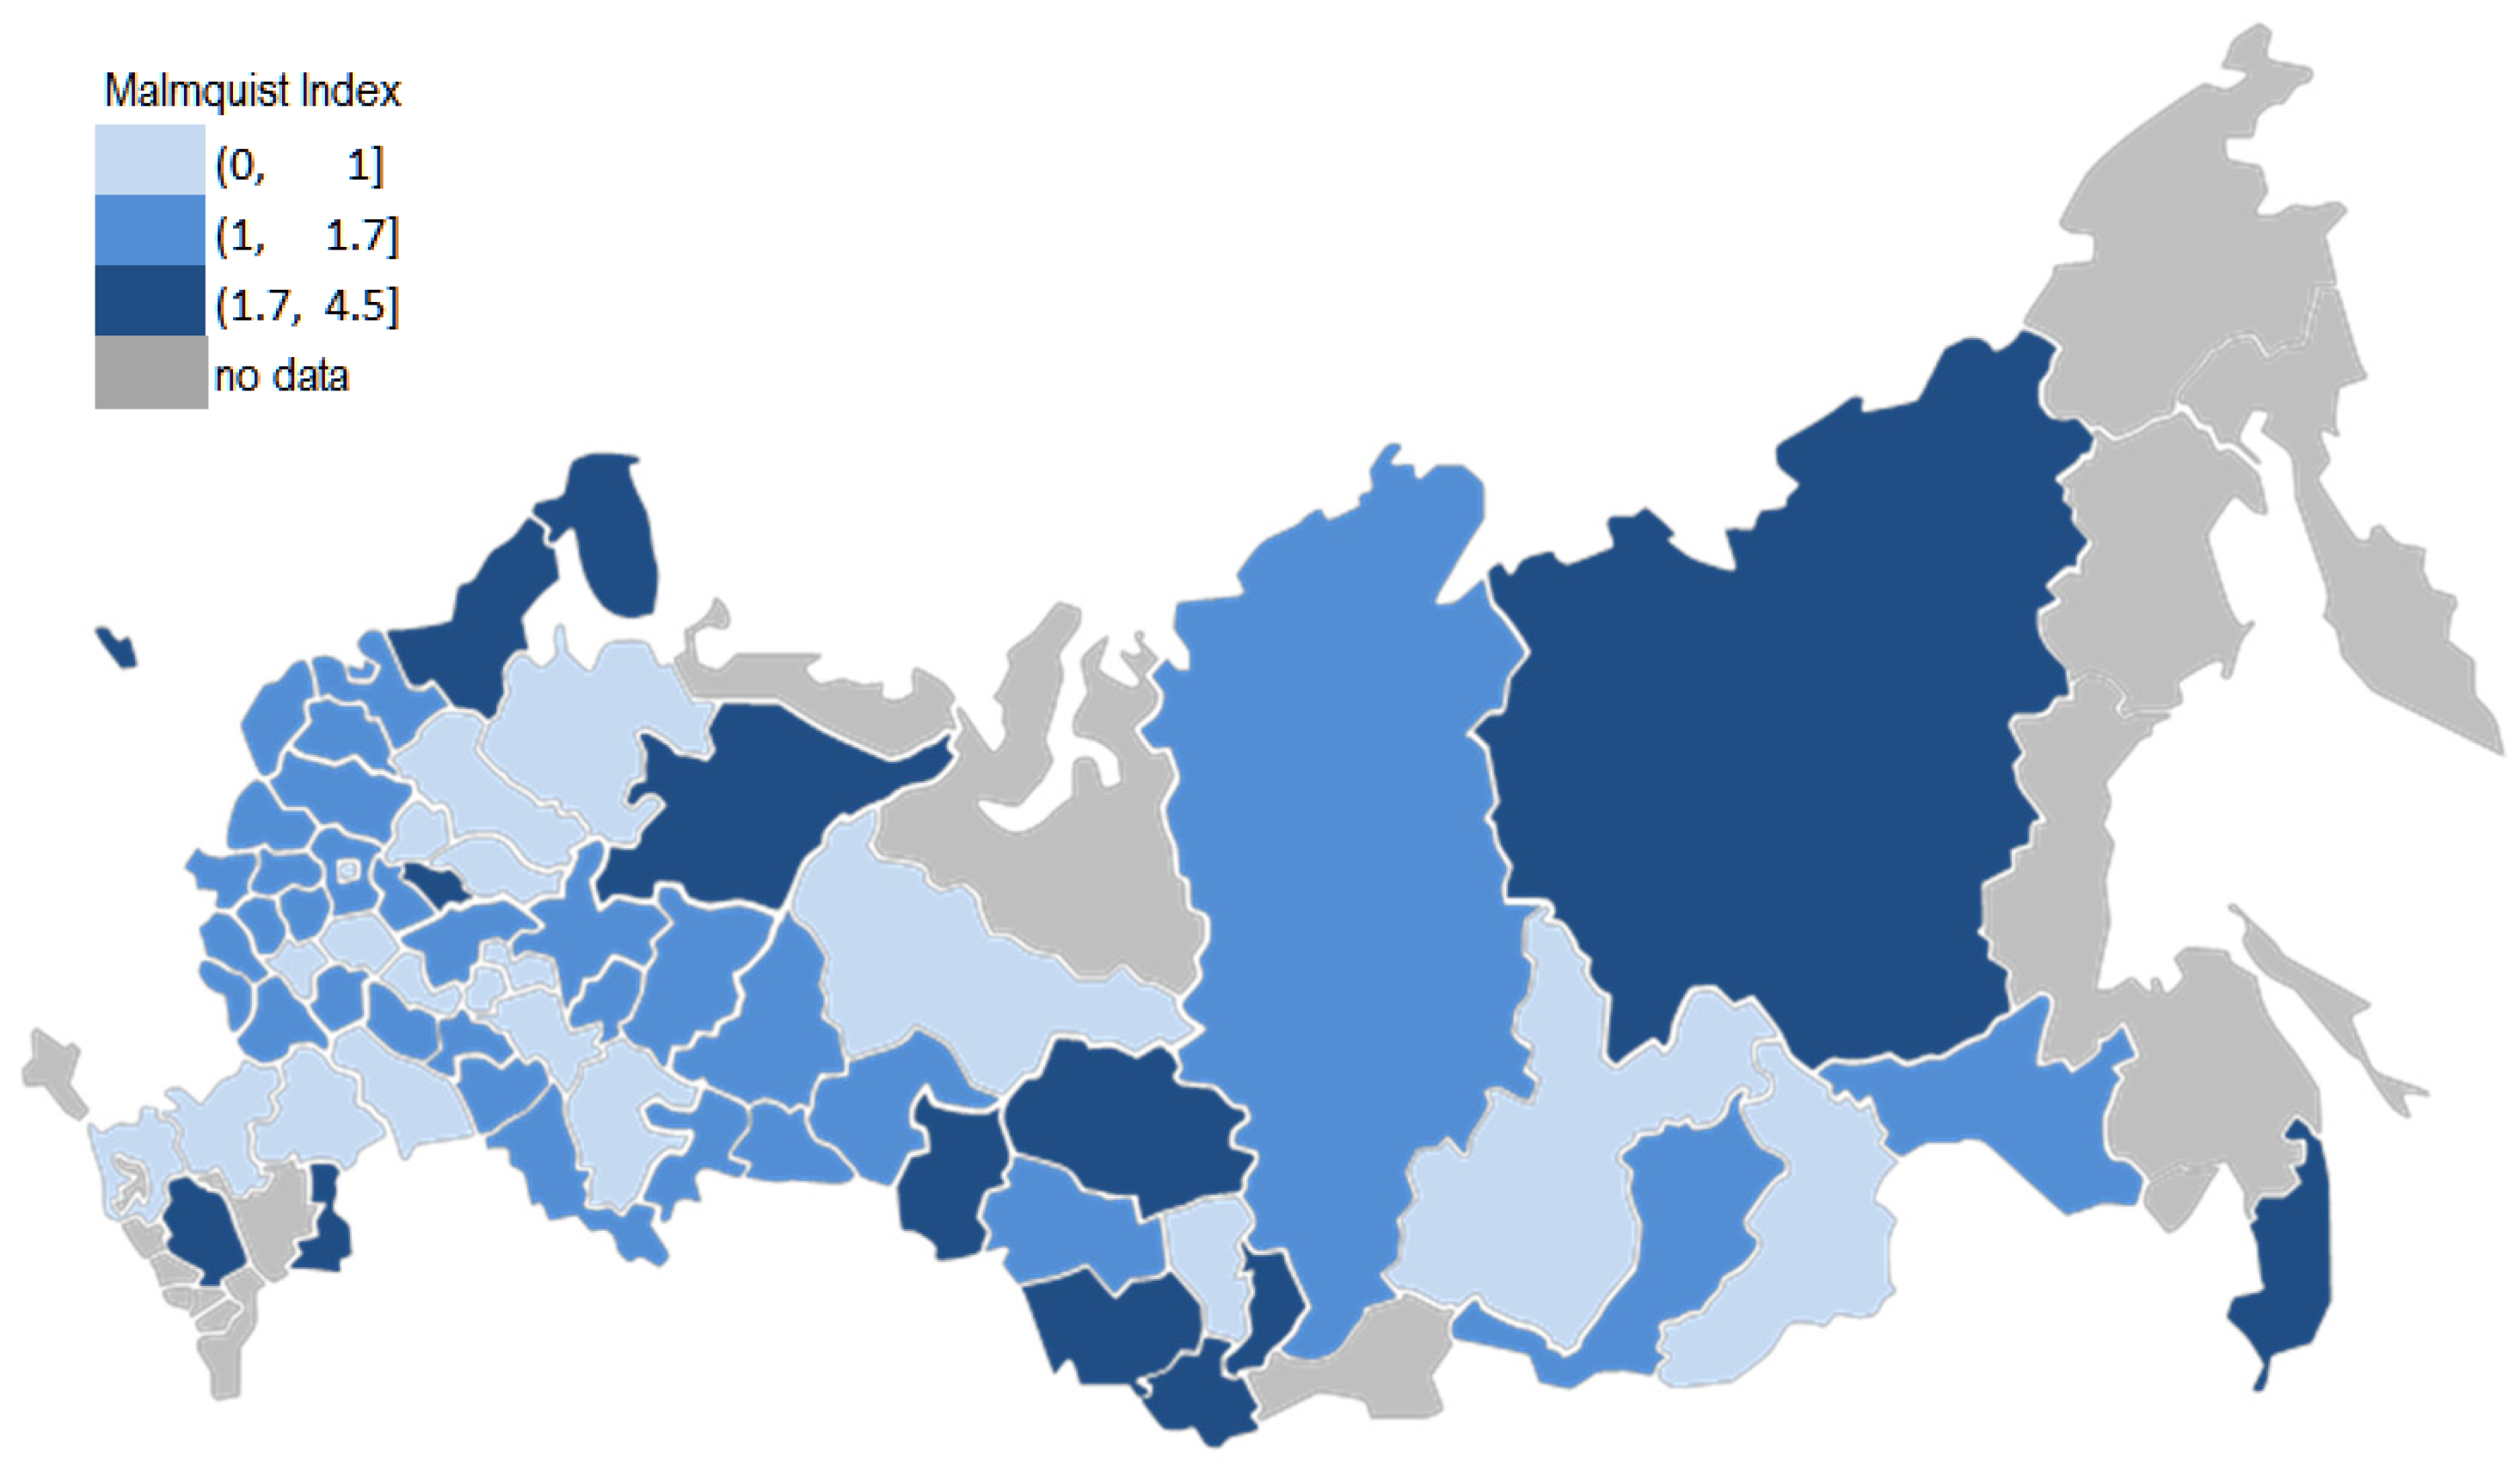
Figure 3.
Schematic map of Russian regions by the Malmquist index, 2017–2020.
The analysis of Figure 2 and Figure 3 allowed us to visually demonstrate the structural spatial shifts that occurred in Russian regions in knowledge-intensive services between 2017 and 2020 and showed an increase in the number of regions with the rapid development of the sector. Twelve regions for which some indicators are missing (registered patents and innovative activity in 2010–2014) are highlighted in gray.
The analysis of structural shifts in the knowledge-intensive services sector demonstrates changes in the spatial arrangement of regions in dynamics. For example, in 2017–2020, knowledge-intensive services growth occurred in those regions that had low efficiency growth rates in 2014–2017. These are mainly the regions of central and western Russia. The increasing growth in the knowledge-intensive services sector in these regions indicates that the sector’s efficiency has improved. We interpreted this trend as an increase in the evenness of penetration of the knowledge-intensive services on the territory of the country and a decrease in the polarization of regional development, which supports the H3 hypothesis of the relative leveling of the development of knowledge-intensive services in Russian regions.
In the period from 2017 to 2020, the less developed regions “caught up” with the regions that were more developed in the period between 2014 and 2017. In addition, the regions of western and central Russia are densely populated industrial regions and the growth of knowledge-intensive services is more desirable from the point of view of spatial development than, for example, even higher knowledge-intensive services growth in regions that are economic leaders, or in eastern resource-producing regions. Provided that the resource inputs we use are a good reflection of the amount of financial resources invested in the knowledge-intensive services sector, we can conclude about a more balanced regional development. Regions located outside the production capacity had increased efficiency by 2020, which indicates a rational public policy for the development of these territories as a zone for the growth of new technological structures and a knowledge-intensive economy.
Table 4 shows the average values of the Malmquist index and its components between 2014 and 2020.
Table 4.
Malmquist productivity index over the period between 2014 and 2020.
Table 5 presents the aggregated results of the calculations of the Malmquist index and its components by regions to exclude the effects of possible fluctuations in indices for individual periods. Given that the Malmquist index uses paired period comparisons, it is useful to compare the values of the performance indices for one single period of 2014–2020.
Table 5.
Malmquist Index summary of means for the model.
In the period 2014–2020, within the framework of which the research was carried out, there was a tendency to increase the total factor productivity (MI = 1.127). TC > 1 reflects a change in the frontier of production capabilities; in this case, the efficiency of the leading regions had increased. EC > 1 shows that the regions reduced the gap with the leading regions.
From 2014 to 2017, the development of knowledge-intensive services could not be considered effective. From 2017 to 2020, its efficiency increased. The average values of the Malmquist Index and its components over two periods maintained the trend while considering three intervals, which indicates that the model is sufficiently stable.
Analysis of the variability of the main performance indices (Figure 4) confirmed that technological change (TC) was the most significant factor of increased efficiency for the Russian regions. An important feature of effective development over both periods is that positive performance was achieved in both periods and on average through scale efficiency change. The mean pure efficiency change in these cases was less than one. With a slight increase in pure efficiency change, there were, on average, regions that were not effective in terms of PE index. This confirms hypothesis H2 on the significant influence of scale efficiency in the development of the knowledge-intensive services sector.
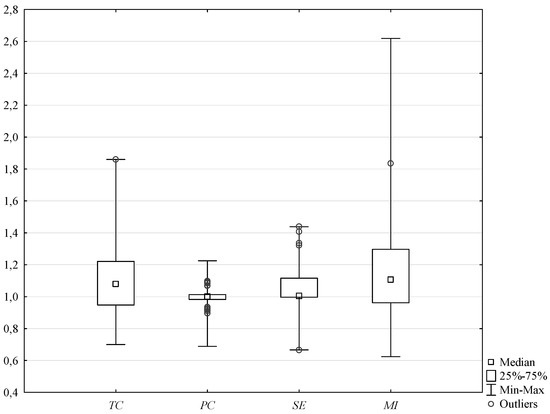
Figure 4.
Variability of aggregate performance indices by region for the period of 2014–2017.
The regions in the sample were very unevenly distributed; there were significant differences in the development dynamics between various regions, while for scale efficiency, changes in the difference was greater than for the pure efficiency changes.
The distribution of MI for the regions is summarized in Figure 5.
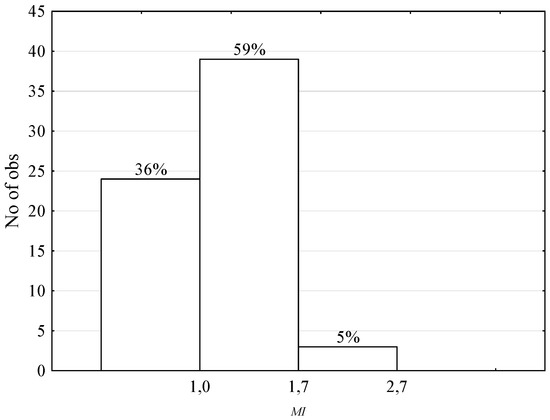
Figure 5.
Histogram of the distribution of regions according to the Malmquist index.
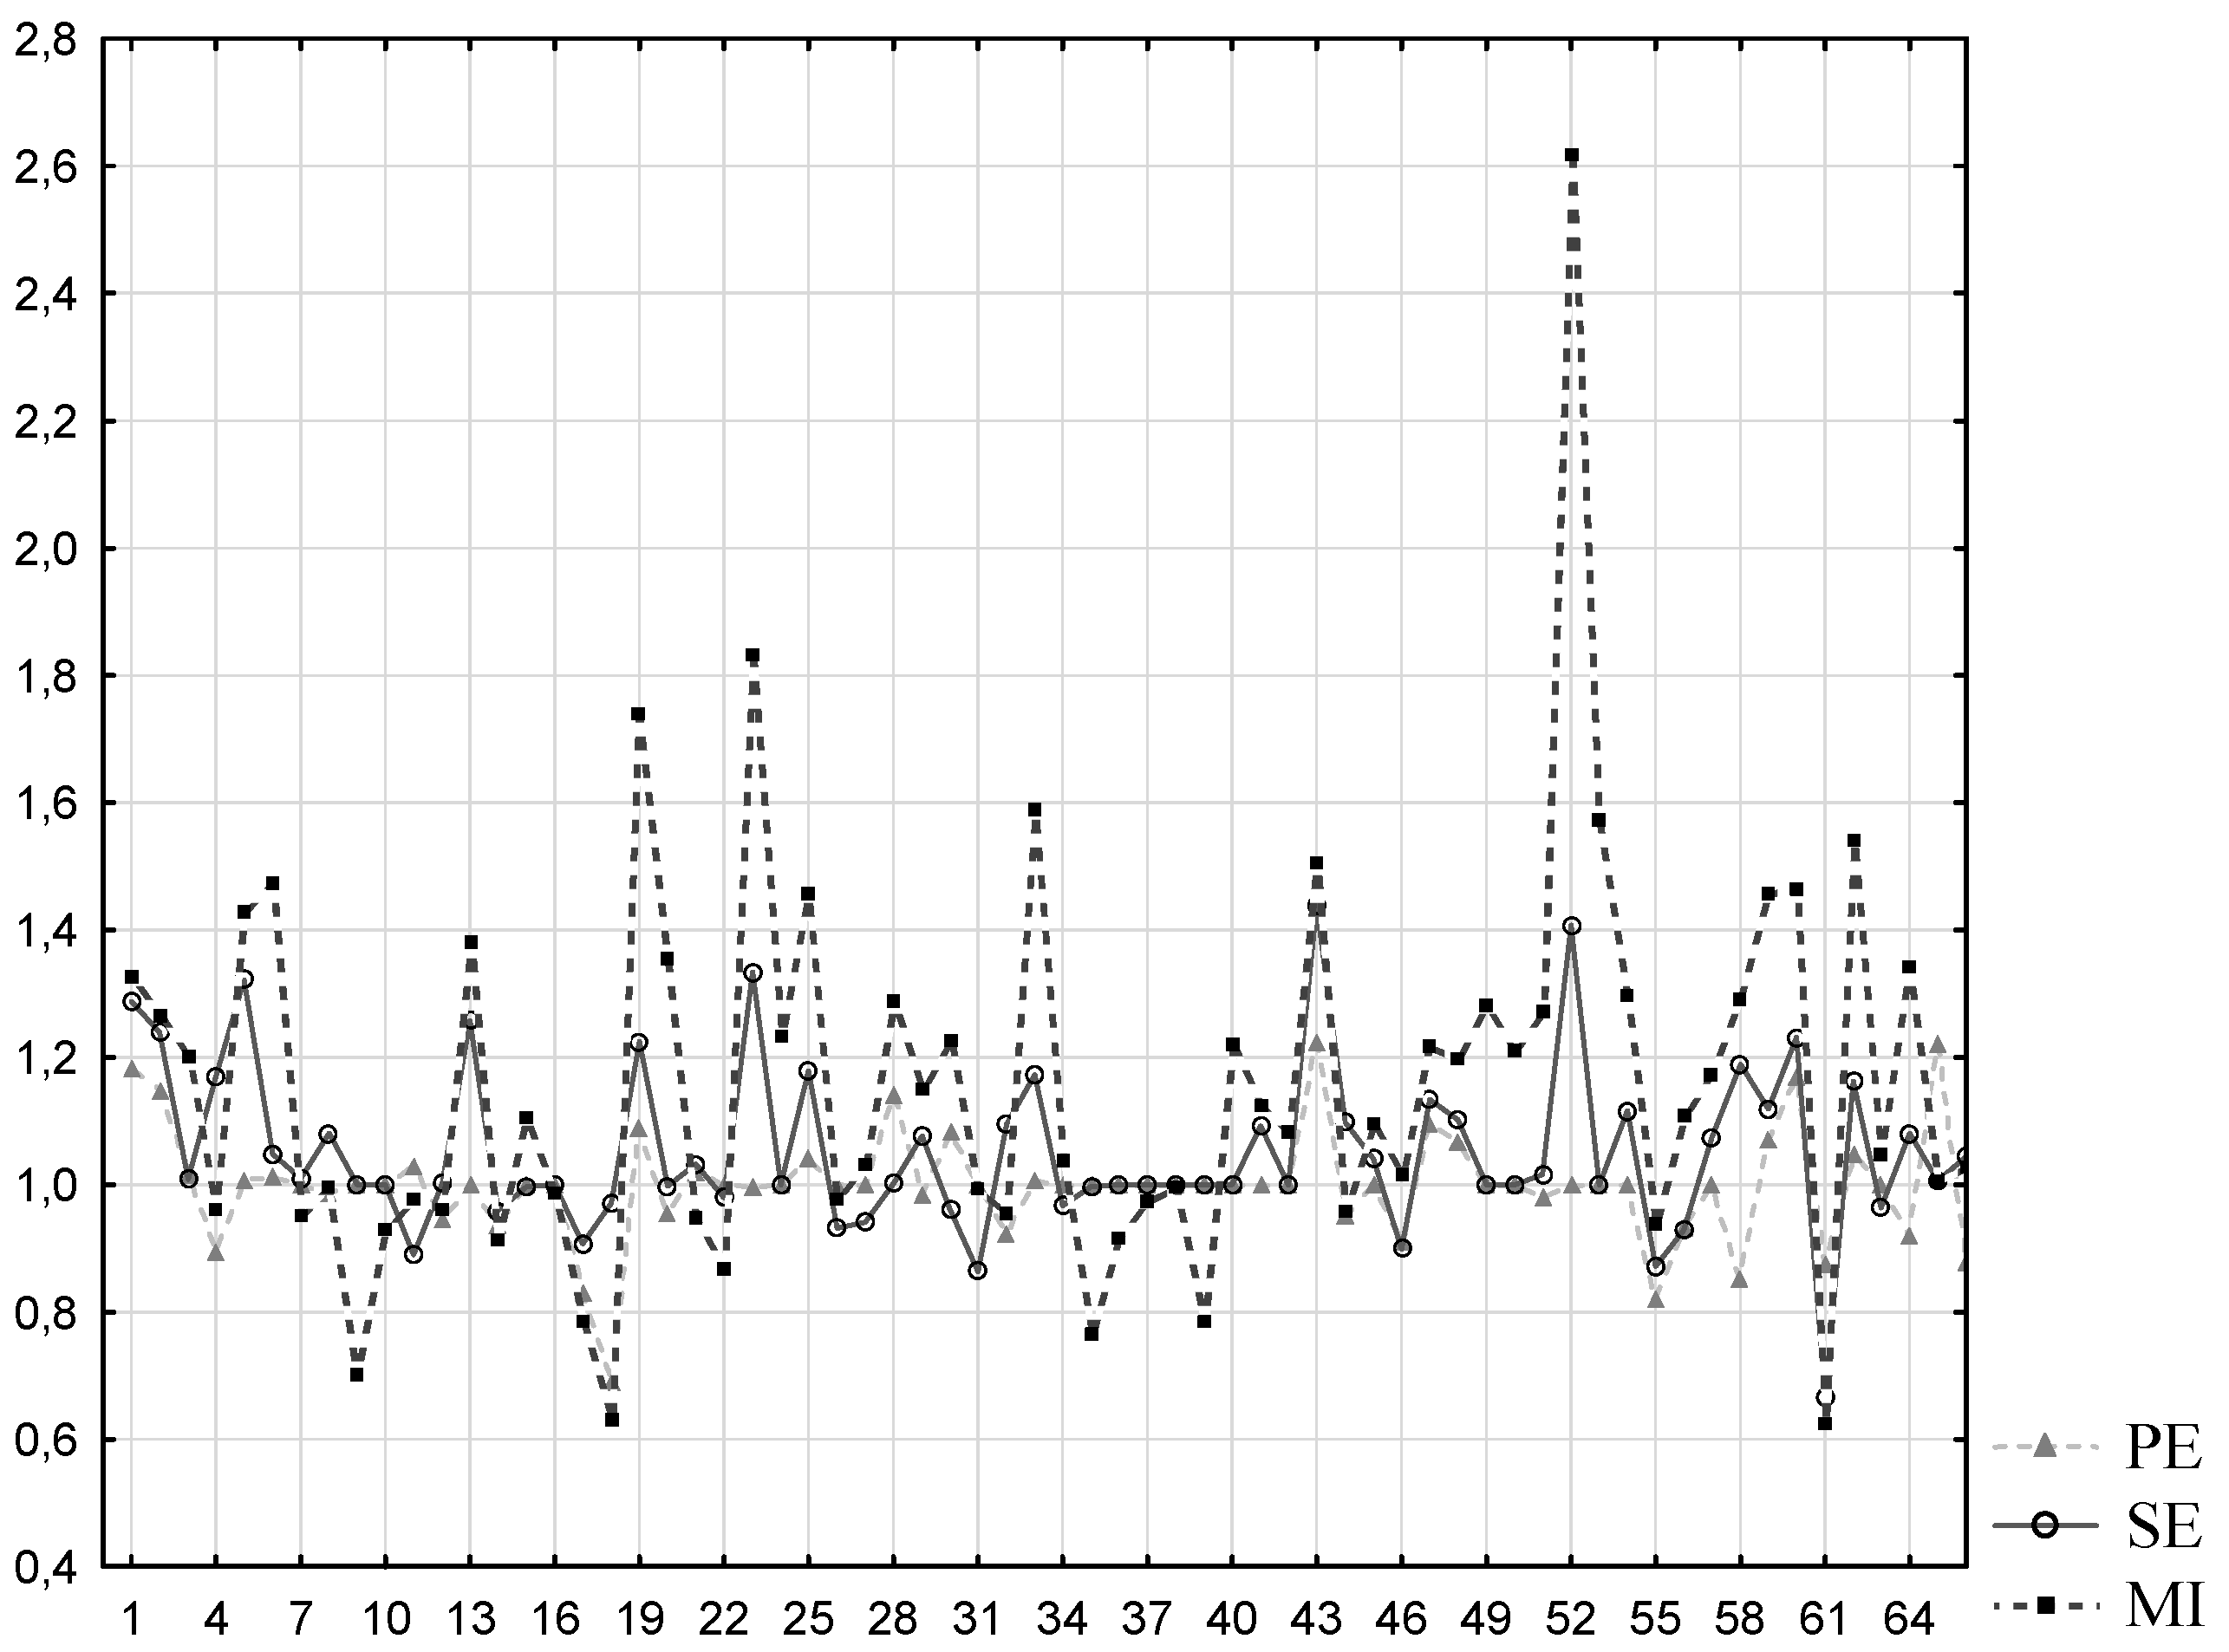
Examining the dynamics of the aggregated values of the Malmquist index and its components PE and SE by considered regions, we can conclude that the pure efficiency change occurred to a much lesser extent than the scale efficiency change (Figure 6). The above was also true for leading regions. The abscissa shows the numbers of the regions indicated in Table 4.
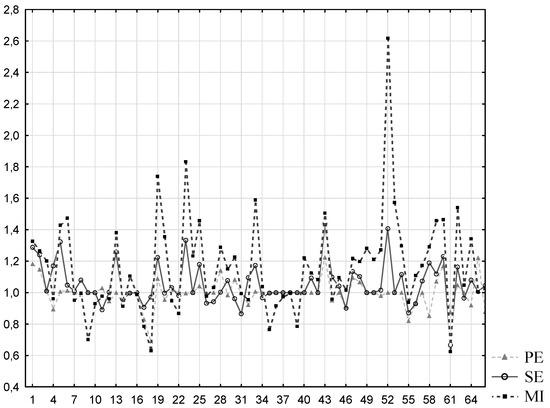
Figure 6.
Cross-region mean estimation of the Malmquist index components.
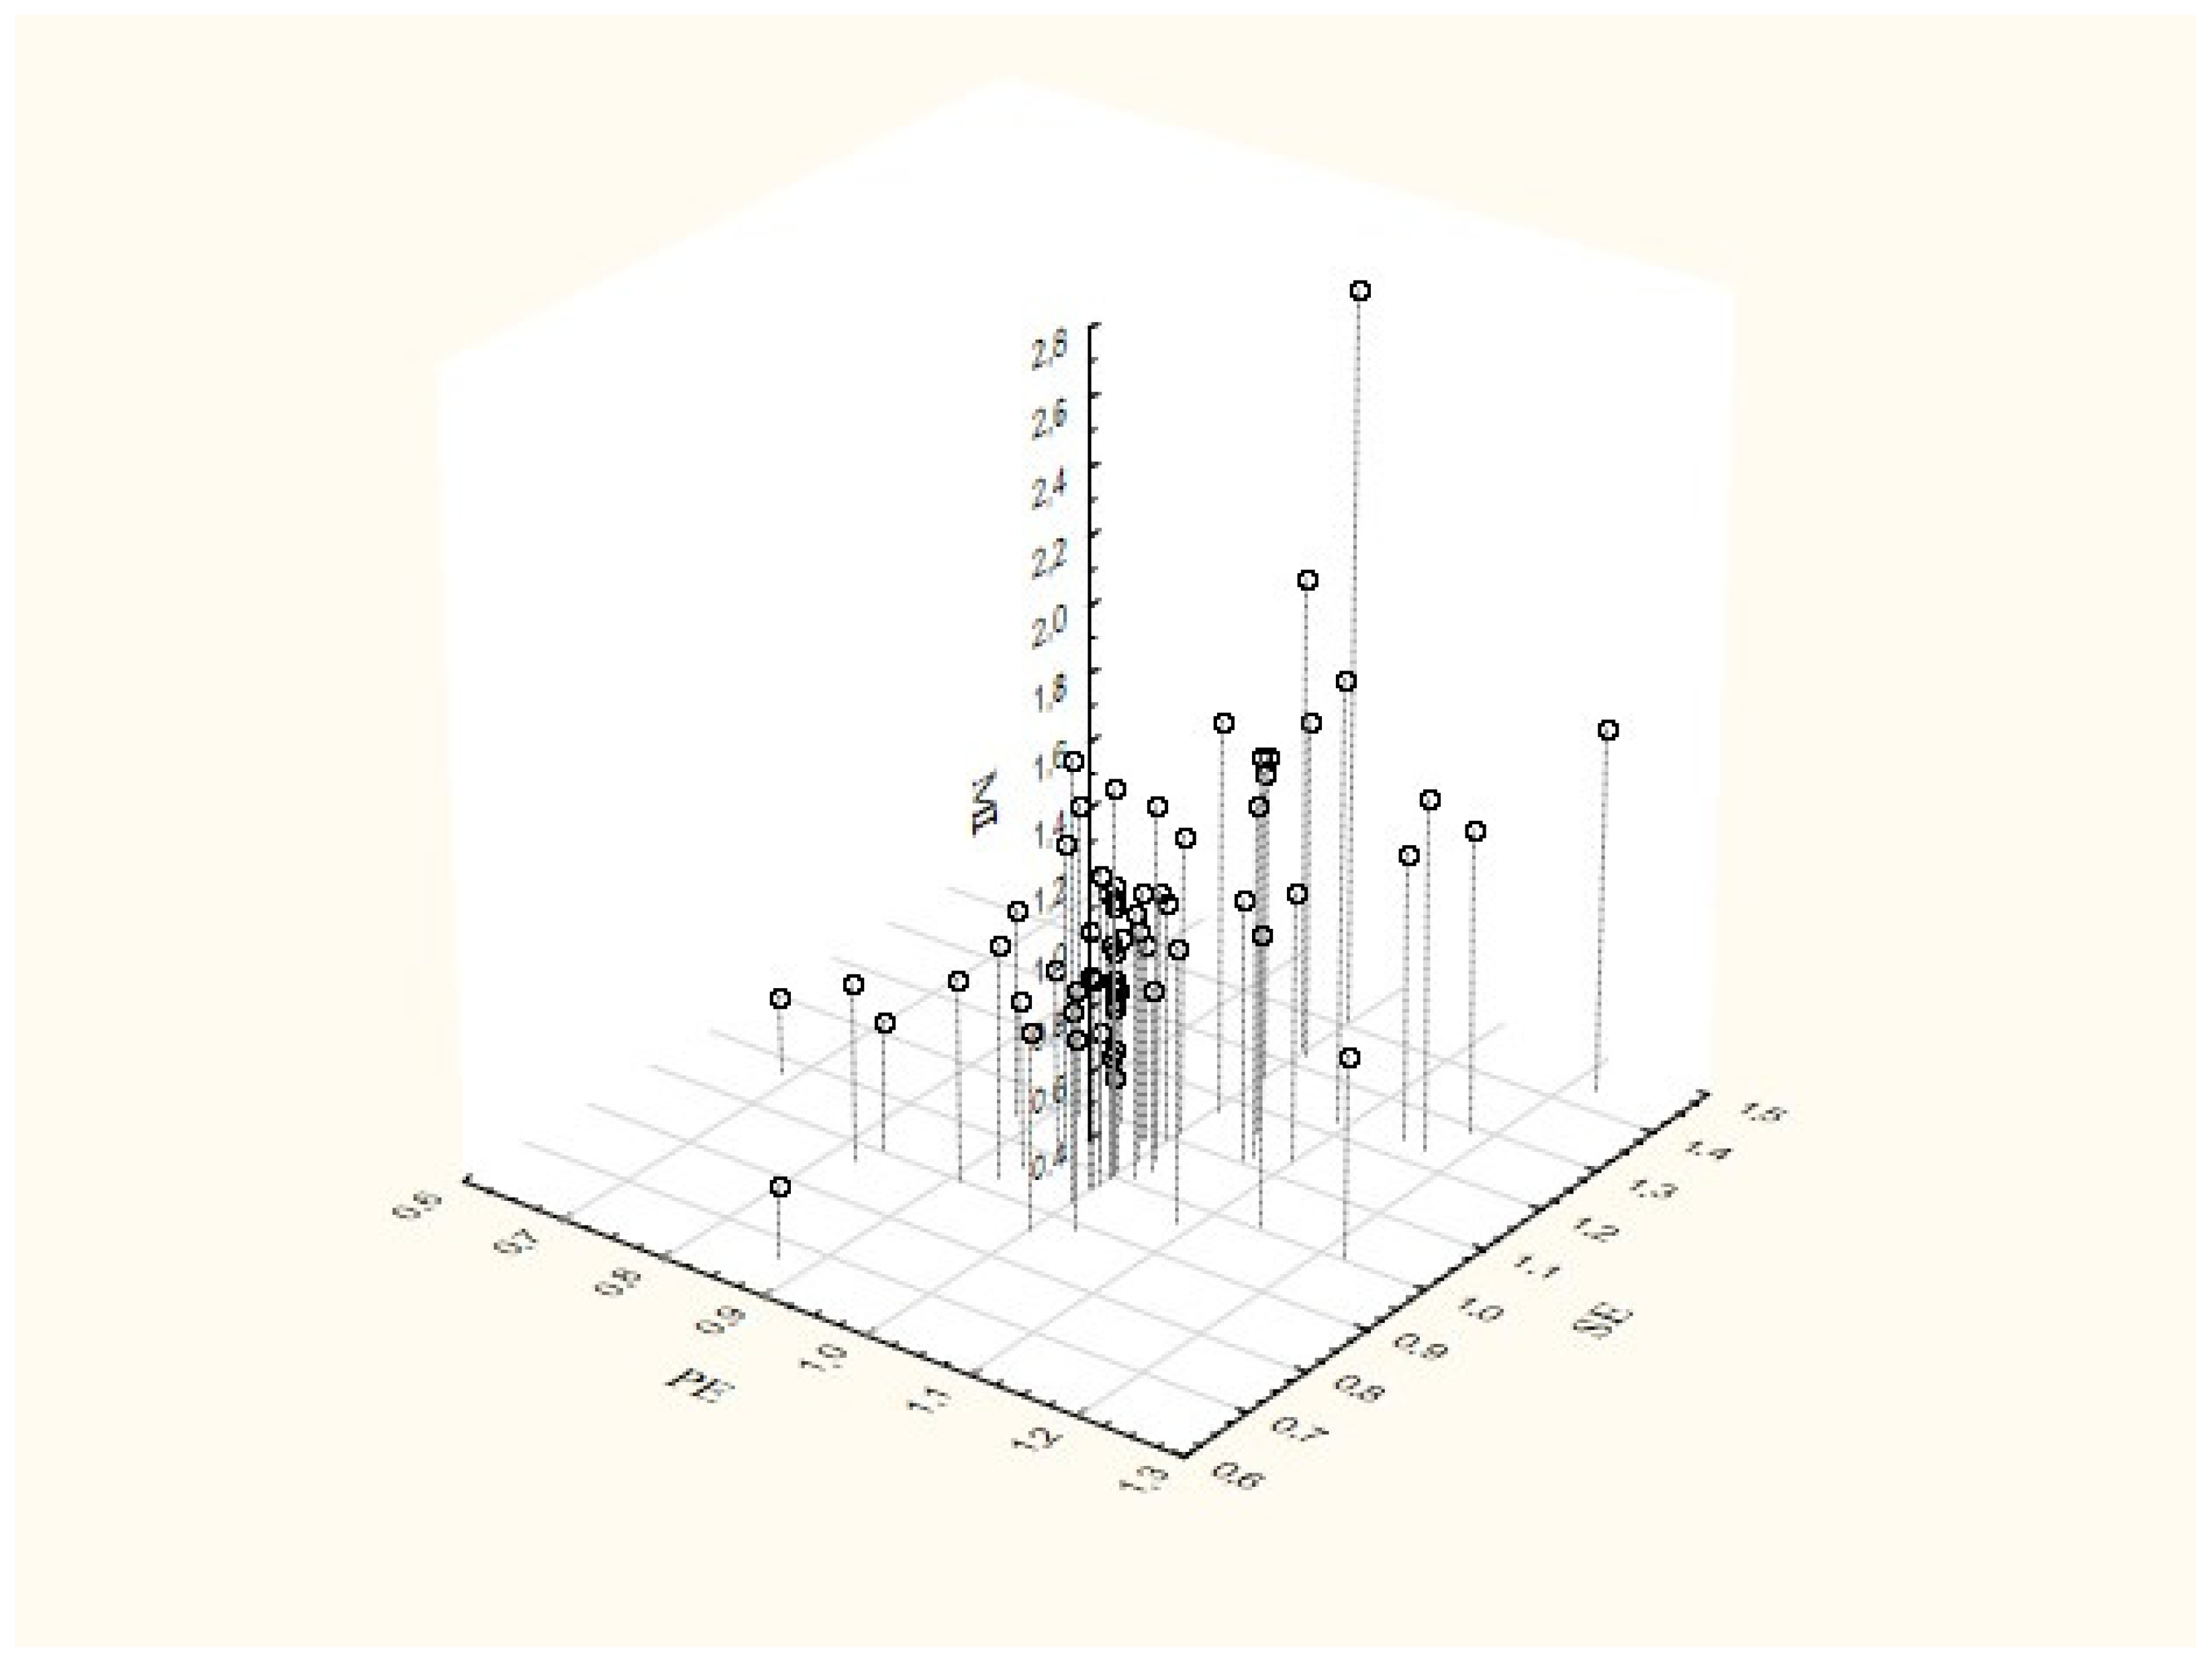
To identify the best practices based on the approximation of the optimal scale of activity, it was proposed to identify those regions with PE > 1 and SE > 1 (Figure 7).

Figure 7.
3D Scatterplot of MI against PE and SE.
The regions in this area demonstrated both an approach to the efficiency frontier and an increase in returns to scale over the period under consideration. A total of 24% of the regions belonged to this group, in particular, the Republic of Tatarstan, the Sverdlovsk region, Republic of Bashkortostan, and Chuvash Republic. The experience of these regions can be used to develop strategic directions for the development of knowledge-intensive services.
5. Discussion and Conclusions
The importance of knowledge-intensive services as a major driver of a country’s economic development makes it necessary to diagnose development in time and space in order to support regulatory policies.
For the knowledge-intensive services sector, both traditional rating models [68] and statistical methods can be applied taking into account different factors for several knowledge-intensive economy segments [69]. The application of the DEA methodology enhances the ability to assess the sector’s performance and dynamics in a resource-result approach. Most of the previous DEA-based research has focused on aspects of the development of knowledge-intensive services. Compared with these, we proposed a methodology to assess the dynamics of the knowledge-intensive services sector based on DEA to assess whether the sector is being developed through the expansion of resources or their efficient use. Our study attempted to implement a systemic approach by using a group of indicators covering features of the sector such as education, innovation, ICT, and their development.
The study was based on the examination of statistics and the updating of the sample as well on the inclusion of new periods in the study, which enriches our knowledge of the sector and allowed us to identify new trends and areas of its development. In the article, the time interval included the period from 2010 to the present day (taking into account open statistics data), which makes it possible to update fundamental knowledge about the development of the sector as a whole, in contrast to previous works.
Previous studies on the development of the knowledge-intensive services sector at the meso-level by DEA methods have assessed the particularities of the regions, taking into account country specificities [70,71]. The choice of input and output variables was limited in the article by the specificity of reflecting the functioning of the sector in Russia. The depth of statistics due to the need to take into account time lags determined the number of study periods. Such a systemic study of the knowledge-intensive services sector in the regions of Russia was carried out for the first time.
In order to assess the structural change in the knowledge-intensive services sector in Russian regions, methodological approaches to the assessment of its efficiency were developed in this study using data envelopment analysis based on a set of indicators reflecting the quantitative characteristics of segments of education, R&D and innovations, and ICT as part of the knowledge-intensive services sector. Input variables (volume of investments in fixed assets aimed at the acquisition of ICT in the region; share of personnel employed in the ICT sector; share of internal expenditure on R&D in GRP; the number of personnel engaged in R&D; share of organizations implementing technological, organizational, and marketing innovations; registered patents; funding for higher education institutions; the number of graduates from higher education institutions), and the output variables (number of used advanced production technologies in the region; share of innovative goods, works, and services in GRP and use of intellectual property) were used.
Our study attempts to distinguish regions by knowledge-intensive services sectors through decomposing the Malmquist index into TC, PE, and SE, which is a scientific novelty of research. Recent research has been aimed at drawing conclusions on the directions of the development of Russian regions from the point of view of the knowledge-intensive services sector. The proposed approach makes it possible to divide the efficiency change into the shift in the production capacity boundary and the movement of regions to or from it during the period from 2014 to 2020.
We obtained the following main conclusions in support of the hypotheses put forward. The use of the Malmquist index for the two periods of 2014–2017 and 2017–2020 showed generally positive development of the knowledge-intensive services sector in Russian regions. The increase in the number of efficient regions from 46% in 2014 to 53% in 2020 indicates an increase in the effectiveness of the knowledge-intensive services sector in the regions under consideration during the study period; that is, most regions have joined the development of knowledge-intensive economies. This may indicate the positive impact of resource provision and financing policies of regional development in the regions.
Based on the evaluation of the effectiveness of the development of knowledge-intensive services both over time and by region, it can be concluded that the change in aggregate costs explains most of the differences in efficiency. In so doing, pure efficiency change has less impact on total factor productivity.
At the same time, it should be noted that the development of knowledge-intensive services is characterized by some unevenness in various aspects, particularly in the net efficiency index.
The study revealed that the high dynamics of knowledge-intensive services showed regions were not traditional leaders in innovative and economic development; the increase in their efficiency has been due to a reduction in the deviation from the leading regions and the significant impact of scale efficiency.
The applied significance of the study is the ability to use timely assessments of the sector’s dynamics and potentials to determine national priorities. Prospects for the transformation of the Russian economy in accordance with the requirements for the development of a new technological paradigm will be associated, first of all, with regions that have demonstrated an increase in the efficiency of the sector, both in terms of pure efficiency and scale efficiency.
Public policies for the development of these segments of the regional economy should include measures to support the development of knowledge-intensive sectors. It is also important to reduce regional differentiation of knowledge-intensive sectors for their even and sustainable development. Calculating and monitoring the regional ranking results for knowledge-intensive services sector development allow for the diagnosis of ongoing structural changes in this sector to obtain empirical estimates for the perspective.
A further step is aimed at exploring the phenomenon of regional efficiency improvements along Russia’s western and southern borders, involving most input variables such as foreign direct investment, openness to trade, international transfer of innovation, the share of innovation exports of the total exports of products, and published scientific articles. The study of stochastic DEA models with a view to possibly assessing the influence of other factors affecting the efficiency of the regional development of knowledge-intensive services is of future research interest.
Author Contributions
Conceptualization, A.F. and G.C.; Methodology, A.F.; Software, G.C.; Validation, A.F., G.C. and R.T.; Formal analysis, A.F., G.C. and R.T.; Investigation, A.F. and G.C.; Resources, A.F. and G.C.; Data curation, A.F.; Writing—original draft preparation, A.F. and G.C.; Writing—review and editing, A.F. and G.C.; Visualization, A.F., G.C. and R.T.; Supervision, A.F.; Project administration, A.F. and G.C.; Funding acquisition, A.F. All authors have read and agreed to the published version of the manuscript.
Funding
This research was funded by the Russian Science Foundation, grant number 19-18-00199.
Institutional Review Board Statement
Not applicable.
Informed Consent Statement
Not applicable.
Data Availability Statement
The data are freely available and were taken from www.https://rosstat.gov.ru (accessed on 28 November 2021).
Conflicts of Interest
The authors declare no conflict of interest.
References
- Tödtling, F.; Lehner, P.; Trippl, M. Innovation in knowledge intensive industries: The nature and geography of knowledge links. Eur. Plan. Stud. 2006, 14, 1035–1058. [Google Scholar] [CrossRef]
- Machlup, F. The Production and Distribution of Knowledge in the United States; Princeton University Press: Princeton, NJ, USA, 1962. [Google Scholar]
- OECD. The Knowledge-Based Economy, Science Technology Industry; OECD: Paris, France, 1996. [Google Scholar]
- Giddens, A. Europe in the Global Age; Polity Press: Cambridge, MA, USA, 2007. [Google Scholar]
- Wegrzyn, G. Service Sector as a Stimulus of Knowledge-Based Economy Development. Transform. Bus. Econ. 2010, 9, 362–381. [Google Scholar]
- Harrington, J.W.; Daniels, P.W. Knowledge-Based Services, Internationalization and Regional Development, 1st ed.; Routledge: London, UK, 2006. [Google Scholar]
- Aslesen, H.W.; Isaksen, A. New perspectives on knowledge-intensive services and innovation. Geogr. Ann. Ser. B Hum. Geogr. 2007, 89, 45–58. [Google Scholar] [CrossRef]
- Kijek, T.; Matras-Bolibok, A. Knowledge-intensive Specialisation and Total Factor Productivity (TFP) in the EU Regional Scope. Acta Univ. Agric. Et Silvic. Mendel. Brun. 2020, 68, 181–188. [Google Scholar] [CrossRef] [Green Version]
- Li, X.; Fan, Z.P.; Feng, B. The Concept, Characteristics and Model of Knowledge-intensive Services. Inf. Sci. 2007, 10. Available online: https://en.cnki.com.cn/Article_en/CJFDTotal-QBKX200710031.htm (accessed on 28 November 2021).
- Santos-Vijande, M.L.; González-Mieres, C.; Ángel López-Sánchez, J. An assessment of innovativeness in KIBS: Implications on KIBS’ co-creation culture, innovation capability, and performance. J. Bus. Ind. Mark. 2013, 28, 86–102. [Google Scholar] [CrossRef]
- Yeh, S.; Ramirez, R. Service Innovation for Knowledge Intensive Services in the Digital Age: A Framework, Twenty-third Americas Conference on Information Systems. In Proceedings of the AMCIS 2017 Proceedings Strategic and Competitive Use of Information Technology, Boston, MA, USA, 10–12 August 2017. [Google Scholar]
- European Monitoring Centre on Change (EMCC). Sector Futures. The Knowledge-Intensive Business Services Sector; EMCC: Dublin, Ireland, 2005; Available online: http://www.proglocode.unam.mx/system/files/european%20foundation_2005.pdf (accessed on 10 October 2021).
- Balaz, V. Knowledge intensive services and knowledge-based economy in small European economies. Ekon. Časopis 2005, 53, 511–526. [Google Scholar]
- Shaposhnikov, V.A. Market of intellectual services: Essence and dialectics of formation. Pract. Mark. 2010, 12, 3–12. [Google Scholar]
- Schnabl, E.; Zenker, A. Statistical Classification of Knowledge-Intensive Business Services (KIBS) with NACE Rev. 2 (evoREG Research Note No. 25); Fraunhofer Institute for Systems and Innovation Research: Karlsruhe, Germany, 25 June 2013; 11p, Available online: http://www.evoreg.eu/docs/files/shno/ResearchNote_25_classificationKIBS_SCE_AZ_9_jb.pdf (accessed on 10 October 2021).
- Gibbons, M.; Limoges, C.; Nowotny, H.; Schwartzman, S.; Scott, P.; Trow, M. The New Production of Knowledge. In The Dynamics of Science and Research in Contemporary Societies; Sage: London, UK, 1994. [Google Scholar]
- Amara, N.; Landry, R.; Doloreux, D. Patterns of innovation in knowledge-intensive business services. Serv. Ind. J. 2009, 29, 407–430. [Google Scholar] [CrossRef]
- Wood, P. The regional significance of knowledge-intensive services in Europe. Innov. Eur. J. Soc. Sci. Res. 2006, 19, 51–66. [Google Scholar] [CrossRef]
- Miles, I.; Kastrinos, N.; Flanagan, K.; Bilderbeek, R.; Hertog, B.; Huntink, W.; Bouman, M. Users, Carriers and Sources of Innovation. In European Innovation Monitoring System (EIMS); EIMS Publication; European Commission: Brussels, Belgium, 1995; No. 15. [Google Scholar]
- Aarikka–Stenroos, L.; Jaakkola, E. Value co-creation in knowledge intensive business services: A dyadic perspective on the joint problem solving process. Ind. Mark. Manag. 2012, 41, 15–26. [Google Scholar] [CrossRef]
- Fisher, A.G.B. Production, primary, secondary and tertiary. Econ. Rec. 1939, 15, 24–38. [Google Scholar] [CrossRef]
- Clark, C. The Conditions of Economic Progress; Macmillan: London, France, 1940. [Google Scholar]
- Fourastié, J. Le Grand Espoir du XXe siècle; Presses Universitaires de France: Paris, France, 1949. [Google Scholar]
- Nelson, R.R.; Phelps, E.S. Investment in Humans, Technological Diffusion, and Economic Growth. Am. Econ. Rev. 1966, 2, 69–75. [Google Scholar]
- Stuart, T.A. Intellectual Capital. In A New Source of Wealth Organizations; Generation: Moscow, Russia, 2007. [Google Scholar]
- Miles, I.; Kastrinos, N.; Flanagan, K.; Bilderbeek, R.; den Hertog, P. Knowledge-Intensive Business Services. Users, Carriers and Sources of Innovation; PREST: Manchester, UK, 1995. [Google Scholar]
- Muller, E.; Doloreux, D. What we should know about knowledge-intensive business services. Technol. Soc. 2009, 31, 64–72. [Google Scholar] [CrossRef]
- Muller, E.; Zenker, A. Business Services as Actors of Knowledge Transformation: The Role of KIBS in Regional and National Innovation Systems. Res. Policy 2001, 30, 1501–1516. [Google Scholar] [CrossRef]
- Zieba, M. Knowledge-Intensive Business Services (KIBS) and Their Role in the Knowledge-Based Economy; GUT FME Working Paper Series A, No. 7/2013 (7); Gda’nsk University of Technology: Gda´nsk, Poland, 2013; Available online: http://hdl.handle.net/10419/173303 (accessed on 10 October 2021).
- Asikainen, A.-L. Innovation modes and strategies in knowledge intensive business services. Serv. Bus. 2015, 9, 77–95. [Google Scholar] [CrossRef]
- Dobrai, K.; Farkas, F. Knowledge-Intensive Business Services: A Brief Overview. Perspect. Innov. Econ. Bus. 2009, 3, 15–17. [Google Scholar] [CrossRef]
- Miles, I. From knowledge-intensive services to knowledge-intensive service systems. Int. J. Serv. Technol. Manag. 2011, 16, 141–159. [Google Scholar] [CrossRef]
- Freel, M. Knowledge-Intensive Business Services users and uses: Exploring the propensity to innovation-related cooperation with Knowledge-Intensive Business Services. In Knowledge-Intensive Business Services; Doloreux, D., Freel, M., Shearmur, R., Burlington, V.T., Eds.; Ashgate Publishing: Farnham, UK, 2010; pp. 75–98. [Google Scholar]
- Kukk, J.; Leppiman, A. The construct of value in knowledge-intensive business service from customer’s perspective. An example of a long-term training activity. Agron. Res. 2016, 14, 91–108. [Google Scholar]
- Plakhin, A.E.; Tkachenko, I.N.; Kompaneets, M.V.; Mihajlovskij, P.V. Mapping of industrial innovations of the fifth technological mode within the framework of industrial park structures of the Sverdlovsk region. IOP Conf. Ser. Mater. Sci. Eng. 2019, 564, 1012082. [Google Scholar] [CrossRef]
- Simchenko, N.A.; Apatova, N.V.; Korolev, O.L. System analysis of digital economy virtualization processes. Perspekt. Nauk. I Obraz.–Perspect. Sci. Educ. 2021, 50, 23–39. [Google Scholar] [CrossRef]
- Windrum, P.; Tomlinson, M. Knowledge-Intensive Services and International Competitiveness: A Four Country Comparison. Technol. Anal. Strateg. Manag. 1999, 11, 391–408. [Google Scholar] [CrossRef] [Green Version]
- Doroshenko, M.; Miles, I.; Vinogradov, D. Knowledge Intensive Business Services: The Russian Experience. Foresight-Russ. 2014, 8, 24–39. [Google Scholar]
- Zabrodin, A.Y. Intellectual Services in Business; Economics: Moscow, Russia, 2008; p. 635. [Google Scholar]
- OECD. Innovation and Knowledge-Intensive Service Activities; OECD: Paris, France, 2006. [Google Scholar]
- Ogurtsova, E.V.; Tugusheva, R.R.; Firsova, A.A. Innovation spillover effects of information and communications technology in higher education. Perspekt. Nauk. I Obraz.–Perspect. Sci. Educ. 2019, 42, 409–421. [Google Scholar]
- Tone, K. Advances in DEA Theory and Applications: With Extensions to Forecasting Models; John Wiley & Sons: Hoboken, NJ, USA, 2017. [Google Scholar]
- Coelli, T.; Rao, D.S.P.; Battese, G.E. An Introduction to Efficiency and Productivity Analysis, 2nd ed.; Springer: New York, NY, USA, 2005. [Google Scholar]
- Thanassoulis, E. Introduction to the Theory and Application of Data Envelopment Analysis: A Foundation Text with Integrated Software; Kluwer Academic Publishers: Boston, MA, USA, 2001. [Google Scholar]
- Cooper, W.; Seiford, L.; Zhu, J. Data Envelopment Analysis: History, Models, and Interpretations. In Handbook on Data Envelopment Analysis; International Series in Operations Research & Management Science; Springer: New York, NY, USA, 2011; pp. 1–39. [Google Scholar]
- Didenko, A.; Loseva, O.V.; Abdikeev, N. Measuring Efficiency of Regional Innovation System with DEA and PCA. In Proceedings of the 2017 IEEE 11thInternationalConference on Application of Information and Communication Technologies (AICT), Moscow, Russia, 20–22 September 2017. [Google Scholar]
- Capello, R.; Caragliu, A.; Lenzi, C. Is innovation in cities a matter of knowledge-intensive services? An empirical investigation, Innovation. Eur. J. Soc. Sci. Res. 2012, 25, 151–174. [Google Scholar] [CrossRef]
- Firsova, A.; Chernyshova, G. 2020 Efficiency Analysis of Regional Innovation Development Based on DEA Malmquist Index Information. Information 2020, 11, 294. [Google Scholar] [CrossRef]
- Camacho, J.A.; Rodríguez, M. Knowledge intensive services and R&D diffusion: An input-output approach. In Knowledge-Based Services, Internationalization and Regional Development; Routledge: England, UK, 2017; pp. 41–59. [Google Scholar]
- Firsova, A.; Chernyshova, G. Analysis of efficiency of regional innovation systems taking into account the financing structure. In Proceedings of the International Scientific Conference “Competitive, Sustainable and Secure Development of the Regional Economy: Response to Global Challenges” (CSSDRE 2018), Volgograd, Russia, 18–20 April 2018; pp. 417–422. [Google Scholar]
- Firsova, A.A.; Chernyshova, G.Y. Mathematical Models for Evaluation of the Higher Education System Functions with DEA Approach. Izv. Saratov Univ. New Ser. Math. Mech. Inform. 2019, 19, 351–362. [Google Scholar] [CrossRef]
- Ratner, S.; Lychev, A.; Rozhnov, A.; Lobanov, I. Efficiency Evaluation of Regional Environmental Management Systems in Russia Using Data Envelopment Analysis. Mathematics 2021, 9, 2210. [Google Scholar] [CrossRef]
- Afzal, M.N.I.; Lawrey, R. Evaluating the comparative performance of technical and scale efciencies in knowledge-based economies (KBEs) in ASEAN: A data envelopment analysis (DEA) application. Eur. J. Econ. Financ. Adm. Sci. 2012, 51, 81–95. [Google Scholar]
- Gavurová, B.; Haláskova, M.; Korony, S. Research and Development Indicators of EU28 Countries from Viewpoint of Super-efficiency DEA Analysis. Acta Univ. Agric. et Silvic. Mendel. Brun. 2019, 67, 225–242. [Google Scholar] [CrossRef] [Green Version]
- Hudec, O.; Prochádzková, M. The Relative Efficiency of Knowledge Innovation Processes in EU Countries. Stud. Reg. Sci. 2013, 43, 145–162. [Google Scholar] [CrossRef]
- Preobrazhenskiy, Y.V.; Firsova, A.A. Enhancing the knowledge spillover through the formation of the oligocentric national innovation system. Indones. J. Geogr. 2020, 52, 368–373. [Google Scholar] [CrossRef]
- Campisi, D.; Mancuso, P.; Mastrodonato, S.L.; Morea, D. Efficiency assessment of knowledge intensive business services industry in Italy: Data envelopment analysis (DEA) and financial ratio analysis. Meas. Bus. Excell. 2019, 23, 484–495. [Google Scholar] [CrossRef]
- Chen, W.; Jing, R.; Xu, R.; Lin, C.; Feng, Z. DEA-Malmquist index approach for the technological innovation efficiency of China’s highly patent-intensive industry. Harbin Gongcheng Daxue Xuebao J. Harbin Eng. Univ. 2017, 38, 489–494. [Google Scholar]
- Sharma, S.; Thomas, V.J. Inter-country R&D efficiency analysis: An application of data envelopment analysis. Scientometrics 2007, 76, 483–501. [Google Scholar]
- Charnes, A.; Cooper, W.W.; Rhodes, E. Measuring the efficiency of decision making units. Eur. J. Oper. Res. 1978, 2, 429–444. [Google Scholar] [CrossRef]
- Banker, R.D.; Charnes, A.; Cooper, W.W. Some models for estimating technical and scale inefficiencies in data envelopment analysis. Manag. Sci. 1984, 30, 1078–1092. [Google Scholar] [CrossRef] [Green Version]
- Färe, R.; Grosskopf, S.; Lovell, C.A.K. Production Frontier; Cambridge University Press: Cambridge, MA, USA, 1994. [Google Scholar]
- Shepherd, R.W. Theory of Cost and Production Frontiers; Princeton University Press: New Jersey, NJ, USA, 1970. [Google Scholar]
- Farrell, M.J. The Measurement of Productive Efficiency. J. R. Stat. Soc. Ser. A 1957, 120, 253–290. [Google Scholar] [CrossRef]
- Färe, R.; Grosskopf, S.; Norris, M.; Zhang, Z. Productivity growth, technical progress and efficiency change in industrialized countries. Am. Econ. Rev. 1994, 84, 66–83. [Google Scholar]
- Färe, R.; Grosskopf, S.; Norris, M. Productivity growth, technical progress and efficiency change in industrialized countries: Reply. Am. Econ. Rev. 1997, 87, 1040–1044. [Google Scholar]
- Federal State Statistics Service. Regions of Russia. Socio-Economic Indicators–2020. The Russian Federal Service of State Statistics. Available online: https://gks.ru/bgd/regl/b20_14p/Main.htm (accessed on 10 October 2021).
- Brenner, T.; Capasso, M.; Duschl, M.; Frenken, K.; Treibich, T. Causal relations between knowledge-intensive business services and regional employment growth. Reg. Stud. 2018, 52, 172–183. [Google Scholar] [CrossRef] [Green Version]
- Pauceanu, A.M. Impact of knowledge intensive businesses services on the economic performance of sectors and regions in the UE. Afr. Dev. Resour. Res. Inst. J. Ghana West Afr. 2015, 8, 2343–6891. [Google Scholar]
- Satzger, G.; Schulteß, P.; Neus, A. Knowledge Intensive Services Procurement Strategy; Karlsruhe Service Research Institute: Karlsruhe, Germany, 2009. [Google Scholar]
- Ilyina, I.E.; Zharova, E.N.; Agamirova, E.V.; Kamenskiy, A.S. Innovative Development of the Regions of Russia. Regionology 2018, 26, 230–255. [Google Scholar] [CrossRef]


Publisher’s Note: MDPI stays neutral with regard to jurisdictional claims in published maps and institutional affiliations. |
© 2022 by the authors. Licensee MDPI, Basel, Switzerland. This article is an open access article distributed under the terms and conditions of the Creative Commons Attribution (CC BY) license (https://creativecommons.org/licenses/by/4.0/).