Abstract
Various approaches including hypothesis test and confidence interval (CI) construction have been proposed to assess non-inferiority and assay sensitivity via a known fraction or pre-specified margin in three-arm trials with continuous or discrete endpoints. However, there is little work done on the construction of the non-inferiority margin from historical data and simultaneous generalized CIs (SGCIs) in a three-arm trial with the normally distributed endpoints. Based on the generalized fiducial method and the square-and-add method, we propose two simultaneous CIs for assessing non-inferiority and assay sensitivity in a three-arm trial. For comparison, we also consider the Wald-type Bonferroni simultaneous CI and parametric bootstrap simultaneous CI. An algorithm for evaluating the optimal sample size for attaining the pre-specified power is given. Simulation studies are conducted to investigate the performance of the proposed CIs in terms of their empirical coverage probabilities. An example taken from the mildly asthmatic study is illustrated using the proposed simultaneous CIs. Empirical results show that the proposed generalized fiducial method and the square-and-add method behave better than other two compared CIs.
1. Introduction
In modern clinical trials, it is extremely interesting to demonstrate whether a new treatment that is less toxic, less expensive or easier to administer is not inferior to an expensive and technical pathological reference treatment by more than a pre-specified margin. This is usually called a two-arm non-inferiority trial that does not include a placebo. Two-arm non-inferiority trials have been widely studied. For example, see [1,2,3]. However, two-arm non-inferiority trials have some shortcomings, such as the selection of the non-inferiority margin and the assessment of assay sensitivity (i.e., the ability to differentiate between an effective treatment and a less effective or ineffective treatment). If ethically acceptable and practically feasible, it is generally recognized that three-arm non-inferiority trials including a placebo can surmount the difficulties mentioned above [4].
There has been a growing interest in developing statistical inference on three-arm non-inferiority trials. For example, see [5], and [6] for the fractional margin, i.e., the non-inferiority margin is taken as a pre-specified fraction of unknown effect size of reference treatment. In particular, Tang, Yu and Tang [7] developed the exact and approximate unconditional test approaches for the assessment of the non-inferiority in a three-arm trial with binary endpoints. However, the aforementioned literature did not consider the assessment of assay sensitivity. To this end, simultaneously assessing non-inferiority and assay sensitivity via a fixed margin has received considerable attention in recent years. For example, Hide and Tango [8] investigated simultaneous testing for both non-inferiority and assay sensitivity via a pre-specified margin, which is defined as a difference between two treatment effects in the considered historical placebo-controlled trial with normally distributed endpoints in the presence of homoscedasticity. Here endpoint represents the observation of random variable, and the normally distributed endpoint means that endpoint comes from a normal distribution. Hida and Tango’s method may be improper due to the usage of the same margins for testing both non-inferiority and assay sensitivity. To solve the problem, Kwong et al. [9] considered a modified version of Hida and Tango’s testing procedure based on different margins for assessing both non-inferiority and assay sensitivity. Mtze, Munk and Friede [10] presented a Wald-type test procedure for assessing both non-inferiority and assay sensitivity in a three-arm trial with negative binomially distributed endpoints.
The aforementioned literature mainly focuses on the non-inferiority testing problem in a three-arm trial. However, there is little work on simultaneously considering the construction of non-inferiority margin from the historical data and confidence interval for simultaneously testing both non-inferiority and assay sensitivity. Moreover, it is difficult to invert to find simultaneous confidence intervals for simultaneously testing both non-inferiority and assay sensitivity based on the aforementioned test procedures. To address these issues, here we consider the construction problem of simultaneous confidence intervals (CIs) for assessing both non-inferiority and assay sensitivity based on the square-and-add method and the generalized fiducial method in a three-arm trial.
CI construction via the square-and-add method [11], which is also called the method of variance estimates recovery, has received considerable attention over the past years in that it does not depend on the large sample theory and has a computationally simple and closed expression. For example, Li et al. [12] proposed an interval for the difference between two poisson rates based on the square-and-add method. Tang et al. [13] proposed five simultaneous CIs for risk differences in stratified matched-pair designs via the square-and-add method. Tang et al. [14] studied the problem of CI construction for the difference between two correlated proportions in the presence of incomplete paired binary data based on the square-and-add method. Zhang and Tang [15] extended the square-and-add method to CI construction of difference between two correlated areas under ROC curves in a matched-pair experiment. However, to our knowledge, there is little work done on simultaneous CI construction for assessing both non-inferiority and assay sensitivity in a three-arm trial using the square-and-add method.
Generalized CIs (GCIs) via generalized fiducial method [16] are widely studied in that it has been shown to be a useful tool for making inference in many practical problems. For example, see [17,18]. In particular, Schaarschmidt [19] discussed simultaneous CI construction for multiple comparisons among expected values of log-normal variables via the generalized fiducial method; Gamalo et al. [20] investigated the generalized CI construction problem for assessing non-inferiority in a three-arm trial with normally distributed endpoints in the presence of heteroscedasticity. However, Gamalo et al. [20] did not consider the assay sensitivity assessment problem. Moreover, to our knowledge, there is little work developed on simultaneous GCIs for assessing both non-inferiority and assay sensitivity in a three-arm trial with normally distributed endpoints. Hence, this paper proposes two simultaneous GCIs for simultaneously assessing non-inferiority and assay sensitivity by incorporating generalized fiducial pivotal quantity of [21] and the square-and-add approach in a three-arm non-inferiority trial with normally distributed endpoints, and presents their corresponding algorithms for evaluating GCIs. For comparison, we also consider Wald-type Bonferroni simultaneous CIs and parametric bootstrap simultaneous CIs introduced in [22]. In addition, we also discuss the problem of sample size determination, and present approximate formulae for determining sample size for attaining a pre-specified power.
The rest of this paper is organized as follows. Section 2 introduces the hypothesis testing problem for assessing both non-inferiority and assay sensitivity in a three-arm trial, discusses the problem of non-inferiority margin construction from historical data, presents four simultaneous CIs for assessing both non-inferiority and assay sensitivity based on generalized fiducial method, square-and-add approach, Wald-type Bonferroni method and parametric bootstrap method and gives the sample size formulae. Simulation studies and an example from the mildly asthmatic study are illustrated in Section 3. A brief discussion is given in Section 4. Technical details are presented in the Appendix A.
2. Materials and Methods
Following [9], we consider a one-way fixed effect model for endpoints in a three-arm non-inferiority trial with experimental, reference and placebo treatments. For notational simplicity, we denote experimental, reference and placebo treatments as E, R and P, respectively. Throughout this paper, we assume
where is the endpoint of the jth individual for the ith treatment, is the fixed effect of the ith treatment, measurement errors , and is the sample size of the ith treatment for E, R, P. Without loss of generality, it is assumed that a larger value of indicates the better efficacy for the ith treatment. Under the above assumption, we have
To assess the non-inferiority (NI) and the assay sensitivity in a three-arm trial, Kwong et al. [9] considered the following modified HT hypotheses:
where is a pre-specified margin, and r is some pre-specified constant and satisfies the restricted condition: . In particular, when , the hypotheses considered above are just those given in [8]. When , the testing procedure for hypotheses (3) is more stringent than the testing procedure of [8] because of requiring assay sensitivity to be established. Clearly, if and are simultaneously rejected by some two-tailed test at the significance level or two one-tailed tests at the significance level , we may draw a conclusion: , which indicates that (i) the NI of experimental treatment to reference one with respect to and (ii) the superiority of reference treatment to placebo by more than . Here is the entire effect size of reference treatment over placebo, and is the NI margin showing the NI of experimental treatment to reference one.
Generally, one can construct two appropriate statistics for testing hypotheses and . Here, rather than hypothesis testing, we consider the problem of constructing simultaneous CIs for and due to the duality of hypothesis testing and CI estimation. If the lower limits of the resultant one-sided simultaneous CIs for and are larger than and , respectively, we can simultaneously reject the null hypotheses and at the significance level . However, in clinical studies, is usually unknown. In what follows, we consider the construction problem of the NI margin, denoted as , via the lower bound of the credible interval of treatment effect of reference treatment in historical trials.
2.1. Construction of NI Margin
In what follows, a historical-trial-based approach and the generalized fiducial method are adopted to determine the NI margin . To this end, we first consider the generalized fiducial CI construction problem as follows.
Let be a random vector whose distribution is indexed by parameter vector . Suppose we are interested in making inference on . Let be an independent copy of S, and s and represent the observed values of S and , respectively. A generalized fiducial pivotal quantity (GFPQ) for parameter , denoted as , is a function of , and satisfies the following conditions:
(i) The conditional distribution of , given , is free of .
(ii) For every allowable , .
Approximate percentiles of form a generalized fiducial CI for . To wit, if the above conditions hold and there exist two statistics and such that
thus the interval is called the generalized fiducial CI for . In what follows, we adapt the above definition of generalized fiducial CI to determine NI margin via a historical placebo-controlled trial for the reference treatment, which is a superiority trial for establishing the efficacy of the reference treatment.
Let be the endpoint of the jth individual for the ith treatment in the historical trial for and . Following the aforementioned one-way fixed effect model, we assume that and follow the normal distributions, i.e.,
where and denote the treatment effects for placebo and reference treatments in the considered historical trial, respectively, and denote their corresponding variances to be estimated, and and are their corresponding sample sizes. Our purpose is to construct GFPQ for mean difference . To this end, we denote and for , P. It is easily shown that and are unbaised estimators of and , respectively. Thus, an unbaised estimator of is given by . It is well known that and are sufficient statstics of and , respectively, and and for , P. Let
where and are independent copies of and , respectively. Then, we have , , and is independent of . Hence, the GFPQs for and are
respectively. Using the GFPQs of and leads to
where and . From Equation (10), it is easily shown that is a GFPQ of . The two-sided GFCI for is , where is the percentile point of sample observations of .
Denote . Following the frequentist’s approach, we take the NI margin as , where is a fraction representing the preservation level or desired proportion of the reference effect to the retained. Thus, the assay sensitivity margin can be expressed as . This shows that when (i.e., ), the assay sensitivity margin results in a more stringent rejection criterion than the historical placebo-controlled trial; when and (i.e., ), the assay sensitivity margin is equal to and the NI margin is set as ; when and , the hypothesis (3) reduces to the HT hypothesis.
2.2. Simultaneous CIs for and
2.2.1. Wald-Type Bonferroni Simultaneous CI
Generally, to construct simultaneous CI for and , one can consider the widely used and simple Bonferroni method based on the Wald-type statistics.
For the current trial data generated from model (2), we denote and . The unbiased estimators of and are given by and , respectively, i.e., and for , R, E. The unbiased estimators of and are and , respectively, whose variances are and , respectively. The estimated variances of and have the forms: and , respectively. It is easily shown that the Wald-type statistics and asymptotically follow the standard normal distribution. Thus, an approximate one-sided Wald-type Bonferroni simultaneous confidence region for and is given by
where , and . The above defined simultaneous confidence region is called the WB-SCI.
As Tang et al. [13] pointed out, the Bonferroni simultaneous confidence region may behave poorly when is small. To address the issue, three new simultaneous confidence regions are developed as follows.
2.2.2. Generalized Fiducial Simultaneous CI
For , P, R, let and be independent copies of and , respectively, and define and . It is easily shown that , and is independent of . It follows from Section 2.1 that the GFPQs for and can be expressed as
respectively. Thus, the GFPQs of and are
respectively. Define
Thus, the one-sided simultaneous generalized fiducial confidence region for is
where , , and is the percentile point of statistic ’s distribution given sample observations. The above defined simultaneous confidence region is referred to as GF-SCI method.
Theorem 1.
Let be an independent and identically distributed sample from for k=P, R, E. Suppose that holds, where and for k=P, R, E. Then, we have
The proof of Theorem 1 is given in Appendix A. Theorem 1 shows that the proposed GF-SCI can asymptotically attain the pre-specified coverage probability.
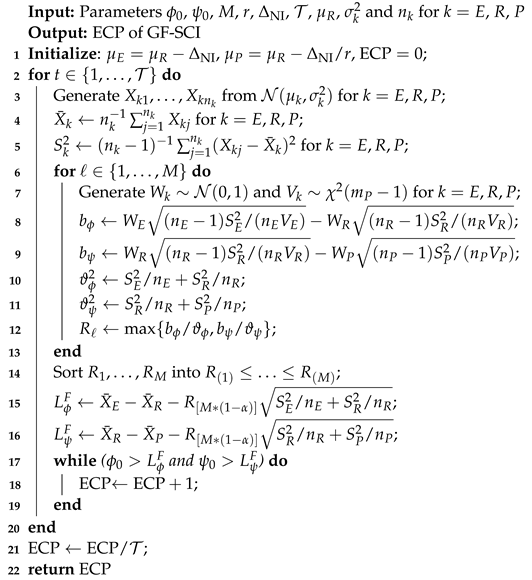
Combining the above argument, we form the following computing Algorithm 1 for evaluating empirical coverage probability (ECP) of the proposed GF-SCI.
| Algorithm 1: Evaluating ECP of GF-SCI. |
 |
2.2.3. Hybrid Generalized Fiducial Simultaneous CI
The above presented GF-SCI for and is computationally intensive in determining the percentile point of statistic ’s distribution. To solve this problem, we develop a hybrid generalized fiducial simultaneous CI by incorporating the square-and-add method and generalized fiducial method as follows.
The lower limits of the approximate Wald-type CIs for and are given by
respectively, where , , and is the percentile point of the standard normal distribution. It is easily shown that and are consistent estimators of and when the sample sizes and are sufficiently large, respectively. Hence, to recovery variances and so that the resultant simultaneous CI behaves satisfactorily for small to moderate sample sizes, we develop the following hybrid method, which is similar to that given in [14].
Let and be the lower and upper limits of an approximate one-sided CI for for k = E, R, P. It follows from the Slutsky’s theorem that statistic asymptotically follows the standard normal distribution for k = E, R, P. Thus, for k = E, R, P, we have and , which lead to for and for , respectively. Following the argument of Howe [23] and Newcombe [11], we substitute the above equations into (18) and define the lower limits of the approximate one-sided hybrid CIs for and as
respectively, which imply that it is necessary to first evaluate the lower and upper limits and (k = E, R, P) for computing and . In what follows, the generalized fiducial method introduced above is employed to calculate and for k = E, R, P.
The lower and upper limits of an approximate one-sided GFCI of adjusted for multiplicity using the Bonferroni method have the forms
where represents the percentile point of sample observations of , which is the GFPQ of with , and for , R, P.
Plugging the above defined lower and upper limits and () into and defined in (19) leads to an approximate one-sided hybrid generalized fiducial simultaneous confidence region of :
The above defined simultaneous confidence region is referred to as HG-SCI method.
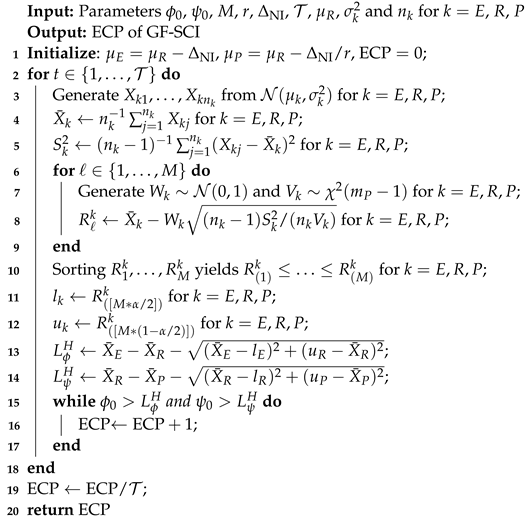
The approach to evaluate empirical coverage probability (ECP) of the defined HG-SCI is summarized as the Algorithm 2.
| Algorithm 2: Evaluating ECP of HG-SCI. |
 |
2.2.4. Parametric Bootstrap Simultaneous CI
From Section 2.2.3, it is easily seen that the current data are repeatedly used in calculating hybrid generalized fiducial simultaneous confidence region. To address the issue, following [22], we consider the following parametric bootstrap simultaneous confidence region for and .
To this end, we denote
Let be the approximate percentile point of statistic ’s distribution. Then, the lower limits of an approximate one-sided simultaneous confidence region for and are given as
respectively. Clearly, the challenge for evaluating and is to calculate . While and are asymptotically distributed as the standard normal distribution, it is rather difficult to compute from the joint distribution of and in that is not independent of . To solve the problem, the parametric bootstrap approach given in [22] is adopted to approximate the distribution of statistic .
Let denote the observed values of for , P, R. Note that the distribution of depends on the nuisance parameters , but it dose not depend on the values of for , R, P. Therefore, when inducing the distribution of , we can take for , R, P. The parametric bootstrap distribution of can be obtained from its resampling distribution when the values of ’s are replaced by and the values of ’s are taken as zero. It follows from Equation (22) that the parametric bootstrap pivotal quantity for statistic is
where
The distribution of provides a parametric bootstrap approximation to the distribution of . Let be the percentile point of bootstrap sample observations of . Thus, an approximate one-sided parametric bootstrap simultaneous confidence region for is given by
where , and . The above defined simultaneous confidence region is referred to as PB-SCI method.
Theorem 2.
Let be an independent and identically distributed sample from for k = P, R, E. Let . Assume that there is a such that holds for k = E, R, P. Then, we have
Proof of Theorem 2 is given in Appendix B. Theorem 2 shows that the preceding proposed parametric bootstrap simultaneous confidence region can asymptotically attain the pre-specified confidence level .
2.3. Sample Size Determination
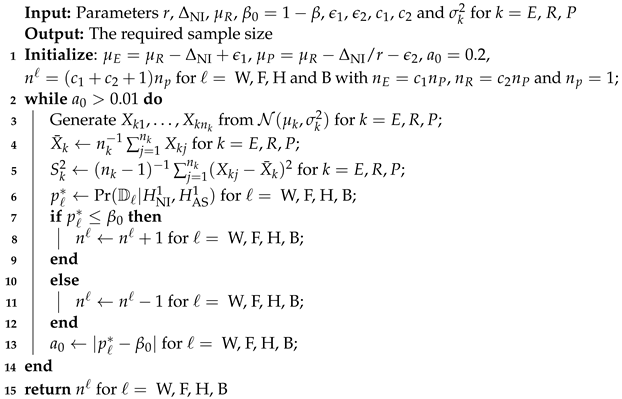
Due to the duality of hypothesis testing and interval estimation, we can obtain the rejection regions at the significance level from the above proposed four simultaneous confidence regions, which are given as , , , , respectively, where denotes the sample mean for , R, P, and , , and correspond to the WB-SCI, GF-SCI, HG-SCI and PB-SCI, respectively. The family wise error rate can be controlled at the significance level via , and the power of can be computed by for ℓ = W, F, H and B. The required sample size for attaining the pre-specified power at the given significance level can be obtained by finding the solution to with respect to n for ℓ = W, F, H and B. There is not a closed-form for n. To this end, Algorithm 3 is presented to compute the sample size n with the assumption: as follows.
| Algorithm 3: Computing sample size. |
 |
3. Results
Simulation examples and a real example are provided to illustrate the efficiency of the preceding proposed methods in terms of empirical coverage probabilities. The lower limits of the approximate 95% one-sided simultaneous confidence region for the proposed methods are given in an application to mildly asthmatic study. Empirical results demonstrated that the GF-SCI and HG-SCI perform better than the WB-SCI and PB-SCI.
3.1. Simulation Results
In this section, two simulation studies are conducted to investigate the performance of the preceding proposed methodologies.
To compare the performance of the proposed simultaneous confidence regions in terms of their empirical coverage probabilities (ECPs), we conduct the first simulation study for replications. In this simulation study, we take = 4, = 1.5, = 1, = 2 and in generating historical data for determining and with , and = 2.0, = 1.5, = 0.5, 1.0 and 3.0, 3.0, 4.0 and 5.0, and indicating that the true values and of and are and , respectively, in sampling the current trial data. We set r = 0.3 together with and 0.7, and r = 0.6 together with and 0.4, corresponding to the cases that and , respectively; and r = 1.0 together with 0.0 corresponding to the case that . We consider = 60, 150 and 300 with the following three allocation proportions: (L1) the balanced design , (L2) the unbalanced design and (L3) the unbalanced design .
For each of the aforementioned settings, the preceding proposed three algorithms for evaluating simultaneous confidence regions for and are used to compute ECPs at the significance level . Results for , 150 and 300 are given in Table 1, Table 2 and Table 3, respectively. Inspection of Table 1, Table 2 and Table 3 indicates that (i) the GF-SCI and HG-SCI methods behave better than the WB-SCI and PB-SCI methods regardless of the values of r, , and and the sample sizes in that the ECPs of the former are quite closer to the pre-specified confidence level 95% than those of the latter; (ii) when the sample size n is small, the PB-SCI and WB-SCI methods are liberal regardless of the balanced and unbalanced designs in that their ECPs are less than the pre-specified confidence level 95%, but the PB-SCI method behaves better than the WB-SCI method in that the ECPs for the former are closer to the pre-specified confidence level than those for the latter; (iii) when the sample size is large (e.g., and 300), the PB-SCI method has the same performance as the GF-SCI and HG-SCI methods, but the WB-SCI method is liberal.

Table 1.
Empirical coverage probabilities of four 95% simultaneous confidence regions for and under various settings with .
Table 2.
Empirical coverage probabilities of four 95% simultaneous confidence regions for and under various settings with .
Table 3.
Empirical coverage probabilities of four 95% simultaneous confidence regions for and under various settings with .
To investigate the performance of the sample size determination method introduced above (i.e., Algorithm 3), we conduct the second simulation study. Here the same settings as those given in the first simulation study including r and are used to generate the historical data in determining the NI margin: and , i.e., = 4, = 1.5, = 1, = 2, , , and and 0.7, and and 0.4, and and . To calculate the required sample size for attaining the power , we consider the following settings: = 2.0, = 1.5, = 0.5, 1.0 and 3.0, 3, 4 and 5, , with = 0.4 and 0.6, and four allocation proportions: = 1:1:1 (the balanced design), and 2:1:1, 2:2:1 and 3:2:1 (the unbalanced design).
For each of the aforementioned settings, the above introduced Algorithm 3 is adopted to calculate the required sample sizes for the WB-SCI, GF-SCI, HG-SCI and PB-SCI methods. The powers for ℓ = W, F, H and B are computed by Monte Carlo method with random observations. Based on the required sample size, we also compute its corresponding empirical power for comparing the accuracy of the proposed sample size determination. Results for are presented in Table 4 and Table 5. Examination of Table 4 and Table 5 shows that (i) the derived sample size formulae are rather accurate regardless of the values of r, and , the balanced and unbalanced designs in that their corresponding empirical powers are quite close to the pre-specified true powers; (ii) the sample size increases as increases; (iii) the value of has little effect on the sample size; (iv) the sample size decreases as increases.
Table 4.
The required sample sizes n for true power 95% and its empirical powers under various settings with .
Table 5.
The required sample sizes n for true power 95% and its empirical powers under various settings with .
3.2. Application to Mildly Asthmatic Study
As an illustration of the preceding proposed simultaneous confidence region, we consider a data set on “Mildly Asthmatic Study” taken from [5]. In the mildly asthmatic study, the primary outcome variable is the forced vital capacity (FVC), and the data set consists of experimental (), reference (), and placebo () groups. The means, standard deviations, minimum and maximum values for the FVC are 4.32, 1.16, 0.8 and 6.52 for E group, respectively; 4.86, 1.03, 2.94 and 6.90 for R group, respectively; and 3.14, 0.97, 1.41 and 4.99 for placebo group, respectively. Since [5] did not present the details on the historical trial, Ghosh et al. [24] independently simulated 5000 historical data sets from the normal distribution with the specified parameters and sample sizes in applying their proposed approach to the assessment of the NI of experimental to reference in a three-arm trial. Unlike [24], we here divide the considered data set into the historical and current data sets, its 30% is taken as the historical data randomly sampled from the considered data set without replacement, and the rest is regarded as the current data. Thus, the above developed approach to determine NI margin is applied to the historical data, and the preceding proposed four simultaneous confidence regions for and are applied to the current data for simultaneously assessing both NI and assay sensitivity with the following specification: , 0.25, 0.5, 0.6, 0.75 and 0.9 together with and . The lower limits of the approximate one-sided simultaneous confidence region of for the GF-SCI, HG-SCI, WB-SCI and PB-SCI methods are presented in Table 6. Examination of Table 6 shows that (i) the assay sensitivity can be established at the significance level in that lower limits of four confidence regions are greater than regardless of the values of ; (ii) the NI cannot be established at the significance level 5% for the GF-SCI, HG-SCI, WB-SCI and PB-SCI methods in that lower limits of their corresponding confidence intervals are less than regardless of the values of , which is consistent with those given in [5].
Table 6.
Lower limits of the approximate one-sided simultaneous confidence regions of for the GF-SCI, HG-SCI, WB-SCI and PB-SCI methods in the mildly asthmatic study.
4. Discussion
This paper studied the confidence interval construction problem for simultaneously assessing the non-inferiority and assay sensitivity in a three-arm trial with normally distributed endpoints, in which the non-inferiority margin is defined as a pre-specified fixed difference between treatment effects of experimental and reference treatments in the considered historical placebo-controlled trial. The generalized fiducial pivotal quantity method together with the historical-trial-based approach were utilized to determine the non-inferiority margin. However, there was no closed-form for the non-inferiority margin via the historical-trial-based approach. To overcome the difficulty, a Monte Carlo resampling method was adopted to determine the non-inferiority margin based on the percentile point of the drawn observations. Based on the constructed non-inferiority margin, we developed four simultaneous confidence intervals for parameters based on the Wald-type statistic together with the Bonferroni method, generalized fiducial pivotal quantity method, hybrid generalized fiducial method incorporating the square-and-add method and generalized fiducial method, and parametric bootstrap resampling method. The flexible algorithms for computing empirical coverage probabilities for the proposed four simultaneous confidence intervals were also given. Simulation studies were conducted to investigate the performance of the proposed four simultaneous confidence intervals under various settings including the moderate and large sample sizes, balanced and unbalanced designs, different hypotheses including the HT hypothesis. Empirical results demonstrated that the GF-SCI and HG-SCI methods perform better than the WB-SCI and PB-SCI methods, and the GF-SCI, PB-SCI and HG-SCI methods had the same performance when the sample size was large (i.e., n = 150 and 300) in terms of their empirical coverage probabilities. Hence, we recommended the usage of the hybrid generalized fiducial simultaneous confidence interval because its computational burden was less than that for the PB-SCI method, and the usage of the Wald-type Bonferroni simultaneous confidence interval when the sample size was large.
This paper did not consider the simultaneous confidence interval construction problem for simultaneously assessing both non-inferiority and assay sensitivity in a three-arm trial with normally distributed endpoints in the presence of missing endpoints, which are commonly encountered in the modern drug studies. We did not consider the usage of the prior information in determining the non-inferiority margin from the placebo-controlled data, which may improve the efficiency of the estimation for the non-inferiority margin.
Author Contributions
Conceptualization, N.T.; methodology, N.T. and F.L.; software, F.L.; validation, N.T.; formal analysis, N.T. and F.L.; investigation, F.L.; resources, N.T. and F.L.; data curation, N.T.; writing—original draft preparation, F.L.; writing—review and editing, N.T.; visualization, F.L.; supervision, N.T.; project administration, N.T.; funding acquisition, N.T. All authors have read and agreed to the published version of the manuscript.
Funding
This research was funded by the grants from the Key Projects of the National Natural Science Foundation of China (Grant No.: 11731101).
Institutional Review Board Statement
Not applicable.
Informed Consent Statement
Not applicable.
Data Availability Statement
The datasets generated and analysed are available from the corresponding author on reasonable request.
Conflicts of Interest
The authors declare no conflict of interest.
Abbreviations
The following abbreviations are used in this manuscript:
| CI | Confidence interval |
| GFPQ | Generalized fiducial pivotal quantity |
| WB-SCI | Wald-type Bonferroni simultaneous confidence region |
| GF-SCI | Simultaneous generalized fiducial confidence region |
| ECP | empirical coverage probability |
| HG-SCI | Hybrid generalized fiducial simultaneous confidence region |
| PB-SCI | Parametric bootstrap simultaneous confidence region |
Appendix A. Proof of Theorem 1
Proof.
Denote , , and . The central limit theorem implies that where are i.i.d. variables. By Skorohod’s theorem (see Billingsley 1995) we can find a sequence independent of such that has the same distribution as and almost surely, where denote observable random vector and represent an independent copy of . In what follows we can therefore assume without loss of generality that
It follows from the Sluctsky’s theorem that as
where denotes the standard normal distribution, for , R, P and the a.s. comes from the a.s. convergence in (A1).
Appendix B. Proof of Theorem 2
Proof.
Note that
where and be the percentile point of bootstrap sample observations of , where is given by . To show the above simultaneous CI has correct coverage probability asymptotically, it is sufficient to show that T has the same limiting distribution as when . This can be justified, according to continuous mapping theorem if we can show that , and , have the same limiting joint distribution, respectively. Note that
From condition , we can obtain that and , for , R, E. Therefore, by Slutsky’s theorem, it follows that
where denotes the standard normal distribution, for , R, P. To show that , also weakly converges to the same joint distribution, we first note that , for , R, E and they are independent. Therefore, by using the similar approach, we can obtain that
Finally, because the distribution of and its limiting distribution are both continuous, so as , where be the percentile point of T. This completes the proof. □
References
- Tango, T. Equivalence test and confidence interval for the difference in proportions for the paired-sample design. Stat. Med. 1998, 17, 891–908. [Google Scholar] [CrossRef]
- Tang, N.S.; Tang, M.L.; Chan, S.F. On tests of equivalence via non-unity relative risk for matached-pair design. Stat. Med. 2003, 22, 1217–1233. [Google Scholar] [CrossRef]
- Tang, M.L.; Tang, N.S.; Chan, S.F. Confidence interval construction for proportion difference in small-sample paired studies. Stat. Med. 2005, 24, 3565–3579. [Google Scholar] [CrossRef]
- ICH E10. Harmonised Tripartite Guideline. Choice of Control Group and Related Issues in Clinical Trials, International Conference on Harmonisation of Technical Requirements for Registration of Pharmaceuticals for Human Use; ICH Steering Committee: Geneva, Switzerland, 2000. [Google Scholar]
- Pigeot, I.; Schafer, J.; Rohmel, J.; Hauschke, D. Assessing non-inferiority of a new treatment in a three-arm clinical trial including a placebo. Stat. Med. 2003, 22, 883–899. [Google Scholar] [CrossRef]
- Tang, M.L.; Tang, N.S. Tests of Noninferiority via Rate Difference for Three-Arm Clinical Trials with Placebo. J. Biopharm. Stat. 2004, 14, 337–347. [Google Scholar] [CrossRef]
- Tang, N.S.; Yu, B.; Tang, M.L. Testing non-inferiroty of a new treatment in three-arm clinical trials with binary endpoints. BMC Med. Res. Methodol. 2014, 14, 134. [Google Scholar] [CrossRef] [PubMed] [Green Version]
- Hida, E.; Tango, T. On the three-arm non-inferiority trial including a placebo with a prespecified margin. Stat. Med. 2011, 30, 224–231. [Google Scholar] [CrossRef] [PubMed]
- Kwong, K.S.; Cheung, S.H.; Hayter, A.J.; Wen, M. Extension of three-arm non-inferiority studies to trials with multiple new treatments. Stat. Med. 2012, 31, 2833–2843. [Google Scholar] [CrossRef] [PubMed]
- Mu¨tze, T.; Konietschke, F.; Munk, A.; Friede, T. A studentized permutation test for three-arm trials in the ‘gold standard’ design. Stat. Med. 2017, 36, 883–898. [Google Scholar] [CrossRef] [PubMed] [Green Version]
- Newcombe, R.G. Interval estimation for the difference between independent proportions: Comparison of eleven methods. Stat. Med. 1998, 17, 873–890. [Google Scholar] [CrossRef]
- Li, H.Q.; Tang, M.L.; Poon, W.Y.; Tang, N.S. Confidence Intervals for Difference Between Two Poisson Rates. Commun. Stat.—Simul. Comput. 2011, 40, 1478–1493. [Google Scholar] [CrossRef]
- Tang, N.S.; Qiu, S.F.; Tang, M.L.; Zou, G.Y.; Yu, D. Simultaneous Confidence Intervals of Risk Differences in Stratified Paired Designs. J. Biopharm. Stat. 2013, 23, 361–377. [Google Scholar] [CrossRef]
- Tang, N.S.; Li, H.Q.; Tang, M.L.; Li, J. Confidence interval construction for the difference between two correlated proportions with missing observations. J. Biopharm. Stat. 2016, 26, 323–338. [Google Scholar] [CrossRef] [PubMed]
- Zhang, Y.Q.; Tang, N.S. Confidence intervals of the difference between areas under two ROC curves in matched-pair experiments. Stat. Med. 2020, 39, 2621–2638. [Google Scholar] [CrossRef]
- Weerahandi, S. Generalized confidence intervals. J. Am. Stat. Assoc. 1993, 88, 899–905. [Google Scholar] [CrossRef]
- Hanning, J.; Iyer, H.; Patterson, P. Fiducial generalized condifence intervals. J. Am. Stat. Assoc. 2006, 101, 254–269. [Google Scholar] [CrossRef]
- Hanning, J.; Iyer, H.; Lai, R.C.S.; Lee, T. Generalized fiducial inference: A review and new results. J. Am. Stat. Assoc. 2016, 111, 1346–1361. [Google Scholar] [CrossRef]
- Schaarschmidt, F. Simultaneous confidence intervals for multiple comparisons among expected values of log-normal variables. Comput. Stat. Data Anal. 2013, 58, 265–275. [Google Scholar] [CrossRef]
- Gamalo, M.A.; Muthukumarana, S.; Ghosh, P.; Tiwari, R.C. A generalized p-value approach for assessing noninferiority in a three-arm trial. Stat. Methods Med. Res. 2013, 22, 261–277. [Google Scholar] [CrossRef] [PubMed]
- Abdel-Karim, A. Applications of Generalized Inference. Doctoral Dissertation, Colorado State University, Fort Collins, CO, USA, 2005. [Google Scholar]
- Sadooghi-Alvandi, S.M.; Malekzadeh, A. Simultaneous confidence intervals for ratios of means of several lognormal distributions: A parametric bootstrap approach. Comput. Stat. Data Anal. 2014, 69, 133–140. [Google Scholar] [CrossRef]
- Howe, W.G. Approximate confidence limits on the mean of X + Y where X and Y are two tabled independent random variables. J. Am. Stat. Assoc. 1974, 69, 789–794. [Google Scholar] [CrossRef]
- Ghosh, S.; Ghosh, S.; Tiwari, R.C. Bayesian approach for assessing non-inferiority in a three-arm trial with pre-specified margin. Stat. Med. 2016, 35, 695–708. [Google Scholar] [CrossRef] [PubMed]
Publisher’s Note: MDPI stays neutral with regard to jurisdictional claims in published maps and institutional affiliations. |
© 2022 by the authors. Licensee MDPI, Basel, Switzerland. This article is an open access article distributed under the terms and conditions of the Creative Commons Attribution (CC BY) license (https://creativecommons.org/licenses/by/4.0/).