Abstract
Three-dimensional (3D) lane detection is widely used in image understanding, image analysis, 3D scene reconstruction, and autonomous driving. Recently, various methods for 3D lane detection from single two-dimensional (2D) images have been proposed to address inaccurate lane layouts in scenarios (e.g., uphill, downhill, and bumps). Many previous studies struggled in solving complex cases involving realistic datasets. In addition, these methods have low accuracy and high computational resource requirements. To solve these problems, we put forward a high-quality method to predict 3D lanes from a single 2D image captured by conventional cameras, which is also cost effective. The proposed method comprises the following three stages. First, a MobileNet model that requires low computational resources was employed to generate multiscale front-view features from a single RGB image. Then, a perspective transformer calculated bird’s eye view (BEV) features from the front-view features. Finally, two convolutional neural networks were used for predicting the 2D and 3D coordinates and respective lane types. The results of the high-reliability experiments verified that our method achieves fast convergence and provides high-quality 3D lanes from single 2D images. Moreover, the proposed method requires no exceptional computational resources, thereby reducing its implementation costs.
Keywords:
3D lane detection software from 2D image; tool for autonomous driving; 3D scene reconstruction software; deep learning software MSC:
90-00; 68-00; 51-00
1. Introduction
Large corporations, such as Tesla, Google, Uber, and Nvidia, have been developing autonomous vehicles. To explore different scenarios around these autonomous vehicles, they often employ several sensors, such as cameras, radar, sonar, and LiDAR. However, the main sensor, LiDAR, is quite expensive. Therefore, it is expected to be difficult to apply these systems widely in practice in the near future [1,2,3,4,5]. In contrast, camera-based autonomous driving systems are low-cost alternatives that use computer vision and deep learning techniques [6,7,8].
Three-dimensional (3D) lane detection from two-dimensional (2D) images is an important technique in camera-based autonomous driving applications. Additionally, 3D lane detection is also widely used in other applications including image understanding, image analysis, 3D scene reconstruction [6,7,8,9], and augmented reality applications of outdoor environments [10,11]. The 3D lanes and 3D-based object detection, localization, and tracking are applied in the perception and sensing systems of autonomous driving vehicles [9]. Several studies have investigated 3D lane estimation from single or multiple 2D images. However, these methods have low accuracy and high computational resource requirements (as discussed in Section 2).
MobileNets stands for efficient convolutional neural networks (CNN) for mobile vision applications [12]. This model is efficient for embedded and mobile vision applications. MobileNets, which are based on an elegant architecture, use depth-wise separable convolutions to construct lightweight deep neural networks. The model contains two global hyper-parameters that efficiently obtain a balance between latency and accuracy while choosing the right-sized model for their application relying on the problem constraint. Moreover, MobileNets require low computational resources, such as mobile devices, and exhibit high performance across various applications, including fine-grained classification, face attributes, object detection, and large-scale geolocalization.
Therefore, to overcome limitations such as low accuracy and high computational cost, we present a 3D lane detection method, which is inspired by PersFormer [13], using both a perspective transformer and MobileNets. The MobileNet-based spatial feature extraction reduces the high computational cost, and the spatial feature transformation module in the perspective transformer generates high-quality bird’s eye view (BEV) features from multiscale front-view features. The main contributions of our research are as follows: (1) a high-performance 3D lane detection method using medium hardware is proposed; and (2) the proposed method achieves fast convergence to reduce training time.
The remainder of this study is arranged as follows. A survey of literature related to 2D and 3D lane detection is discussed in Section 2. Section 3 details the proposed 3D lane detection method. The results of the high-reliability experiments and evaluations are presented in Section 4 consisting of both qualitative and quantitative measures. Finally, in Section 5, we provide conclusions and several potential directions for future work.
2. Related Works
The conventional 2D lane-detection method includes three stages. First, the semantic segmentation stage is employed to assign each pixel in a 2D image corresponding to a label to verify whether it places on a lane. Second, a spatial transformation stage projects the output of the image segmentation stage onto a plane surface. The third stage extracts 2D lanes using a lane model fitting with strong assumptions. The model fitting for quadratic curves is the most common model. Traditional 2D lane detection studies are based on image processing techniques, such as filtering [14,15] and clustering [16]. With developments in deep learning, several CNN-based approaches have significantly outperformed traditional methods. Many studies have considered 2D lane detection as a semantic segmentation problem [17,18,19,20,21]. For example, Neven et al. [19] introduced a binary segmentation method requiring a post-clustering process for lane instance discrimination. In addition, Lee et al. [17], Pan et al. [18], and Hou et al. [20] presented multiclass pixel-wise segmentation approaches that limit the maximum detection results in one frame but require large computational resources. Several lightweight methods have been proposed to reduce computational resources based on an effective grid [22,23,24,25] or anchor [26,27,28,29,30]. However, these methods are of poor quality. For example, grid-based research that finds lanes row-wise has a smaller resolution than that of the segmentation map. The model output is the probability of each cell being in a lane, and a vertical post-clustering process generates lane instances. In contrast, the anchor-based studies focus on the offsets optimization of the predefined line anchors, which is based on classical object detection. However, a critical problem which remains is defining these anchors. Chen et al. [26] selected vertical anchors, unsuitable for curving lane prediction, for overcoming this problem. In [27,29,30], anchors with slender tilt shapes were designed. In addition, the authors employed different anchors to improve the detection accuracy (albeit at the cost of increased computational resources).
For 3D lane detection, two trends exist. In the first trend, Nedevschi et al., Benmansour et al., and Bai et al. [31,32,33] employed multimodal or multiview high-cost sensors, such as a stereo camera or LiDAR, to obtain a 3D ground topology. The second involves adopting computer vision and deep learning using images captured from 2D cameras to reduce the cost. Based on the second trend, we put forward a novel method for predicting the 3D lanes.
The authors of [16,19,29] assumed that lanes in the BEV space are plane surfaces such that the lane height is zero. However, this assumption is inaccurate in most autonomous driving environmental scenarios that include uphill/downhill, bumps, and crush turns. Recently, some monocular methods [34,35,36,37] have employed inverse perspective mapping to predict lanes in 3D space from a single 2D image. For example, 3D-LaneNet [34] was a pioneering study with a simple end-to-end neural network. It uses a spatial transformer network [38] to create spatial feature projections but has moderate performance. Gen-LaneNet [35] builds on 3D-LaneNet consisting of a two-stage network for dividing the segmentation encoder and 3D lane generation. However, the Gen-LaneNet performance depends significantly on the binary segmentation stage accuracy, which degrades in extreme weather or night scenarios. 3D-LaneNet and Gen-LaneNet methods also exhibited low performance in curving or crush-turn scenarios. In contrast, the PersFormer method [13] provided better feature representation and optimized the anchor design to detect 2D and 3D lanes. PersFormer is an end-to-end monocular lane detector with a spatial-feature transformation module, that creates BEV features by attending to connected front-view local regions, using camera parameters as a reference. However, the PersFormer method has high computational resource requirements and long convergence times. To overcome the problems of PersFormer and maintain high performance, we propose a method that combines the perspective transformer with MobileNet.
3. Proposed Methods
3.1. System Overview
From an input image I ∈ RH×W, the proposed method generates a set of 3D lanes as follows:
where H × W is the resolution of the input image in pixels and N is the total number of 3D lanes in the predefined BEV range. Mathematically, each 3D lane li is represented by an ordered set of 3D coordinates as follows:
where i is the lane index and Ni is the total number of sample points in lane li.
L3D = {l1, l2, l3, …, lN},
li = [(x1, y1, z1), (x2, y2, z2), …, (xNi, yNi, zNi)],
The overall of the proposed framework is illustrated in Figure 1. The proposed framework includes three stages: feature extraction, perspective transformation, and lane detection postprocessing. The feature extraction stage uses single 2D images as the input. The input image is passed through a preprocessing step before being fed to the MobileNet model to obtain multiscale front-view features. In the second stage, the perspective transformer module uses the front-view features from the first stage to generate BEV features by attending to the local context and aggregating the surrounding features to form a robust representation. In this module, inverse perspective mapping from the front view to the BEV was performed. In the third stage, the lane detection module generates the coordinates, and types of 2D and 3D lanes. 2D lane detection is inherited from the LaneATT [30] model to increase the accuracy of 3D lane prediction. The 3D lane detection is referred to as the 3D-LaneNet [34] model, and it is obtained by modifying the structure and anchor design similar to PersFormer [13] method. After each iteration, the networks are fine-tuned based on PersFormer and we trained the system until 2D and 3D predictions are perfected. After training, the proposed system was used to retrieve high-quality 3D lanes from single red-blue-green (RGB) images. The main steps of the proposed method are detailed below.
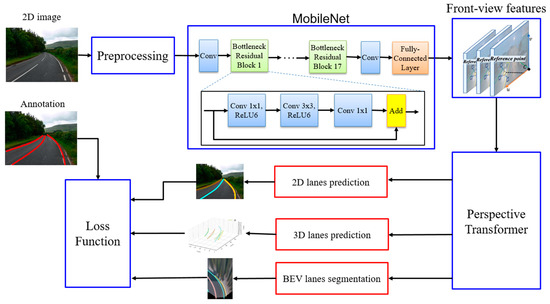
Figure 1.
Proposed method for 3D lane detection.
3.2. Feature Extraction
The target of the feature extraction stage is similar to that of the backbone module in other methods [13,34,35]. However, we focus on a lightweight model with low computational resource requirements to maintain the front-view feature quality. Therefore, we designed the feature extraction stage differently from previous models by scaling up the input image size before feeding it to the MobileNet that serves as the backbone network. After moving through several convolution layers, the feature extraction stage generates four different scaled front-view feature maps with pixel resolutions of 180 × 240, 90 × 120, 45 × 60, and 22 × 30 pixels. Next, all front-view feature maps are transformed into the corresponding BEV-space feature maps using a perspective transformer.
3.3. Three-Dimensional Lane Detection
Most previous studies have focused on 2D and 3D lane detection separately. However, they are not mutually exclusive. Hence, we used 2D lane prediction to support 3D lane detection using the loss function. Based on PersFormer, the proposed method designs anchors to optimize feature sharing across 2D and 3D domains. In BEV space, a point (x, y) casts the corresponding point (u, v) in front view space through intermediate state (x0, y0). By learning offsets, the network learns target-reference points mapping from BEV space to front-view space. We employed seven groups of anchors sampled with different inclination angles in the BEV space and projected them onto the front view. The inclination angles consist of π/2, arctan (±0.5), arctan (±1), and arctan (±2), respectively.
3.4. Loss Function
We summarize the overall loss to fine-tune the networks in the proposed method. From the 2D input image and ground-truth labels, we computed the sum of losses of all of the anchors. The total loss is a combination of the 3D lane detection , 2D lane detection and intermediate segmentation with different factors α, β, and γ, respectively, as shown in Equation (3). Since this study focuses on 3D lane prediction, α was the highest, followed by β and γ.
and comprises classification loss, regression loss, and visibility loss, as shown in Equations (4) and (5), respectively. and are the predicted lane categories in the 3D and 2D domains, respectively. Each loss type had a corresponding factor, ,, and for 3D loss, and ,, and for 2D loss. The classification loss is the cross-entropy loss . The regression loss is the L1 loss, and the visibility loss is a binary cross-entropy loss .
The segmentation loss is also a binary cross-entropy loss between the prediction and ground-truth segmentation maps, respectively, as follows:
4. Experiments
To verify the high reliability of the proposed 3D lanes detection method both qualitatively and quantitatively, we conducted several experiments. In addition, the performance of our 3D lanes detection method was compared with that of several ultra-modern studies.
OpenLane dataset [13] is the first real-world 3D lane dataset and currently the largest scale compared with the existing benchmarks. We used OpenLane for both qualitative and quantitative experiments. The OpenLane was constructed on top of the influential Waymo Open dataset [39] by following the same data format. It comprises 200,000 frames and over 880,000 high-accuracy annotated lanes with 14 category labels, including single white dash, double yellow solid, and left/right curbside. In addition, the OpenLane dataset contains six sub-datasets: curve case, up and down case, night case, extreme weather case, merge and split case, and intersection case.
We run the experiments on a medium server with four NVIDIA TitanX GPUs with the Ubuntu 16.04 operating system and Cuda 10.2 version. Moreover, we employed PyTorch 1.8.0 as a deep learning library. The Adam optimizer was used along with a batch size of 2. We scale up the input image size by 1.5 times before feeding to the MobileNet. Base on experiments, α, β and γ were set to 10, 4 and 1, respectively. Other parameters are based on the model in [13]. The training time for the OpenLane dataset was approximately 3 days with 10 epochs.
4.1. Qualitative Results
Figure 2, Figure 3 and Figure 4 show the 2D and 3D results of the six sub-datasets. In all six cases, the results were predicted accurately from the corresponding RGB images. Columns (a) and (c) show 2D results, and columns (b) and (d) show the 3D results compared with the ground truth of the 3D lanes. The resulting 3D lanes show that the proposed method has the ability to predict 3D lanes close to the ground-truth data. In some special cases, when the lanes are covered by vehicles or the lanes are not clear, the proposed method has some missing lanes.
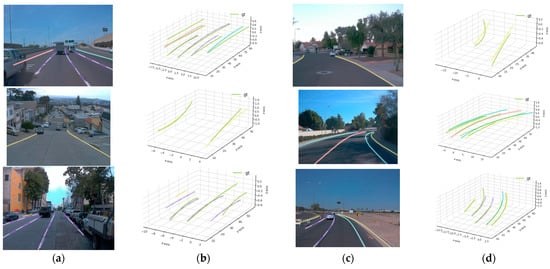
Figure 2.
Results of 2D and 3D lanes obtained from the proposed method: (a) 2D results of up and down case; (b) 3D results of up and down case; (c) 2D results of curve case; (d) 3D results of curve case.
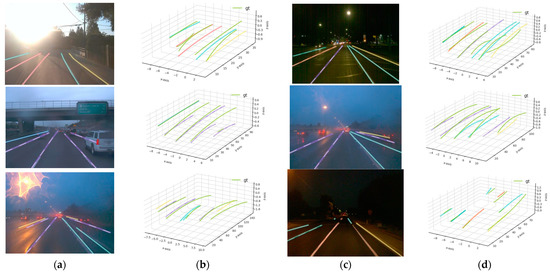
Figure 3.
Results of 2D and 3D lanes obtained from the proposed method: (a) 2D results of extreme weather case; (b) 3D results of extreme weather case; (c) 2D results of night case; (d) 3D results of night case.
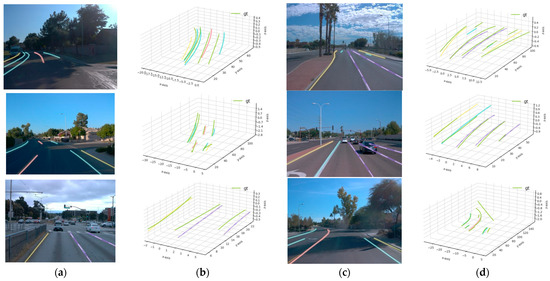
Figure 4.
Results of 2D and 3D lanes obtained from the proposed method: (a) 2D results of intersection case; (b) 3D results of intersection case; (c) 2D results of the merge and split case; (d) 3D results of merge and split case.
Figure 5, Figure 6, Figure 7, Figure 8 and Figure 9 show qualitative comparisons between our method and ultra-modern PersFormer, 3D-LaneNet, and Gen-LaneNet methods for the six sub-datasets of OpenLane. In all cases, the proposed method performed significantly better than Gen-LaneNet and 3D-LaneNet. Besides, the proposed method can provide lane-type and subtle curbside information, which is missing in Gen-LaneNet and 3D-LaneNet. Moreover, the proposed method shows better qualitative performance than PersFormer which is the best current ultra-modern model. Under a straight-road scenario, PersFormer and the proposed method provided similar quality. Nevertheless, the proposed method shows improved performance for difficult cases, such as the up and down, curve, extreme weather, and merge and split cases.
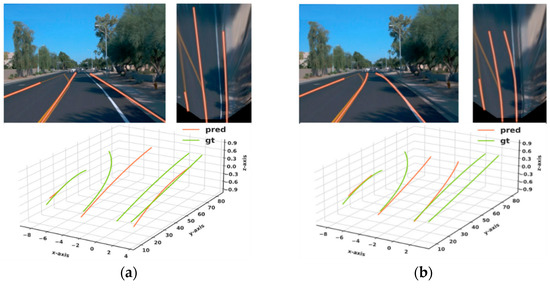
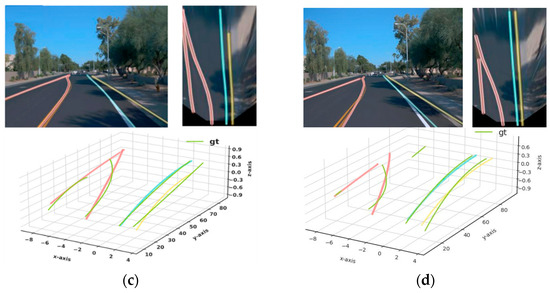
Figure 5.
Qualitative comparison between (a) 3D-LaneNet [34], (b) Gen-LaneNet [35], (c) PersFormer [13], and (d) proposed method on the merge and split case.
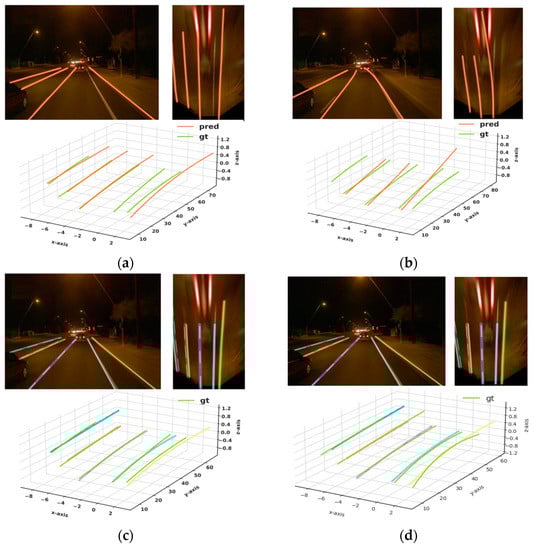
Figure 6.
Qualitative comparison between: (a) 3D-LaneNet [34], (b) Gen-LaneNet [35], (c) PersFormer [13], and (d) proposed method on night case.
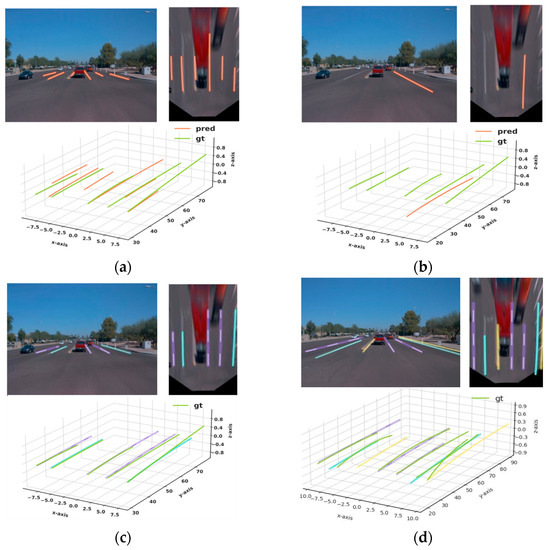
Figure 7.
Qualitative comparison between: (a) 3D-LaneNet [34], (b) Gen-LaneNet [35], (c) PersFormer [13], and (d) proposed method on intersection case.
Figure 8.
Qualitative comparison between: (a) 3D-LaneNet [34], (b) Gen-LaneNet [35], (c) PersFormer [13], and (d) proposed method on weather case.
Figure 9.
Qualitative comparison between (a) 3D-LaneNet [34], (b) Gen-LaneNet [35], (c) PersFormer [13], and (d) proposed method on curve case.
4.2. Quantitative Results
To evaluate the 3D lane quality, we compared predicted data with ground-truth 3D lanes by calculating both accuracy and error values. We employed eight commonly used performance measures: F-score, recall, precision, category accuracy, error near/far of x and z, respectively. The F-score demonstrates the relationship between true positives, false positives, and false negatives. Relying on PersFormer, the match between the prediction and ground truth was built based on the edit distance. A generated lane is considered true positive only if more than 75% of the lane’s wrapped y-positions have a point-wise distance smaller than the maximum distance limit. In the experiments, the max-allowed distance was set to 1.5 m. Recall (Equation (7)) and precision (Equation (8)) were investigated by relying on the percentage of matched ground-truth and predicted 3D lanes. Using recall and precision, we calculate F-score (Equation (9)), which is the most important value for evaluating performance measures. Thus, the F-score illustrates the regression performance of deep learning models based on recall and precision values. In addition, the OpenLane dataset has category information per lane. Hence, we evaluated the accuracy of the matched lanes, referred as category accuracy, to show classification performance. Finally, the x and z error near are used to calculate the start and estimated end point errors of the predicted 3D lanes.
Table 1 lists results of eight quantitative measures of the proposed method. The best F-score is obtained for the curved case (53.6%), followed by recall (54.2%) and category accuracy (93.2%). The merge and split case has the best precision (54.7%), x error far (0.733 m), and z error far (0.62 m). In contrast, the extreme weather case achieved the best x error near (0.275 m) and z error near (0.141 m). The intersection case has the worst F-score, recall, precision, category accuracy, x error near, and z error near measures considering the difficulty in predicting the 3D lanes. Among all of the measures, the up and down case obtained the two worst measures (x and z error far) due to the large height difference between the start and end points in one lane.

Table 1.
Results of eight quantitative measures of the proposed method.
To verify the high reliability of the proposed method, we checked the quantitative performance of the proposed method against other ultra-modern methods on the OpenLane dataset. Table 2 and Table 3 illustrate the comparison results for the entire validation and six scenario sets, respectively. The scenario sets comprising the curve, up and down, night, extreme weather, merge and split, and intersection cases were selected from the validation set based on the scene tags of each frame.
Table 2.
The comparison results in both accuracy and error values.
Table 3.
The comparison results in accuracy measure. Proposed method achieves the best F-score on 4/6 scenario sets. The best scores are marked in bold.
The proposed method outperforms the Gen-LaneNet, 3D-LaneNet, and PersFormer methods in F-score by 18.2%, 7.7%, and 0.1%, respectively (Table 2). However, the proposed method overlooks the near and far error metrics on the x- and z-axis since it is more suitable for fitting the main body of a lane rather than the start and end points. Moreover, the proposed method also obtains the best F-score on 4/6 scenario sets, except for the night and intersection cases (Table 3).
3D-LaneNet and Gen-LaneNet failed to support category classification. Therefore, we only report the category accuracy of the proposed method and PersFormer. When we run with significantly lower computational resources than PersFormer, the category accuracy of our method is quite lower than that of PersFormer, as in Table 4. However, the category accuracy of our method was similar to that of PersFormer when using similar resources. In addition, the proposed method converged faster than the PersFormer, and the training time was 10 times shorter than that of PersFormer under similar conditions. Overall, the proposed method achieves the best performance in 3D lane detection compared with other researches.
Table 4.
Computational resources of proposed method and PersFormer.
5. Conclusions
We propose an approach to extract 3D lanes from a single 2D RGB image of an outdoor scene for applications, such as autonomous vehicles. To solve both the limitations of low accuracy and high computational cost, we implemented a three-stage PersFormer-based method using perspective transformation and MobileNets to generate 3D lanes. The results of the experiments verify that the proposed 3D lanes detection method has ability to create high-quality 3D data from a single 2D image. The efficiency of our method is evaluated on a common server with four TitanX GPUs. Compared with the ultra-modern 3D lane detection approaches, the proposed method obtains the best performance in quantitative analyses and visual assessment. Moreover, the proposed method limits the need for high computational resources, such as high-end GPUs. In some special cases, when the lanes are covered by vehicles or the lanes are not clear, the proposed method has some missing lanes. In the future, we will enhance the feature extraction stage to get higher category accuracy and expand the proposed model to build accumulated 3D lanes from multiple frames. Additionally, we will compare our method with more relevant works to verify the performance in both qualitative and quantitative terms.
Author Contributions
Methodology, M.L.; software, P.M.C.; validation, M.L.; writing—original draft preparation, P.M.C.; writing—review and editing, M.L., P.M.C. and K.C.; visualization, M.L.; funding acquisition, K.C. All authors have read and agreed to the published version of the manuscript.
Funding
This work was supported by Korea Institute of Police Technology (KIPoT) grant funded by the Korea government (KNPA) (No. 092021D75000000, AI driving ability test standardization and evaluation process development.
Data Availability Statement
In Publicly available datasets were analyzed in this study. This data can be found here: https://github.com/OpenPerceptionX/OpenLane [13] (accessed on 2 July 2022).
Conflicts of Interest
The authors declare no conflict of interest.
References
- Chu, P.M.; Cho, S.; Fong, S.; Park, Y.W.; Cho, K. 3D Reconstruction Framework for Multiple Remote Robots on Cloud System. Symmetry 2017, 9, 55. [Google Scholar] [CrossRef]
- Chu, P.; Cho, S.; Sim, S.; Kwak, K.; Cho, K. A Fast Ground Segmentation Method for 3D Point Cloud. J. Inf. Process. Syst. 2017, 13, 491–499. [Google Scholar]
- Chu, P.M.; Cho, S.; Sim, S.; Kwak, K.; Cho, K. Multimedia System for Real-Time Photorealistic Nonground Modeling of 3D Dynamic Environment for Remote Control System. Symmetry 2018, 10, 83. [Google Scholar] [CrossRef]
- Li, Y.; Ibanez-Guzman, J. Lidar for autonomous driving: The principles, challenges, and trends for automotive lidar and perception systems. IEEE Signal Process. Mag. 2020, 37, 50–61. [Google Scholar] [CrossRef]
- Vargas, J.; Alsweiss, S.; Toker, O.; Razdan, R.; Santos, J. An overview of autonomous vehicles sensors and their vulnerability to weather conditions. Sensors 2021, 21, 5397. [Google Scholar] [CrossRef] [PubMed]
- Ravindran, R.; Santora, M.J.; Jamali, M.M. Multi-object detection and tracking, based on DNN, for autonomous vehicles: A review. IEEE Sens. J. 2020, 21, 5668–5677. [Google Scholar] [CrossRef]
- Chu, P.M.; Sung, Y.; Cho, K. Generative Adversarial Network-Based Method for Transforming Single RGB Image Into 3D Point Cloud. IEEE Access 2019, 7, 1021–1029. [Google Scholar] [CrossRef]
- Kuramoto, A.; Aldibaja, M.A.; Yanase, R.; Kameyama, J.; Yoneda, K.; Suganuma, N. Mono-camera based 3D object tracking strategy for autonomous vehicles. In Proceedings of the 2018 IEEE Intelligent Vehicles Symposium (IV), Changshu, China, 26–30 June 2018; pp. 459–464. [Google Scholar]
- Zhang, H.; Ji, H.; Zheng, A.; Hwang, J.N.; Hwang, R.H. Monocular 3D localization of vehicles in road scenes. In Proceedings of the IEEE/CVF International Conference on Computer Vision, Montreal, Canada, 11–17 October 2021; pp. 2855–2864. [Google Scholar]
- Efrat, N.; Bluvstein, M.; Oron, S.; Levi, D.; Garnett, N.; Shlomo, B.E. 3D-Lanenet+: Anchor free lane detection using a semi-local representation. arXiv 2020, arXiv:2011.01535. [Google Scholar]
- Minaee, S.; Liang, X.; Yan, S. Modern Augmented Reality: Applications, Trends, and Future Directions. arXiv 2022, arXiv:2202.09450. [Google Scholar]
- Howard, A.G.; Zhu, M.; Chen, B.; Kalenichenko, D.; Wang, W.; Weyand, T.; Andreetto, M.; Adam, H. Mobilenets: Efficient convolutional neural networks for mobile vision applications. arXiv 2017, arXiv:1704.04861. [Google Scholar]
- Chen, L.; Sima, C.; Li, Y.; Zheng, Z.; Xu, J.; Geng, X.; Li, H.; He, C.; Shi, J.; Qiao, Y.; et al. PersFormer: 3D Lane Detection via Perspective Transformer and the OpenLane Benchmark. arXiv 2022, arXiv:2203.11089. [Google Scholar]
- Aly, M. Real time detection of lane markers in urban streets. In Proceedings of the 2008 IEEE Intelligent Vehicles Symposium (IV), Eindhoven, The Netherlands, 4–6 June 2008; pp. 7–12. [Google Scholar]
- Li, Z.Q.; Ma, H.M.; Liu, Z.Y. Road lane detection with gabor filters. In Proceedings of the 2016 International Conference on Information System and Artificial Intelligence, Hong Kong, China, 24–26 June 2016; pp. 436–440. [Google Scholar]
- Wang, J.; Mei, T.; Kong, B.; Wei, H. An approach of lane detection based on inverse perspective mapping. In Proceedings of the 17th International IEEE Conference on Intelligent Transportation Systems, Qingdao, China, 8–11 October 2014; pp. 35–38. [Google Scholar]
- Lee, S.; Kim, J.; Yoon, J.S.; Shin, S.; Bailo, O.; Kim, N.; Lee, T.H.; Hong, H.S.; Han, S.H.; Kweon, I.S. Vpgnet: Vanishing point guided network for lane and road marking detection and recognition. In Proceedings of the IEEE International Conference on Computer Vision, Venice, Italy, 22–29 October 2017; pp. 1947–1955. [Google Scholar]
- Pan, X.; Shi, J.; Luo, P.; Wang, X.; Tang, X. Spatial as deep: Spatial cnn for traffic scene understanding. In Proceedings of the AAAI Conference on Artificial Intelligence, New Orleans, LA, USA, 2–7 February 2018; pp. 7276–7283. [Google Scholar]
- Neven, D.; Brabandere, B.D.; Georgoulis, S.; Proesmans, M.; Gool, L.V. Towards end-to-end lane detection: An instance segmentation approach. In Proceedings of the 2018 IEEE Intelligent Vehicles Symposium(IV), Suzhou, China, 26–30 June 2018; pp. 286–291. [Google Scholar]
- Hou, Y.; Ma, Z.; Liu, C.; Loy, C.C. Learning lightweight lane detection CNNs by self attention distillation. In Proceedings of the IEEE/CVF International Conference on Computer Vision, Seoul, Korea, 27 October–2 November 2019; pp. 1013–1021. [Google Scholar]
- Abualsaud, H.; Liu, S.; Lu, D.B.; Situ, K.; Rangesh, A.; Trivedi, M.M. Laneaf: Robust multi-lane detection with affinity fields. IEEE Robot. Autom. Lett. 2021, 6, 7477–7484. [Google Scholar] [CrossRef]
- Qin, Z.; Wang, H.; Li, X. Ultra fast structure-aware deep lane detection. In Proceedings of the European Conference on Computer Vision, Glasgow, UK, 23–28 August 2020; pp. 276–291. [Google Scholar]
- Liu, L.; Chen, X.; Zhu, S.; Tan, P. Condlanenet: A top-to-down lane detection framework based on conditional convolution. In Proceedings of the IEEE/CVF International Conference on Computer Vision, Montreal, QC, Canada, 11–17 October 2021; pp. 3773–3782. [Google Scholar]
- Jayasinghe, O.; Anhettigama, D.; Hemachandra, S.; Kariyawasam, S.; Rodrigo, R.; Jayasekara, P. Swiftlane: Towards fast and efficient lane detection. In Proceedings of the 2021 20th IEEE International Conference on Machine Learning and Applications, Pasadena, CA, USA, 13–15 December 2021; pp. 859–864. [Google Scholar]
- Qu, Z.; Jin, H.; Zhou, Y.; Yang, Z.; Zhang, W. Focus on local: Detecting lane marker from bottom up via key point. In Proceedings of the IEEE/CVF Conference on Computer Vision and Pattern Recognition, Montreal, QC, Canada, 11–17 October 2021; pp. 14122–14130. [Google Scholar]
- Chen, Z.; Liu, Q.; Lian, C. Pointlanenet: Efficient end-to-end CNNs for accurate real-time lane detection. In Proceedings of the 2019 IEEE Intelligent Vehicles Symposium (IV), Paris, France, 9–12 June 2019; pp. 2563–2568. [Google Scholar]
- Li, X.; Li, j.; Hu, X.; Yang, J. Line-cnn: End-to-end traffic line detection with line proposal unit. IEEE Trans. Intell. Transp. Syst. 2019, 21, 248–258. [Google Scholar] [CrossRef]
- Xu, H.; Wang, S.; Cai, X.; Zhang, W.; Liang, X.; Li, Z. Curvelane-nas: Unifying lane-sensitive architecture search and adaptive point blending. In Proceedings of the European Conference on Computer Vision, Glasgow, UK, 23–28 August 2020; pp. 689–704. [Google Scholar]
- Su, J.; Chen, C.; Zhang, K.; Luo, J.; Wei, X.; Wei, X. Structure guided lane detection. In Proceedings of the Thirtieth International Joint Conference on Artificial Intelligence, Montreal, QC, Canada, 19–26 August 2021; pp. 997–1003. [Google Scholar]
- Tabelini, L.; Berriel, R.; Paixao, T.M.; Badue, C.; Souza, A.F.D.; Oliveira-Santos, T. Keep your eyes on the lane: Real-time attention-guided lane detection. In Proceedings of the IEEE/CVF Conference on Computer Vision and Pattern Recognition, Montreal, QC, Canada, 11–17 October 2021; pp. 294–302. [Google Scholar]
- Nedevschi, S.; Schmidt, R.; Graf, T.; Danescu, R.; Frentiu, D.; Marita, T.; Oniga, F.; Pocol, C. 3D lane detection system based on stereovision. In Proceedings of the 7th International IEEE Conference on Intelligent Transportation Systems (IEEE Cat. No. 04TH8749), Washington, DC, USA, 3–6 October 2004; pp. 161–166. [Google Scholar]
- Benmansour, N.; Labayrade, R.; Aubert, D.; Glaser, S. Stereovision-based 3D lane detection system: A model driven approach. In Proceedings of the 2008 11th International IEEE Conference on Intelligent Transportation Systems, Beijing, China, 12–15 October 2008; pp. 182–188. [Google Scholar]
- Bai, M.; Mattyus, G.; Homayounfar, N.; Wang, S.; Lakshmikanth, S.K.; Urtasun, R. Deep multi-sensor lane detection. In Proceedings of the 2018 IEEE/RSJ International Conference on Intelligent Robots and Systems, Madrid, Spain, 1–5 October 2018; pp. 3102–3109. [Google Scholar]
- Garnett, N.; Cohen, R.; Pe’er, T.; Lahav, R.; Levi, D. 3D-Lanenet: End-to-end 3D multiple lane detection. In Proceedings of the IEEE/CVF International Conference on Computer Vision, Seoul, Korea, 27 October–2 November 2019; pp. 2921–2930. [Google Scholar]
- Guo, Y.; Chen, G.; Zhao, P.; Zhang, W.; Miao, J.; Wang, J.; Choe, T.E. Gen-Lanenet: A generalized and scalable approach for 3d lane detection. In Proceedings of the European Conference on Computer Vision, Glasgow, UK, 23–28 August 2020; pp. 666–681. [Google Scholar]
- Jin, Y.; Ren, X.; Chen, F.; Zhang, W. Robust monocular 3D lane detection with dual attention. In Proceedings of the 2021 IEEE International Conference on Image Processing, Anchorage, AK, USA, 19–22 September 2021; pp. 3348–3352. [Google Scholar]
- Liu, R.; Chen, D.; Liu, T.; Xiong, Z.; Yuan, Z. Learning to predict 3D lane shape and camera pose from a single image via geometry constraints. In Proceedings of the AAAI Conference on Artificial Intelligence, Vancouver, BC, Canada, 22 February–1 March 2022; pp. 1765–1772. [Google Scholar]
- Jaderberg, M.; Simonyan, K.; Zisserman, A.; Kavukcuoglu, K. Spatial transformer networks. Adv. Neural Inf. Process. Syst. 2015, 28, 2017–2025. [Google Scholar]
- Sun, P.; Kretzschmar, H.; Dotiwalla, X.; Chouard, A.; Patnaik, V.; Tsui, P.; Guo, J.; Zhou, Y.; Chai, Y.; Caine, B.; et al. Scalability in perception for autonomous driving: Waymo open dataset. In Proceedings of the IEEE/CVF Conference on Computer Vision and Pattern Recognition, Seattle, WA, USA, 14–19 June 2020; pp. 2446–2454. [Google Scholar]
Publisher’s Note: MDPI stays neutral with regard to jurisdictional claims in published maps and institutional affiliations. |
© 2022 by the authors. Licensee MDPI, Basel, Switzerland. This article is an open access article distributed under the terms and conditions of the Creative Commons Attribution (CC BY) license (https://creativecommons.org/licenses/by/4.0/).