Abstract
COVID-19 has shaken the entire world economy and affected millions of people in a brief period. COVID-19 has numerous overlapping symptoms with other upper respiratory conditions, making it hard for diagnosticians to diagnose correctly. Several mathematical models have been presented for its diagnosis and treatment. This article delivers a mathematical framework based on a novel agile fuzzy-like arrangement, namely, the complex fuzzy hypersoft () set, which is a formation of the complex fuzzy (CF) set and the hypersoft set (an extension of soft set). First, the elementary theory of is developed, which considers the amplitude term (A-term) and the phase term (P-term) of the complex numbers simultaneously to tackle uncertainty, ambivalence, and mediocrity of data. In two components, this new fuzzy-like hybrid theory is versatile. First, it provides access to a broad spectrum of membership function values by broadening them to the unit circle on an Argand plane and incorporating an additional term, the P-term, to accommodate the data’s periodic nature. Second, it categorizes the distinct attribute into corresponding sub-valued sets for better understanding. The set and -mapping with its inverse mapping (INM) can manage such issues. Our proposed framework is validated by a study establishing a link between COVID-19 symptoms and medicines. For the COVID-19 types, a table is constructed relying on the fuzzy interval of . The computation is based on -mapping, which identifies the disease and selects the optimum medication correctly. Furthermore, a generalized -mapping is provided, which can help a specialist extract the patient’s health record and predict how long it will take to overcome the infection.
Keywords:
COVID-19; disease modelling; complex numbers (C-numbers); complex fuzzy hypersoft set; mapping; inverse mapping MSC:
03E72; 68U35
1. Introduction
COVID-19 marked itself on the world’s map at the end of 2019 in the Hunan Seafood market of Wuhan district (Hubei, China) [1]. After a few days, deep sequencing analysis of the samples taken from the infected patients’ lower respiratory tract led to identifying a novel virus that belonged to the Severe Acute Respiratory Syndrome. From there, it was given the name SARS-CoV-2 and was found to be the infection-causing agent of the pneumonia clusters observed in the infected patients [2]. The coronavirus family is thought to be the cause of sickness in both animals and humans, according to [3]. A total of seven family members of the Coronavirus family can produce infection in humans. The most common infection causative agents in humans out of these viruses are namely: 229E, HKU1, NL63, and OC43 [1].
Machine learning and deep learning methods are widely used for COVID-19 diagnostics (see, for example, [4,5,6]), severity prediction [7], and spread prediction [8,9]. The overview of these methods can be found in review papers [10,11]. Fuzzy-logic-based methods have also been applied extensively for disease diagnostics with various examples ranging from advice on the common cold [12] to Huntington’s disease [13].
Conventional methods are insufficient to solve multidimensional challenges in the environment, economics, engineering, and robotics. The four theories discussed here that specialize in solving these types of problems include the fuzzy set theory Zadeh [14], interval mathematics [15], the probability set theory [16], and the rough set theory Pawlak [17]. They are widely used in various fields such as statistics, machine learning, and artificial intelligence. Liu et al. [18] characterized the concept of a correlation coefficient between hesitant fuzzy sets and applied it for medical diagnoses. Molodtsov [19] showed that soft set (SS) theory has significant applications in the fields of data mining, medical imaging, Riemann integration, game theory, and pattern recognition. Soft sets were initially deployed by Maji et al. [20] to handle judgment call dilemmas. S-sets and associated variants are relevant according Yang et al. [21]. The paradigm of imprecise SS and its various forms was established by Maji et al. [22]. Kharal et al. [23,24] established the concepts of mappings on fuzzy soft subclasses and soft classes. They deployed examples and empirical evidence to explore the preservation of the image of fuzzy soft sets and soft sets. In [25], Karaaslan investigated the word smooth class and its relevant functions. Alkhazaleh et al. [26] developed the concepts of a mapping on classes and categorised neutrosophic soft set collections into single-valued neutrosophic classes and also explored and identified a single-valued neutrosophic image and neutrosophic soft images of neutrosophic soft sets. Ropiak [27] combined rough set based granular computing with deep learning methods, which allowed for the improvement of knowledge extraction.
The notion of mappings over collections of multifunctional fuzzy soft sets was pioneered by Sulaiman et al. [28]. They focused on a few factors linked to the image and INI of multi-aspect fuzzy soft sets and demonstrated their findings with numerical examples. The concept of mappings between picture fuzzy soft sets and an intuitionistic fuzzy soft set and INI was defined by Bashir and Salleh [29].
Samarandache [30] offered the fuzzified hypersoft (FHS) and hypersoft sets (HS) as modifications of fuzzy soft and soft settings. Saeed et al. [31,32,33,34], Zulqarnain et al. [35], Martin et al. [36], Musa et al. [37], Ajay et al. [38], and Debnath et al. [39] discussed the basics of the HS and their entire mappings in an HS environment, as well as their exposition of the HS in object classification, cell imaging, and multi-eligibility requirements. Ramot et al. [40] proposed an extensive analysis of the mathematical properties of the CF set. Elementary predetermined operations on CF sets were studied, including CF complement, union, and intersection. Thirunavukarasu et al. [41] examined the intuitive understanding of a soft CF set’s aggregation operation. They also illustrated uses for consolidation techniques, demonstrating that the approach may be successfully used in a wide range of circumstances including uncertainty and periodicities. In 2020, Rahman et al. [42] combined two major theories complex set and hypersoft set in a fuzzy setting: a sophisticated neutrosophic set, and a complex intuitionistic imprecise information given to build hypersoft mixtures.
The paradigm of a complex multi-fuzzy collection, which is a fusion of CF collections and multi-fuzzy defines, was established by Al-Qudah et al. [43]. Their developed scheme would indeed be equipped to deal with instabilities, ambiguities, and evaluation based of two-dimensional cross inputs by continuously storing the magnitude and P-terms of the C-numbers.
The main objective of this study is to simulate a feasible type of situation of COVID-19-specific diagnosis, as well as to ensure an effective treatment because it is difficult to distinguish other upper-respiratory infections from COVID-19 using existing theoretical and empirical models and techniques [23,24,44,45] because these techniques are restrained from finalizing configurations. The above mentioned strategies are inadequate to thoroughly assess the data to gain a more substantial insight and correct diagnosis. To remedy this defect, these foundations are coupled into a multifaceted system composed of a fuzzy output and a hypersoft (HS) setting.
This approach is far more flexible in two main ways. To continue, it extends the to obtain a new term ’P-term’ to support the statement’s reoccurring aspect, permitting a broad range of weighted parameters. They cannot keep up in two-dimensional quantities to the unit circle in an image plane. Furthermore, the traits can be further grouped into sub-values to enhance explanation. A mapping is a correlation between the two or more segments which is handled by guidelines that transfer an embedding feature to its underpinning normative considered appropriate predicated on subsystem and subsurface properties. This tool enables comparable inputs to be treated by a single basic value. The goal of the research is to investigate COVID-19 treatments in the community, as well as the manifestations that correlate with them. It is impossible to discern which characteristic of COVID-19 is causing issues and how substantial it is after gazing at the COVID-19 health consequences. To reduce this issue, the set and -mapping with its INM are often used.
When linked with scientific modelling, these concepts are effective and crucial for appropriately addressing the issues. A table based on the fuzzy region among is constructed for the diverse strains of COVID-19. The approaches rely on -mapping and would be used to create an index that indicates the ailment and then decides the correct diagnosis. In addition, a detailed -mapping, which will support a practitioner in estimating the time before the symptoms are alleviated, is established.
The main contributions and the advantages of the proposed method can be summarized as follows:
- The adopted model is more flexible and consistent as compared to existing fuzzy soft set-like models because it is capable of managing the following limitations of the existing literature collectively as a single model:
- (a).
- Uncertainties involved in the approximation of alternatives.
- (b).
- Periodic nature of the data.
- (c).
- Consideration of sub-parametric values as disjointed classes.
- (d).
- Entitlement of multi-argument approximate function.
It tackles first issue by assigning a fuzzy membership grade to each alternative corresponding to parameters, the second by considering phase and amplitude terms, and the third and fourth by considering the hypersoft setting. Thus it leads to constructing a reliable decision support system by addressing these issues collectively. - An intelligent algorithm is proposed that aims to support problem-solving for an early assortment of alternatives and identify sufferers with conflicting medical indications.
- This exploration demonstrates a well-built association between the signs and mathematically records them to ample concern. The scheme is assembled on trimming set designs that can predict a patient’s state and estimate medical indications over time to analyze a medicine’s health effects. It can be carried out to foresee the contagion’s reinfection parameters in anticipation that the infection is cured. In the upcoming outlook, such pattern recognition-based algorithms are proposed to diminish medical inaccuracies and receive inspiring results depending on various patient configurations.
2. Implementation of Set for COVID-19
This section’s primary focus is to analyze the highlighted problem related to COVID-19. The analysis is based on the cause of the disease, its symptoms, diagnosis, and treatment of patients. mapping and inverse mapping are applied for precise and accurate analysis and suggest a procedure policy purely based on mathematical strategies presented in this article.
2.1. COVID-19 and Its Variants
With the passage of time, scientists have identified numerous variants of COVID-19 as it has evolved. There are many distinct forms of coronaviruses, but just four are discussed below.
The first is SARS, also known as Severe Acute Respiratory Syndrome, whose causative agent also belongs to the coronavirus family. The SARS-CoV virus has a zoonotic origin, targets the lungs, and causes acute respiratory problems. It was the first virus whose virology or genetic sequence was remotely similar to the COVID-19 virus upon the first examination.
SARS-CoV-2 or COVID-19 is responsible for the pandemic that started back in 2019. As explained in the introduction, it also hinders respiratory functions and is renowned as the successor of the SARS-CoV-1 virus by the US National Institutes of Health.
MERS, or Middle Eastern Respiratory Syndrome, also belongs to the coronavirus family. It first presented itself in the Middle Eastern countries of Asia around 2012, and it is called MERS or the Camel Flu. Its symptoms are quite similar to those of the COVID-19 virus, but the most prominent are mild to high fever, shortness of breath, diarrhea, and cough. MERS is regarded as more severe when compared with other diseases.
The OC43(HCoV-OC43) strain of the human coronavirus is a component of the COVID family and belongs to a group of viruses called the Betacoronavirus 1. This strain is prominent in infecting humans and cattle. As far as the virus’s structural integrity goes, it is a simple-stranded RNA, positive-sense, enclosed virus. It is also one of those viruses of the coronavirus family that affects humans out of the seven strains. Its host-entering mechanism involves binding with the N-acetyl-9-O-acetylneuraminic acid receptor of the host cell.
These are the specific symptoms associated with these problems: loss of speech or movement, chest pain or pressure, difficulty breathing or shortness of breath, loss of taste or smell, headache, diarrhea, sore throat, aches and Pain, tiredness, dry cough, and fever.
An algorithm based on -mapping is proposed to diagnose COVID-19, suggest appropriate treatments, and track the treatment steps and improvement measures for the patients.
2.2. Preliminaries
This portion provides a few basic concepts to facilitate the readers for clear understanding proposed approach.
Definition 1
([14]). The FS is characterized by a membership mapping which is stated as a family of pairs where and are regarded as belonging degree of and unit closed interval, respectively.
Definition 2
([19]). An SS is stated as the family of pairs where with , and as an -approximate member of SS, a set of evaluating indicators and the family of subsets of , respectively.
Definition 3
([41]). Let say and are the initial universal set and attributes, respectively. For any , let and be a CF soft set over . Then, a CF soft set is subjected to , which is specified by a function that represents a mapping . Here, is known as CF approximate function of the CF soft set, and it can be signified as
Definition 4
([30]). An HS is stated as a class of pairs where with as -multi-argument approximate member of HS for and is equal to , whereas all are disjoint sub-classes of parameters having their respective sub-parametric values. For more definition see, [31].
2.3. Methodology
This section aims to describe the various stages of complete methodology that are adopted for this study. The Figure 1 presents the graphical view of complete methodology adopted in this study.
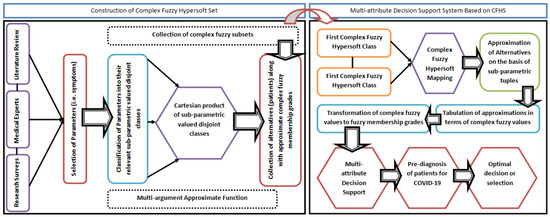
Figure 1.
Pictographic view of various stages involved in adopted methodology.
2.3.1. Description of Fuzzy Rules
In accordance with the terminological understanding of “fuzzy rule”, the following criteria have been employed to justify fuzzy rule requirements:
- Consideration of linguistic variables: The linguistic variables are taken as fuzzy input and their corresponding linguistic variable are taken as fuzzy output.
- Employment of membership function: In this proposed approach, a novel function called multi-argument approximate function is employed which considers the Cartesian product of sub-parametric valued disjointed classes corresponding to parameters as its domain and the collection of complex fuzzy sets as its co-domain. In other words, this function has sub-parametric tuples having multi-argument coordinates. It is the modified version of approximate function used in a soft set. It ensures the entitlement of the hypersoft setting with provision of due status to parameters and their sub-parametric values in the form of disjointed classes. Table 1 presents the comparison of the adopted membership function with other existing membership functions.
 Table 1. Comparison of employed membership function with other membership functions.
 - Designing of fuzzy-valued-based rules: In this step, construction and computation of the relevant fuzzy system are involved.
- Observation of fuzzy-valued-based output: This step is meant for obtaining the optimum decision.
2.3.2. Pre-Stage
COVID-19 patients show similar symptoms to the sickness caused by the viruses listed above, making it hard to pinpoint the cause of the ailment and propose an appropriate treatment for the disease. This ambiguity and vagueness are dealt with by using in a specialized manner. To translate oral data into numerical language, a fuzzy interval [0, 1] is constructed for various types of COVID. A chart is created to find the actual form of COVID from its different types; see Table 2.
Table 2.
COVID diagnosis table with ranges.
Diseases are known to progress over time, so this paper will utilize this fact by collecting the patient’s data for 2–3 days, comparing the symptoms and the side effects (if any) presented, leading to a complete workup of the patient’s history. Further on, additional graphs regarding the present condition compared to the previous condition of the patients are created for better monitoring and trend identifying purposes. The above statement is expanded in Table 3 and Figure 2. Depending on the conditions of COVID, it is divided into a set of three ranges, namely serious, moderate, and low. Figure 2 defines the ranges along with the constraints allocated to these ranges.
Table 3.
COVID is analysed using associated concerns and how they are treated on a daily basis.
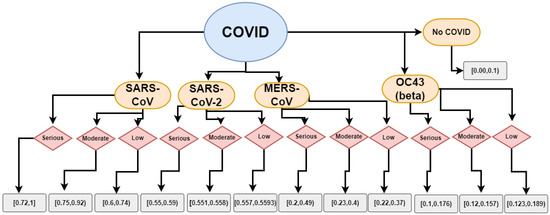
Figure 2.
Flowchart of various ranges related to COVID-19’s mentioned criteria.
2.4. Proposed Algorithm for Pre-Diagnosis of Patients Based on CFHS Mapping
This section proposes a multi-attribute decision-making-based () algorithm (Algorithm 1) for pre-diagnosis of COVID-19 in patients who are under observation.
| Algorithm 1: Procedural flow of pre-diagnosis of COVID-19 in patients. |
| ▹Start |
| ▹Input |
| Step 1. To categorise the coronavirus family. Suppose be set of four patients suspected to have COVID and be set of symptoms whose sub-values related to sets ’s, where . Following a crucial evaluation at th times, the consultant’s set chart is customised as: , where are membership of SARS-CoV, SARS-CoV-2, MERS-CoV and OC43 (beta) for patients and symptoms respectively and . The union of all “t” day to clinical charts is used to procure the most relevant data on all patients. |
| Step 2. It is anticipated that a class having relevant indications and the their respective sub-classes are ’s with . An set is constructed having weights proposed by decision-makers (health experts) after assessing the physical condition of the patient under observation over time . |
| Step 3. Now, mappings are defined as follows: and characterized as follows; , , ; (based on the interrelations with the basic symptoms). |
| Suppose -mapping defined as;
|
| ▹Construction |
| Step 4. Transform set to aggregation values by using, [46], where . |
| Step 5. Then, by making use of the information from Table 3, constitute a set after symptoms and assemble the pre-diagnosis table which leads to the assessment for consistency of the proposed study. |
| Step 6. Take the mean for each specific patient centred on their clinical manifestations. Now, compare our outcomes to the diagnosis Table 2. |
| ▹Computation |
| Step 7. Consider a class consists of symptoms which are correlated concurrently, where and is a list of potential medicines, then it allows for constructing , where is the function from to that is the collection with recommendations of physician. |
| Step 8. Obtain by applying min-max composition over and . |
| Step 9. Use medications that offer additional benefits while having fewer side effects. To determine the patient’s status, the guidelines are followed. |
| ▹Output |
| Step 10. Consider two mappings: and |
| and such that and |
| Then this mapping can be constructed in this mechanism: and can be regarded as: |
| Step 11. Continue step 10 whenever the outcomes need to be assessed and finally compute the score values by taking arithmetic mean of all final obtained values corresponding to each patient. |
Methodological Limitations
Prior to the application of the algorithm above, the following limitations of the technique are checked:
- As the parameters described have the same base and structure, a mapping will be required to convert the criterion to its parameterized value.
- The two collections to be compared must belong to the same structural class of the set, and their composition must be independent of each other.
- By using the patient’s history and medical records, the doctor should advise the best course of medication based on the symptoms presented by the disease.
- A database is required that comprises the ranges needed for the disease identification and mapping, which can be constructed with the assistance of a medical professional.
- If the proposed treatment method is leading to diverse effects on the patient, inverse -mapping is utilized to remove the adverse effects and restart the medication process all over again.
3. Experimental Study
The usage of the algorithm described above in a clinical situation is the main emphasis of this section. The patient’s medical condition is first translated into mathematical syntax with the aid of medical personnel. The next step involves the comparison of the mathematical syntax of the patient with the syntax of the patients recorded in the database beforehand. The patient with distinct symptoms of COVID-19 is monitored with the help of a diagnostic map, and day-by-day reports can be seen in (Table 2 and Table 3). These tables can be used for a comparative analysis to deduce the intensity of the disease on a particular patient. The most significant advantage of the algorithm is its use case for determining a particular disease based on its symptoms and severity using mapping functions. The algorithm can propose an optimal treatment method based on the disease based on the patient’s condition. The technique’s development will be aided by a fully generalized mapping of the physician’s rehabilitation and convenient restoration graphs for clinical practice, retrospective cohort analysis, and application users. Four patients present similar symptoms making it complicated for medical professionals to suggest a diagnosis based on their overlapping symptoms. Many dynamics are considered, but some are ruled out for ease of explanation of the algorithm, such as the previous skin color changes, history, and other aspects. Based on the diagnosis presented by the algorithm and the doctor’s intuition, a treatment method can be started along with the patient’s rehabilitation plan. The following example is performed on hypothetical data, but if real data is used, it can lead to fruitful results and help optimize the workflow in hospitals while minimizing human errors and misdiagnosis problems.
Step 1.
Let be considered a set of four patients. Let Fever, Cough, Pain, be ailments with distinct attributes, the attributes of which are associated to the sets and respectively. Let Intermittent fever, Remittent fever}, Dry cough}, Pain in temples of head, Pain in forehead}. Now, generate the first two days chart given in Table 4 and Table 5 which are in the form of . After that, take the union between them. The results can be seen in Table 6, where .
Table 4.
: Symptoms from on the first day of patient’s treatment.
Table 5.
: Symptoms from on the second day of patient’s treatment.
Table 6.
: union of and .
Step 2.
Let tightness sensation in the head, stroke}, Scratchy sensation}, Malaise, Body aches} be three sets related to three different attributes Headaches, Sore throat, weakness, respectively, for COVID-related symptoms. Specialists weight clinical conditions depending on clinical knowledge and translate relevant knowledge to quantitative transcription to establish the displayed in Table 7.
Table 7.
: Scales assigned to each patient’s clinical manifestations.
Step 3.
Define the mappings listed below; and such that;
, , , , and
,
,
,
Measure the image of as well as in Table 8.
Table 8.
: The image of under mapping.
Step 4.
Table 9.
Scores in the form of FHS set.
Step 5.
Compare Table 9 with Table 3 to obtain initial diagnosis and generate a diagnosis Table 10. This table is utilized to check the accuracy of the generated diagnosis.
Table 10.
Initial treatment chart is developed to assess the validity of the results.
Step 6.
Determine the average of all the aspects from Table 9 that correspond to each individual’s symptoms. This can be seen in Table 11. The COVID chart (Table 2) is currently being compared to the Table 11 findings. Patients , are diagnosed with SARS-CoV, while patients , are suspected with SARS-CoV-2.
Table 11.
Personal information from patient significance levels related to clinical manifestations.
Step 7.
The doctor prescribes medicine after accurately assessing the true essence of each clinical condition. The set evolves based on critical specific suggestions, along with the adequate care for the different sorts of COVID. Suppose Pfizer, Moderna, Novavax, AstraZeneca} be distinctive sustainable therapies, then is established, which is a set of surgeon’s advice for the effective treatments for COVID manifestations, and repurpose to fuzzy values using [46], with weights , to obtain aggregation values. Table 12 contains . The assessment methods in Table 12 are determined depending on each patient’s condition.
Table 12.
is represented in a tabular format: Doctor’s advice for COVID symptoms and the appropriate treatment.
Step 8.
Measure the union among both , and collect the linkage among both predicted treatments and doctors as set , see Table 13.
Table 13.
tabular representation: union of and to investigate the affiliation for both envisaged treatments and patients.
Step 9.
The prescription is pertinent for the patients because it generates more rewards while having low toxicity. Table 14 shows the best medicine dosages for each patient. From Table 14, the treatment is most suitable for patient , while one of the treatments among , , and is to be advised for patient ; for patient the most suitable treatment is , and the treatment is the most suitable for patient . The concluding position relies on the person’s actual status, disease features, and disease.
Table 14.
Data pertaining to suggested treatment is represented in a tabular format.
Step 10.
The individual’s predicament is classified by the characteristics of ailments and the patient’s condition. The incidences will repeat whenever illnesses are cured. By using -mapping and creating mappings to assess the development of each patient; and such that
and
This is how the -mapping can be conveyed;
The -mapping is underlying as;
where , , , identify the number of remedies and rehabilitation exacerbations in Table 15, Table 16, Table 17 and Table 18 for .
Table 15.
tabular representation: after the second therapy event, the patient’s improvement report.
Table 16.
tabular representation: After the third therapy event, the patient’s improvement report.
Table 17.
tabular representation: After the fourth therapy event, the patient’s improvement report.
Table 18.
tabular representation: After the fifth therapy event, the patient’s improvement report.
Step 11.
Step 10 is reiterated until patients’ targets are met. Figure 3, Figure 4, Figure 5 and Figure 6 depict each patient’s status update.
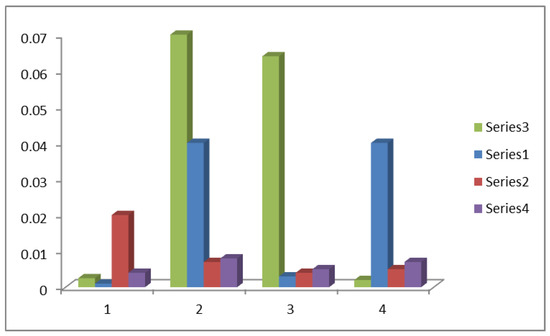
Figure 3.
Graph of progress of patient .
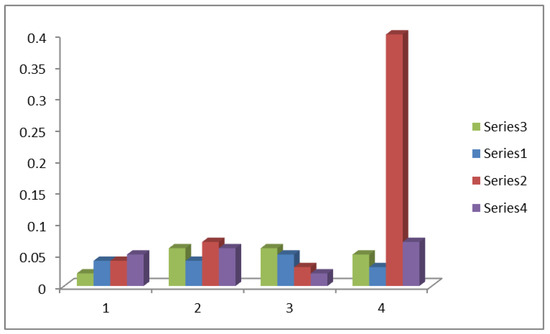
Figure 4.
Graph of progress of patient .
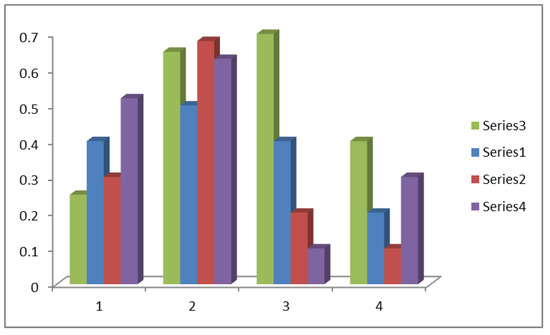
Figure 5.
Graph of progress of patient .
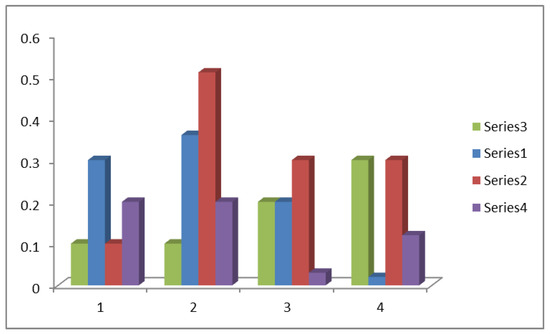
Figure 6.
Graph of progress of patient .
In Table 19, the symbols ✓ and ✕ are meant for YES and NO, respectively. Similarly, the features such as FMG stand for fuzzy membership grade, COP for “consideration of parameters”, COSP for “consideration of sub-parameters”, MOPND for “management of periodic nature of data” and REC for “ranking evaluation criteria”.
Table 19.
The proposed is compared to established paradigms.
3.1. Target Users of the Proposed Approach
The proposed algorithm aims to be a problem-solving support for early assortment alternatives and identifying sufferers with conflicting medical indications. This exploration demonstrates a well-built association between the signs and mathematically records them. The scheme is assembled on trimming set designs that can predict a patient’s state and estimate medical indications over time to analyse the health effects of a medicine. It can be carried out to foresee the contagion’s reinfection possibilities in anticipation of a cure. In their upcoming implementation, such pattern recognition-based algorithms are committed to diminishing medical inaccuracies and receiving inspiring results depending on various patient configurations.
3.2. Comparative Analysis
The concept of mapping is both broad and appropriate for various illnesses. Existing theories cannot be used to cope with and examine the challenges; however, our proposals do have their limits (Table 19). Because of such boundaries, some physicians may be incapable or unwilling to gather all the initial information. The presented method can transform the patient’s condition into a quantitative style without gaps or overlaps, permitting us to secure the best diagnosis and treatment. The presented approach is compared to existing theories on structural and computational basis in Table 19 and Table 20. When attributes are further split into attribute values and the concerns include complex data, current techniques fail to execute. The proposed mapping addresses these shortfalls. It reveals that, compared to conventional techniques, our framework is stable and effective in responding to such obstacles satisfactorily.
Table 20.
Comparison of computational results of proposed algorithm.
Now, the recommended plan is discussed along with its comprehensive nature.
- Because the COVID diagnosed individual cannot be comprehensively assessed after the initial assessment, additional days are added to this approximation. All of the patient’s facts are contained in the set, and its union and severity can be linked to symptoms.
- In each patient trial, a relationship between related and critical indications can be determined, and weights assigned to them, which is crucial. The results will be non-specific if only the initial symptoms are considered.
- A treatment method for the patients is suggested in the second stage of the algorithm based on their COVID type.
- At the third stage, a generalized version of -mapping tracks the patients’ progress. With each scene, all memberships decrease until they reach zero. COVID symptoms, pharmaceutical neutral effects with therapies, and side effects are all falling. As time passes, this model depicts the evolution of the disease.
- If an individual does not progress after that round, inverse -mapping is used to reinstate him to his initial state, and then the medications must be resumed from the beginning.
- Under the influence of parameterizations, the proposed approach is helpful for many patients with various illnesses and multiform criteria. This research is comprehensive and coherent in dealing with concerns in the medical world and multi-criteria.
- The data recorded by the medical personnel will be evaluated in the form of . The intensity of the effect and the time the patient has been sick are recorded in the form of a complex number, while the sub-parametric values of the attributes are taken in hypersoft structures. The data recorded is taken between 0 and 1, depending on the degree of % match.
- This framework attempts to identify any illness’s prognosis as well as their associated symptoms. By integrating these notions with a scientific prototype, these concepts can ve fully understand. This investigation demonstrates a relationship between symptoms and treatments, which simplifies the issue. The calculation relies on -mapping to correctly identify the disease and choose the most appropriate treatment for each patient. A generalized mapping is used to predict the physician’s progression record and evaluate the spacing of rehabilitation until it is mitigated.
4. Conclusions
COVID-19 and its associated complications have been discussed in this article. A technique is suggested for diagnosing the patient’s primary symptoms and analyzing their COVID. As a result, the -mapping, INM and a few practical works with associated features are described. There are three stages to the calculation that have been established. The model examines the patients’ actual COVID in the first stage. In the second step, -mapping was utilized to locate suitable medications for the patients depending on their COVID-19 severity. Thirdly, generalized mapping is developed for the patient’s development. The system predicts which medication will best treat the patient until the patient achieves suitable immune response. By associating this approach with existing knowledge, the findings thus gained are precise, simple to cope with, and have outstanding flexibility to examine MCDM issues. Other zones of the Neutrosophic HS set, Plithogenic HS set, Plithogenic Intuitionistic Fuzzy HS set, Q-Rung Orthopair Fuzzy HS set and their gluing models are to be explored for developing flexible hybrid structures. It may also be adapted for intelligent machines, diagnostic devices, information retrieval, information processing, social bonding, personalized recommendation approaches, algorithms, media platforms, remote sensing, the macroeconomic paradigm, classification techniques, image recognition, virtual architecture, and probabilistic reasoning.
Author Contributions
Conceptualization, M.S., M.A., A.U.R. and M.A.M.; methodology, M.S., M.A., A.U.R. and M.M.J.; software, M.H.S., A.U.R., M.A.M., M.M.J. and R.D.; validation, M.H.S., A.M., M.M.J. and R.D.; formal analysis, M.S., A.U.R., M.A. and R.D.; investigation, M.S., M.A., A.U.R., M.A.M. and M.M.J.; data curation, M.H.S., A.M., M.A.M. and R.D.; writing of the original draft, M.A., A.U.R., M.H.S. and M.A.M.; writing of the review and editing, M.S., M.A., M.A.M. and R.D.; visualization, M.S., M.A., A.U.R., M.H.S. and M.M.J.; supervision, M.S., M.A.M., M.M.J. and R.D.; project administration, M.S., M.A.M. and M.M.J.; funding acquisition, R.D. All authors have read and agreed to the published version of the manuscript.
Funding
This research received no external funding.
Institutional Review Board Statement
Not applicable.
Informed Consent Statement
Not applicable.
Data Availability Statement
Not applicable.
Conflicts of Interest
The authors declare no conflict of interest.
References
- Hafeez, A.; Ahmad, S.; Siddqui, S.A.; Ahmad, M.; Mishra, S. A review of covid-19 (coronavirus disease-2019) diagnosis, treatments and prevention. Ejmo 2020, 4, 116–125. [Google Scholar]
- Huang, C.; Wang, Y.; Li, X.; Ren, L.; Zhao, J.; Hu, Y.; Zhang, L.; Fan, G.; Xu, J.; Gu, X. Clinical features of patients infected with 2019 novel coronavirus in wuhan, china. Lancet 2020, 395, 497–506. [Google Scholar] [CrossRef] [Green Version]
- Shekhar, S.; Wurth, R.; Kamilaris, C.D.; Eisenhofer, G.; Barrera, F.J.; Hajdenberg, M.; Tonleu, J.; Hall, J.E.; Schiffrin, E.L.; Porter, F.; et al. Endocrine conditions and covid-19. Horm. Metab. Res. 2020, 52, 471–484. [Google Scholar] [CrossRef] [PubMed]
- Abayomi-Alli, O.O.; Damaševičius, R.; Maskeliūnas, R.; Misra, S. An ensemble learning model for COVID-19 detection from blood test samples. Sensors 2022, 22, 2224. [Google Scholar] [CrossRef]
- Allioui, H.; Mohammed, M.A.; Benameur, N.; Al-Khateeb, B.; Abdulkareem, K.H.; Garcia-Zapirain, B.; Maskeliūnas, R. A multi-agent deep reinforcement learning approach for enhancement of COVID-19 CT image segmentation. J. Pers. Med. 2022, 12, 309. [Google Scholar] [CrossRef] [PubMed]
- Rehman, N.U.; Zia, M.S.; Meraj, T.; Rauf, H.T.; Damaševičius, R.; El-Sherbeeny, A.M.; El-Meligy, M.A. A self-activated cnn approach for multi-class chest-related covid-19 detection. Appl. Sci. 2021, 11, 9023. [Google Scholar] [CrossRef]
- Jiang, X.; Coffee, M.; Bari, A.; Wang, J.; Jiang, X.; Huang, J.; Shi, J.; Dai, J.; Cai, J.; Zhang, T.; et al. Towards an artificial intelligence framework for data-driven prediction of coronavirus clinical severity. Comput. Mater. Contin. 2020, 63, 537–551. [Google Scholar] [CrossRef]
- Tuli, S.; Tuli, S.; Tuli, R.; Gill, S.S. Predicting the growth and trend of COVID-19 pandemic using machine learning and cloud computing. Internet Things 2020, 11, 100222. [Google Scholar] [CrossRef]
- Wieczorek, M.; Silka, J.; Polap, D.; Wozniak, M.; Damaševicius, R. Real-time neural network based predictor for cov19 virus spread. PLoS ONE 2020, 15, e0243189. [Google Scholar] [CrossRef]
- Kumar, V.; Singh, D.; Kaur, M.; Damaševičius, R. Overview of current state of research on the application of artificial intelligence techniques for COVID-19. PeerJ Comput. Sci. 2021, 7, 1–34. [Google Scholar] [CrossRef]
- Alyasseri, Z.A.A.; Al-Betar, M.A.; Doush, I.A.; Awadallah, M.A.; Abasi, A.K.; Makhadmeh, S.N.; Alomari, O.A.; Abdulkareem, K.H.; Adam, A.; Damasevicius, R.; et al. Review on COVID-19 diagnosis models based on machine learning and deep learning approaches. Expert Syst. 2022, 39, e12759. [Google Scholar] [CrossRef] [PubMed]
- Omoregbe, N.A.I.; Ndaman, I.O.; Misra, S.; Abayomi-Alli, O.O.; Damaševičius, R. Text messaging-based medical diagnosis using natural language processing and fuzzy logic. J. Healthc. Eng. 2020, 2020, 8839524. [Google Scholar] [CrossRef]
- Lauraitis, A.; Maskeliunas, R.; Damaševičius, R. ANN and fuzzy logic based model to evaluate huntington disease symptoms. J. Healthc. Eng. 2018, 2018, 4581272. [Google Scholar] [CrossRef] [Green Version]
- Zadeh, L.A. Fuzzy sets. In Fuzzy Sets, Fuzzy Logic, and Fuzzy Systems: Selected Papers by Lotfi A Zadeh; World Scientific: Singapore, 1996; pp. 394–432. [Google Scholar]
- Dawood, H. Interval mathematics as a potential weapon against uncertainty. In Mathematics of Uncertainty Modeling in the Analysis of Engineering and Science Problems; IGI Global: Hershey, PA, USA, 2014; pp. 1–38. [Google Scholar] [CrossRef] [Green Version]
- Dubois, D.; Prade, H. Interval-valued fuzzy sets, possibility theory and imprecise probability. In Proceedings of the 4th Conference of the European Society for Fuzzy Logic and Technology and 11th French Days on Fuzzy Logic and Applications, EUSFLAT-LFA 2005 Joint Conference, Barcelona, Spain, 7–9 September 2005; pp. 314–319. [Google Scholar]
- Pawlak, Z.; Grzymala-Busse, J.; Slowinski, R.; Ziarko, W. Rough set. Commun. ACM 1995, 38, 88–95. [Google Scholar] [CrossRef]
- Liu, X.; Wang, Z.; Zhang, S.; Garg, H. Novel correlation coefficient between hesitant fuzzy sets with application to medical diagnosis. Expert Syst. Appl. 2021, 183, 115393. [Google Scholar] [CrossRef]
- Molodtsov, D. Soft set theory—First results. Comput. Math. Appl. 1999, 37, 19–31. [Google Scholar] [CrossRef] [Green Version]
- Maji, P.; Roy, A.R.; Biswas, R. An application of soft sets in a decision making problem. Comput. Math. Appl. 2002, 44, 1077–1083. [Google Scholar] [CrossRef] [Green Version]
- Yang, X.; Yu, D.; Yang, J.; Wu, C. Generalization of soft set theory: From crisp to fuzzy case. In Fuzzy Information and Engineering; Springer: Berlin/Heidelberg, Germany, 2007; pp. 345–354. [Google Scholar]
- Maji, P.K.; Biswas, R.; Roy, A. Fuzzy soft sets. J. Fuzzy Math. 2001, 9, 589–602. [Google Scholar]
- Kharal, A.; Ahmad, B. Mappings on soft classes. New Math. Nat. Comput. 2011, 7, 471–481. [Google Scholar] [CrossRef]
- Kharal, A.; Ahmad, B. Mappings on fuzzy soft classes. Adv. Fuzzy Syst. 2009, 2009, 407890. [Google Scholar] [CrossRef]
- Karaaslan, F. Soft classes and soft rough classes with applications in decision making. Math. Probl. Eng. 2016, 2016, 1584528. [Google Scholar] [CrossRef] [Green Version]
- Alkhazaleh, S.; Marei, E. Mappings on neutrosophic soft classes. Neutrosophic Sets Syst. 2014, 2, 3–8. [Google Scholar]
- Ropiak, K.; Artiemjew, P. On a hybridization of deep learning and rough set based granular computing. Algorithms 2020, 13, 63. [Google Scholar] [CrossRef] [Green Version]
- Sulaiman, N.H.; Mohamad, D. Mappings on multiaspect fuzzy soft classes. In AIP Conference Proceedings; American Institute of Physics: University Park, PA, USA, 2014; Volume 1602, pp. 716–722. [Google Scholar]
- Bashir, M.; Salleh, A.R. Mappings on intuitionistic fuzzy soft classes. In AIP Conference Proceedings; American Institute of Physics: University Park, PA, USA, 2013; Volume 1522, pp. 1022–1032. [Google Scholar]
- Smarandache, F. Extension of soft set to hypersoft set, and then to plithogenic hypersoft set. Neutrosophic Sets Syst. 2018, 22, 168–170. [Google Scholar]
- Saeed, M.; Ahsan, M.; Siddique, M.K.; Ahmad, M.R. A study of the fundamentals of hypersoft set theory. Int. J. Sci. Eng. Res. 2020, 11, 320–329. [Google Scholar]
- Saeed, M.; Ahsan, M.; Abdeljawad, T. A development of complex multifuzzy hypersoft set with application in mcdm based on entropy and similarity measure. IEEE Access 2021, 9, 60026–60042. [Google Scholar] [CrossRef]
- Saeed, M.; Ahsan, M.; Saeed, M.H.; Mehmood, A.; Khalifa, H.A.E.W.; Mekawy, I. The Prognosis of Allergy Based Diseases using Pythagorean Fuzzy Hypersoft Mapping Structures and Recommending Medication. IEEE Access 2022, 10, 5681–5696. [Google Scholar] [CrossRef]
- Saeed, M.; Ahsan, M.; Saeed, M.H.; Mehmood, A.; Abdeljawad, T. An application of neutrosophic hypersoft mapping to diagnose hepatitis and propose appropriate treatment. IEEE Access 2021, 9, 70455–70471. [Google Scholar] [CrossRef]
- Zulqarnain, M.; Dayan, F.; Saeed, M. Topsis analysis for the prediction of diabetes based on general characteristics of humans. Int. J. Pharm. Sci. Res. 2018, 9, 2932–2939. [Google Scholar]
- Martin, N.; Smarandache, F. Introduction to combined plithogenic hypersoft sets. Neutrosophic Sets Syst. 2020, 35, 503–510. [Google Scholar] [CrossRef]
- Musa, S.Y.; Asaad, B.A. Bipolar hypersoft sets. Mathematics 2021, 9, 1826. [Google Scholar] [CrossRef]
- Ajay, D.; Charisma, J.J.; Boonsatit, N.; Hammachukiattikul, P.; Rajchakit, G. Neutrosophic semiopen hypersoft sets with an application to MAGDM under the COVID-19 scenario. J. Math. 2021, 2021, 5583218. [Google Scholar] [CrossRef]
- Debnath, S. Interval-valued intuitionistic hypersoft sets and their algorithmic approach in multi-criteria decision making. Neutrosophic Sets Syst. 2022, 48, 226–250. [Google Scholar]
- Ramot, D.; Milo, R.; Friedman, M.; Kandel, A. Complex fuzzy sets. IEEE Trans. Fuzzy Syst. 2002, 10, 171–186. [Google Scholar] [CrossRef]
- Thirunavukarasu, P.; Suresh, R.; Ashokkumar, V. Theory of complex fuzzy soft set and its applications. Int. J. Innov. Res. Sci. Technol. 2017, 3, 13–18. [Google Scholar]
- Rahman, A.U.; Saeed, M.; Smarandache, F.; Ahmad, M.R. Development of hybrids of hypersoft set with complex fuzzy set, complex intuitionistic fuzzy set and complex neutrosophic set. Neutrosophic Sets Syst. 2020, 38, 335–355. [Google Scholar]
- Al-Qudah, Y.; Hassan, N. Operations on complex multi-fuzzy sets. J. Intell. Fuzzy Syst. 2017, 33, 1527–1540. [Google Scholar] [CrossRef] [Green Version]
- Riaz, M.; Tehrim, S.T. Bipolar fuzzy soft mappings with application to bipolar disorders. Int. J. Biomath. 2019, 12, 1950080. [Google Scholar] [CrossRef]
- Riaz, M.; Hashmi, M.R. M-polar neutrosophic soft mapping with application to multiple personality disorder and its associated mental disorders. Artif. Intell. Rev. 2021, 54, 2717–2763. [Google Scholar] [CrossRef]
- Al-Qudah, Y.; Hassan, N. Complex multi-fuzzy soft set: Its entropy and similarity measure. IEEE Access 2018, 6, 65002–65017. [Google Scholar] [CrossRef]
- Ahsan, M.; Saeed, M.; Rahman, A.U. A theoretical and analytical approach for fundamental framework of composite mappings on fuzzy hypersoft classes. Neutrosophic Sets Syst. 2021, 45, 268–285. [Google Scholar]
- Zadeh, L.A. The concept of a linguistic variable and its application to approximate reasoning—II. Inf. Sci. 1975, 8, 301–357. [Google Scholar] [CrossRef]
- Atanassov, K. Intuitionistic fuzzy sets. Fuzzy Sets Syst. 1986, 20, 87–96. [Google Scholar] [CrossRef]
- Smarandache, F. Neutrosophy: Neutrosophic Probability, Set, and Logic: Analytic Synthesis & Synthetic Analysis; American Research Press: Santa Fe, NM, USA, 1998. [Google Scholar]
- Zhang, W.R.; Zhang, L. YinYang bipolar logic and bipolar fuzzy logic. Inf. Sci. 2004, 65, 265–287. [Google Scholar] [CrossRef]
- Chen, J.; Li, S.; Ma, S.; Wang, X. -Polar fuzzy sets: An extension of bipolar fuzzy sets. Sci. World J. 2014, 2014, 416530. [Google Scholar] [CrossRef] [Green Version]
- Deli, I.; Ali, M.; Smarandache, F. Bipolar neutrosophic sets and their application based on multi-criteria decision making problems. In Proceedings of the International Conference on Advanced Mechatronic Systems (ICAMechS), Beijing, China, 22–24 August 2015; pp. 249–254. [Google Scholar]
- Heilpern, S. Fuzzy mappings and fixed point theorem. J. Math. Anal. Appl. 1981, 83, 566–569. [Google Scholar] [CrossRef] [Green Version]
- Zeb, A.; Khan, A.; Juniad, M.; Izhar, M. Fermatean fuzzy soft aggregation operators and their application in symptomatic treatment of COVID-19 (case study of patients identification). J. Ambient Intell. Humaniz. Comput. 2022, 1–18. [Google Scholar] [CrossRef] [PubMed]
- Riaz, M.; Garg, H.; Hamid, M.T.; Afzal, D. Modelling uncertainties with TOPSIS and GRA based on q-rung orthopair m-polar fuzzy soft information in COVID-19. Expert Syst. 2021, 39, e12940. [Google Scholar] [CrossRef]
Publisher’s Note: MDPI stays neutral with regard to jurisdictional claims in published maps and institutional affiliations. |
© 2022 by the authors. Licensee MDPI, Basel, Switzerland. This article is an open access article distributed under the terms and conditions of the Creative Commons Attribution (CC BY) license (https://creativecommons.org/licenses/by/4.0/).