Article

Developing a Multicriteria Decision-Making Model Based on a Three-Layer Virtual Internet of Things Algorithm Model to Rank Players’ Value

Department of Recreational & Graduate Institute of Recreational Sport Management, National Taiwan University of Sport, No. 16, Sec. 1, Shuang-Shih Road, Taichung 404, Taiwan
Mathematics 2022, 10(14), 2369; https://doi.org/10.3390/math10142369
Submission received: 25 May 2022 / Revised: 28 June 2022 / Accepted: 4 July 2022 / Published: 6 July 2022

Abstract

:
This paper proposes a multicriteria decision-making model based on a three-layer virtual internet of things (IoT) algorithm to automatically track and evaluate professional football players’ performance over the Internet. The three layers were respectively related to (1) automated data reading, (2) the players’ comprehensive grey relational degree calculation, and (3) the players’ classification. The methodology was applied in the context of the COVID-19 pandemic to investigate the performance of the top 10 defenders (according to The Sun, an internationally renowned sports website) in the European leagues, participating in the knockout phase of the 2019–20 UEFA Champions League. The results indicate that Virgil van Dijk of Liverpool FC was the best defender, followed by Harry Maguire of Manchester United, and Sergio Ramos of Real Madrid in the second and third positions, respectively. However, this ranking contradicted that of The Sun’s, which ranked these defenders in the seventh, tenth, and eighth positions, respectively. These results can help club management, coaches, and teams negotiate price positioning and future contract renewals or player transfers.

1. Introduction

COVID-19 disrupted most aspects of everyday life in 2020. Many professional sporting events, including the Tokyo Olympics, were either postponed or canceled. Owing to the pandemic, the global sports industry suffered an estimated economic loss of 50–60% of its revenue, estimated at approximately $60 billion [1]. Real-Time News [2] reported that 183 professional football players and coaches collapsed in 2021, and 108 football players died during the COVID-19 pandemic because of player vaccination issues. Therefore, collecting data on football players is crucial during games and evaluating their training, performance, and market value [3].
Football players can be categorized as forwards, midfielders, defenders, and goalkeepers [4,5]. Each position has its tactics, and each role has a different function. For instance, the defender understands the attack patterns of the forward and has quick, explosive power and reaction capabilities. Furthermore, their insight into the game can be used to understand how to capitalize on opportunities to pass the ball back and orchestrate plays. While positions such as forwards are easier to compare on task-relevant statistics (e.g., number of goals or assists), ranking a defender’s value is significantly more challenging. This study mainly investigated the top 10 highest-paid Premier League defenders, as summarized by The Sun rankings [6], as they performed with few or no spectators during the pandemic.
During the pandemic, many professional and international competitions encountered different pressures and employed various responses, including outright cancellations, postponements, and reductions in the number of matches. For professional games, some leagues disallowed spectators or allowed only a few spectators to enter stadiums. Different IoT-related technologies broadcasted matches so that fans could watch sports at home as if they were at the stadium. Sportradar [7] reported that, after the COVID-19 pandemic, the Euro Cup 2020 used motion capture technology for fans to experience the visual and auditory effects of the football tournament in a virtual setting, bringing fans a match experience that is close to real-life. Thus, as a globally popular sport, professional football is a significant trial area to improve fan enjoyment.
The key to an excellent football game is the performance of the football players on the field, and players’ performance directly affects a coach’s scheduling, salary, and endorsement opportunities. To evaluate the performance of professional football players, a virtual environment was first constructed using Docker. Tampermonkey wrote automated tracking scripts for virtual electronic tags to manage and synchronously track the corresponding virtual objects on the Internet. Tampermonkey is a browser extension software that manages and executes user scripts. Installing a Tampermonkey script allows HTML pages to change on the client’s side, facilitating the performance of more operations. The top five defensive European leagues were regarded as virtual objects, and the results of each game, monitored using virtual IoT, were sent to the database at a designated address. Finally, a grey relational analysis (GRA) algorithm evaluated the relative value model for players who played in similar positions. By instantly and synchronously analyzing the players’ relative rankings using comprehensive indicators, players in similar positions could be informed of their relative performance, thereby enabling them to strive towards becoming the most valuable player of the season or year, and the team could be provided with the option of offering an equivalent salary to players or sponsors.
The rest of the paper is organized as follows. Section 2 presents the literature review. Section 3 presents the material and methods that express the problem description and the three-layer virtual IoT algorithm. Section 4 presents the results, and Section 5 discusses them. Finally, Section 6 concludes the study.

2. Literature Review

The literature review has three subsections: Section 2.1, on the “use of IoT technology in the sports industry”; Section 2.2, on “web scraping analysis”; and Section 2.3, which outlines the “methods for evaluating player performance.”

2.1. Using IoT Technology in the Sports Industry

Smart living is a system with sensors and machines connected through IoT technology and applied in various electronic and communication fields. This approach provides digital management in business intelligence, smart home appliances, medical industries, and sports [8,9,10]. The world is undergoing a digital transformation, wherein data and information are shared to develop artificial intelligence (AI) solutions to interpret sports performance and design practice contexts [11,12]. Rajšp and Fister [13] systematically collated 109 research papers on smart sports training. For intelligent data analysis, various studies have demonstrated that IoT could reduce the costs associated with professional sports, improve sporting efficiency, elevate training quality and satisfaction, and, hence, assist in developing data-oriented predictive services to achieve smart sports training. Camomilla et al. [14] collated 2040 research papers to classify using accelerometers, gyroscopes, and/or magnetometers to analyze the development of relevant technologies for athletic tasks performed by athletes, providing an important reference for future technological development. The rise of wearable inertial sensors in sports has been attributed to several recent developments, including the commercialization of 5G technology, greater integration of software and hardware, smart cloud services, big data analysis methods, and the introduction and application of artificial intelligence algorithms. Consequently, the commercial value of smart sports has notably increased.
The IoT platform has various applications in professional sports and technology. Michahelles and Schiele [15] used wearable sensors and video analysis to help coaches identify the movements of professional skiers to improve the training efficiency and communication between athletes and coaches. The main contribution is that through the visual software, the video simultaneously analyzes athletes’ movements and sensor data, providing coaches with real-time analysis and decision-making. Delgado, Huntington, and Ko et al. [16,17,18] also reported that the national football league (NFL) and golf association (LPGA) use IoT to collect data on calorie consumption and the running speed of trainees to assist coaches and football players in formulating training plans, reducing injury risk, and improving overall training quality. While IoT helps athletes and teams, it may also improve the fan experience. In [19], IoT technology was applied to record the swing characteristics of famous players and their performance on each hole by employing cloud computing, allowing fans to view players’ swinging skills and strategies on mobile apps. The Big Lead [20] reported that coaches and athletes collect data on perceived effort, heart rate, blood lactate, and training impulse through IoT, which they used to propose appropriate training plans, analyze training loads, and avoid sports injuries. According to efficient data analysis and interpretation obtained from monitoring, scientific training with timely feedback from athletes and coaches can be provided. Duffy [21] reported that the NFL cooperates with Twitter, using the platform’s intelligent push technology to accurately push real-time NFL updates, game analysis, replays, and highlights for content that Twitter users are interested in or follow. Additionally, users can share messages remotely while receiving real-time updates.
Mora et al. [22] also used IoT technology to monitor the heart rates of footballers during a match. They predicted the occurrence of injuries and even sudden death through real-time data monitoring. Umek et al. [23] used two orthogonally affixed strain gauge (SG) sensors, a 3-axis accelerometer, and a 3-axis gyroscope to develop a high-precision optical tracking system, Qualisys Track Manager, to conduct smart parameter analysis on golf swing motions and movement calibration to obtain feedback through cloud IoT. Kos and Umek [24] also developed a SmartSki system that connects ski equipment and body sensors. Using IoT technology, ski parameters were collected to adjust how coaches trained skiers. The SmartSki system has been tested and verified by alpine ski experts for over a year. It has discovered the coach feedback system or the skier’s real-time biofeedback system and the original system has been constantly revised to help develop better sports equipment and accelerate learning for skiers. Gowda et al. [25] developed the iBall system, which uses IoT technology to combine wireless and inertial sensor data to accurately track 3D ball trajectories in cricket matches. The results of the iBall system found that the median ball location error is at 8 cm, while rotational error remains below 12°, even at the end of the flight. Moreover, Roslan and Ahmad [26] developed the OpenHAB app to replace high-speed cameras with IoT technology and smartphones with wearable devices and communication protocols, helping high jumpers improve their training methods by monitoring historical data to enhance their performance. De Prisco et al. [27] proposed an AmI system for gym environments providing music services to create an adequate music ambience. It comprises an IoT sensor unit, a processing unit, and an actuator unit. The gym intelligence was deployed in five gyms and found that user satisfaction with the background music provided rose from 3.05 to 4.91.

2.2. Web Scraping Analysis

Glez-Peña et al. [28] introduced WhichGenes and PathJam’s operational web data scraper that extracts data from biomedical web pages for analysis. The main contribution of Web scraping APIs and frameworks address the most common tasks that Web data scrapers get involved in, such as site access, HTML, parsing and contents extraction, and output building to accomplish retrieval goals. Dongo et al. [29] used Twitter API and web scraping to extract the true transparency and legitimacy of information from the Internet, respectively. The results determined that both methods produce the same credibility value. However, for time performance, web scraping is faster than Twitter API and more flexible in fetching data. Some researchers [30,31] used the Google Chrome add-on tool Data Miner on the Carolina Panthers’ Twitter page (@Panthers) and used R suite to develop fitzRoy to scrape statistics from the Australian Rules Football webpage to count historical data. Next, data from the complete months of January and February 2018 were selected by the web scraping of tweets to enable comparisons between the Twitter content of two unrelated months. The study found that 46% of the national football league (NFL) fans were women. However, the posts confirm a bias toward men.
The NFL could build mutual trust with female fans among viable stakeholders through social media. Schedlbauer et al. [32] used web crawling, web extraction, and text mining techniques to extract 544 job advertisements from the German job site STEPSTONE and then used R statistical software for classification. The analysis determined that only 45% of the terms were related to professional knowledge, whereas 55% were related to soft skills. Vinué [33] used R statistical software to analyze data from the official websites of the top three European team competitions: the EuroLeague, the EuroCup, and the Spanish ACB (Association of Basketball Clubs) league. The main contribution of the research was to introduce the free R statistical software, which can visually explore the data of each basketball season so data can be presented more humanely. Uzun [34] used the UzunExt string method and additional information to quickly extract web content. During the crawling process, UzunExt can be used to enhance the starting position of the search process, the number of internal tags can be used to improve the extraction process, and the number of tags can be used to terminate the extraction process. Labels are repeated, which can accelerate extraction. The research found that UzunExt is 60 times faster than traditional DOM tree extraction. Extraction is 2.35 times faster than using only the string method. Sundaramoorthy et al. [35] developed a crawler robot to extract content from various news websites in a web scraping/crawling method, categorized all news URLs, and stored them on the NewsOne platform, freely available to readers. Deshpande and Rasal [36] used machine learning and web scraping to predict teams and players’ athletic performance. Fister et al. [37] used deep analytic methods to analyze blogs and news published by triathletes and determined that the most essential aspect affecting triathletes was their mentality. Guarino et al. [38] proposed machine learning and sentence embedding techniques to develop Knoxly, which could be implemented on the Google Chrome extension. Knoxly defines “Keyword,” “Topic,” “Sensitiveness,” and “Personalization” modules. The study found that its effectiveness in terms of the accuracy of sensitive information identification and efficiency in affecting user experience were assessed.

2.3. Methods for Evaluating Player Performance

Researchers have used IoT technology to model and evaluate sports players. Valtolina and Barricelli [39] proposed using the SmartFit framework to develop a three-layer architecture with IoT engineers, coaches, trainers, and athletes for quantitative data analysis on non-professional sports teams. This study proposes end-user development techniques involving multidisciplinary design teams in the design of the network configuration of sensors and services and to provide business intelligence projects. Bhatia [40] proposed an IoT-Fog computing-inspired game-theoretical decision-making model that uses sports data parameters to analyze athlete performance. The game decision analysis model was tested on four cricket players, and performance was measured in terms of sensitivity (93.14%), specificity (93.97%), precision (94.56%), and f-measure (91.69%). Kopetz [41] developed a labeling technique and suggested adding more smart labels to their ID tagging system. Tagged objects become smart objects, as they enable data collection through various transmission interfaces. The IoT is not in any new disruptive technology but the pervasive deployment of smart objects. Based on this concept, Chang [42] used the Tampermonkey extension to develop virtual IoT electronic tags to track game data from 15 players playing in the center position in the National Basketball Association (NBA). The technique for order of preference by similarity to the ideal solution algorithm calculated the classification model of the relative values of the center NBA players. Trojan horses can acclimatize banking transaction activities, as they are muddled in browsers on top of mobile banking applications and display users’ transactions. Therefore, [43] used JavaScript to write Tampermonkey scripts to manipulate a user’s browser to regain confidential data. This can be applied to mobile device banking transactions to avoid any browser-type intrusion.
Nowak et al. [44] used 12 pieces of literature and compiled 29 evaluation criteria using the STROBE checklist to evaluate amputee football players’ athletic performance. This research found that no test was simultaneously presented as valid, reliable, or standardized. Zambom-Ferraresi et al. [45] proposed Bayesian model averaging techniques and relative importance metrics to measure players’ athletic performance in the top five European football leagues during 2012/13–2014/15. A football player’s performance includes five measurement indicators: assists, shots conceded, saves made by the goalkeeper, the number of precise passes for the total number of passes, and shots on target. Research concluded that offensive actions are more important than defensive actions.
Sexton and Lewis [46] proposed a two-stage data envelopment analysis (DEA) to evaluate MLB teams’ performance during the 1999 season in major league baseball to improve overall efficiency of team performance. The study found that the two-stage DEA model can detect inefficiencies that the one-stage DEA model misses, allowing for resource consumption that the one-stage DEA model counts towards inefficiency. Additionally, [47] used the DEA model to evaluate 26 NBA players, and [48] suggested using the dynamic network DEA (DDEA) model to evaluate NBA players’ performance and ranking during the 2014–2015 season. The DNDEA model provides the best approach for this application, with specific subprocesses for each team in each quarter and carry-overs between quarters. Chitnis and Vaidya [49] used DEA to evaluate the performance rankings of 40 professional male tennis players in the “ATP World Tour Masters 1000” grand slam tournament. DEA has shown significant efficacy as it does not need to determine the weights of the respective evaluation criteria, unlike the evaluation method used by the association of tennis professionals. Returning to basketball, from an objective perspective, Chang [50] used entropy to calculate a comprehensive value assessment of the top 10 guards based on five categories (rebounds, assists, steals, blocked shots, and scoring) during the 2017–2018 season. The calculated comprehensive assessment values and player scores developed a player value matrix to assess the relative value model among players of the same type.
Oukil and Govindaluri [51] proposed the DEA-ordered weighted averaging (DEA-OWA) model. This model first calculates and evaluates the weights of the football player index from an objective perspective based on the ordered weighted averaging (OWA). DEA was then employed to calculate the performance and rankings of 34 football players in the European premier football league clubs. Similarly, [52] used the non-concave meta frontier DEA algorithm to calculate the performance of football players in Germany’s premier football league during the season from March 2002 to September 2008. The results showed that a team’s average player efficiency score was significantly and positively correlated with its rank within the league.
In summary, IoT technology has been used in the sports industry to evaluate player performance. This study developed virtual IoT tracking technology using GRA to calculate the comprehensive assessment values of various football indexes and the real-time performance of professional players, along with a value classification model.

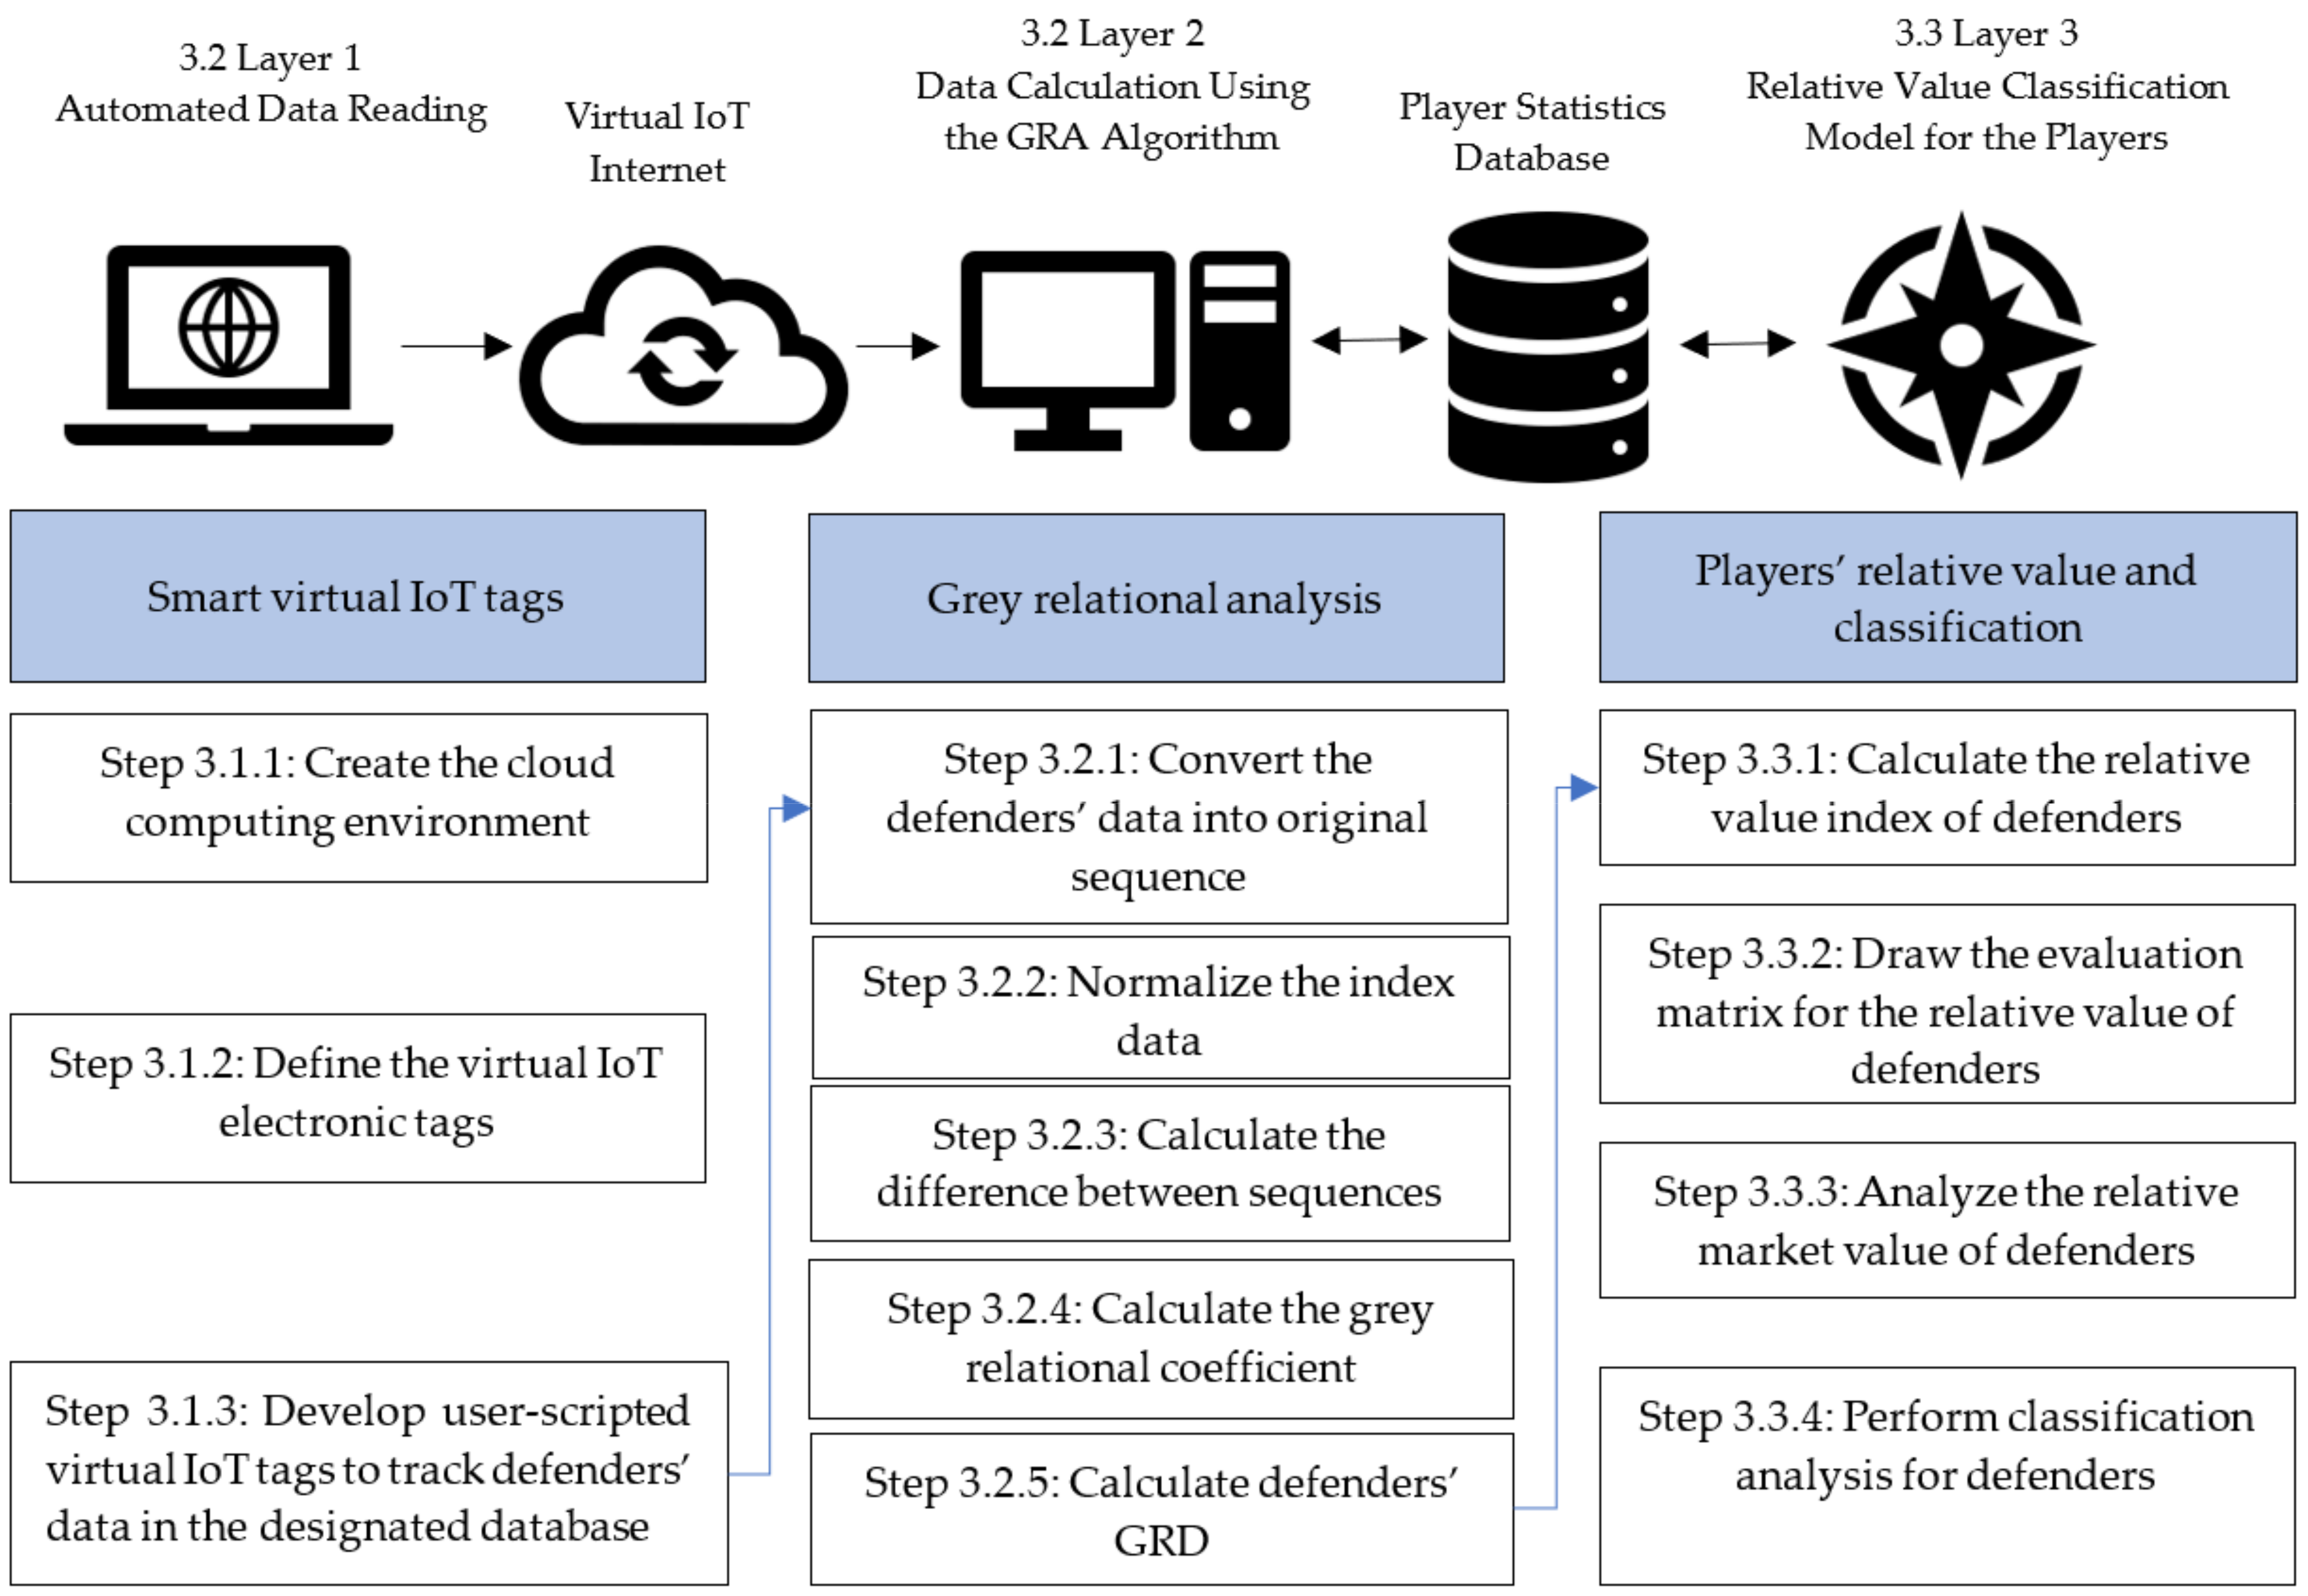
3. Materials and Methods

A football player in each position uses their own tactics, and each role has varying functions. For instance, the defender must have swift explosive power and reaction capabilities to understand the attack patterns of the offensive forward and use game insight to recognize how to capitalize on opportunities to pass the ball back and orchestrate plays. Ranking the value of defenders is challenging, whereas positions such as forwards are easier to compare based on task-relevant statistics (e.g., number of goals or assists).
This study developed a three-layer virtual IoT algorithm to evaluate player performance. Section 3.1, “Layer 1: Automated Data Reading,” illustrates the athlete’s virtual IoT electronic tags. Section 3.2, “Layer 2: Data Calculation GRA Analysis Algorithm,” uses the GRA to evaluate the relative value of football defenders. Section 3.3, “Layer 3: Relative Value Classification Model for the Players,” uses a relative value evaluation matrix to analyze players’ relative value and classification. Figure 1 presents the architecture of the virtual IoT algorithm.

3.1. Layer 1: Automated Data Reading

The first layer includes the automated data reading layer, wherein the European football defenders to be evaluated were administrated with smart IoT tags and added to the ID label. The labeled players became smart objects for tracking various indices. The following are the steps of the procedure:
  • Step 3.1.1. Create the Virtual Cloud Computing Environment
The three-layer virtual IoT algorithm is installed on an Intel Core i7-7800, 2TB SATA3 HDD, and 16G DDR4 2666 running Docker with Windows 10 Professional, Google Chrome 102.0.5005.115, MySQL 5.6, and Tampermonkey 4.16.1.
On the Docker official website, Kvitnitsky [53] stated that the cloud virtualization technology of Docker features lightweight virtual layers and is easy to transplant, making it economical to run an application. The program can be booted within seconds and does not place excessive load on application memory or the requirements of the computational economy, making it ideal for building, sharing, and running high-performance applications. Therefore, this study installed Tampermonkey on Docker for developing virtual IoT tags and creating a virtual cloud computing environment.
  • Step 3.1.2. Define the Virtual IoT Electronic Tags
According to the statistics in [54], 744 clubs with 19,909 players compete in the first-tier competition in Europe. This study tracks the top five leagues in Europe, i.e., Premier League, LaLiga, Bundesliga, Lega Serie A, and Ligue 1. The top five leagues in Europe have 98 clubs with 345 defenders. For example, during the COVID-19 pandemic, the top five leagues in Europe had 32 teams compete in the group stage to decide the 16 places and 261 defenders to participate in the knockout phase of the 2019–20 UEFA Champions League [54] (see Table 1).
Tracking contents include “name, competition, club, season, date of birth/age, height, current international, citizenship, position, appearances, minutes played (MP), goals, assists, yellow cards (YC), second yellow cards (SYC), red cards (RC), wage (Euro), value (Euro), highest market value (HMV) (Euro), and outfitter.”
  • Step 3.1.3. Develop User-Scripted Virtual IoT Tags to Track Defenders’ Data in the Designated Database
First, the FIFAIndex [55] and Transfer Market [56] provide information about each player in the same position on the webpage. Therefore, the label is defined for each location on the web page. The Tampermonkey application programming interface (API) writes user-scripted virtual IoT tags and JS scripts to automatically click and track the data of each football defender and modify the HTML rendered by the Chrome browser [57]. After filtering the noise of webpage advertisements, the indicator data of the monitored guards are sent to the Access 2019 database at the designated location for storage.
An example is selected from Table 1 Group D Juventus’s Matthijs De Ligt from the database using the Tampermonkey API. Tracking the two websites, FIFA Index [55] and Transfer Market [56] (see Table 2 of the Matthijs de Ligt’s URL column), the relevant information and data for the 2019–20 season are obtained as follows:
The VIoT track ID result is Matthijs De Ligt: {name, competition, club, season, date of birth/age, height, current international, citizenship, position, appearances, minutes played, goals, assists, YC, SYC, RC, wage (Euro), value (Euro), HMV (Euro), and outfitter.} = {Matthijs De Ligt, Lega Serie A, 2019–20, 12 August 1999 (22), 1.89 m, Netherlands, Netherlands, center-back, 39, 3.349′, 4, 1, 5, 0, 0, €80 m, €75 m, €75 m, and Adidas}.

3.2. Layer 2: Data Calculation Using the GRA Algorithm

The calculated comprehensive grey relational degree (GRD) ranking used in this study was determined to be superior to the currently published ranking from an objective perspective. Screened from the database and comparing the top 10 defenders officially announced on the internationally renowned sports website The Sun [6], Table 2 provides the results filtered from the database. The filtered data are then used for the GRA algorithm to calculate the comprehensive GRD of the defender.
Deng [58] was the first to propose the GRA algorithm. This algorithm is a non-functional sequence model and evaluates the relational degree between different cases. Using discrete data, it determines the most important indices that affect a particular case and measures the differences between the cases [59,60,61]. The GRA requires relatively less data, analyzes many uncertainty factors in multi-criteria decision problems, and provides an easier solution than the mathematical analysis methods. The GRA can overcome the disadvantages of the statistics method. This is unlike the traditional statistics analysis handling the relation between variables. Some of its defects are as follows: (1) it requires plenty of data; (2) data distribution must be typical; and (3) fewer factors are allowed and can be expressed functionally [62,63]. Defenders are analyzed fairly and objectively based on the data obtained from the evaluation. Therefore, this study employed the GRA algorithm to evaluate the relative value of football defenders.
For instance, a relational analysis algorithm is described using a dataset of European football players in the defense role. The steps of the algorithm are as follows.
  • Step 3.2.1. Convert the Defenders’ Data into the Original Sequence
The top 10 defenders dataset contains j pieces of basic football data (appearances, goals, assists, minutes played, yellow cards, second yellow cards, and red cards). The relational degrees between referential sequence X0 and i comparative sequences (i.e., football defenders to be evaluated), X1, X2, …, Xi, are represented as follows:
X0 = {x0 (1), x0 (2), …, x0 (j)},
X1 = {x1 (1), x1 (2), …, x1 (j)},
Xi = {xi (1), xi (2), …, xi (j)}.
  • Step 3.2.2. Normalize the Index Data
The normalization of the basic football indices can be divided into three parts.
First, if the basic data being evaluated are beneficial attributes (e.g., goals and assists), the data can be described as having a characteristic of “the higher, the better.” The data normalization of such data can be calculated with Equation (1) [64,65]:
γ i j = X i j min X i j max X i j min X i j ,
where max [Xi (j)] denotes the maximum value of an index.
However, if basic data have negative attributes (e.g., red and yellow cards that can expel players from matches), this index can be described as having a characteristic of “the lower, the better.” The normalization of such data can be calculated using Equation (2):
γ i j = max X i j X i j max X i j min X i j ,
where min [Xi (j)] denotes the minimum value of an index.
Finally, if the target value ranges between the maximum and minimum values (e.g., minutes played per game), the target value is set to (ob):
γ i j = X i j X ob j max X i j X ob j ,
where the definitions of max [Xi (j)] and min [Xi (j)] are the same as those in Equations (1) and (2), respectively, and Xob (j) is the target value of the jth data point.
  • Step 3.2.3. Calculate the Difference between Sequences
Calculating the comparative sequences Xi of the relevant evaluation index of the defender and degree of correlation with reference sequence X0.
Δ 0 j j = x 0 j x i j ,
where i = 1, 2, …, n; j = 1, 2, …, k.
  • Step 3.2.4. Calculate the Grey Relational Coefficient
The relational coefficient of referential sequence X0 and comparative sequence Xi are then calculated at point j as follows:
γ 0 i j = Δ min + Δ max Δ 0 j j + Δ max ,
where Δ 0 i j is the absolute value of the difference between sequences X0 and Xi at j, i.e., max i   max j Δ 0 j j and Δ min = min i   min j Δ 0 j j .
  • Step 3.2.5. Calculate Defenders’ GRD
Finally, the index weight of the GRD is calculated as
Γ 0 i = j = 1 k λ j γ 0 i j ,
where λ j is the weight value of the jth basic index.

3.3. Layer 3: Relative Value Classification Model for the Players

By defining the comprehensive GRD, age, wage, and market value of the tracked guards, the data obtained are transferred into Power BI to describe the relative value of the tracked guards. The procedure steps are as follows.
  • Step 3.3.1. Calculate the Relative Value Index of Defenders
Filter the clubs, age, wage, and market value of the top 10 football defenders in the 2019–20 season, GRD, GRD ranking, and The Sun ranking from the database and The Sun announcements [6].
  • Step 3.3.2. Draw the Evaluation Matrix for the Relative Value of Defenders
Calculate the average of each evaluated player’s wage and GRD. Wage is the X-axis, GRD is the Y-axis, and the average value of wage and GRD is the intersection of these two lines. The player-relative value assessment matrix can be divided into four blocks. Divide the 10 defenders into four blocks using these and draw a player-relative value assessment matrix to assess the defender’s immediate relative value during the season.
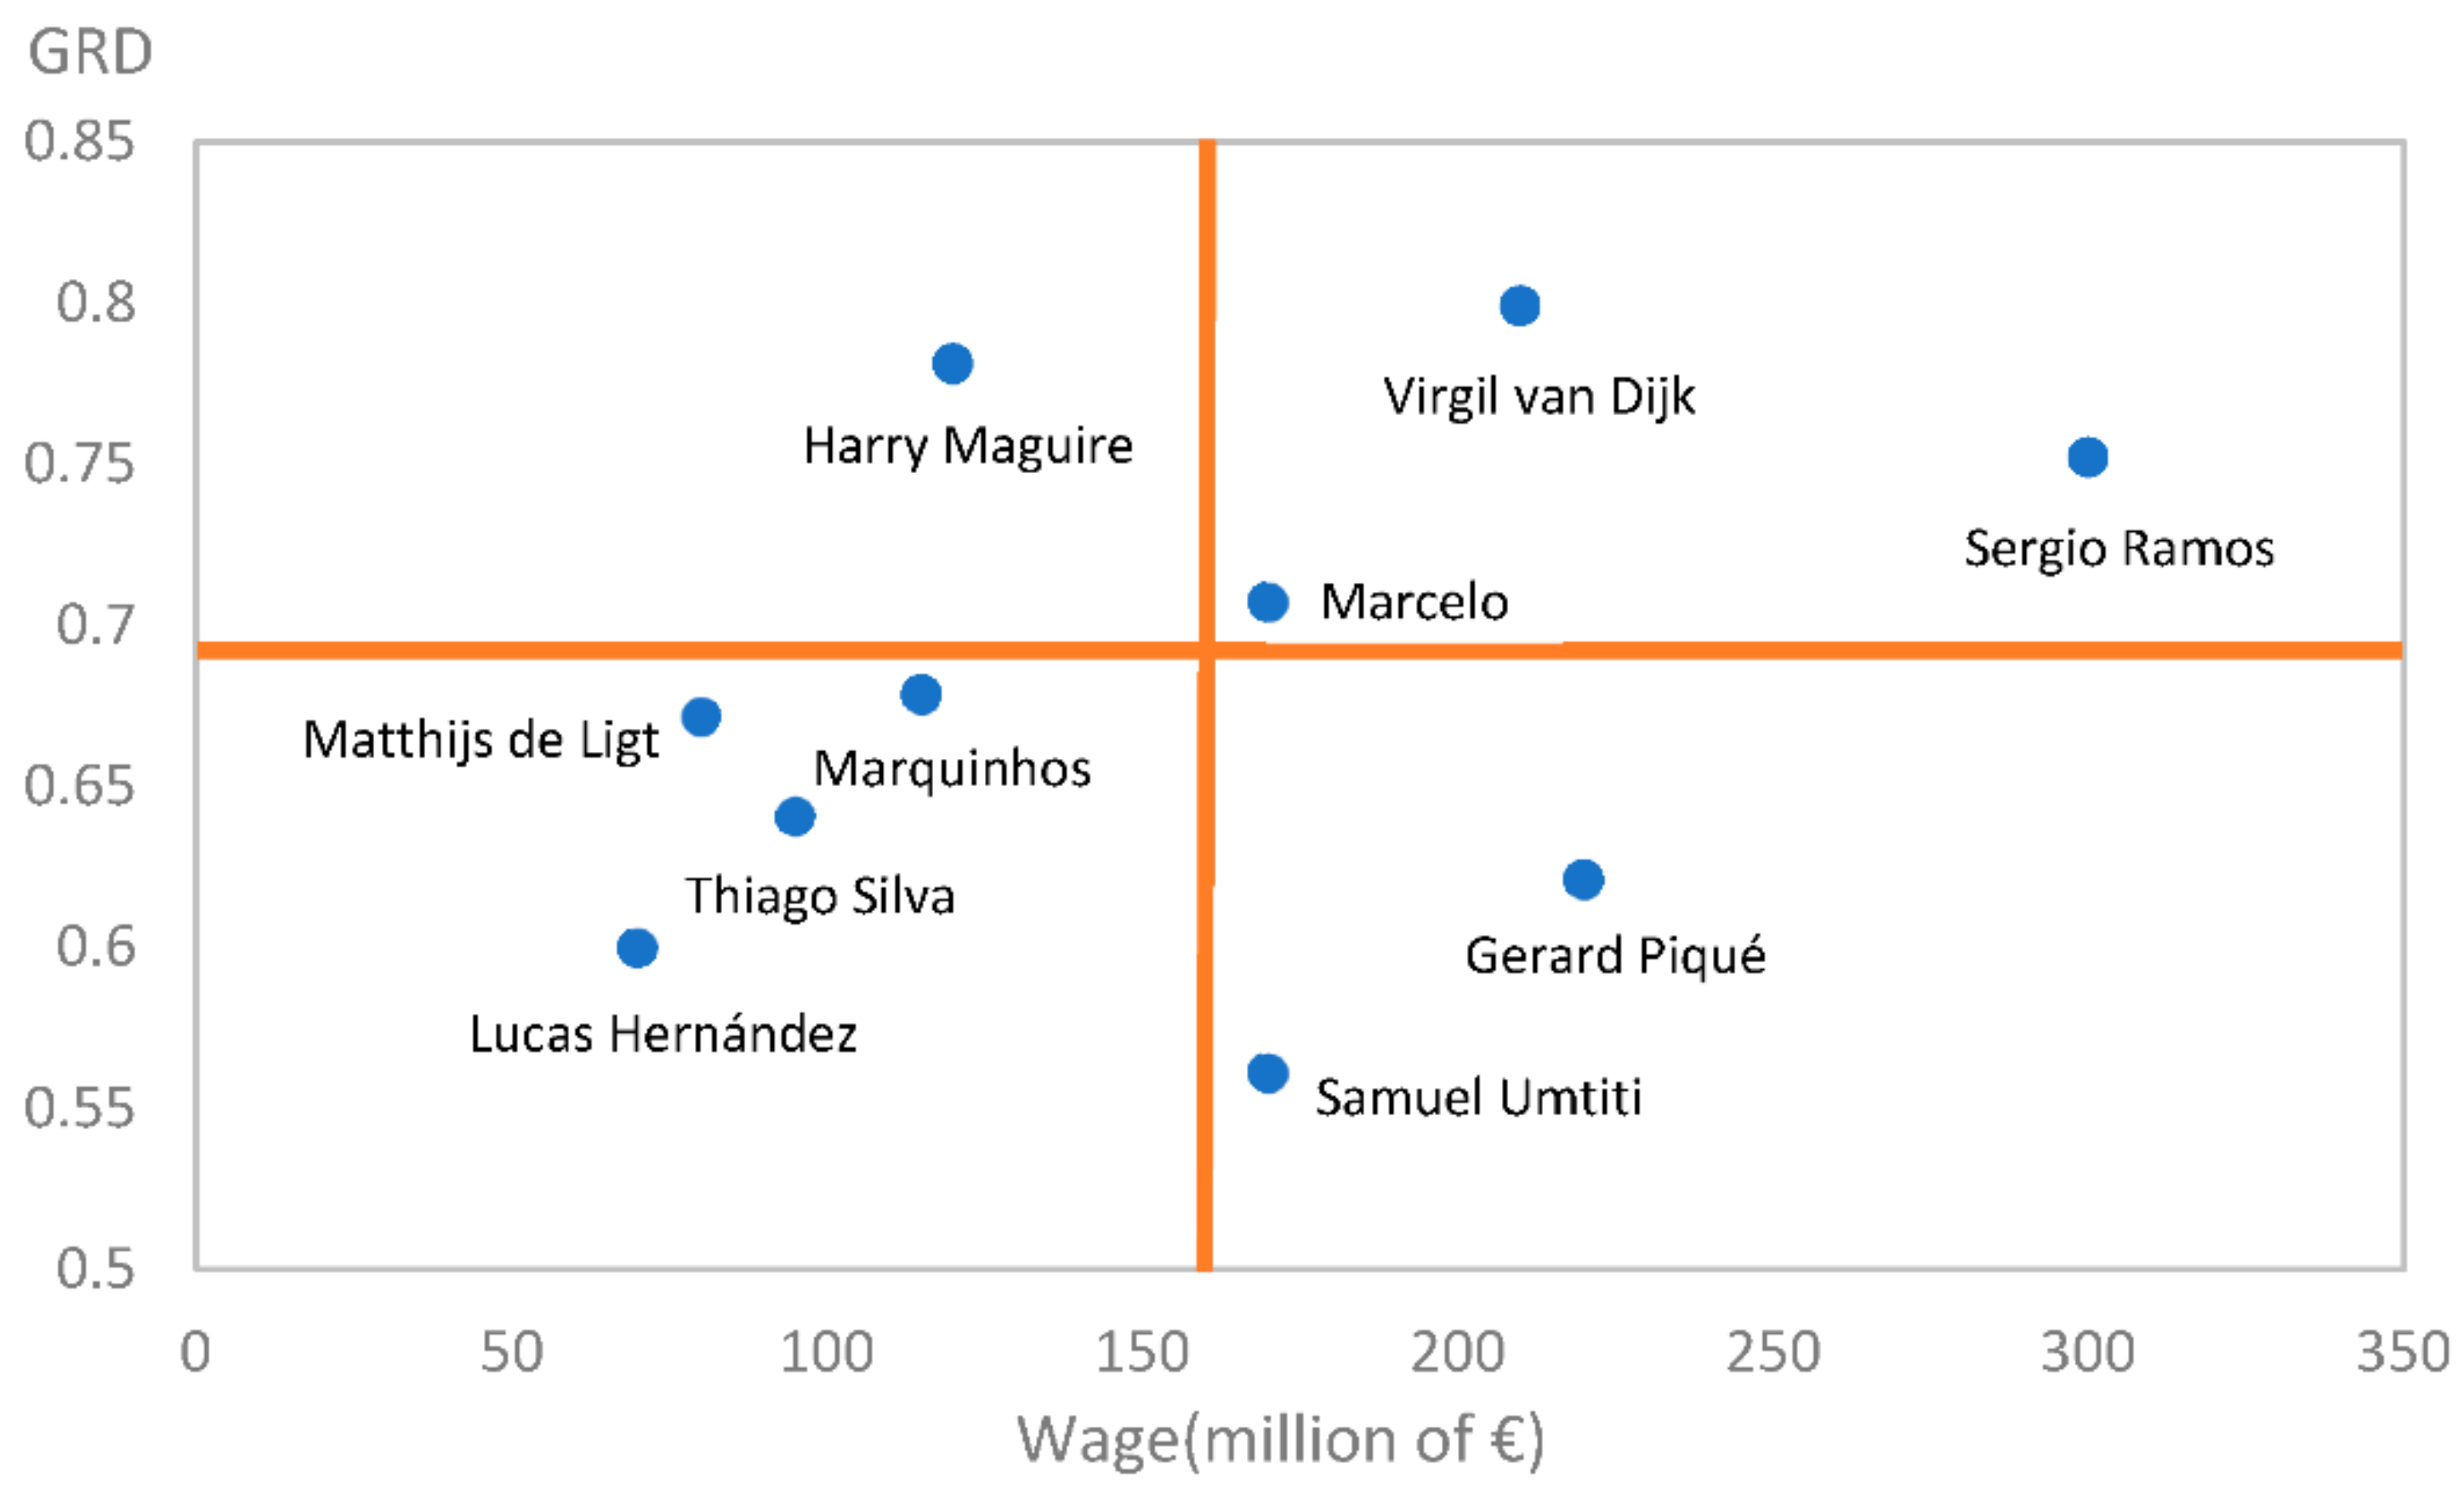
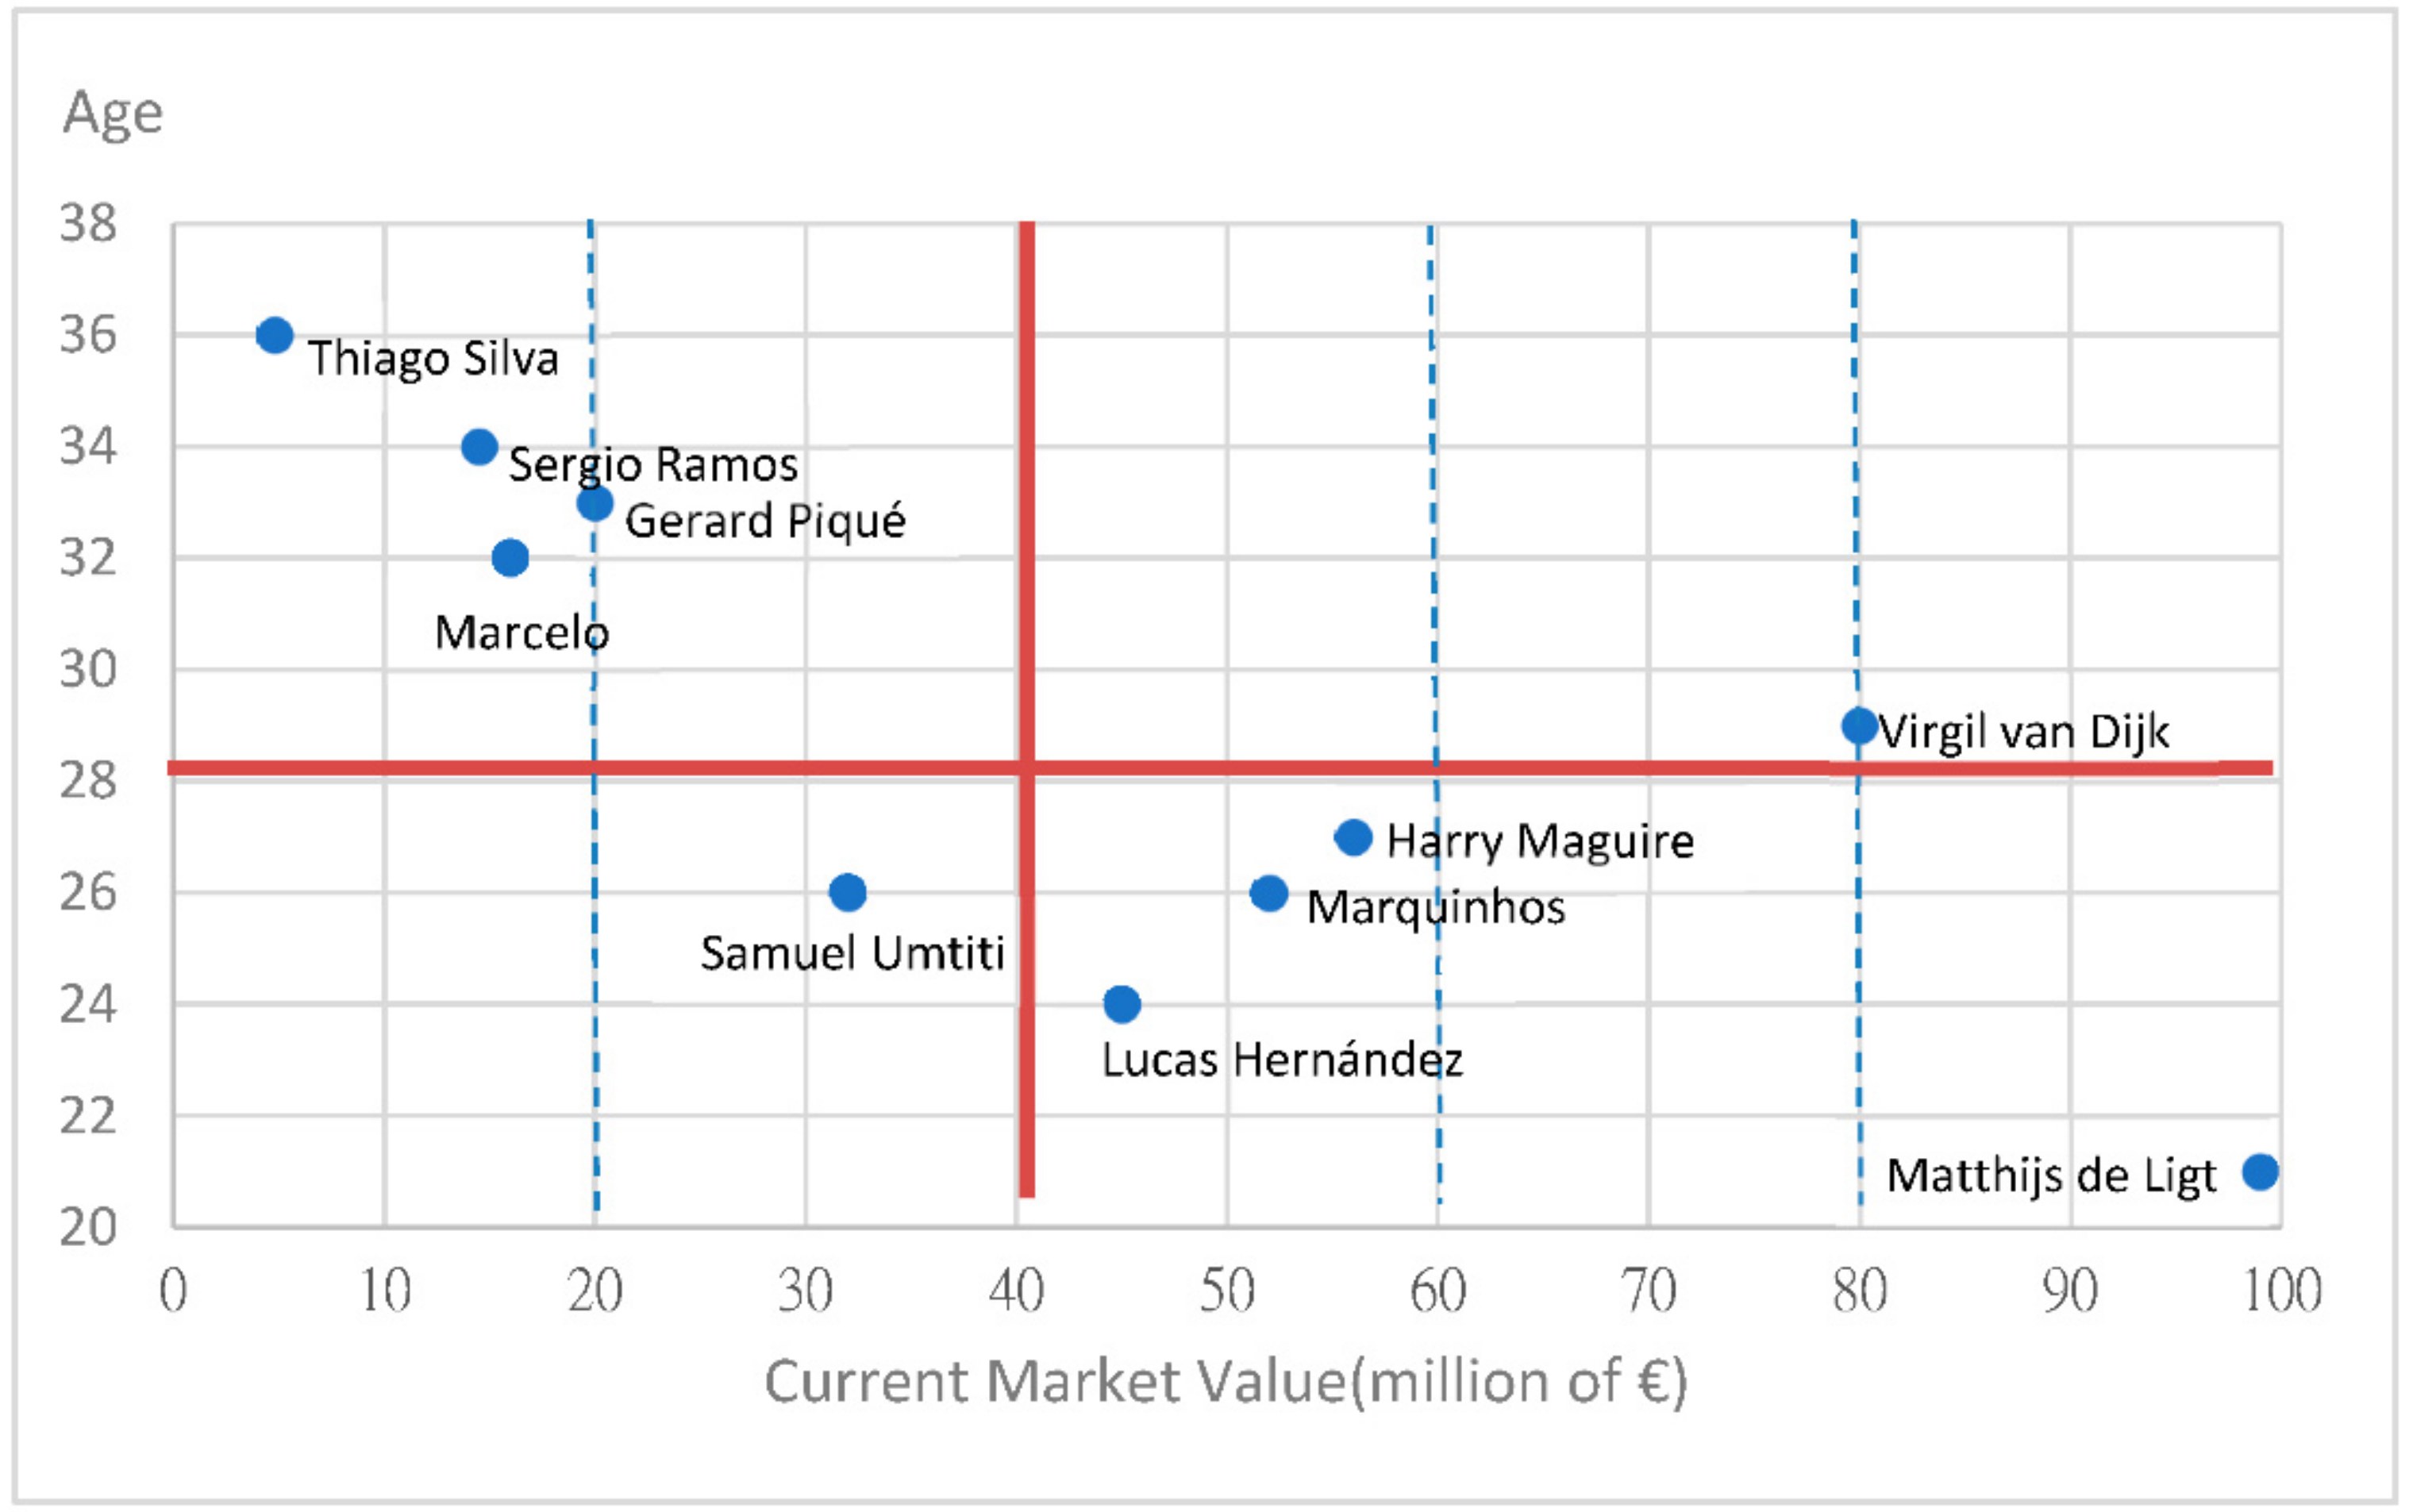
  • Step 3.3.3. Analyze the Relative Market Value of Defenders
A football player’s age is key to his sports career. Market value and age constitute the player’s relative market value analysis chart; market value is the X-axis, age is the Y-axis, and the average value of market value and age is the intersection of these two lines. The player’s relative market value matrix can be divided into four blocks. Based on the relative analysis of the defender’s age and market value, 10 defenders are divided into four blocks with average age and market value to draw a player’s relative market value analysis chart.
  • Step 3.3.4. Perform Classification Analysis for Defenders
Analyze the top 10 defenders based on GRD, age, wage, and market value.

4. Results

Table 3 presents the player data in the original sequence data; the clubs where the top 10 defenders belonged in the regular 2019–2020 season were selected, along with seven discrete basic index data points from the database. To verify the data of these top 10 defenders in Table 3, we used data from the FIFAIndex [55] and Transfer Market [56] websites. The “Layer 1: Automated Data Reading” data from the entire process were found 100% correct by automatically clicking on the web page, performing web scraping analysis, saving it onto the database, and then filtering these top 10 defenders’ data from the database.
The next step was normalizing index data. Attribute data based on the “the higher, the better” principle were appearance, goals, assists, and minutes played. The indices with a negative attribute had the “the lower, the better” characteristic and included three indices (yellow, second yellow, and red cards). Considering seven indices in Table 2, none of the defenders were shown a second yellow card, and only Sergio Ramos had a red card. Therefore, these indices were ignored in the comparison. Table 3 lists the maximum values of the beneficial indices and minimum values of the negative attribute indices. The reference sequence was X0 = (55, 13, 7, 4.962, 1) and was normalized using Equations (1) and (2). Table 4 presents the calculation results.
Equation (4) was used to calculate the differences between the defender sequences. Table 5 presents the results.
Then, Equation (5) was used to calculate the grey relational coefficient of the defenders. Table 6 presents the results. Additionally, Equation (6) was used to calculate the GRDs of the defenders (shown in the rightmost column of Table 6).
The third layer was used as the relative value classification model for players. This layer details the defenders’ comprehensive GRD, ages, wages, and market values. Data obtained were transferred into Excel 2019 to depict the real-time states of the defenders.
Finally, the relative value index of the defenders was calculated by selecting the clubs to which the top 10 defenders belonged, along with their ages, wages, market values, GRD, GRD ranking, and The Sun ranking from the database. Table 7 summarizes the results.
The results of the two rankings calculated in “Layer 2 Data Calculation Using the GRA Algorithm” in Table 7, the GRD ranking and The Sun ranking [54], are very different. However, the questions as to which ranking is closer to the current situation and which ranking is more reasonable must be asked. Next, “Layer 3: Relative Value Classification Model for the Players,” shows that the value and ranking of these top 10 defenders are the same based on wage and market value.
Using steps 3.3.1–3.3.4, the relative-value evaluation matrix can be determined for the defenders. The GRD and wage of each player to be evaluated were calculated; the average results were 0.6812 and 155 million, respectively. The top 10 defenders were divided into four blocks based on these values. The relative value evaluation matrix for players was created to evaluate their real-time relative value during the playing season (Figure 2). From the performances and wages of defenders in Table 6 and the upper right corner of Figure 2, the GRD and The Sun rankings show that three of the top 10 defenders have higher relative performances and wages than other defenders. The three defenders are Virgil van Dijk, Sergio Ramos, and Marcelo. Virgil van Dijk, ranked 1st in GRD but 7th in The Sun; Sergio Ramos, ranked 3rd in GRD but 8th in The Sun; and Marcelo ranked, 4th in GRD but 9th in The Sun. For the wage ranking of the top 10 defenders, Virgil van Dijk’s wage is €210 million, ranking 3rd; Sergio Ramos’ €300 million, ranked 1st; and Marcelo’s €170 million, ranked 4th. The top three rankings published by The Sun were different. The proposed GRD comprehensive indicators are close to the facts and are reasonable.
The top-right block of Figure 2 represents the GRDs and wages of three above-average defenders: Sergio Ramos (0.752, 300), Virgil van Dijk (0.799, 210), and Marcelo (0.7071, 170). However, although Marcelo has a GRD of 0.7071, which ranks 4th, his wage is €170 million, which is significantly lower than expected for that GRD. According to Figure 2, Gerard Piqué (0.6209, 220) ranks 8th in the lower right corner, and Virgil van Dijk (0.799, 210) ranks 1st in the upper right corner. However, the latter earns a slightly lower €10 million wage than the former. Thus, Virgil van Dijk’s annual wage was underestimated. The GRD of Harry Maguire (0.7811, 120) ranks 2nd, yet his wage is only €120 million, indicating that he is highly undervalued. The bottom-left block of Figure 2 shows the remaining four defenders. The GRD and wages of these players are lower than average, indicating that their wages are consistent and commensurate with their play.
Subsequently, the relative market values of the defenders were analyzed. Figure 3 shows the relational analysis of their age and market value. The average age and market values were 28.8 and €41.9 million, respectively. Figure 3 shows that the top 10 defenders were divided again into four blocks to plot an analysis graph of their relative market value. For market value, players with above-average market values were below average age, except Virgil van Dijk (29) whose age was slightly higher than average. Thus, from the relative market value analysis graph in Figure 3, the market value of defenders relates to their age. As shown in the upper-left block of Figure 3, four defenders were above 30 years old but below €20 million in market value. Although Sergio Ramos earned €300 million and ranked first among the 10 defenders, he was 34 years old at the time of analysis, and his market value was only €14 million. Therefore, the market value for defenders older than 30 decreases.

5. Discussion

This study conducted a classification analysis on European defensive football players. The top 10 defenders in European football were analyzed based on their GRD, age, wage, and market value. Players, clubs, and advertisement sponsors can use the classification of each player through a comprehensive assessment of the GRD. Players can use this classification to evaluate their current relative values based on their scores and wages. For club management, coaches and teams can use these data when conducting negotiations and price positioning for future contract renewals or transfers. Finally, by making the apparent value of the players more transparent, sponsors can use the data to endorse their products at reasonable prices. Based on our analyses, players were categorized into one of seven categories. The players selected according to categories from our database are listed below with their GRD, age, wage, and market value in parentheses:
GRD > 0.6812, age > 28.8, wage > €155 million. These are experienced defenders who are older, often close to retirement, and have a relatively low market value, including Virgil van Dijk (0.799, 29, €210 million, €70 million), Sergio Ramos (0.752, 34, €300 million, €14 million), and Marcelo (0.7071, 32, €170 million, €10 million).
GRD > 0.6812, age < 28.8, wage < €155 million. These are young defenders with a current market value of €40 million, in good physical condition, experienced, and have the potential for substantial development. Harry Maguire (0.7811, 27, €120 million, €40 million) was the only defender who met the above condition in our dataset. According to the contract wage and market value, Maguire has a lower-than-expected salary based on his relative value.
GRD < 0.6812, age > 28.8, wage > €155 million. Gerard Piqué (0.6209, 33, €220 million, €12 million), who is close to retirement age, was the only defender from our dataset to meet these conditions. Although an experienced player and highly paid, his opportunity for trade is small. Therefore, his remaining market value is only €12 million.
GRD < 0.6812, age > 28.8, wage < €155 million. The defender from our dataset who met these conditions was Thiago Silva (0.6407, 36, €95 million, €3.5 million). The player is 36 and thus does not have trade opportunities. Silva has the lowest market value among the top 10 defenders evaluated.
GRD < 0.6812, age < 28.8, wage > €155 million. Currently, no one from our datasets met these conditions. If a player met these conditions, the comprehensive value of their GRD would be low, and the player would require more training. If a club is willing to pay over €155 million to such a player, then that player’s value would be overestimated.
GRD < 0.6812, age < 28.8, wage < €155 million. Defenders from our dataset who met these conditions are Marquinhos (0.6784, 26, €115 million, €70 million), Matthijs de Ligt (0.6716, 21, €80 million, €75 million), and Lucas Hernández (0.5998, 24, €70 million, €45 million).
GRD < 0.6812, age < 28.8, wage > €155 million. Samuel Umtiti (0.561, 26, €170 million, €10 million), whose wage was above average, was the only defender in our dataset who met these conditions. This implies that his on-field performance was worse than other defenders evaluated. His performance does not meet expectations; thus, his market value is €10 million. If Umtiti’s various indices do not improve, his salary will likely decrease, and his market value may also decrease.
Using Virgil van Dijk of Liverpool FC as an example and comparing the results of this study with The Sun’s rankings, he ranked first in terms of GRD (0.799) but 7th in The Sun. Virgil van Dijk performed well during the 2019–2020 football season, during which the COVID-19 pandemic struck. Although European football was suspended for over 3 months after the pandemic started in mid-March 2020, after the league reopened in mid-June, Liverpool FC won the team’s first European football championship, raising awareness of the importance of quality defenders. Virgil van Dijk was traded at a record salary of €86.59 million during the winter of 2017. Because the player was not particularly famous then, Liverpool FC was only willing to offer him a weekly salary of €144,000. However, because of his outstanding performance, he was later reoffered a new contract, raising the player’s weekly wage to €230,000, with an increase of 66%. Conversely, the salary of Matthijs de Ligt, who ranks first in European football, is twice that of Virgil Van Dijk. Having just joined this season, Matthijs de Ligt earned a weekly wage of €480,000, which was €134,000 higher than that of the second-ranked player, Thiago Silva, whose weekly salary was €346,000.
In this study, the player-relative value assessment matrix proposed by the experience of [38,42] calculates the GRD comprehensive index value for various indicators of an athlete’s performance to evaluate the ranking of defenders and then uses the salary of defenders to determine whether the salary and athletic performance of these 10 defenders are reasonable. Based on the ranking of the top 10 guards provided by The Sun [6], the proposed three-layer virtual IoT algorithm can reflect the current financial and market value of players in real-time, and the ranking closely reflects the facts. This study can allow players to determine their relative ranking, the scheduling of the coaching team, and the team’ management to understand the players’ athletic performance, age, wage, and market value.

6. Conclusions

By selecting the player to be tracked and parsing the web scraping analysis of each game from the sport’s official website, basic index data generated by players during each match were calculated objectively using the GRA method to evaluate the relative value of the players. Four main contributions can be identified in this study.
First, the three-layer virtual IoT tracking technology developed in this study, combined with the algorithm used, calculates the relative value and rankings of players of similar positions after each game during the season. Second, with smart virtual IoT tags, tagged players can become smart objects, facilitating automatic tracking and data reading on web pages. Third, in our calculation layer, GRA calculates the comprehensive index of each player from an objective perspective. This method is robust. Using this value, players can determine their relative performance and ranking throughout the season. These data can be provided to players, coaches, and teams as a crucial basis for contract negotiations. Finally, the proposed relative-value classification model for players provides a relative-value evaluation matrix for the top 10 defenders. Additionally, the proposed model analyzes the relative market value and classification. These data can form the basis upon which clubs can make trade decisions, salary negotiations, and sponsor negotiations, allowing advertising agents to determine appropriate sponsor fees. In the future, physical health factors and sports performances post-COVID-19 pandemic infection can be added as a value indicator for football players.
UEFA has announced that they expect club losses across the continent to reach 7 billion euros due to the impact of the COVID-19 pandemic on the 2019–20 and 2020–21 seasons. In 2020, 52 clubs declared bankruptcy. UEFA President Aleksander Čeferin suggested that the “financial fair play” competition regulations of each club must be adjusted and updated to make the clubs’ finances more transparent and to reduce the recurrence of bankruptcy [66]. The players’ wages account for most of the finances of the clubs’ entire operations. Therefore, in this study, the proposed three-layer virtual IoT algorithm calculates the comprehensive indicators of players with similar abilities objectively and fairly and provides a reference for clubs when calculating player wages and market value to avoid player wages being overestimated and causing financial difficulties.
A limitation of the present study is that only the top 10 defenders and the COVID-19 pandemic during the 2019–2020 season were investigated. Therefore, future studies could apply the following suggestions: (1) They could expand the research scope by evaluating all active European football defenders. The results of this study could be used as a benchmark for other defenders; (2) They could develop indices and relative values and perform classification analyses for different player positions (e.g., goalkeepers, midfielders, and forwards) to provide real-time relative situational analysis and suggestions for players in all roles; (3) They could compare players with similar conditions and automated decision making to achieve AI [11,38]; (4) They could compare their own techniques and research methods for different layers with those of others.

Funding

This research was funded by the National Taiwan University of Sport, grant number 110DG00116.

Institutional Review Board Statement

Not applicable.

Informed Consent Statement

Not applicable.

Data Availability Statement

Not applicable.

Conflicts of Interest

The author declares no conflict of interest.

References

  1. CNBC. Huge Pent-Up Desire’ for Live Sports Could Turn into an Oversupply Later this Year, Analyst Says. Available online: https://www.cnbc.com/2020/05/15/global-sports-economy-will-take-a-60-billion-hit-from-the-coronavirus.html (accessed on 15 May 2020).
  2. Real-Time News, The Epidemic of Athletes. Available online: https://rtmag.co.il/?view=article&id=49&catid=22 (accessed on 2 March 2022).
  3. Mon-López, D.; García-Aliaga, A.; Ginés Bartolomé, A.; Muriarte Solana, D. How has COVID-19 modified training and mood in professional and non-professional football players? Physiol. Behav. 2020, 227, 113148. [Google Scholar] [CrossRef] [PubMed]
  4. Nation, J.R.; Le Unes, A.D. Personality characteristics of intercollegiate football players as determined by position, classification, and redshirt status. J. Sport Behav. 1983, 6, 92–102. [Google Scholar]
  5. Bujnovsky, D.; Maly, T.; Ford, K.R.; Sugimoto, D.; Kunzmann, E.; Hank, M.; Zahalka, F. Physical fitness characteristics of high-level youth football players: Influence of playing position. Sports 2019, 7, 46. [Google Scholar] [CrossRef] [PubMed] [Green Version]
  6. The Sun. Liverpool to Hand Van Dijk New £50M Deal to Fend Off Juventus… but How Does It Compare to Other Defenders? Available online: https://www.the-sun.com/sport/premier-league/392185/liverpool-to-hand-van-dijk-new-50m-deal-to-fend-off-juventus-but-how-does-it-compare-to-other-defenders/ (accessed on 14 October 2020).
  7. Sportradar. Sportradar Delivers Sports Content and Coverage above 2019 Level. Available online: https://www.sportradar.com/news-archive/sportradar-delivers-sports-content-and-coverage-above-2019-levels/ (accessed on 23 April 2020).
  8. Aheleroff, A.; Xu, X.; Lu, Y.; Aristizabal, M.; Velásquez, J.P.; Joa, B.; Valencia, Y. IoT-enabled smart appliances under industry 4.0: A case study. Adv. Eng. Inf. 2020, 43, 101043. [Google Scholar] [CrossRef]
  9. Gupta, A.; Chakraborty, C.; Gupta, B. Medical information processing using smartphone under IOT framework. In Energy Conservation for IoT Devices; Mittal, M., Tanwar, S., Agarwal, B., Goyal, L., Eds.; Springer: Berlin/Heidelberg, Germany, 2019; p. 206. [Google Scholar] [CrossRef]
  10. Kalyani, V.L.; Gaur, P.; Vats, S.P. IoT: ‘Machine to machine’ application: A future vision. J. Manag. Eng. Inf. Technol. 2015, 2, 15–20. [Google Scholar]
  11. Xu, W. Toward human-centered AI. Interactions 2019, 26, 42–46. [Google Scholar] [CrossRef] [Green Version]
  12. Araújo, D.; Couceiro, M.; Seifert, L.; Sarmento, H.; Davids, K. Artificial Intelligence in Sport Performance Analysis, 1st ed.; Routledge: London, UK, 2021. [Google Scholar] [CrossRef]
  13. Rajšp, A.; Fister, I., Jr. A systematic literature review of intelligent data analysis methods for smart sport training. Appl. Sci. 2020, 10, 3013. [Google Scholar] [CrossRef]
  14. Camomilla, V.; Bergamini, E.; Fantozzi, S.; Vannozzi, G. Trends supporting the in-field use of wearable inertial sensors for sport performance evaluation: A systematic review. Sensors 2018, 18, 873. [Google Scholar] [CrossRef] [Green Version]
  15. Michahelles, F.; Schiele, B. Sensing and monitoring professional skiers. IEEE Pervasive Comput 2005, 4, 40–45. [Google Scholar] [CrossRef]
  16. Delgado, R. How the Internet of Things Is Turning into the Internet of Sports. Available online: http://tech.co/internet-things-turning-internet-sports-2014-09 (accessed on 14 October 2020).
  17. Huntington, S. The 7 Best Sports Apps. Available online: https://tech.co/news/best-sports-apps-2014-07 (accessed on 14 October 2020).
  18. Ko, H.; Lee, H.; Kim, T.; Pack, S. LPGA: Location Privacy-Guaranteed Offloading Algorithm in Cache-Enabled Edge Clouds; IEEE: Piscataway Township, NJ, USA, 2020. [Google Scholar]
  19. Halson, S.L. Monitoring training load to understand fatigue in athletes. Sports Med. 2014, 44, 139–147. [Google Scholar] [CrossRef] [Green Version]
  20. The Big Lead. Available online: http://thebiglead.com/2016/04/06/did-the-nfl-whiff-with-twitter-and-internet-streaming/ (accessed on 14 October 2020).
  21. Duffy, T. Did the NFL Whiff with Twitter and Internet Streaming? Available online: http://thebiglead.com/2016/04/06/did-the-nfl-whiff-with-twitter-and-internet-streaming/ (accessed on 14 October 2020).
  22. Mora, H.; Gil, D.; Terol, R.M.; Azorín, J.; Szymanski, J. An IoT-based computational framework for healthcare monitoring in mobile environments. Sensors 2017, 17, 2302. [Google Scholar] [CrossRef] [Green Version]
  23. Umek, A.; Zhang, Y.; Tomažič, S.; Kos, A. Suitability of strain gage sensors for integration into smart sport equipment: A golf club example. Sensors 2017, 17, 916. [Google Scholar] [CrossRef]
  24. Kos, A.; Umek, A. Smart sport equipment: SmartSki prototype for biofeedback applications in skiing. Pers. Ubiquitous Comput. 2018, 22, 535–544. [Google Scholar] [CrossRef]
  25. Gowda, M.; Dhekne, A.; Shen, S.; Choudhury, R.R.; Yang, S.; Yang, L.; Golwalkar, S.; Essanian, A. IoT platform for sports analytics. Mob. Comput. Commun. Rev. 2018, 21, 8–14. [Google Scholar] [CrossRef]
  26. Roslan, M.F.; Ahmad, A. Internet of Things (IoT)-based solution for real-time monitoring system in high jump sport. Int. J. Integr. Eng. 2019, 11, 197–205. [Google Scholar]
  27. De Prisco, R.; Guarino, A.; Lettieri, N.; Malandrino, D.; Zaccagnino, R. Providing music service in ambient intelligence: Experiments with gym users. Expert Sys. Appl. 2021, 177, 114951. [Google Scholar] [CrossRef]
  28. Glez-Peña, D.; Lourenço, A.; López-Fernández, H.; Reboiro-Jato, M.; Fdez-Riverola, F. Web scraping technologies in an API world. Brief. Bioinform. 2013, 15, 788–797. [Google Scholar] [CrossRef] [Green Version]
  29. Dongo, I.; Cardinale, Y.; Aguilera, A.; Martinez, F.; Quintero, Y.; Robayo, G.; Cabeza, D. A qualitative and quantitative comparison between web scraping and API methods for Twitter credibility analysis. Int. J. Web Inf. Syst. 2021, 17, 580–606. [Google Scholar] [CrossRef]
  30. Grace, A.N. Gender Effect Through Media: A Twitter Analysis of the NFL’s Carolina Panthers. Bachelor’s Thesis, Appalachian State University, Boone, NC, USA, 2018. [Google Scholar]
  31. Grace, A.N.; Mueller, T.S. Gender bias in sport media: A critical analysis of Twitter content and the National Football League’s Carolina Panthers. J. Gend. Stud. 2019, 28, 363–370. [Google Scholar] [CrossRef]
  32. Schedlbauer, J.; Raptis, G.; Ludwig, B. Medical informatics labor market analysis using web crawling, web scraping, and text mining. Int. J. Med. Inform. 2021, 150, 104453. [Google Scholar] [CrossRef]
  33. Vinué, G. A Web application for interactive visualization of European basketball data. Big Data 2020, 8, 70–86. [Google Scholar] [CrossRef]
  34. Uzun, E. A Novel Web Scraping Approach Using the Additional Information Obtained from Web Pages. IEEE Access 2020, 8, 61726–61740. [Google Scholar] [CrossRef]
  35. Sundaramoorthy, K.; Durga, R.; Nagadarshini, S. NewsOne—An aggregation system for news using web scraping method. In Proceedings of the International Conference on Technical Advancements in Computers and Communications (ICTACC), Melmaurvathur, India, 10–11 April 2017; pp. 136–140. [Google Scholar]
  36. Survey on Football League Table and Player Performance Prediction Using Data Science. Available online: https://doi.org/10.2139/ssrn.3978932 (accessed on 6 December 2021).
  37. Fister, I.; Fister, D.; Rauter, S.; Mlakar, U.; Brest, J.; Fister, I. Deep Analytics Based on Triathlon Athletes’ Blogs and News. In Recent Advances in Soft Computing; Matoušek, R., Ed.; MENDEL 2017; Advances in Intelligent Systems and Computing, 837; Springer: Cham, Switzerland, 2017. [Google Scholar] [CrossRef]
  38. Guarino, A.; Malandrino, D.; Zaccagnino, R. An automatic mechanism to provide privacy awareness and control over unwittingly dissemination of online private information. Comput. Netw. 2022, 202, 108614. [Google Scholar] [CrossRef]
  39. Valtolina, S.; Barricelli, B.R. An end-user development framework to support quantified self in sport teams. In New Perspectives in End-User Development; Paternò, F., Wulf, V., Eds.; Springer: Cham, Switzerland, 2017; pp. 413–443. [Google Scholar]
  40. Bhatia, M. IoT-inspired framework for athlete performance assessment in smart sport industry. IEEE Internet Things J. 2020, 8, 9523–9530. [Google Scholar] [CrossRef]
  41. Kopetz, H. Internet of Things. In Real-Time Systems Real-Time Systems; Springer: Boston, MA, USA, 2011. [Google Scholar] [CrossRef]
  42. Chang, C.W. Construction of value classification model by tracking NBA center players’ performance with virtual IoT tagging technology. J. Inf. Technol. 2020, 21, 295–303. [Google Scholar]
  43. Kumar, P.S.J.; Hu, W.; Li, X.; Lal, K. Mobile banking adeptness on man-in-the-middle and man-in-the-browser attacks. IOSR-J. MCA 2017, 4, 13–19. [Google Scholar] [CrossRef]
  44. Nowak, A.M.; Marszalek, J.; Molik, B. Sports performance tests for amputee football players: A scoping review. Int. J. Environ. Res. Public Health 2022, 19, 4386. [Google Scholar] [CrossRef]
  45. Zambom-Ferraresi, F.; Rios, V.; Lera-López, F. Determinants of sport performance in European football: What can we learn from the data? Decis. Support. Syst. 2018, 114, 18–28. [Google Scholar] [CrossRef] [Green Version]
  46. Sexton, T.R.; Lewis, H.F. Two-stage DEA: An application to major league baseball. J. Prod. Anal. 2003, 19, 227–249. [Google Scholar] [CrossRef]
  47. Radovanović, S.; Radojicic, M.; Jeremic, V.; Savic, G. A novel approach in evaluating efficiency of basketball players. J. Theor. Pract. Manag. 2013, 18, 37–45. [Google Scholar] [CrossRef]
  48. Villa, G.; Lozano, S. Dynamic network DEA approach to basketball games efficiency. J. Oper. Res. Soc. 2018, 69, 1738–1750. [Google Scholar] [CrossRef]
  49. Chitnis, A.; Vaidya, O. Performance assessment of tennis players: Application of DEA. Procedia Soc. Behav. Sci. 2014, 133, 74–83. [Google Scholar] [CrossRef] [Green Version]
  50. Chang, C.W. Using entropy to construct and evaluate players’ value and sustainable development model. J. Inf. Optim. Sci. 2019, 6, 1337–1349. [Google Scholar]
  51. Oukil, A.; Govindaluri, S.M. A systematic approach for ranking football players within an integrated DEA-OWA framework. Manag. Decis. Econ. 2017, 38, 1125–1136. [Google Scholar] [CrossRef]
  52. Tiedemann, T.; Francksen, T.; Latacz-Lohmann, U. Assessing the performance of German Bundesliga football players: A non-parametric meta frontier approach. Cent. Eur. J. Oper. Res. 2011, 19, 571–587. [Google Scholar] [CrossRef]
  53. Docker. New Vulnerability Scanning, Collab and Support Enhance Docker Pro and Team Subscriptions. Available online: https://www.docker.com/blog/new-collab-support-and-vulnerability-scanning-enhance-popular-docker-pro-and-team-subscriptions/ (accessed on 3 October 2020).
  54. UEFA.com. 2019/20 Season Bayern Reign as Coman Returns to haunt Paris. 2022. Available online: https://www.uefa.com/uefachampionsleague/history/seasons/2020/ (accessed on 25 March 2022).
  55. Fifaindex. 2021. Available online: https://www.fifaindex.com (accessed on 16 December 2021).
  56. Transfer Market. 2021. Available online: https://www.transfermarkt.com (accessed on 16 December 2021).
  57. Biniok, J. Tampermonkey. 2022. Available online: https://www.tampermonkey.net/documentation.php (accessed on 25 March 2022).
  58. Deng, J.L. Introduction to grey system theory. J. Grey Syst. 1989, 1, 1–24. [Google Scholar]
  59. Chang, E.C. Using the grey relational analysis to explore the relationship between scoring factors and performance of volleyball competition. Phys. Educ. J. 2011, 44, 275–289. [Google Scholar]
  60. Deng, J.L. Grey System Theory and Applications; Springer Science & Business Media: Kao-Li, Taiwan, 2000. [Google Scholar]
  61. Tsai, W.C. A study on the correlations of technique factors influence on tournament success or failure of top junior tennis player: Case study on world No. 1 Junior Chun-Hsin Tseng. Taiwan J. Sports Sch. Res. 2019, 66, 53–73. [Google Scholar]
  62. Oral, C. Financial performance evaluation of sport clubs traded in Borsa Istanbul by using grey relational analysis. Int. J. Econ. Financ. 2016, 8, 293. [Google Scholar] [CrossRef] [Green Version]
  63. Ecer, F.; Boyukaslan, A. Measuring performances of football clubs using financial ratios: The gray relational analysis approach. Am. J. Econ. 2014, 4, 62–71. [Google Scholar]
  64. Yimen, N.; Dagbasi, M. Multi-attribute decision-making: Applying a modified Brown–Gibson Model and RETScreen Software to the optimal location process of utility-scale photovoltaic plants. Processes 2019, 7, 505. [Google Scholar] [CrossRef] [Green Version]
  65. Yimen, N.; Tchotang, T.; Kanmogne, A.; Adamu, Y.; Fon, F.L.; Dagbasi, M. Brown–Gibson model as a multi-criteria decision analysis (MCDA) method: Theoretical and mathematical formulations, literature review, and applications. In Multiple Criteria Decision Making. Studies in Systems; Kulkarni, A.J., Ed.; Decision and Control; Springer: Singapore, 2022; Volume 407. [Google Scholar] [CrossRef]
  66. Brennan, E. UEFA Expects €7 Billion in Pandemic Losses. Available online: https://www.insidethegames.biz/articles/1118812/uefa-expects-billions-pandemic-losses (accessed on 4 February 2022).
Figure 1. Architecture of the three-layer virtual IoT algorithm.
Mathematics 10 02369 g001
Figure 2. Relative-value evaluation matrix for the top 10 defenders.
Mathematics 10 02369 g002
Figure 3. Relative market value analysis of the top 10 defenders.
Mathematics 10 02369 g003
Table 1. 2019–20 UEFA Champions League group stage and defenders.
StageClubDefendersSum
Group AParis Saint-GermainPresnel Kimpembe, Thilo Kehrer, Marquinhos, Juan Bernat, Colin Dagba, Abdou Diallo, Layvin Kurzawa, Thomas Best, Thiago Silva9
Real MadridDani Carvajal, Eder Militão, Sergio Ramos, Raphael Varane, Nacho, Marcelo, Alvaro Odriozola, Ferland Mendy8
Club BruggeEduard Sobol, Odilon Kossounou, Matej Mitrovic, Simon Deli, Federico Ricca, Dion Cools, Brandon Mechele, Clinton Mata8
GalatasaraySener Ozbayrakli, Omer Bayram, Mariano Ferreira, Christian Luyindama, Marcao, Yuto Nagatomo6
Group BBayern MunichThiago Alcantara, Javi Martinez, Mickael Cuisance, Leon Goretzka, Alphonso Davies, Corentin Tolisso, Sarpreet Singh, Joshua Kimmich, Joshua Zirkzee, Daniel Ontuzans, Lucas Hernández11
TottenhamDanny Rose, Toby Alderweireld, Jan Vertonghen, Davinson Sanchez, Eric Dier, Kyle Walker-Peters, Serge Aurier, Ben Davies8
OlympiakosRuben Semedo, Omar Elabdellaoui, Yassine Meriah, Kostas Tsimikas, Avraam Papadopoulos, Vasilis Torosidis, Papa Abou Cisse, Bruno Gaspar8
Red Star BelgradeMilos Degenek, Radovan Pankov, Srdjan Babic, Jander, Nemanja Milunovic, Milan Rodic, Marko Gobeljic7
Group CManchester CityKyle Walker, John Stones, Oleksandr Zinchenko, Angelino, Aymeric Laporte, Benjamin Mendy, Joao Cancelo, Nicolas Otamendi8
Shakhtar DonetskBogdan Butko, Sergii Kryvtsov, Davit Khocholava, Mykola Matviyenko, Ismaily, Eduardo, Dodo7
GNK Dinamo ZagrebIvo Pinto, Jacques Francois Moubandje, Marin Leovac, Kevin Theophile-Catherine, Petar Stojanovic, Marko Leskovic, Joska Gvardoil, Dino Peric, Emir Dilaver9
AtalantaRafael Toloi, Simon Kjaer, Andrea Masiello, Jose Luis Palomino, Robin Gosens, Guilherme Arana, Berat Xhimshiti, Timothy Castagne, Hans Hateboer, Roger Ibanez10
Group DJuventusMattia De Sciglio, Matthijs De Ligt, Alex Sandro, Danilo, Leonardo Bonucci, Daniele Rugani, Marih Demiral7
Atletico MadridJose Giménez, Santiago Arias, Renan Lodi, Stefan Savic, Felipe, Mario Hermoso, Kieran Trippier, Sime Vrsaljko8
Bayer LeverkusenPanagiotis Retsos, Jonathan Tah, Sven Bender, Aleksandar Dragovic, Wendell, Mitchell Weiser6
Lokomotiv MoscowDmitiri Zhivoglyadov, Bryan Idowu, Benedikt Howedes, Vedran Corluka, Vladislav Ignatyev, Murilo Cerquiera, Boris Rotenberg, Maciej Rybus, Solomon Kverkvelia9
Group ELiverpoolVirgil van Dijk, Dejan Lovren, Joe Gomez, Andy Robertson, Joel Matip, Sepp van den Berg6
NapoliKevin Malcuit, Mario Rui, Sebastiano Luperto, Nikola Maksimovic, Giovanni Di Lorenzo, Mario Rui, Elseid Hysaj, Kalidou Koulibaly, Faouzi Ghoulam, Kostas Manolas10
Red Bull SalzburgAlexander Walke, Albert Vallci, Jerome Onguene, Andre Ramalho, Andreas Ulmas, Patrick Farkas, Marin Pongracic, Maximilian Wober, Rasmus Kristensen9
GenkDries Wouters, Neto Borges, Sebastien Dewaest, Jere Uronen, Joakim Maehle, Jhon Lucumi, Carlos Cuesta, Vladimir Screciu8
Group FBarcelonaNelson Semedo, Gerard Piqué, Jean-Clair Todibo, Clement Lenglet, Moussa Wagué, Jordi Alba, Samuel Umtiti, Junior Firpo, Ronald Araújo9
Borussia DortmundManuel Akanji, Leonardo Balerdi, Achraf Hakimi, Raphael Guerreiro, Mats Hummels, Mateu Morey, Lukasz Piszczek, Marcel Schmelzer, Nico Schulz, Julian Weigl, Dan-Axel Zagadou11
InterDiego Godin, Stefan De Vrij, Andrea Ranocchia, Kwadwo Asamoah, Federico Dimarco, Danilo D’Ambrosio, Cristiano Biraghi, Milan Skriniar, Andrea Bastoni9
Slavia PragueDavid Hovorka, Tomas Holes, Vladimir Coufal, Jaroslav Zeleny, Ondrej Kudela, Jan Boril, Ladislav Takacs, Michal Frydrych8
Group GZenit St PetersburgDouglas Santos, Yordan Osorio, Branislav Ivanovic, Vyacheslav Karavaev, Igor Smolnikov, Emanuel Mammana, Yaroslav Rakitskyy7
BenficaGerman Conti, Alex Grimaldo, Ruben Dias, Tyronne Efe Ebuehi, Jardel, Andre Almeida, Ferro7
LyonMapou Yanga-Mbiwa, Joachim Andersen, Rafael, Jason Denayor, Marcelo, Leo Dubois, Fernando Marcal, Kenny Tete, Oumar Solet, Youssouf Kone10
RB LeipzigMarcelo Saracchi, Willi Orban, Dayot Upamecano, Ibrahima Konate, Lukas Klostermann, Nordi Mukiele, Marcel Halstenberg, Ethan Ampadu, Frederick Jakel9
Group HChelseaAntonio Rudiger, Marcos Alonso, Andreas Christensen, Kurt Zouma, Cesar Azpilicueta, Fikyaro Tomori, Emerson7
AjaxPerr Schuurs, Joel Veltman, Kik Pierie, Noussair Mazraoui, Daley Blind, Lisandro Martinez, Nicolas Tagliafico7
ValenciaThierry Correia, Jaume Costa, Eliaquim Mangala, Gabriel, Mouctar Diakhaby, Jose Gaya, Ezequiel Garay7
LOSC LilleTiago Djalo, Gabriel, Adama Soumaoro, Jose Fonte, Zeki Celik, Jeremy Pied, Reinildo Mandavam, Domagoj Bradaric8
Total261
Table 2. Virtual IoT tags for tracking URLs and filtering the database results of the top 10 defenders during the 2019–2020 season.
DefendersWebpagesURLAppearancesGoalsAssistsM PYCSYCRCAgeWageCMVHMVOutfitter
Matthijs de LigtFIFAIndexhttps://www.fifaindex.com/player/235243/matthijs-de-ligt/39413.349′50021€80 m€75 m€75 mAdidas
Transfer Markethttps://www.transfermarkt.com/matthijs-de-ligt/profil/spieler/326031
Thiago SilvaFIFAIndex https://www.fifaindex.com/player/164240/thiago-silva/35112.725′40036€95 m€3.5 m€40 mNike
Transfer Market https://www.transfermarkt.com/thiago-silva/profil/spieler/29241
Lucas HernándezFIFAIndex https://www.fifaindex.com/player/220814/lucas-hern%C3%A1ndez/25021.119′40024€70 m€45 m€70 mNike
Transfer Markethttps://www.transfermarkt.com/lucas-hernandez/profil/spieler/281963
Gerard PiquéFIFAIndex https://www.fifaindex.com/player/152729/piqu%C3%A9/45103.986′200033€220 m€12 m€50 mNike
Transfer Markethttps://www.transfermarkt.com/gerard-pique/profil/spieler/18944
MarquinhosFIFAIndex https://www.fifaindex.com/player/207865/marquinhos/37613.043′40026€115 m€70 m€70 mNike
Transfer Markethttps://www.transfermarkt.com/marquinhos/profil/spieler/181767
Samuel UmtitiFIFAIndex https://www.fifaindex.com/player/205600/samuel-umtiti/18001.316′60026€170 m€10 m€70 mPuma
Transfer Markethttps://www.transfermarkt.com/samuel-umtiti/profil/spieler/126540
Virgil van DijkFIFAIndex https://www.fifaindex.com/player/203376/virgil-van-dijk/50524.590′10029€210 m€70 m€100 mNike
Transfer Markethttps://www.transfermarkt.com/virgil-van-dijk/profil/spieler/139208
Sergio RamosFIFAIndex https://www.fifaindex.com/player/155862/sergio-ramos/441313.828′100134€300 m€14 m€50 mNike
Transfer Markethttps://www.transfermarkt.com/sergio-ramos/profil/spieler/25557
MarceloFIFAIndex https://www.fifaindex.com/player/10961/marcelo-salas/fifa05/23271.854′30032€170 m€10 m€70 m-
Transfer Markethttps://www.transfermarkt.com/marcelo/profil/spieler/44501
Harry MaguireFIFAIndex https://www.fifaindex.com/player/203263/harry-maguire/55334.962′90027€120 m€40 m€70 mNike
Transfer Market https://www.transfermarkt.com/harry-maguire/profil/spieler/177907
FIFAIndex URL: accessed on 16 December 2021; Transfer Market URL: accessed on 16 December 2021.
Table 3. Basic original data of the top 10 European defenders during the 2019–2020 season.
DefendersClubAppearancesGoalsAssistsMPYCSYCRC
Matthijs de LigtJuventus FC39413.349′500
Thiago SilvaParis Saint-Germain35112.725′400
Lucas HernándezBayern Munich25021.119′400
Gerard PiquéFC Barcelona45103.986′2000
MarquinhosParis Saint-Germain37613.043′400
Samuel UmtitiFC Barcelona18001.316′600
Virgil van DijkLiverpool FC50524.590′100
Sergio RamosReal Madrid441313.828′1001
MarceloReal Madrid23271.854′300
Harry MaguireManchester United55334.962′900
Table 4. Normalization of basic data of top 10 defenders.
DefendersClubAppearancesGoalsAssistsMPYC
Matthijs de LigtJuventus FC0.56760.30770.14290.58030.7895
Thiago SilvaParis Saint-Germain0.45950.07690.14290.41790.8421
Lucas HernándezBayern Munich0.18920.00000.28570.00000.8421
Gerard PiquéFC Barcelona0.72970.07690.00000.74600.0000
MarquinhosParis Saint-Germain0.51350.46150.14290.50070.8421
Samuel UmtitiFC Barcelona0.00000.00000.00000.05130.7368
Virgil van DijkLiverpool FC0.86490.38460.28570.90321.0000
Sergio RamosReal Madrid0.70271.00000.14290.70490.5263
MarceloReal Madrid0.13510.15381.00000.19130.8947
Harry MaguireManchester United1.00000.23080.42861.00000.5789
Table 5. Differences between defender sequences Δ 0 j j .
DefendersClubAppearancesGoalsAssistsMPYC
Matthijs de LigtJuventus FC0.43240.69230.85710.41970.2105
Thiago SilvaParis Saint-Germain0.54050.92310.85710.58210.1579
Lucas HernándezBayern Munich0.81081.00000.71431.00000.1579
Gerard PiquéFC Barcelona0.27030.92311.00000.25401.0000
MarquinhosParis Saint-Germain0.48650.53850.85710.49930.1579
Samuel UmtitiFC Barcelona1.00001.00001.00000.94870.2632
Virgil van DijkLiverpool FC0.13510.61540.71430.09680.0000
Sergio RamosReal Madrid0.29730.00000.85710.29510.4737
MarceloReal Madrid0.86490.84620.00000.80870.1053
Harry MaguireManchester United0.00000.76920.57140.00000.4211
Table 6. Calculation of grey relational coefficient λ 0 j j .
DefendersClubAppearancesGoalsAssistsMPYCGRD
Matthijs de LigtJuventus FC0.69810.59090.53850.70440.82610.6716
Thiago SilvaParis Saint-Germain0.64910.52000.53850.63210.86360.6407
Lucas HernándezBayern Munich0.55220.50000.58330.50000.86360.5998
Gerard PiquéFC Barcelona0.78720.52000.50000.79750.50000.6209
MarquinhosParis Saint-Germain0.67270.65000.53850.66700.86360.6784
Samuel UmtitiFC Barcelona0.50000.50000.50000.51320.79170.5610
Virgil van DijkLiverpool FC0.88100.61900.58330.91171.00000.7990
Sergio RamosReal Madrid0.77081.00000.53850.77220.67860.7520
MarceloReal Madrid0.53620.54171.00000.55290.90480.7071
Harry MaguireManchester United1.00000.56520.63641.00000.70370.7811
Table 7. Relative value index of the top 10 defenders.
DefendersClubAgeWage
(Euro)
CMV (Euro)HMV (Euro)GRDGRD RankingThe Sun RankingOutfitter
Matthijs de LigtJuventus FC21€80 m€75 m€75 m0.671661Adidas
Thiago SilvaChelsea FC36€95 m€3.5 m€40 m0.640772Nike
Lucas HernándezBayern Munich24€70 m€45 m€70 m0.599893Nike
Gerard PiquéFC Barcelona33€220 m€12 m€50 m0.620984Nike
MarquinhosParis Saint-Germain26€115 m€70 m€70 m0.678455Nike
Samuel UmtitiFC Barcelona26€170 m€10 m€70 m0.5610106Puma
Virgil van DijkLiverpool FC29€210 m€70 m€100 m0.799017Nike
Sergio RamosReal Madrid34€300 m€14 m€50 m0.752038Nike
MarceloReal Madrid32€170 m€10 m€70 m0.707149-
Harry MaguireManchester United27€120 m€40 m€70 m0.7811210Nike
Publisher’s Note: MDPI stays neutral with regard to jurisdictional claims in published maps and institutional affiliations.

