Abstract
An increasing effort has been put into dealing with the question of time-series analysis regarding institutional efficiency, including in the area of higher education. Universities are important institutions for economies and societies and are expected to provide excellence as well as efficiency in their processes and outputs. This is reflected in the context of an increased global competitive environment by more refined international university rankings. Combining the two areas, this paper points towards a methodological challenge in comparing different ranking datasets for their use in a data envelopment analysis (DEA) Malmquist index time-series efficiency analysis, namely, index-based data compared to additive data. The problem is discussed in a theoretical framework and complemented with an empirical application: calculations for 70 European universities with budget and staff input data and different ranking output data for the timeframe of 2011–2016 show that there is no evidence for a specific index data problem. Important implications regarding university management and higher education policies are outlined. Efficiency improvements among the analyzed universities are significant but also unevenly distributed and not easy to obtain for individual institutions.
1. Introduction
University institutions play an important role in economic development, innovation, and internationalization, e.g., through their objectives of research, teaching, and third mission, and therefore for societies at large. Steering resources within university systems, as done by higher education politicians regarding public budgets, by university managers within the institutions themselves as well as by stakeholders, such as corporations as research partners, and students as study program participants, is an important task within the economic and management domain. To fulfil this task effectively, deciders have to rely on information regarding the performance of universities, recently, for example, provided by a growing number of national and international university rankings [1,2,3,4]. Rankings have evolved regarding their principal setup, incorporating criticism addressing indicators, institutional inclusion, and data quality, including the discourse on journal publication and the individual researcher level [5,6,7,8]. This also went hand in hand with an increased influence on policies and resource decisions in higher education [9,10,11,12]. Regarding the analysis and use of ranking data as well as for higher education efficiency analysis in general, increasing emphasis is put on the question of dynamic time-series developments. Specific calculation methods, such as data envelopment analysis (DEA) window analysis as well as DEA Malmquist index, are employed for such questions. As Parteka and Wolszczak-Delacz [13] (p. 68) outline, this may overcome shortcomings of former analysis perspectives which had focused mainly on static efficiency analysis results [14,15,16,17,18,19,20,21,22,23]. The underlying technique for efficiency measurement is the DEA introduced by Charnes, Cooper, and Rhodes [24] in the basic form with constant returns to scale (CRS) and extended by Banker, Charnes, and Cooper [25] with variable returns to scale (VRS). DEA applications within the higher education sector as a typical multi-input and multioutput production environment are numerous [26,27,28,29,30,31,32,33]. In addition, the Malmquist index for analysing longitudinal developments over time [34,35,36] has also been applied for universities, e.g., for the Philippines [37] and Australia [38].
This paper addresses the research question of if university ranking data is applicable for longitudinal efficiency analysis endeavors. The specific methodological question therein is, if ranking index data can be used. This is motivated by the potential problem that an increased university input volume could not be met by an increased university output volume if index numbers are used.
This is of importance, as many rankings, as for example the Times Higher Education (THE) ranking as well as the ARWU Shanghai ranking, use index numbers for comparing the performance of universities for any yearly publication [39,40]. In these cases, all performance and evaluation measures are indexed for a maximum value of 100. If such an index number problem would exist for dynamic efficiency analysis, it would restrict the analysis potential of using university ranking data as one of the largest and most comprehensive international datasets. To test for this specific problem, a DEA Malmquist index calculation is applied with three different datasets from (a) the THE ranking with index numbers; (b) the CWTS Leiden ranking without index numbers; as well as (c) the combined case with data from both rankings systems as output indicators. This methodological management science question may also be applied to other industries. For higher education, it is connected to the research discussion of university rankings being a “zero sum game”, as rankings depict only relative positions of institutions among themselves, not the overall (e.g., quality, productivity, excellence) development of the higher education sector (see for example [41] (pp. 195–196) or [42] (p. 45)). Additionally, many researchers also connect this question to the presumably necessary increasing input volumes (budget, staff, further tight resources) in order to stay in the same positions within university rankings, such as, for example, Hazelkorn argues [43] (p. 71). For efficiency analysis matters and methodology, this is connected to the question of industry or structural efficiency as introduced by Farrell [44] (p. 262), [45] (p. 165).
The remainder of this paper is structured as follows: Section 2 describes the characteristics of university rankings and their data, especially for the applied systems of the THE and CWTS university rankings. Section 3 provides the methodological background regarding DEA and the Malmquist index as well as a short insight into index number theory. Section 4 presents the calculation results for the ranking datasets. Section 5 lays down some discussion points before Section 6 closes with conclusions and possible further research questions.
2. Ranking Systems and Research Data
University rankings have been established as a part of the higher education information environment for stakeholders, such as students, university managers, corporations, as well as politicians. However, they are also informative for researchers interested in the performance and international or national comparison of university institutions [46,47,48,49,50]. The following two ranking systems have been used in order to gather longitudinal output data for several universities [51,52,53]:
(A) The Times Higher Education (THE) ranking is one of the most long-standing and acknowledged international university rankings, established in 2004. This ranking has incorporated several changes due to feedback and criticism during the last decade. The THE ranking establishes five evaluation areas, all individually indexed for a maximum of 100. For the 2015/16 ranking, for example, the leading California Institute of Technology received the evaluation results of 95.6 for teaching, 64.0 for international outlook, 97.6 for research, 99.8 for citations, and 97.8 for industry income. This altogether provided the total ranking evaluation of 95.2. Though there have been changes and adaptions in the underlying 13 evaluation indicators, the basic setup of this structure has been continued since the 2011 ranking. Therefore, data can be used in this timeline (2011–2016) in a sensible way. In a detailed breakdown, the 13 indicators are explained as follows in Table 1.

Table 1.
Indicator Weights and Definitions for the THE Ranking [54].
The following thresholds and inclusion criteria are employed by THE, which play an important role in the question of which institutions are listed and which not: Universities are excluded from the ranking if they do not teach undergraduates or if their research output averaged fewer than 200 journal articles per year over the five-year period 2010–2014. In exceptional cases, institutions below the 200-paper threshold are included if they have a particular focus on disciplines with generally low-publication volumes. There are significant and elaborate processes in place regarding data gathering, also including a defined error management approach. This is connected to the “Berlin Principles on Rankings of Higher Education Institutions” (see [55] (pp. 51–53) and [56] (pp. 80–86)). Institutions provide and sign off their institutional data for use in the THE ranking. On the rare occasions when a particular data point is not provided, a low estimate between the average value and the lowest value reported by all institutions is entered (25th percentile of all data values). In addition, a standardization approach for each indicator is used based on the distribution of data within a particular indicator—a cumulative probability function using a version of Z-scoring (see [57] (pp. 91–93) and [58]). Within the applied dataset from THE, not all out of the five indicator values reached a maximum of 100 among the selected 70 European universities, as in some cases the 100 maximum value was attained by a non-European university (Australia, Canada, China, the United States, etc.).
(B) The CWTS Leiden ranking is seen as one of the international rankings featuring the highest quality standards, especially because of the high impact of research, publication, and citation data included [53]. In this analysis, size-independent data is used in order to maintain comparability. In addition, due to input data such as budget size, institutional size is already incorporated. Data has been available for this ranking since 2011 [59]. CWTS data is based on bibliometric statistics from the Web of Science (Thomson Reuters), where the universities in the 2016 edition of the Leiden Ranking are ranked according to their percentage of highly cited publications. A publication therein is considered highly cited if it belongs to the top 1%, 10%, or 50% most cited publications in its field as explained by [60]. This focused basis on publications and citations from one large database is a strength (in terms of comparability and data quality) and also a weakness, e.g., regarding disciplinary bias or quality evaluation (see [11] (pp. 13–14)). Compared to THE ranking data, for CWTS data, there is no index value used but additive data with no upper bound (e.g., citations numbers). From the CWTS dataset, P (publications, with partial share points for coauthors), TCS and TCNS (total citations and total citations normalized), as well as P_top1 and P_top50 (number of publications among the top 1% or 50% most frequently cited) are selected.
For input data gathering, the European ETER project was used, which provides large datasets (among others: budgets, staff, students, graduates, etc.) for the years 2011, 2012, and 2013 in the current version, accessible via the Internet [61]. Concurrent with the time series in the THE ranking datasets, input data total budget and total academic staff was used, connecting the input year 2011 with the output (ranking) data of 2011 and 2012, the 2012 input year with the output data of 2013 and 2014, as well as the 2013 input year with the output data of 2015 and 2016.
University selection for this analysis was established regarding the principle of selecting the European institutions from the 2011 THE ranking, which featured the top 200 universities worldwide; that amounted to 81 universities. Furthermore, 11 institutions had to be excluded due to missing data, some due to missing or inconsistent ranking data (THE or CWTS), the majority due to missing input budget or staff data (ETER), leaving 70 institutions. Data as described in Table 2 for 2 example universities has been used for all 70 universities. In this case, the research question can be highlighted: as the University of Oxford (UK) has increased budget and staff input for 2011–2016 by 20.54% and 13.87%, respectively, output numbers have risen in the indexed THE ranking by 5.80% on average, whereas in the nonindexed CWTS ranking, output has risen by 34.33%. On the other hand, for the University of Würzburg (Germany), numbers are different. With a budget increase by 2.06% and a staff increase by 4.24%, the output rise amounted to 17.51% with THE, but only to 14.08% with CWTS.
Table 2.
Calculation Data Cut-out for Two Example Universities, Sources: [39,40,61].
Figure 1 highlights the input–output scheme for the analysis, in this case regarding the THE indicators as outputs. Some example correlations are included, especially the input indicator correlation between budget and staff of r = 0.86.
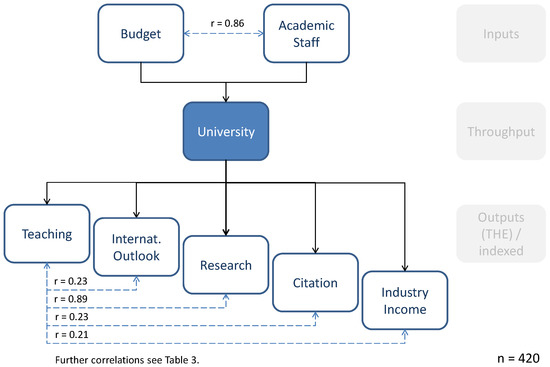
Figure 1.
Input and Output Indicators and Correlations.
Further correlations between input and output indicators assessed from the whole dataset of 420 units (70 universities and 6 years of data) are outlined in Table 3. Interestingly, high correlation levels are not only obvious between the two input indicators budget and academic staff, but also among output indicators, mainly within the two used ranking systems, for example, between the THE indicators “Teaching” and “Research” (0.890), calling in mind the “Humboldt principle” regarding the unity of teaching and research [62] (p. 274), [63,64], and also among the CWTS indicators publications (P) and citations (TCS, 0.963, and TNCS, 0.980), which is obvious given the fact that the same database is used and publications are a requirement for receiving citations. The same holds true for the correlation of publications with being among the top 1% or top 50% of cited publications (0.921 and 0.995, respectively). Therefore, it can be concluded that especially the CWTS indicators are highly correlated as they stem from the same database and are all connected to initial publications.
Table 3.
Total Input and Output Indicator Correlations (n = 420).
Furthermore, high correlations between the two rankings datasets can also be observed: THE indicators “Teaching” and “Research” feature high correlation levels with all CWTS (publication-based) indicators. For “Research”, this is not so much surprising, for “Teaching”, it surely is.
Finally, it can also be of interest to look into low levels of correlation. The THE indicators “International Outlook” as well as “Industry Income” show only weak to nonexistent correlations with the other indicators within THE as well as in CWTS. This can support the hypothesis that these fields are fairly independent and should be covered by separate indicators (as THE argues, for example). It also can be seen as proof for a supposition that these areas do not really belong to the core of academic and university objectives. At least, the negative correlation between citations and industry income can be seen in such a light of “estrangement” between academe and the corporate world. At least, it can be understood from an individual researcher’s perspective, who often enough faces the nontrivial trade-off between time invested in topics interesting from an academic perspective and derived publications on the one hand, and industry-affine questions with connected projects, income, and publications for those topics.
3. Research Methodology and Index Numbers
The data envelopment analysis (DEA) method is based on works of Koopmans regarding the activity analysis concept [65], Debreu [66] and Farrell in terms of the radial efficiency measure [44], as well as the works of Diewert [67]. This led to the specific DEA method suggestion by Charnes, Cooper, and Rhodes in 1978 [24]. Reasons for the increasing use of this efficiency analysis technique in higher education research are the fact that no a priori knowledge about a production function is required, only real-life data is used, and a multitude of inputs can be combined with a multitude of outputs, which is very typical for universities as “multi-product-organisations” [68,69,70,71,72,73].
DEA studies decision making units (DMU), which can be seen as the entities responsible for input, throughput, and output decision making [74] (p. 22). DMU such as, e.g., university institutions, departments, schools, or institutes and research groups, can be evaluated and compared, showing a specific level of decision-making success in terms of overall efficiency. DEA uses a nonparametric mathematical programming approach for the evaluation of DMU efficiency relative to each other. Further, it is assumed that there are several DMU and it is supposed that inputs and outputs comply with these requirements:
- ▪
- For each input and output, there are numerical, positive data for all DMU.
- ▪
- Selected values (inputs, outputs, and the chosen DMU) should depict the interest of decision-makers towards the relative efficiency evaluations.
- ▪
- DMU are homogenous in terms of identical inputs and outputs.
- ▪
- Input and output indicator units and scales are congruent.
Furthermore, two different models can be distinguished. The CCR model, named after the authors Charnes, Cooper, and Rhodes [24], with constant returns to scale, and the BCC model with variable returns to scale [25]. For both models and their efficiency measurement, the following specifications are made [75] (p. 239):
n the number of DMU to be evaluated
DMUj the jth DMU
m the number of inputs to each DMU
s the number of outputs to each DMU
xij amount of the ith input consumed by DMU j
ykj amount of the kth output produced by DMU j
eff abbreviation for efficiency
vi the weight assigned to the ith input
uk the weight assigned to the kth output.
A basic characteristic of the CCR model is the reduction of a multioutput and multi-input setting to a single (weighted) input and output combination for each DMU. For a certain DMU, measuring its efficiency and comparison with other DMU in the system is enabled. Usually executed by a series of linear programming formulations, DMU performance comparison facilitates a ranking of the different analyzed DMU and scales their relative efficiency from low to high, whereby the latter is defined as efficient. The CCR model contains both mathematical maximization and minimization problems. Detecting DMU relative technical efficiency requires on the one hand detection of each DMU technical efficiency, and on the other hand, the comparison of all DMU efficiencies. These steps are executed in the DEA simultaneous arithmetic operation. The calculation of the DMU efficiency value results from the consideration of the weighted inputs and weighted outputs. With the help of quantified inputs and quantified outputs, DEA generates via a quotient one single efficiency ratio for each DMU. The weighting factors are endogenously determined and allow the pooling of heterogeneous inputs and outputs with different units of measurement in one efficiency ratio. Hereby, each DMU’s weights are considered optimally in order to maximize the efficiency value and determine only the definitely provable inefficiency. With the help of the following figure, the different scales of CCR and BCC are depicted in the case of a single input and single output situation. In Figure 2, H illustrates a scale-efficient DMU (on the border production function). Inspection of DMU K reveals that the distance XJ/XK stands for possible input savings regarding a decline of technical inefficiency, whereas XK/YL represents possible output enlargements regarding the decline of technical inefficiency. The distance XI/XK stands for the gross-scale efficiency and XI/XJ shows the pure-scale efficiency with a corrected input. YL/YM stands for the pure-scale efficiency with corrected output (in case of variable scales).
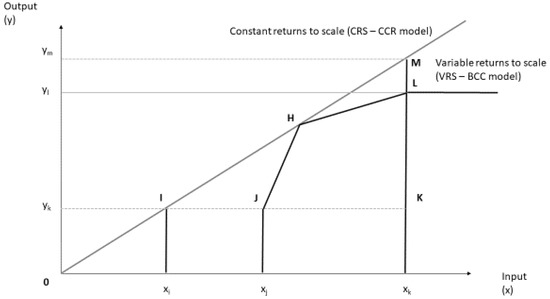
Figure 2.
DEA Frontier Graph for CCR and BBC Models.
Calculating DMU efficiency, it can be observed that DMU H has the highest efficiency value. Building the border production function (“envelopment function”) under the assumption of constant returns to scale (CCR) therefore complies with a line through the origin. This function with the assumption of variable returns to scale (BCC) is built by combining the points J, H, and L. As this is the case, the area of production opportunities is limited by the set of convex combinations of realized productions belonging to the border production function. Therefore, in the case of variable returns to scale, DMU J, H, and L are efficient, whereas DMU K is inefficient. In a CCR model, usually only one DMU is found to be efficient, whereas in a BCC model several, DMU are expected to be efficient.
Based on early works of Malmquist [34], Caves, Christensen, and Diewert [12] proposed a calculation of a productivity index in order to shed light on efficiency changes over time. This longitudinal perspective is promising for the DEA method, as most efficiency measurement approaches are directed towards the question of efficiency improvement. To provide usable information for this objective, the index is therefore distinguishing between a technological progress for the whole set of DMU, as, for example, universities—individually adapted for each institution—on the one side, and the technological efficiency on the other side [35]. This second technological efficiency is caused by the organizational and process setup of an institution. The following formula depicts the mathematical distance function algorithm used for the Malmquist index [36,38]:
Regarding the use of index numbers, the basic discussion can be divided into three areas of economic application and discussion: (i) Based on mathematical theory, the first and still foremost application area for index numbers was the question of price and monetary value development over time, as, for example, outlined by Fisher (1911, 1922) [76,77], as well as Divisia [78]. This “basket index” field is still discussed and amended today as an intertemporal application, e.g., with questions regarding testing and quality evaluation of price indices [79,80]; (ii) The second area of index number application in economics is further intertemporal comparisons of organizational or industry quantities such as indexed economic cycle growth and development indices or forecasts [81]; (iii) The third area applies the use of index numbers for an interorganizational or geographical comparison of economic quantities such as production outputs between different corporations or commodity prices between different trading locations and stock markets [82,83]. This third application area has to be connected to the index number application in question here, which is the interorganizational comparison of university performance measures within ranking systems. Many problems have been identified in connection with the use of index numbers starting with, e.g., [84]. Mainly quality and stability problems allocated to the basket or definition problems are on record [85,86], but also problems of numerical comparison due to index number calculation are expressed [87,88].
4. Results
The following results have been obtained in a Malmquist index calculation for the timeframe 2011–2016 regarding the 70 selected European universities. The calculation was conducted with the software package BANXIA Frontier Analyst with an output maximization mode in a BCC model with variable returns to scale.
Three calculation runs are reported, all with the same input data (budget and staff data). (I) First, inputs were combined with five output indicators from the THE ranking (all indexed values); (II) Second, two input indicators were combined with five selected output indicators from the CWTS Leiden ranking (all nonindexed values); (III) Third, the inputs were combined in a DEA Malmquist calculation with 10 output indicators (five from THE as indexed values, five from CWTS ranking results as nonindexed values). No superefficiencies were calculated for these DEA runs, therefore all efficient units are showing a maximum efficiency score of 100.00. Table 4 presents the base efficiencies calculated for the initial year 2011 for all 70 universities.
Table 4.
University Efficiency Scores and Returns to Scale 2011 (Base Year).
The reason for applying three different calculation runs is to look into possible differences between efficiency level changes of indexed data and nonindexed ranking data in the two different cases. The third run (III) is a control case where both datasets are combined. This should enable a result regarding the question of if an index data problem is existing in using university ranking data for a DEA longitudinal efficiency analysis.
From Table 4, the following obvious recognitions from the data results have to be stated in order to support a further discussion in the next section. First, the 2011 efficiency values for the three calculation runs feature different values for the 70 universities. This can be expected, as different output indicators lead to different efficiency values in a relative efficiency measurement scheme. For some institutions, such as, e.g., Cambridge or the Karolinska Institute, identical efficiency scores are calculated, as such an institution is leading across a multitude of output indicators.
Second, several universities accomplish decreasing returns to scale or even increasing returns to scale, proving the assumption that the DEA BCC model for variable returns to scale is appropriate for university and higher education efficiency analysis settings.
Third, 17 (respectively 2 and 24) out of 70 universities are calculated as being efficient in regard to the selected two inputs and five (respectively 10 in run III) outputs. This is a comparatively high number, underlined by the average efficiency of all 70 universities of 87.21% (run I). For comparison, do Jiménez-Sáez et al. [89] (p. 235) report a mean efficiency of between 58.2% and 82.2% for Spanish research programs between 1988 and 1999. Therefore, a proposed problem with the index numbers (used in runs I and III) cannot be shown. This is supported by detailed data from Table 5 and Figure 3, indicating that there are differences in the efficiency development (measured by the DEA Malmquist index), as can be expected due to different output indicators. However, these differences do not point towards a significant structural disadvantage of index numbers (with the THE data in run I and run III). Especially, the 2012–2016 mean efficiency improvement is nearly identical (1.0266; 1.0251; 1.0240—bold numbers) for the three calculation runs.
Table 5.
Mean Efficiency Improvement Scores in Three Calculation Runs I–III.
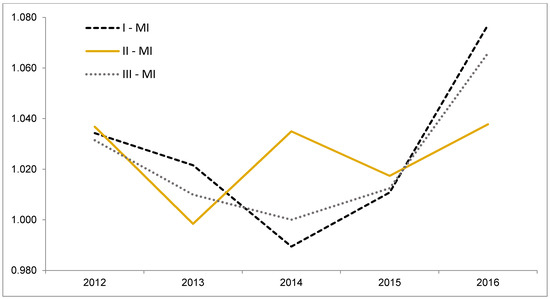
Figure 3.
Mean Malmquist Index 2012–2016 for Three Datasets (Run I, II, III).
Table 6 reports some cut-outs for Malmquist index values per university in the calculated dataset for run III. From this, the following observations can be noted in order to support the discussion (Section 5). Leading institutions for annual efficiency improvements are, for example, the University of Konstanz (33.20% improvement 2016 on 2015, run III), Bielefeld University (30.06% improvement 2016 on 2015), and the Technical University of Munich (22.87% improvement 2016 on 2015). The fact that the top improvement numbers are reduced significantly in the first ranking positions as well as the fact that, for example, Bielefeld University is also listed among the bottom 30 institutions regarding annual efficiency changes (−19.39% for 2012 on 2011) hints to the assumption that data irregularities or changes in data gathering, e.g., with the ranking systems or within the universities themselves, have led to these high numbers in efficiency changes. Therefore, in the next table, the long-term average changes are also reported.
Table 6.
Top 30 and Bottom 30 Annual Malmquist Index 2012–2016 (Cut-out, Sorted from Run III).
Further on, Table 7 depicts the average of all year-on-year changes in efficiency between 2011 and 2016 for all universities, ranked according to the average Malmquist index values (total average efficiency change). The following statements may be derived in a first analysis concerning run III (last three columns). The highest level of average improvement over the six-year period was attained by the German RWTH University Aachen (average 1.0748 or 7.48% annually), followed by the University of Copenhagen (Denmark), as well as the University of Tübingen (Germany). Obviously, the individual leaders of efficiency improvement in the categories of “Catch-up” (individual DMU improvement due to closing the gap to the border production frontier) and “Frontier shift” (collective improvement of the border production frontier, compare, e.g., [13] (p. 74) are different from the total efficiency improvement champions, which are the Universities of Exeter and Karlsruhe (Catch-up, besides RWTH), as well as the University of Konstanz, LSE London, and Humboldt-University of Berlin (Frontier shift).
Table 7.
Arithmetic Mean Malmquist Index Values 2011–2016 per Institution.
In addition, the leading institutions, regarding average improvement from this perspective (Table 7), are different from the institutions leading on yearly improvements (Table 6). This connects to the fact known widely in management science, and especially with accounting and controlling, that achieving short-term improvements is a totally different game than sustaining long-term enhancements, in this case a six-year period [90,91,92]. The success of German institutions in the sample may be connected to the experience that these institutions had to adapt to the international ranking system, regarding the specific data gathering in this arena, within the analyzed timeframe. It also may fall into the same period when, e.g., due to the German excellence initiative, the first results in increasing international visibility and competitiveness were achieved [4,93].
From Table 8, depicting the statistical characteristics of all Malmquist index values by year (2012–2016) on the previous year for run III, some further descriptions can be outlined (highest values in bold numbers). First, high average levels of improvement are shown for the years 2012 and 2016, but not so much for the years in between. As an absolute value, the overall efficiency improvement of 6.59% for the last reported year of 2016 is high, also compared to other industries. For example, Örkcü et al. [94] (p. 101) report an efficiency improvement of 3.28% for Turkish airports on average from 2009 to 2014, Sueyoshi and Goto [95] (p. 342) describe a 1.10% efficiency improvement for 12 national petroleum companies from 2005 to 2009, and Emrouznejad and Yang [96] (p. 853) calculate a 2.89% efficiency improvement for the Chinese metal industry on average from 2004 to 2012. Again, it has to be emphasized that while these are exceptional values, there are also years, such as 2013 and 2014, with only minimal or zero improvement on efficiency regarding the inputs and outputs reported here. Second, variance and standard deviation with an annual sample among the 70 universities show remarkably high values, especially again in the first (2012) and last (2016) analyzed year.
Table 8.
Malmquist Index Annual Average Values, Variances, and Standard Deviations (Run III).
Specific Malmquist index values for each university per year and for all three calculation runs I–III, as well as detailed numbers on the Malmquist catch-up and frontier shift breakdown, are reported in Appendix A (Table A1).
5. Discussion
The described results can be connected to existing research regarding university efficiency and is discussed as follows. The overall range of efficiency scores for 2011, as outlined in Table 4, is quite small between (17 institutions with) 100.00% and a minimum value of 61.60% (University of Copenhagen, run I, mean 87.21%). Such high levels of efficiency are not necessarily usual, but also not unexpected with 70 decision making units and 7, respectively 12, indicators. For example, the results of Fandel [97] (2007, p. 527), detailing 10 out of 15 German universities within North Rhine-Westphalia as efficient, with a mean efficiency of 92.77%, by using two inputs and three outputs for the 15 DMU. Also, Johnes [98] (p. 281) reports a mean efficiency of 92.51% regarding 130 UK universities with six inputs and three outputs, also with the lowest individual university efficiency levels around 60%. See also the comprehensive review of DEA studies in education by Fuentes, Fuster, and Lillo-Banuls [99] (pp. 91–93) regarding the applied inputs and outputs which are highly influential for the calculated efficiency results (in comparison with the number of observed DMU). This baseline is further analyzed regarding time-series changes in the following years until 2016.
Out of 350 dynamic data points (5 years of change from 2011 for 70 universities, run III), altogether 118 institutions with annual negative changes of efficiency are reported, whereas for 232 instances, a positive improvement of efficiency is recognized. This shows that universities are working hard to improve their efficiency as demanded from stakeholders and taxpayers regarding the inflow of public money into the higher education system. However, it also highlights that efficiency improvement is not an easy task but has to be earned with hard work. There is no “automatism” in efficiency improvement as is, for example, sometimes made to be believed due to technological change, as, e.g., for e-learning [100,101]. The results regarding productivity increases (individual and overall) are within range of existing results, for example, by Parteka and Wolszczak-Derlacz [13] (p. 73), who report an average 4.1% annual increase of productivity for 266 public universities in 7 European countries between 2001 and 2005. In their dataset, universities from Germany, Italy, and Switzerland provided the highest efficiency improvements. However, it has to be recognized that in this case, three inputs (staff, students, budget) were compared only to two outputs (publications and graduates). As also in this research, German universities are reported to have above-average efficiency improvements, which seems to be a stable result. Obviously, the reported analysis results and differences regarding the distinction between general technological progress (“frontier shift”) and its use on the one hand and the individual organizational reasons for efficiency changes (“catch-up”) on the other hand for universities are interesting and should be studied further. In addition, in-depth analysis is required in terms of resource and organizational consequences of such efficiency development results for universities as done, e.g., in the health care or service sector [102,103]. For example, it can be questioned if an institution or a department should receive unequivocal research or teaching funding when long-term negative developments of efficiency are recognized. This is superior to the question applied mainly today of, if due to an existing (low) efficiency status compared to others, restrictions in terms of funding shall be implemented. Whereas an efficiency development can largely be attributed to the institutional responsibility (given stable and comparable circumstances), the static efficiency position compared to other institutions may have a multitude of (external) influences and institutional responsibility is not a given.
As a policy implication, this would hint at an adjusted resource distribution scheme where allocation is connected to the longitudinal efficiency development of institutions. For example, institutions with decreasing efficiencies over time would also receive a reduced amount of resources, whereas institutions increasing their efficiency (change, not absolute level, potentially above a threshold level) would receive in increase in funding, e.g., by state budgets or also competitively distributed research funding and other sources.
Requirements for efficiency analysis with the DEA technique and for ranking endeavors have to be recalled into the academic and public discourse. Mainly, it has to be ensured that the analyzed DMU are actually comparable. This notion can be discussed in different perspectives: (i) From a production theory perspective, the border production function has to be identical or at least the same technical production possibilities have to be available to all compared units and institutions [65]; (ii) From an economic price and market perspective, the used factor prices, as, e.g., for academic personnel, have to be identical or at least comparable; whereas wages for academics are not identical, not even within one country, the argument may be stated that even in a global perspective wages for research and teaching assistants as well as professors as core personnel for universities do not feature too much deviation; (iii) From a higher education research perspective, the main notion is the question of comparable objectives, missions, and profiles. This may be tested mainly against the following research hypothesis. The subject mix and homogeneity within and in between institutions has to be taken into account. Either only broad university institutions calling upon the “universitas” principle are included into comparative analyzes, or the analysis is broken down into subject fields, as is done by most rankings today (i.e., THE and CWTS, but also others such as the Shanghai ARWU ranking).
Altogether, it can be argued that the contribution of this paper in finding no proof for an index data problem for the application of ranking data in DEA efficiency analysis endevors for universities has the following implication for the knowledge and future research directions. Ranking data can be used unequivocally for efficiency analysis projects, independent of the fact if the rankings contain indexed data or aggregate data. This alleviates the application of ranking data for higher education efficiency research and therefore provides an important potential for further analysis, as the data realm of international university rankings is growing every year.
It has to be stressed that efficiency questions and the interest in analyzing and improving the performance, excellence, and output (given more or less fixed inputs) of universities in higher education is not new (see, for example, [104]). However, today the available techniques, such as DEA windows analysis and DEA Malmquist index for a dynamic time-series analysis, the available data due to information technology, as well as chances to compare these data and analyses internationally have improved the level of analysis significantly. To put these available instruments to a good use, this article wants to contribute to the methodological discussion regarding efficiency analyses for higher education.
6. Conclusions and Outlook
This paper has made it obvious that no specific index number problem can be found for longitudinal efficiency analysis calculations for universities based on ranking data. This holds true for the indexed ranking publications of Times Higher Education, as this data (for the timeframe 2011–2016) was analyzed herein in comparison with the CWTS (nonindexed) data. Research and policy implications for the presented and analyzed data include, among others, the following points for further discourse. Ranking data, also within an indexed form, are assumed to be feasible and can acts as a quality output indicator basis for efficiency analysis endeavors, also in a longitudinal time-series analysis with such instruments as, for example, the DEA window analysis or the DEA Malmquist index analysis. As described above, the time-series analysis of efficiency development per institution may be an interesting field for academic analysis as well as a decision basis for university managers, politicians, as well as stakeholders and partners of universities. For example, if a company is thinking about a long-term research cooperation with a university, a look into past long-term efficiency developments at this institution may be well advised and informative in order to protect such a strategic investment. Further, it is has been shown that long-term efficiency improvement is a different playing field from yearly improvements. In the long-term perspective, German universities in particular were faring well within the analyzed timeframe of 2011–2016 and the applied dataset of 70 European universities. From the input and output correlation analysis, interesting results are that larger budgets and staff numbers correlate with higher ranking evaluations in the fields of teaching and research, but less so for citations. Institutions with larger input volumes therefore have at least a larger chance to reach higher output levels in these fields. However, this is definitively not true for the evaluation fields of international outlook and industry income as measured by THE rankings. This may be connected to the fact that achieving productive international as well as industry cooperation may not so much depend on the size of the budget and staff numbers but more on a mind-set within the university regarding industry income and especially a form of flexibility. This is hypothetical, as there is no causal analysis at hand, but at least the correlation numbers for the observed 420 cases may provide some interesting basis for creating and further on testing hypotheses regarding such productivity connections in universities.
Efficiency analysis may provide an elaborate form of quality check towards ranking systems, especially in the proposed time-series form, as with constant inputs for the same institutions and timeframe, rankings are supposed to present similar results. If not, the quality of the ranking performance measurement can be doubted. This has to be enlarged with datasets from other rankings in a timeline perspective, and with that, the problem of establishing a “reference set” or “baseline” performance dataset may arise. Which ranking or dataset would other rankings have to be measures “against”? Such avenues of inquiry are connected to the quality debate regarding evaluations and rankings for universities, as, for example, stated by Bornmann [105], Osterloh and Frey [106], and Harmann [107] for an international perspective. For the national German context regarding the VHB JOURQUAL3 journal rankings in economics and business administration, Eisend [108] and Schrader and Hennig-Thurau [109] discuss this as well as Lorenz and Löffler [110] for the Handelsblatt ranking of business economists. Policy implications point towards the discourse regarding conflicts of interest for university management in pursuing efficiency goals compared to other objectives such as excellence, reputation, or cooperation, as Blackmore points out [111].
Further research is warranted to address, for example, the following five areas regarding university efficiency, rankings, and overall sector performance development: (a) Further ranking data for indexed and nonindex values should be tested in order to enlarge the database for the falsification of an index number problem for university ranking data in longitudinal efficiency analysis projects; (b) The further eligibility of such a dynamic efficiency analysis, e.g., with the DEA Malmquist index for a metaevaluation of rankings, could be tested. This can be an important contribution to ranking system quality; (c) Institutional management implications do earn a further look into possible steering and efficiency improvement measures based on longitudinal efficiency results for individual universities. Sideways comparisons with other knowledge-intensive service industries such as health care, finance and insurance, accounting and consulting, or logistics could be promising; (d) In addition, the possible implications and measures on a policy-systems level of higher education are of high interest given the fact that, e.g., for Germany, the public resources spent within university institutions totals about 48.2 billion Euros or 1.3% of total GDP for 2014 [112] (p. 71). Any fact-based research implying possible changes and improvements in the setup for public funding distribution in the sector might be of high value in an economic perspective; (e) Finally, also a look into the organizational level of research groups and individual researchers regarding the long-term dynamic efficiency development may be very interesting. Much research work already does exist for this in static as well as dynamic output perspectives, e.g., [113,114,115], but little yet regarding a longitudinal efficiency perspective taking inputs into account. This could, for example, connect to the long-standing question of if outside and additional resources are able to improve the efficiency of an individual researcher or if there is no or a marginal effect, as, for example, found by Fedderke and Goldschmidt [116] (p. 479).
Altogether, the question of ranking data as an output database for time-series efficiency analysis in higher education has been proven to be a worthwhile and interesting field of inquiry for higher education research and management.
Funding
This research received no external funding.
Conflicts of Interest
The author declares no conflict of interest.
Appendix A
Table A1.
Malmquist Index Values (Catch-up and Frontier Shift) 2012–2016, based on 2011.
Table A1.
Malmquist Index Values (Catch-up and Frontier Shift) 2012–2016, based on 2011.
| RUN I (THE) | RUN II (CWTS) | RUN III (THE & CWTS) | ||||||||
|---|---|---|---|---|---|---|---|---|---|---|
| University | Year * | Malmquist Index | Catch-Up | Frontier Shift | Malmquist Index | Catch-Up | Frontier Shift | Malmquist Index | Catch-Up | Frontier Shift |
| Aarhus University | 2011 | |||||||||
| Aarhus University | 2012 | 1.1500 | 1.1335 | 1.0146 | 1.0367 | 0.9989 | 1.0378 | 1.1500 | 1.1335 | 1.0146 |
| Aarhus University | 2013 | 1.0259 | 1.0577 | 0.9699 | 1.0442 | 1.0844 | 0.9629 | 1.0259 | 1.0577 | 0.9699 |
| Aarhus University | 2014 | 0.9372 | 0.9462 | 0.9905 | 1.0814 | 1.0480 | 1.0318 | 0.9374 | 0.9467 | 0.9902 |
| Aarhus University | 2015 | 0.9786 | 0.9935 | 0.9851 | 1.0764 | 1.0582 | 1.0172 | 0.9804 | 0.9943 | 0.9860 |
| Aarhus University | 2016 | 1.1883 | 1.1423 | 1.0403 | 1.0696 | 1.0425 | 1.0260 | 1.1870 | 1.1408 | 1.0405 |
| Bielefeld University | 2011 | |||||||||
| Bielefeld University | 2012 | 0.8061 | 0.8252 | 0.9768 | 1.0055 | 0.9916 | 1.0140 | 0.8061 | 0.8252 | 0.9768 |
| Bielefeld University | 2013 | 1.0855 | 1.1112 | 0.9768 | 1.0482 | 1.1397 | 0.9198 | 1.0855 | 1.1112 | 0.9768 |
| Bielefeld University | 2014 | 0.9529 | 0.9926 | 0.9600 | 1.0547 | 1.0250 | 1.0290 | 0.9529 | 0.9926 | 0.9600 |
| Bielefeld University | 2015 | 0.9247 | 0.9202 | 1.0050 | 1.0250 | 1.0408 | 0.9849 | 0.9247 | 0.9202 | 1.0050 |
| Bielefeld University | 2016 | 1.3023 | 1.0984 | 1.1856 | 1.0516 | 1.0312 | 1.0198 | 1.3006 | 1.0984 | 1.1841 |
| Delft University of Technology | 2011 | |||||||||
| Delft University of Technology | 2012 | 1.0024 | 1.0000 | 1.0024 | 0.9936 | 0.9282 | 1.0705 | 1.0027 | 1.0000 | 1.0027 |
| Delft University of Technology | 2013 | 1.0361 | 1.0000 | 1.0361 | 1.0266 | 1.0471 | 0.9804 | 1.0352 | 1.0000 | 1.0352 |
| Delft University of Technology | 2014 | 0.9631 | 1.0000 | 0.9631 | 1.0484 | 1.0238 | 1.0240 | 0.9647 | 1.0000 | 0.9647 |
| Delft University of Technology | 2015 | 1.0110 | 1.0000 | 1.0110 | 1.0945 | 1.0744 | 1.0187 | 1.0133 | 1.0000 | 1.0133 |
| Delft University of Technology | 2016 | 1.0328 | 1.0000 | 1.0328 | 1.1385 | 1.1006 | 1.0345 | 1.0328 | 1.0000 | 1.0328 |
| Durham University | 2011 | |||||||||
| Durham University | 2012 | 1.0284 | 1.0082 | 1.0200 | 0.9602 | 0.9268 | 1.0361 | 1.0278 | 1.0071 | 1.0206 |
| Durham University | 2013 | 0.9888 | 1.0000 | 0.9888 | 0.9487 | 0.9764 | 0.9716 | 0.9846 | 1.0000 | 0.9846 |
| Durham University | 2014 | 0.9453 | 1.0000 | 0.9453 | 1.0045 | 0.9266 | 1.0841 | 0.9465 | 1.0000 | 0.9465 |
| Durham University | 2015 | 1.0133 | 0.9781 | 1.0360 | 1.1159 | 1.1384 | 0.9802 | 1.0146 | 0.9801 | 1.0352 |
| Durham University | 2016 | 1.0161 | 0.9514 | 1.0680 | 0.9590 | 0.9632 | 0.9957 | 1.0229 | 0.9817 | 1.0419 |
| Eindhoven University of Tec. | 2011 | |||||||||
| Eindhoven University of Tec. | 2012 | 1.0376 | 1.0000 | 1.0376 | 1.0599 | 1.0206 | 1.0385 | 1.0376 | 1.0000 | 1.0376 |
| Eindhoven University of Tec. | 2013 | 1.0213 | 1.0000 | 1.0213 | 1.0501 | 1.0968 | 0.9575 | 1.0213 | 1.0000 | 1.0213 |
| Eindhoven University of Tec. | 2014 | 0.9704 | 1.0000 | 0.9704 | 1.0545 | 1.0257 | 1.0281 | 0.9751 | 1.0000 | 0.9751 |
| Eindhoven University of Tec. | 2015 | 0.9776 | 1.0000 | 0.9776 | 1.0136 | 1.0237 | 0.9901 | 0.9776 | 1.0000 | 0.9776 |
| Eindhoven University of Tec. | 2016 | 0.8549 | 0.8495 | 1.0063 | 1.1259 | 1.1159 | 1.0090 | 0.8670 | 0.8633 | 1.0042 |
| Erasmus Univ. Rotterdam | 2011 | |||||||||
| Erasmus Univ. Rotterdam | 2012 | 1.0539 | 1.0159 | 1.0373 | 1.0838 | 1.0000 | 1.0838 | 1.0171 | 1.0000 | 1.0171 |
| Erasmus Univ. Rotterdam | 2013 | 1.1899 | 1.1013 | 1.0805 | 0.9814 | 1.0000 | 0.9814 | 1.1164 | 1.0000 | 1.1164 |
| Erasmus Univ. Rotterdam | 2014 | 0.9577 | 1.0000 | 0.9577 | 1.0566 | 1.0000 | 1.0566 | 0.9752 | 1.0000 | 0.9752 |
| Erasmus Univ. Rotterdam | 2015 | 0.9998 | 1.0000 | 0.9998 | 0.9726 | 1.0000 | 0.9726 | 0.9744 | 1.0000 | 0.9744 |
| Erasmus Univ. Rotterdam | 2016 | 1.1147 | 1.0000 | 1.1147 | 0.9864 | 1.0000 | 0.9864 | 1.0427 | 1.0000 | 1.0427 |
| ETH Lausanne | 2011 | |||||||||
| ETH Lausanne | 2012 | 1.0331 | 1.0000 | 1.0331 | 1.0786 | 1.0144 | 1.0633 | 1.0327 | 1.0000 | 1.0327 |
| ETH Lausanne | 2013 | 1.0006 | 1.0000 | 1.0006 | 1.0041 | 1.0591 | 0.9481 | 0.9995 | 1.0000 | 0.9995 |
| ETH Lausanne | 2014 | 0.9859 | 1.0000 | 0.9859 | 1.0679 | 1.0364 | 1.0304 | 0.9907 | 1.0000 | 0.9907 |
| ETH Lausanne | 2015 | 1.0108 | 1.0000 | 1.0108 | 1.2424 | 1.2268 | 1.0127 | 1.0154 | 1.0000 | 1.0154 |
| ETH Lausanne | 2016 | 1.0169 | 1.0000 | 1.0169 | 1.1238 | 1.0628 | 1.0574 | 1.0186 | 1.0000 | 1.0186 |
| Ghent University | 2011 | |||||||||
| Ghent University | 2012 | 1.0083 | 1.0002 | 1.0081 | 1.0455 | 1.0131 | 1.0320 | 1.0146 | 1.0069 | 1.0077 |
| Ghent University | 2013 | 0.9927 | 0.9877 | 1.0050 | 1.0153 | 1.0394 | 0.9768 | 0.9860 | 1.0017 | 0.9843 |
| Ghent University | 2014 | 0.9923 | 0.9930 | 0.9993 | 1.0488 | 1.0245 | 1.0237 | 1.0128 | 1.0000 | 1.0128 |
| Ghent University | 2015 | 0.9504 | 0.9432 | 1.0076 | 1.0076 | 0.9968 | 1.0109 | 0.9545 | 0.9442 | 1.0110 |
| Ghent University | 2016 | 1.0279 | 0.9757 | 1.0536 | 0.9998 | 0.9809 | 1.0193 | 1.0240 | 0.9894 | 1.0349 |
| Goethe University Frankfurt | 2011 | |||||||||
| Goethe University Frankfurt | 2012 | 1.0781 | 1.0447 | 1.0320 | 1.0368 | 1.0186 | 1.0179 | 1.0781 | 1.0447 | 1.0320 |
| Goethe University Frankfurt | 2013 | 0.9831 | 1.0010 | 0.9821 | 1.0279 | 1.0086 | 1.0191 | 0.9831 | 1.0010 | 0.9821 |
| Goethe University Frankfurt | 2014 | 1.0863 | 1.0819 | 1.0040 | 1.0374 | 1.0077 | 1.0295 | 1.0869 | 1.0842 | 1.0025 |
| Goethe University Frankfurt | 2015 | 0.9759 | 0.9850 | 0.9907 | 1.0117 | 1.0095 | 1.0022 | 0.9760 | 0.9832 | 0.9927 |
| Goethe University Frankfurt | 2016 | 1.0063 | 0.9841 | 1.0226 | 1.0129 | 0.9889 | 1.0243 | 1.0064 | 0.9838 | 1.0229 |
| Heidelberg University | 2011 | |||||||||
| Heidelberg University | 2012 | 1.1011 | 1.0530 | 1.0456 | 1.0282 | 1.0138 | 1.0142 | 1.1011 | 1.0530 | 1.0456 |
| Heidelberg University | 2013 | 0.9621 | 0.9816 | 0.9801 | 1.0452 | 1.0109 | 1.0340 | 0.9621 | 0.9816 | 0.9801 |
| Heidelberg University | 2014 | 1.0065 | 1.0064 | 1.0000 | 1.0455 | 1.0067 | 1.0386 | 1.0065 | 1.0064 | 1.0000 |
| Heidelberg University | 2015 | 1.0704 | 1.0761 | 0.9948 | 1.0314 | 1.0121 | 1.0191 | 1.0707 | 1.0761 | 0.9950 |
| Heidelberg University | 2016 | 1.0959 | 1.0621 | 1.0318 | 1.0338 | 1.0048 | 1.0289 | 1.0959 | 1.0621 | 1.0318 |
| Humboldt University of Berlin | 2011 | |||||||||
| Humboldt University of Berlin | 2012 | 1.0599 | 1.0543 | 1.0053 | 1.0357 | 1.0000 | 1.0357 | 1.0917 | 1.0000 | 1.0917 |
| Humboldt University of Berlin | 2013 | 0.9692 | 1.0000 | 0.9692 | 0.8913 | 1.0000 | 0.8913 | 0.9215 | 1.0000 | 0.9215 |
| Humboldt University of Berlin | 2014 | 0.8934 | 1.0000 | 0.8934 | 1.0125 | 1.0000 | 1.0125 | 0.9527 | 1.0000 | 0.9527 |
| Humboldt University of Berlin | 2015 | 1.0525 | 1.0000 | 1.0525 | 0.9987 | 1.0000 | 0.9987 | 1.0130 | 1.0000 | 1.0130 |
| Humboldt University of Berlin | 2016 | 1.2664 | 1.0000 | 1.2664 | 1.0083 | 1.0000 | 1.0083 | 1.2122 | 1.0000 | 1.2122 |
| Imperial College London | 2011 | |||||||||
| Imperial College London | 2012 | 0.9955 | 1.0000 | 0.9955 | 1.0644 | 1.0000 | 1.0644 | 1.0220 | 1.0000 | 1.0220 |
| Imperial College London | 2013 | 0.9743 | 1.0000 | 0.9743 | 0.9991 | 1.0000 | 0.9991 | 0.9914 | 1.0000 | 0.9914 |
| Imperial College London | 2014 | 0.9492 | 1.0000 | 0.9492 | 0.9794 | 1.0000 | 0.9794 | 0.9636 | 1.0000 | 0.9636 |
| Imperial College London | 2015 | 0.9927 | 1.0000 | 0.9927 | 1.0026 | 1.0000 | 1.0026 | 0.9961 | 1.0000 | 0.9961 |
| Imperial College London | 2016 | 0.9892 | 1.0000 | 0.9892 | 1.0244 | 1.0000 | 1.0244 | 0.9918 | 1.0000 | 0.9918 |
| Karlsruhe Institute of Tec. | 2011 | |||||||||
| Karlsruhe Institute of Tec. | 2012 | 0.9963 | 0.9847 | 1.0118 | 1.0589 | 1.0187 | 1.0394 | 1.0091 | 0.9924 | 1.0168 |
| Karlsruhe Institute of Tec. | 2013 | 1.1554 | 1.1597 | 0.9963 | 0.9848 | 1.0329 | 0.9534 | 1.1325 | 1.1455 | 0.9886 |
| Karlsruhe Institute of Tec. | 2014 | 0.9790 | 1.0012 | 0.9778 | 1.1020 | 1.0811 | 1.0192 | 0.9790 | 1.0012 | 0.9778 |
| Karlsruhe Institute of Tec. | 2015 | 1.0006 | 0.9992 | 1.0014 | 1.1541 | 1.1434 | 1.0093 | 1.0077 | 1.0024 | 1.0053 |
| Karlsruhe Institute of Tec. | 2016 | 1.1948 | 1.1865 | 1.0070 | 1.0734 | 1.0572 | 1.0153 | 1.1875 | 1.1827 | 1.0041 |
| Karolinska Institute | 2011 | |||||||||
| Karolinska Institute | 2012 | 1.0719 | 1.0000 | 1.0719 | 1.0239 | 1.0000 | 1.0239 | 1.1080 | 1.0000 | 1.1080 |
| Karolinska Institute | 2013 | 1.0015 | 0.9942 | 1.0073 | 0.9719 | 0.9599 | 1.0125 | 0.9600 | 1.0000 | 0.9600 |
| Karolinska Institute | 2014 | 0.9369 | 0.9904 | 0.9459 | 1.0233 | 0.9811 | 1.0430 | 0.9617 | 1.0000 | 0.9617 |
| Karolinska Institute | 2015 | 0.9972 | 0.9965 | 1.0007 | 1.0306 | 1.0303 | 1.0004 | 0.9956 | 1.0000 | 0.9956 |
| Karolinska Institute | 2016 | 1.1510 | 1.0191 | 1.1295 | 1.0088 | 1.0219 | 0.9872 | 1.0926 | 1.0000 | 1.0926 |
| King’s College London | 2011 | |||||||||
| King’s College London | 2012 | 1.0562 | 1.0441 | 1.0115 | 1.0355 | 0.9695 | 1.0681 | 1.0590 | 1.0403 | 1.0179 |
| King’s College London | 2013 | 0.9630 | 0.9626 | 1.0005 | 0.9886 | 0.9970 | 0.9916 | 0.9366 | 0.9621 | 0.9736 |
| King’s College London | 2014 | 1.0336 | 1.0567 | 0.9782 | 1.0588 | 1.0759 | 0.9841 | 1.0314 | 1.0363 | 0.9952 |
| King’s College London | 2015 | 1.0220 | 1.0133 | 1.0086 | 1.0693 | 1.0526 | 1.0159 | 1.0171 | 1.0052 | 1.0119 |
| King’s College London | 2016 | 1.0816 | 1.0241 | 1.0562 | 1.1455 | 1.0856 | 1.0551 | 1.0809 | 1.0232 | 1.0565 |
| KTH Royal Institute of Tec. | 2011 | |||||||||
| KTH Royal Institute of Tec. | 2012 | 1.0212 | 1.0000 | 1.0212 | 0.9900 | 0.9477 | 1.0446 | 1.0212 | 1.0000 | 1.0212 |
| KTH Royal Institute of Tec. | 2013 | 1.0091 | 1.0000 | 1.0091 | 0.9753 | 0.9630 | 1.0128 | 1.0091 | 1.0000 | 1.0091 |
| KTH Royal Institute of Tec. | 2014 | 0.9793 | 1.0000 | 0.9793 | 1.0622 | 1.0262 | 1.0350 | 0.9793 | 1.0000 | 0.9793 |
| KTH Royal Institute of Tec. | 2015 | 0.9919 | 1.0000 | 0.9919 | 1.0434 | 1.0327 | 1.0103 | 0.9924 | 1.0000 | 0.9924 |
| KTH Royal Institute of Tec. | 2016 | 0.9396 | 1.0000 | 0.9396 | 1.0689 | 1.0667 | 1.0020 | 0.9525 | 1.0000 | 0.9525 |
| KU Leuven | 2011 | |||||||||
| KU Leuven | 2012 | 1.0214 | 1.0131 | 1.0082 | 1.0024 | 0.9679 | 1.0357 | 1.0194 | 1.0000 | 1.0194 |
| KU Leuven | 2013 | 1.0064 | 1.0000 | 1.0064 | 0.9823 | 1.0154 | 0.9674 | 0.9986 | 1.0000 | 0.9986 |
| KU Leuven | 2014 | 0.9942 | 1.0000 | 0.9942 | 1.0189 | 0.9896 | 1.0296 | 0.9999 | 1.0000 | 0.9999 |
| KU Leuven | 2015 | 1.0038 | 1.0000 | 1.0038 | 0.9959 | 0.9805 | 1.0157 | 0.9991 | 1.0000 | 0.9991 |
| KU Leuven | 2016 | 1.0496 | 1.0000 | 1.0496 | 0.9944 | 0.9704 | 1.0247 | 1.0485 | 1.0000 | 1.0485 |
| Lancaster University | 2011 | |||||||||
| Lancaster University | 2012 | 0.9467 | 0.9836 | 0.9624 | 1.0133 | 0.9802 | 1.0339 | 0.9358 | 0.9612 | 0.9736 |
| Lancaster University | 2013 | 0.9607 | 1.0133 | 0.9481 | 0.8593 | 1.0328 | 0.8320 | 0.9597 | 1.0113 | 0.9490 |
| Lancaster University | 2014 | 1.0022 | 1.0402 | 0.9635 | 1.0445 | 1.0260 | 1.0180 | 0.9958 | 1.0401 | 0.9574 |
| Lancaster University | 2015 | 0.9867 | 0.9902 | 0.9964 | 0.7532 | 0.8437 | 0.8927 | 0.9867 | 0.9902 | 0.9964 |
| Lancaster University | 2016 | 1.0644 | 1.0506 | 1.0131 | 1.0442 | 1.0305 | 1.0133 | 1.0648 | 1.0513 | 1.0128 |
| Leiden University | 2011 | |||||||||
| Leiden University | 2012 | 0.8690 | 0.8779 | 0.9898 | 1.1860 | 1.1101 | 1.0684 | 0.9546 | 0.9635 | 0.9907 |
| Leiden University | 2013 | 1.1281 | 1.0755 | 1.0490 | 1.0293 | 1.0317 | 0.9977 | 1.0762 | 1.0369 | 1.0379 |
| Leiden University | 2014 | 0.9939 | 1.0405 | 0.9551 | 1.0382 | 1.0187 | 1.0192 | 0.9991 | 1.0009 | 0.9981 |
| Leiden University | 2015 | 0.9858 | 0.9736 | 1.0125 | 0.9484 | 0.9562 | 0.9918 | 0.9845 | 0.9954 | 0.9890 |
| Leiden University | 2016 | 1.0431 | 0.9436 | 1.1054 | 0.9703 | 0.9796 | 0.9904 | 1.0252 | 0.9489 | 1.0805 |
| LMU Munich | 2011 | |||||||||
| LMU Munich | 2012 | 1.1073 | 1.0757 | 1.0294 | 1.0341 | 1.0228 | 1.0111 | 1.1073 | 1.0757 | 1.0294 |
| LMU Munich | 2013 | 1.0102 | 1.0306 | 0.9802 | 1.0184 | 0.9841 | 1.0348 | 1.0102 | 1.0306 | 0.9802 |
| LMU Munich | 2014 | 0.9740 | 0.9759 | 0.9981 | 1.0210 | 0.9746 | 1.0475 | 0.9742 | 0.9763 | 0.9979 |
| LMU Munich | 2015 | 1.1686 | 1.1505 | 1.0157 | 1.0025 | 0.9567 | 1.0479 | 1.1683 | 1.1501 | 1.0158 |
| LMU Munich | 2016 | 1.0230 | 1.0000 | 1.0230 | 1.0134 | 0.9834 | 1.0305 | 1.0230 | 1.0000 | 1.0230 |
| LSE London | 2011 | |||||||||
| LSE London | 2012 | 1.1377 | 1.0000 | 1.1377 | 1.0873 | 1.0371 | 1.0485 | 1.1377 | 1.0000 | 1.1377 |
| LSE London | 2013 | 0.9903 | 1.0000 | 0.9903 | 1.0185 | 1.2124 | 0.8401 | 0.9903 | 1.0000 | 0.9903 |
| LSE London | 2014 | 0.9642 | 1.0000 | 0.9642 | 0.9132 | 0.8884 | 1.0278 | 0.9555 | 1.0000 | 0.9555 |
| LSE London | 2015 | 1.0283 | 1.0000 | 1.0283 | 0.9619 | 1.8963 | 0.5072 | 1.0283 | 1.0000 | 1.0283 |
| LSE London | 2016 | 1.1503 | 1.0000 | 1.1503 | 1.1364 | 1.0000 | 1.1364 | 1.1503 | 1.0000 | 1.1503 |
| Lund University | 2011 | |||||||||
| Lund University | 2012 | 1.0333 | 1.0335 | 0.9999 | 0.9876 | 0.9657 | 1.0228 | 1.0194 | 0.9722 | 1.0486 |
| Lund University | 2013 | 1.0478 | 1.0463 | 1.0014 | 0.9684 | 0.9503 | 1.0191 | 1.0216 | 1.0230 | 0.9986 |
| Lund University | 2014 | 0.9217 | 0.9556 | 0.9645 | 1.0108 | 0.9790 | 1.0325 | 0.9467 | 0.9643 | 0.9817 |
| Lund University | 2015 | 1.0297 | 1.0154 | 1.0141 | 1.0190 | 1.0069 | 1.0120 | 1.0318 | 1.0312 | 1.0006 |
| Lund University | 2016 | 1.1367 | 1.0901 | 1.0428 | 1.0357 | 1.0190 | 1.0165 | 1.1320 | 1.0662 | 1.0617 |
| Newcastle University | 2011 | |||||||||
| Newcastle University | 2012 | 0.9924 | 0.9494 | 1.0453 | 0.9831 | 0.9946 | 0.9884 | 0.9954 | 0.9946 | 1.0008 |
| Newcastle University | 2013 | 1.0037 | 1.0305 | 0.9740 | 0.9507 | 1.0054 | 0.9456 | 0.9550 | 1.0054 | 0.9498 |
| Newcastle University | 2014 | 0.9732 | 0.9761 | 0.9970 | 1.0983 | 1.0000 | 1.0983 | 1.0577 | 1.0000 | 1.0577 |
| Newcastle University | 2015 | 0.9953 | 0.9660 | 1.0304 | 0.9812 | 1.0000 | 0.9812 | 0.9648 | 1.0000 | 0.9648 |
| Newcastle University | 2016 | 1.1384 | 1.1351 | 1.0029 | 1.0045 | 1.0000 | 1.0045 | 1.0393 | 1.0000 | 1.0393 |
| Queen Mary Univ. of London | 2011 | |||||||||
| Queen Mary Univ. of London | 2012 | 1.0081 | 0.9810 | 1.0276 | 1.1627 | 1.1185 | 1.0395 | 1.0081 | 0.9810 | 1.0276 |
| Queen Mary Univ. of London | 2013 | 0.9961 | 1.0329 | 0.9644 | 1.0241 | 1.0623 | 0.9640 | 0.9961 | 1.0329 | 0.9644 |
| Queen Mary Univ. of London | 2014 | 1.0088 | 1.0022 | 1.0065 | 1.1593 | 1.1178 | 1.0371 | 1.0088 | 1.0022 | 1.0065 |
| Queen Mary Univ. of London | 2015 | 1.0099 | 0.9869 | 1.0233 | 1.0394 | 1.0479 | 0.9919 | 1.0099 | 0.9869 | 1.0233 |
| Queen Mary Univ. of London | 2016 | 1.0516 | 1.0016 | 1.0499 | 1.0517 | 1.0382 | 1.0130 | 1.0529 | 1.0074 | 1.0452 |
| RWTH Aachen University | 2011 | |||||||||
| RWTH Aachen University | 2012 | 1.0727 | 1.0382 | 1.0331 | 1.0296 | 1.0006 | 1.0289 | 1.0727 | 1.0382 | 1.0331 |
| RWTH Aachen University | 2013 | 1.0700 | 1.0799 | 0.9908 | 1.0685 | 1.0318 | 1.0356 | 1.0700 | 1.0799 | 0.9908 |
| RWTH Aachen University | 2014 | 1.0611 | 1.0446 | 1.0158 | 1.0785 | 1.0348 | 1.0421 | 1.0611 | 1.0446 | 1.0158 |
| RWTH Aachen University | 2015 | 0.9718 | 1.0276 | 0.9457 | 1.0561 | 1.0221 | 1.0333 | 0.9718 | 1.0276 | 0.9457 |
| RWTH Aachen University | 2016 | 1.1986 | 1.1760 | 1.0192 | 1.0441 | 1.0129 | 1.0308 | 1.1986 | 1.1760 | 1.0192 |
| Stockholm University | 2011 | |||||||||
| Stockholm University | 2012 | 1.1557 | 1.1324 | 1.0206 | 1.0440 | 1.0191 | 1.0244 | 1.1557 | 1.1324 | 1.0206 |
| Stockholm University | 2013 | 1.0315 | 1.0604 | 0.9727 | 1.1025 | 1.1015 | 1.0009 | 1.0315 | 1.0604 | 0.9727 |
| Stockholm University | 2014 | 0.9535 | 0.9832 | 0.9697 | 1.0529 | 1.0250 | 1.0272 | 0.9535 | 0.9832 | 0.9697 |
| Stockholm University | 2015 | 1.0287 | 1.0007 | 1.0281 | 1.0282 | 1.0130 | 1.0150 | 1.0287 | 1.0007 | 1.0281 |
| Stockholm University | 2016 | 0.9288 | 0.8881 | 1.0458 | 1.0500 | 1.0399 | 1.0097 | 0.9288 | 0.8881 | 1.0458 |
| Swedish U. of Agri. Sciences | 2011 | |||||||||
| Swedish U. of Agri. Sciences | 2012 | 0.9937 | 1.0000 | 0.9937 | 1.0239 | 0.9898 | 1.0344 | 0.9937 | 1.0000 | 0.9937 |
| Swedish U. of Agri. Sciences | 2013 | 0.9957 | 1.0000 | 0.9957 | 0.9956 | 1.0063 | 0.9894 | 0.9957 | 1.0000 | 0.9957 |
| Swedish U. of Agri. Sciences | 2014 | 1.0093 | 1.0000 | 1.0093 | 1.0768 | 1.0398 | 1.0356 | 1.0043 | 1.0000 | 1.0043 |
| Swedish U. of Agri. Sciences | 2015 | 1.0318 | 1.0000 | 1.0318 | 1.1221 | 1.1271 | 0.9956 | 1.0413 | 1.0000 | 1.0413 |
| Swedish U. of Agri. Sciences | 2016 | 1.0248 | 1.0000 | 1.0248 | 1.0599 | 1.0478 | 1.0116 | 1.0248 | 1.0000 | 1.0248 |
| Tec. University of Denmark | 2011 | |||||||||
| Tec. University of Denmark | 2012 | 1.0056 | 0.9805 | 1.0256 | 1.0546 | 1.0182 | 1.0357 | 1.0056 | 0.9805 | 1.0256 |
| Tec. University of Denmark | 2013 | 1.0470 | 1.0371 | 1.0095 | 1.0816 | 1.0985 | 0.9846 | 1.0468 | 1.0371 | 1.0093 |
| Tec. University of Denmark | 2014 | 1.0061 | 0.9969 | 1.0092 | 1.0175 | 1.0512 | 0.9680 | 1.0063 | 0.9981 | 1.0083 |
| Tec. University of Denmark | 2015 | 1.0017 | 0.9986 | 1.0031 | 0.9632 | 0.9424 | 1.0221 | 1.0024 | 0.9984 | 1.0039 |
| Tec. University of Denmark | 2016 | 0.8786 | 0.8736 | 1.0057 | 1.0629 | 1.0411 | 1.0209 | 0.8918 | 0.8820 | 1.0112 |
| Tec. University of Munich | 2011 | |||||||||
| Tec. University of Munich | 2012 | 0.9105 | 0.8875 | 1.0259 | 1.0539 | 1.0235 | 1.0297 | 0.9077 | 0.8871 | 1.0233 |
| Tec. University of Munich | 2013 | 1.0031 | 1.0267 | 0.9770 | 1.0626 | 1.0254 | 1.0362 | 1.0031 | 1.0267 | 0.9770 |
| Tec. University of Munich | 2014 | 1.0547 | 1.0530 | 1.0016 | 1.0604 | 1.0132 | 1.0466 | 1.0547 | 1.0531 | 1.0015 |
| Tec. University of Munich | 2015 | 0.9763 | 0.9798 | 0.9964 | 1.0580 | 1.0147 | 1.0427 | 0.9763 | 0.9797 | 0.9966 |
| Tec. University of Munich | 2016 | 1.2287 | 1.2016 | 1.0225 | 1.0331 | 1.0024 | 1.0306 | 1.2287 | 1.2016 | 1.0225 |
| Trinity College Dublin | 2011 | |||||||||
| Trinity College Dublin | 2012 | 1.0144 | 1.0000 | 1.0144 | 1.0857 | 0.9985 | 1.0873 | 1.0174 | 1.0000 | 1.0174 |
| Trinity College Dublin | 2013 | 0.9802 | 1.0000 | 0.9802 | 1.0942 | 1.1177 | 0.9790 | 0.9866 | 1.0000 | 0.9866 |
| Trinity College Dublin | 2014 | 0.9721 | 1.0000 | 0.9721 | 1.0564 | 1.0339 | 1.0217 | 0.9747 | 1.0000 | 0.9747 |
| Trinity College Dublin | 2015 | 0.9675 | 0.9427 | 1.0262 | 1.1399 | 1.1160 | 1.0214 | 0.9869 | 0.9841 | 1.0028 |
| Trinity College Dublin | 2016 | 1.0000 | 0.9603 | 1.0413 | 1.0274 | 1.0076 | 1.0197 | 1.0080 | 0.9798 | 1.0289 |
| University College Dublin | 2011 | |||||||||
| University College Dublin | 2012 | 0.9440 | 0.9155 | 1.0311 | 1.1026 | 1.0659 | 1.0345 | 0.9564 | 0.9236 | 1.0355 |
| University College Dublin | 2013 | 0.9258 | 0.9643 | 0.9601 | 1.0606 | 1.0803 | 0.9818 | 0.9411 | 0.9809 | 0.9594 |
| University College Dublin | 2014 | 1.0322 | 1.0268 | 1.0053 | 1.0412 | 1.0013 | 1.0399 | 1.0339 | 1.0196 | 1.0140 |
| University College Dublin | 2015 | 0.9762 | 0.9578 | 1.0192 | 1.0953 | 1.1020 | 0.9939 | 0.9984 | 0.9914 | 1.0070 |
| University College Dublin | 2016 | 1.0871 | 1.0559 | 1.0296 | 0.9853 | 0.9734 | 1.0122 | 1.0679 | 1.0367 | 1.0301 |
| University College London | 2011 | |||||||||
| University College London | 2012 | 1.0244 | 1.0041 | 1.0202 | 1.0483 | 1.0000 | 1.0483 | 1.0468 | 1.0000 | 1.0468 |
| University College London | 2013 | 0.9823 | 0.9928 | 0.9894 | 0.9847 | 1.0000 | 0.9847 | 0.9847 | 1.0000 | 0.9847 |
| University College London | 2014 | 0.9909 | 0.9936 | 0.9973 | 1.0373 | 1.0000 | 1.0373 | 1.0224 | 1.0000 | 1.0224 |
| University College London | 2015 | 1.0088 | 0.9985 | 1.0103 | 1.0207 | 1.0000 | 1.0207 | 1.0207 | 1.0000 | 1.0207 |
| University College London | 2016 | 1.0538 | 1.0228 | 1.0304 | 1.0519 | 1.0000 | 1.0519 | 1.0484 | 1.0000 | 1.0484 |
| University of Aberdeen | 2011 | |||||||||
| University of Aberdeen | 2012 | 0.9930 | 0.9693 | 1.0244 | 1.0297 | 0.9813 | 1.0493 | 0.9958 | 0.9735 | 1.0229 |
| University of Aberdeen | 2013 | 0.9973 | 1.0276 | 0.9705 | 0.9195 | 0.9815 | 0.9369 | 0.9729 | 1.0089 | 0.9643 |
| University of Aberdeen | 2014 | 0.9857 | 0.9635 | 1.0231 | 0.9715 | 0.9169 | 1.0596 | 0.9950 | 0.9738 | 1.0218 |
| University of Aberdeen | 2015 | 1.0011 | 0.9853 | 1.0161 | 0.9508 | 0.9349 | 1.0171 | 1.0021 | 0.9840 | 1.0184 |
| University of Aberdeen | 2016 | 1.0827 | 1.0826 | 1.0000 | 0.9691 | 0.9517 | 1.0183 | 1.0670 | 1.0625 | 1.0042 |
| University of Amsterdam | 2011 | |||||||||
| University of Amsterdam | 2012 | 1.1270 | 1.1432 | 0.9858 | 1.0435 | 1.0067 | 1.0365 | 1.0459 | 1.0075 | 1.0381 |
| University of Amsterdam | 2013 | 1.1002 | 1.1002 | 1.0000 | 1.0404 | 1.0262 | 1.0138 | 1.0508 | 1.0430 | 1.0075 |
| University of Amsterdam | 2014 | 0.9673 | 1.0150 | 0.9529 | 1.0595 | 1.0302 | 1.0284 | 1.0353 | 1.0129 | 1.0222 |
| University of Amsterdam | 2015 | 1.0404 | 1.0257 | 1.0143 | 1.0616 | 1.0477 | 1.0133 | 1.0620 | 1.0506 | 1.0108 |
| University of Amsterdam | 2016 | 1.1430 | 1.0616 | 1.0766 | 1.0299 | 1.0156 | 1.0141 | 1.0501 | 1.0147 | 1.0350 |
| University of Basel | 2011 | |||||||||
| University of Basel | 2012 | 1.0341 | 1.0060 | 1.0280 | 0.9524 | 0.9215 | 1.0335 | 1.0312 | 1.0038 | 1.0273 |
| University of Basel | 2013 | 0.9924 | 1.0101 | 0.9825 | 1.0373 | 1.0216 | 1.0154 | 0.9922 | 1.0101 | 0.9822 |
| University of Basel | 2014 | 1.0281 | 1.0000 | 1.0281 | 1.1148 | 1.0739 | 1.0381 | 1.0281 | 1.0000 | 1.0281 |
| University of Basel | 2015 | 0.9964 | 1.0000 | 0.9964 | 1.0935 | 1.0893 | 1.0038 | 0.9990 | 1.0000 | 0.9990 |
| University of Basel | 2016 | 1.0416 | 1.0000 | 1.0416 | 1.0873 | 1.0914 | 0.9962 | 1.0414 | 1.0000 | 1.0414 |
| University of Bergen | 2011 | |||||||||
| University of Bergen | 2012 | 1.0059 | 0.9715 | 1.0354 | 1.0456 | 1.0268 | 1.0183 | 1.0059 | 0.9715 | 1.0354 |
| University of Bergen | 2013 | 0.9707 | 0.9917 | 0.9788 | 1.0396 | 1.0374 | 1.0021 | 0.9703 | 0.9945 | 0.9756 |
| University of Bergen | 2014 | 0.9428 | 0.9464 | 0.9961 | 1.0453 | 1.0168 | 1.0280 | 0.9413 | 0.9471 | 0.9939 |
| University of Bergen | 2015 | 1.0226 | 0.9894 | 1.0336 | 1.0359 | 1.0207 | 1.0149 | 1.0260 | 0.9945 | 1.0318 |
| University of Bergen | 2016 | 1.1952 | 1.1739 | 1.0182 | 1.0330 | 1.0248 | 1.0080 | 1.1901 | 1.1637 | 1.0226 |
| University of Birmingham | 2011 | |||||||||
| University of Birmingham | 2012 | 0.9456 | 0.9513 | 0.9940 | 0.9804 | 0.9530 | 1.0288 | 0.9616 | 0.9492 | 1.0131 |
| University of Birmingham | 2013 | 0.9947 | 1.0229 | 0.9724 | 0.9759 | 0.9739 | 1.0021 | 0.9628 | 1.0081 | 0.9551 |
| University of Birmingham | 2014 | 1.0266 | 1.0486 | 0.9789 | 0.9928 | 0.9675 | 1.0261 | 1.0274 | 1.0123 | 1.0149 |
| University of Birmingham | 2015 | 1.0440 | 1.0279 | 1.0157 | 1.0276 | 1.0071 | 1.0203 | 1.0495 | 1.0352 | 1.0139 |
| University of Birmingham | 2016 | 1.1072 | 1.0871 | 1.0185 | 1.0322 | 1.0183 | 1.0136 | 1.0956 | 1.0639 | 1.0298 |
| University of Bonn | 2011 | |||||||||
| University of Bonn | 2012 | 1.1156 | 1.0775 | 1.0353 | 1.0051 | 0.9855 | 1.0198 | 1.1156 | 1.0775 | 1.0353 |
| University of Bonn | 2013 | 1.1055 | 1.1274 | 0.9806 | 1.0772 | 1.0600 | 1.0162 | 1.1055 | 1.1274 | 0.9806 |
| University of Bonn | 2014 | 1.0037 | 0.9970 | 1.0067 | 1.0411 | 1.0118 | 1.0290 | 1.0038 | 0.9972 | 1.0066 |
| University of Bonn | 2015 | 1.0381 | 1.0474 | 0.9912 | 0.9747 | 0.9751 | 0.9996 | 1.0381 | 1.0472 | 0.9913 |
| University of Bonn | 2016 | 1.0179 | 0.9936 | 1.0244 | 1.0254 | 0.9996 | 1.0259 | 1.0179 | 0.9936 | 1.0244 |
| University of Bristol | 2011 | |||||||||
| University of Bristol | 2012 | 1.0856 | 1.0597 | 1.0244 | 1.0436 | 0.9878 | 1.0564 | 1.0705 | 1.0115 | 1.0583 |
| University of Bristol | 2013 | 0.9537 | 0.9752 | 0.9780 | 0.8462 | 0.8799 | 0.9618 | 0.9103 | 0.9531 | 0.9551 |
| University of Bristol | 2014 | 0.9793 | 1.0138 | 0.9659 | 1.0375 | 1.0648 | 0.9743 | 1.0011 | 1.0210 | 0.9805 |
| University of Bristol | 2015 | 1.0057 | 0.9847 | 1.0213 | 0.9423 | 0.9329 | 1.0101 | 0.9955 | 0.9801 | 1.0158 |
| University of Bristol | 2016 | 1.0771 | 1.0506 | 1.0252 | 0.9511 | 0.9263 | 1.0267 | 1.0562 | 1.0111 | 1.0446 |
| University of Cambridge | 2011 | |||||||||
| University of Cambridge | 2012 | 1.0243 | 1.0000 | 1.0243 | 1.0055 | 1.0000 | 1.0055 | 1.0132 | 1.0000 | 1.0132 |
| University of Cambridge | 2013 | 0.9964 | 1.0000 | 0.9964 | 1.0162 | 1.0000 | 1.0162 | 1.0162 | 1.0000 | 1.0162 |
| University of Cambridge | 2014 | 0.9952 | 1.0000 | 0.9952 | 1.0513 | 1.0000 | 1.0513 | 1.0303 | 1.0000 | 1.0303 |
| University of Cambridge | 2015 | 0.9858 | 1.0000 | 0.9858 | 1.0154 | 1.0000 | 1.0154 | 1.0131 | 1.0000 | 1.0131 |
| University of Cambridge | 2016 | 1.0044 | 1.0000 | 1.0044 | 1.0383 | 1.0000 | 1.0383 | 1.0251 | 1.0000 | 1.0251 |
| University of Copenhagen | 2011 | |||||||||
| University of Copenhagen | 2012 | 1.3003 | 1.2325 | 1.0550 | 1.0775 | 1.0391 | 1.0370 | 1.1659 | 1.1227 | 1.0385 |
| University of Copenhagen | 2013 | 1.0206 | 1.0271 | 0.9936 | 1.0687 | 1.0775 | 0.9918 | 1.0018 | 1.0238 | 0.9785 |
| University of Copenhagen | 2014 | 1.0027 | 1.0019 | 1.0008 | 1.0829 | 1.0452 | 1.0360 | 1.0537 | 1.0348 | 1.0183 |
| University of Copenhagen | 2015 | 0.9924 | 0.9877 | 1.0048 | 1.0390 | 1.0179 | 1.0208 | 1.0273 | 1.0102 | 1.0170 |
| University of Copenhagen | 2016 | 1.1718 | 1.1435 | 1.0248 | 1.0763 | 1.0449 | 1.0300 | 1.0917 | 1.0554 | 1.0344 |
| University of Dundee | 2011 | |||||||||
| University of Dundee | 2012 | 1.0718 | 1.0326 | 1.0380 | 1.0915 | 1.0035 | 1.0878 | 1.0696 | 1.0000 | 1.0696 |
| University of Dundee | 2013 | 0.9191 | 0.9400 | 0.9778 | 0.8434 | 0.8612 | 0.9794 | 0.9090 | 0.9521 | 0.9547 |
| University of Dundee | 2014 | 1.0310 | 1.0639 | 0.9691 | 0.9775 | 0.9621 | 1.0160 | 1.0292 | 1.0503 | 0.9800 |
| University of Dundee | 2015 | 0.9954 | 0.9481 | 1.0498 | 0.9141 | 0.9031 | 1.0121 | 0.9916 | 0.9505 | 1.0433 |
| University of Dundee | 2016 | 1.0652 | 1.0431 | 1.0212 | 1.0379 | 1.0339 | 1.0039 | 1.0643 | 1.0406 | 1.0228 |
| University of East Anglia | 2011 | |||||||||
| University of East Anglia | 2012 | 1.0977 | 1.1141 | 0.9853 | 0.9797 | 0.9934 | 0.9862 | 1.1203 | 1.1098 | 1.0095 |
| University of East Anglia | 2013 | 0.9916 | 1.0149 | 0.9771 | 0.8696 | 0.9210 | 0.9442 | 0.9562 | 1.0002 | 0.9560 |
| University of East Anglia | 2014 | 0.9623 | 1.0048 | 0.9577 | 0.9627 | 0.8880 | 1.0842 | 0.9543 | 0.9931 | 0.9609 |
| University of East Anglia | 2015 | 1.0265 | 0.9662 | 1.0624 | 1.0423 | 1.0221 | 1.0198 | 1.0283 | 0.9718 | 1.0581 |
| University of East Anglia | 2016 | 1.1003 | 1.1074 | 0.9936 | 1.0118 | 0.9906 | 1.0214 | 1.0953 | 1.1004 | 0.9953 |
| University of Edinburgh | 2011 | |||||||||
| University of Edinburgh | 2012 | 1.0718 | 1.0307 | 1.0398 | 1.0476 | 1.0169 | 1.0302 | 1.0718 | 1.0307 | 1.0398 |
| University of Edinburgh | 2013 | 0.9874 | 1.0066 | 0.9809 | 1.0035 | 0.9925 | 1.0111 | 0.9864 | 1.0066 | 0.9799 |
| University of Edinburgh | 2014 | 0.9514 | 0.9693 | 0.9815 | 1.0398 | 1.0110 | 1.0285 | 0.9574 | 0.9751 | 0.9819 |
| University of Edinburgh | 2015 | 1.0068 | 1.0054 | 1.0014 | 0.9989 | 0.9838 | 1.0154 | 1.0037 | 0.9995 | 1.0042 |
| University of Edinburgh | 2016 | 1.0996 | 1.0581 | 1.0392 | 1.0233 | 0.9983 | 1.0251 | 1.0996 | 1.0581 | 1.0392 |
| University of Exeter | 2011 | |||||||||
| University of Exeter | 2012 | 1.0916 | 1.0564 | 1.0333 | 1.0698 | 1.0341 | 1.0345 | 1.0916 | 1.0564 | 1.0333 |
| University of Exeter | 2013 | 1.0588 | 1.0899 | 0.9715 | 1.0855 | 1.1271 | 0.9631 | 1.0588 | 1.0899 | 0.9715 |
| University of Exeter | 2014 | 1.0112 | 1.0177 | 0.9936 | 1.0016 | 0.9351 | 1.0712 | 1.0114 | 1.0182 | 0.9933 |
| University of Exeter | 2015 | 1.0060 | 0.9766 | 1.0301 | 0.9250 | 0.9389 | 0.9852 | 1.0065 | 0.9774 | 1.0298 |
| University of Exeter | 2016 | 1.1610 | 1.1233 | 1.0335 | 1.2387 | 1.2357 | 1.0025 | 1.1543 | 1.1255 | 1.0256 |
| University of Freiburg | 2011 | |||||||||
| University of Freiburg | 2012 | 1.0299 | 1.0153 | 1.0144 | 1.0357 | 1.0046 | 1.0309 | 1.0299 | 1.0153 | 1.0144 |
| University of Freiburg | 2013 | 1.0119 | 1.0197 | 0.9924 | 1.0237 | 1.0155 | 1.0081 | 1.0119 | 1.0197 | 0.9924 |
| University of Freiburg | 2014 | 1.0413 | 1.0232 | 1.0177 | 1.0585 | 1.0240 | 1.0336 | 1.0413 | 1.0232 | 1.0177 |
| University of Freiburg | 2015 | 0.9808 | 0.9874 | 0.9933 | 1.0222 | 1.0215 | 1.0006 | 0.9808 | 0.9874 | 0.9933 |
| University of Freiburg | 2016 | 1.1739 | 1.1458 | 1.0245 | 1.0250 | 0.9971 | 1.0279 | 1.1736 | 1.1458 | 1.0242 |
| University of Geneva | 2011 | |||||||||
| University of Geneva | 2012 | 1.0184 | 1.0352 | 0.9838 | 1.0394 | 0.9876 | 1.0524 | 1.0183 | 1.0202 | 0.9981 |
| University of Geneva | 2013 | 0.9741 | 0.9997 | 0.9744 | 0.9960 | 0.9659 | 1.0312 | 0.9763 | 0.9993 | 0.9770 |
| University of Geneva | 2014 | 1.0117 | 1.0087 | 1.0030 | 1.0662 | 1.0242 | 1.0410 | 1.0122 | 1.0007 | 1.0115 |
| University of Geneva | 2015 | 1.0076 | 1.0000 | 1.0076 | 1.0162 | 1.0096 | 1.0066 | 1.0084 | 1.0000 | 1.0084 |
| University of Geneva | 2016 | 1.0210 | 1.0000 | 1.0210 | 1.0037 | 1.0018 | 1.0019 | 1.0211 | 1.0000 | 1.0211 |
| University of Glasgow | 2011 | |||||||||
| University of Glasgow | 2012 | 1.1143 | 1.0741 | 1.0374 | 1.0345 | 1.0045 | 1.0299 | 1.1143 | 1.0741 | 1.0374 |
| University of Glasgow | 2013 | 0.9411 | 0.9574 | 0.9830 | 0.9690 | 0.9617 | 1.0076 | 0.9419 | 0.9576 | 0.9836 |
| University of Glasgow | 2014 | 1.0117 | 1.0436 | 0.9695 | 1.0227 | 0.9962 | 1.0266 | 1.0183 | 1.0498 | 0.9700 |
| University of Glasgow | 2015 | 1.0439 | 1.0193 | 1.0241 | 1.0565 | 1.0527 | 1.0036 | 1.0426 | 1.0214 | 1.0208 |
| University of Glasgow | 2016 | 1.0150 | 0.9651 | 1.0518 | 1.0103 | 0.9820 | 1.0289 | 1.0109 | 0.9571 | 1.0561 |
| University of Göttingen | 2011 | |||||||||
| University of Göttingen | 2012 | 0.9091 | 0.8753 | 1.0387 | 1.2455 | 1.1875 | 1.0488 | 0.9095 | 0.8753 | 1.0391 |
| University of Göttingen | 2013 | 1.0985 | 1.1234 | 0.9778 | 1.1114 | 1.0845 | 1.0248 | 1.0986 | 1.1234 | 0.9780 |
| University of Göttingen | 2014 | 0.9676 | 0.9719 | 0.9956 | 0.6741 | 0.6477 | 1.0407 | 0.9660 | 0.9719 | 0.9938 |
| University of Göttingen | 2015 | 1.0270 | 1.0275 | 0.9995 | 1.0238 | 1.0186 | 1.0051 | 1.0270 | 1.0275 | 0.9995 |
| University of Göttingen | 2016 | 0.7960 | 0.7713 | 1.0321 | 1.0304 | 1.0085 | 1.0217 | 0.7960 | 0.7713 | 1.0321 |
| University of Groningen | 2011 | |||||||||
| University of Groningen | 2012 | 1.0521 | 1.0110 | 1.0407 | 1.0701 | 1.0372 | 1.0318 | 1.0812 | 1.0395 | 1.0401 |
| University of Groningen | 2013 | 1.2216 | 1.1876 | 1.0286 | 1.0497 | 1.0331 | 1.0161 | 1.1758 | 1.1930 | 0.9856 |
| University of Groningen | 2014 | 0.9529 | 0.9929 | 0.9598 | 1.0423 | 1.0079 | 1.0342 | 1.0122 | 1.0093 | 1.0029 |
| University of Groningen | 2015 | 1.0081 | 0.9980 | 1.0101 | 1.0448 | 1.0209 | 1.0235 | 1.0188 | 0.9980 | 1.0209 |
| University of Groningen | 2016 | 1.0935 | 1.0327 | 1.0588 | 1.0323 | 1.0230 | 1.0090 | 1.0429 | 1.0020 | 1.0409 |
| University of Helsinki | 2011 | |||||||||
| University of Helsinki | 2012 | 0.9988 | 0.9734 | 1.0261 | 1.0014 | 0.9675 | 1.0350 | 0.9983 | 0.9624 | 1.0374 |
| University of Helsinki | 2013 | 1.0232 | 1.0500 | 0.9745 | 1.0003 | 1.0316 | 0.9696 | 1.0071 | 1.0512 | 0.9580 |
| University of Helsinki | 2014 | 0.9845 | 1.0113 | 0.9735 | 1.0193 | 0.9916 | 1.0279 | 1.0064 | 1.0185 | 0.9881 |
| University of Helsinki | 2015 | 1.0212 | 1.0066 | 1.0145 | 1.0467 | 1.0325 | 1.0138 | 1.0256 | 1.0065 | 1.0190 |
| University of Helsinki | 2016 | 1.0599 | 1.0168 | 1.0423 | 1.0320 | 1.0099 | 1.0219 | 1.0399 | 0.9730 | 1.0687 |
| University of Konstanz | 2011 | |||||||||
| University of Konstanz | 2012 | 0.9118 | 1.0000 | 0.9118 | 0.9276 | 1.0000 | 0.9276 | 0.9118 | 1.0000 | 0.9118 |
| University of Konstanz | 2013 | 1.0922 | 1.0000 | 1.0922 | 1.0105 | 1.0000 | 1.0105 | 1.0922 | 1.0000 | 1.0922 |
| University of Konstanz | 2014 | 0.9744 | 1.0000 | 0.9744 | 1.0791 | 1.0000 | 1.0791 | 0.9744 | 1.0000 | 0.9744 |
| University of Konstanz | 2015 | 1.0052 | 1.0000 | 1.0052 | 0.9270 | 1.0000 | 0.9270 | 1.0056 | 1.0000 | 1.0056 |
| University of Konstanz | 2016 | 1.3417 | 1.0000 | 1.3417 | 1.0163 | 1.0000 | 1.0163 | 1.3320 | 1.0000 | 1.3320 |
| University of Lausanne | 2011 | |||||||||
| University of Lausanne | 2012 | 1.0792 | 1.0642 | 1.0140 | 0.9938 | 0.9300 | 1.0685 | 1.0738 | 1.0598 | 1.0132 |
| University of Lausanne | 2013 | 0.9647 | 0.9889 | 0.9755 | 1.0164 | 1.0044 | 1.0120 | 0.9592 | 0.9828 | 0.9760 |
| University of Lausanne | 2014 | 1.0176 | 1.0095 | 1.0081 | 1.0554 | 1.0196 | 1.0351 | 1.0189 | 1.0091 | 1.0097 |
| University of Lausanne | 2015 | 0.9974 | 0.9828 | 1.0149 | 1.0241 | 1.0283 | 0.9959 | 0.9979 | 0.9858 | 1.0123 |
| University of Lausanne | 2016 | 1.0518 | 1.0220 | 1.0291 | 0.9537 | 0.9595 | 0.9939 | 1.0491 | 1.0252 | 1.0233 |
| University of Leeds | 2011 | |||||||||
| University of Leeds | 2012 | 1.0597 | 1.0530 | 1.0064 | 1.0332 | 1.0073 | 1.0257 | 1.0920 | 1.0754 | 1.0155 |
| University of Leeds | 2013 | 1.0558 | 1.0676 | 0.9889 | 0.9659 | 0.9636 | 1.0024 | 0.9857 | 1.0241 | 0.9625 |
| University of Leeds | 2014 | 1.0458 | 1.0703 | 0.9771 | 1.0237 | 0.9977 | 1.0261 | 1.0505 | 1.0654 | 0.9860 |
| University of Leeds | 2015 | 0.9683 | 0.9506 | 1.0186 | 1.0294 | 1.0172 | 1.0120 | 0.9797 | 0.9604 | 1.0201 |
| University of Leeds | 2016 | 1.1377 | 1.1161 | 1.0194 | 1.0576 | 1.0233 | 1.0335 | 1.1274 | 1.0909 | 1.0334 |
| University of Liverpool | 2011 | |||||||||
| University of Liverpool | 2012 | 1.0702 | 1.0651 | 1.0048 | 1.0298 | 1.0020 | 1.0278 | 1.0984 | 1.0854 | 1.0120 |
| University of Liverpool | 2013 | 1.0304 | 1.0638 | 0.9686 | 0.9665 | 0.9586 | 1.0082 | 1.0035 | 1.0414 | 0.9635 |
| University of Liverpool | 2014 | 1.0125 | 1.0044 | 1.0080 | 1.0224 | 0.9927 | 1.0300 | 1.0212 | 1.0094 | 1.0116 |
| University of Liverpool | 2015 | 1.0616 | 1.0433 | 1.0175 | 1.0406 | 1.0233 | 1.0169 | 1.0600 | 1.0478 | 1.0117 |
| University of Liverpool | 2016 | 1.0926 | 1.0620 | 1.0288 | 1.0185 | 1.0090 | 1.0094 | 1.0807 | 1.0495 | 1.0297 |
| University of Manchester | 2011 | |||||||||
| University of Manchester | 2012 | 1.0398 | 1.0298 | 1.0097 | 1.0079 | 0.9713 | 1.0377 | 1.0170 | 0.9973 | 1.0198 |
| University of Manchester | 2013 | 0.9863 | 0.9876 | 0.9987 | 0.9740 | 0.9898 | 0.9840 | 0.9612 | 0.9835 | 0.9773 |
| University of Manchester | 2014 | 1.0014 | 1.0132 | 0.9883 | 1.0094 | 0.9766 | 1.0336 | 1.0344 | 1.0248 | 1.0094 |
| University of Manchester | 2015 | 1.0210 | 1.0111 | 1.0097 | 1.0100 | 1.0034 | 1.0066 | 1.0147 | 1.0038 | 1.0108 |
| University of Manchester | 2016 | 1.0622 | 1.0425 | 1.0189 | 1.0177 | 0.9903 | 1.0277 | 1.0575 | 1.0278 | 1.0289 |
| University of Nottingham | 2011 | |||||||||
| University of Nottingham | 2012 | 0.9697 | 0.9699 | 0.9998 | 1.0577 | 1.0265 | 1.0304 | 0.9979 | 0.9815 | 1.0167 |
| University of Nottingham | 2013 | 0.9804 | 0.9931 | 0.9872 | 0.9872 | 0.9919 | 0.9953 | 0.9359 | 0.9809 | 0.9541 |
| University of Nottingham | 2014 | 0.9782 | 0.9964 | 0.9817 | 1.0441 | 1.0188 | 1.0249 | 1.0178 | 1.0013 | 1.0165 |
| University of Nottingham | 2015 | 1.0039 | 0.9909 | 1.0131 | 1.0371 | 1.0270 | 1.0098 | 1.0294 | 1.0100 | 1.0192 |
| University of Nottingham | 2016 | 1.1428 | 1.1322 | 1.0093 | 1.0123 | 0.9922 | 1.0203 | 1.1006 | 1.0676 | 1.0309 |
| University of Oxford | 2011 | |||||||||
| University of Oxford | 2012 | 1.0369 | 1.0000 | 1.0369 | 1.0599 | 1.0000 | 1.0599 | 1.0403 | 1.0000 | 1.0403 |
| University of Oxford | 2013 | 1.0090 | 1.0000 | 1.0090 | 1.0463 | 1.0000 | 1.0463 | 1.0568 | 1.0000 | 1.0568 |
| University of Oxford | 2014 | 1.0251 | 1.0000 | 1.0251 | 1.0717 | 1.0000 | 1.0717 | 1.0540 | 1.0000 | 1.0540 |
| University of Oxford | 2015 | 0.9496 | 1.0000 | 0.9496 | 1.0293 | 1.0000 | 1.0293 | 0.9695 | 1.0000 | 0.9695 |
| University of Oxford | 2016 | 1.0056 | 1.0000 | 1.0056 | 1.0588 | 1.0000 | 1.0588 | 1.0306 | 1.0000 | 1.0306 |
| University of Sheffield | 2011 | |||||||||
| University of Sheffield | 2012 | 1.0638 | 1.0509 | 1.0123 | 0.9818 | 0.9585 | 1.0243 | 1.0649 | 1.0127 | 1.0516 |
| University of Sheffield | 2013 | 1.0137 | 1.0392 | 0.9755 | 0.9530 | 0.9521 | 1.0010 | 0.9603 | 0.9998 | 0.9605 |
| University of Sheffield | 2014 | 0.9940 | 1.0232 | 0.9714 | 1.0055 | 0.9811 | 1.0248 | 1.0139 | 1.0305 | 0.9839 |
| University of Sheffield | 2015 | 1.0199 | 0.9995 | 1.0203 | 0.9914 | 0.9751 | 1.0167 | 1.0219 | 1.0074 | 1.0144 |
| University of Sheffield | 2016 | 1.0857 | 1.0557 | 1.0284 | 1.0053 | 0.9903 | 1.0151 | 1.0719 | 1.0437 | 1.0270 |
| University of Southampton | 2011 | |||||||||
| University of Southampton | 2012 | 1.0255 | 1.0078 | 1.0175 | 0.9999 | 0.9682 | 1.0327 | 1.0476 | 1.0172 | 1.0299 |
| University of Southampton | 2013 | 1.0199 | 1.0406 | 0.9801 | 0.9904 | 0.9884 | 1.0020 | 0.9793 | 1.0194 | 0.9606 |
| University of Southampton | 2014 | 0.9811 | 0.9834 | 0.9977 | 1.0419 | 1.0164 | 1.0251 | 1.0039 | 1.0046 | 0.9994 |
| University of Southampton | 2015 | 1.0379 | 1.0273 | 1.0104 | 1.0705 | 1.0550 | 1.0147 | 1.0462 | 1.0338 | 1.0120 |
| University of Southampton | 2016 | 1.0668 | 1.0493 | 1.0167 | 1.0193 | 0.9982 | 1.0212 | 1.0559 | 1.0280 | 1.0271 |
| University of St Andrews | 2011 | |||||||||
| University of St Andrews | 2012 | 0.9444 | 1.0000 | 0.9444 | 1.0725 | 1.0000 | 1.0725 | 0.9640 | 1.0000 | 0.9640 |
| University of St Andrews | 2013 | 0.9987 | 1.0000 | 0.9987 | 0.9844 | 1.0000 | 0.9844 | 1.0274 | 1.0000 | 1.0274 |
| University of St Andrews | 2014 | 0.9756 | 1.0000 | 0.9756 | 0.9039 | 1.0000 | 0.9039 | 0.8899 | 1.0000 | 0.8899 |
| University of St Andrews | 2015 | 1.0312 | 1.0000 | 1.0312 | 0.9912 | 1.0000 | 0.9912 | 1.0327 | 1.0000 | 1.0327 |
| University of St Andrews | 2016 | 1.0959 | 1.0000 | 1.0959 | 0.9796 | 1.0000 | 0.9796 | 1.0954 | 1.0000 | 1.0954 |
| University of Sussex | 2011 | |||||||||
| University of Sussex | 2012 | 0.8821 | 1.0000 | 0.8821 | 1.0305 | 1.0000 | 1.0305 | 0.8821 | 1.0000 | 0.8821 |
| University of Sussex | 2013 | 1.0175 | 1.0000 | 1.0175 | 0.9044 | 1.0000 | 0.9044 | 1.0178 | 1.0000 | 1.0178 |
| University of Sussex | 2014 | 0.9227 | 1.0000 | 0.9227 | 1.0760 | 1.0000 | 1.0760 | 0.9571 | 1.0000 | 0.9571 |
| University of Sussex | 2015 | 1.0354 | 1.0000 | 1.0354 | 0.8338 | 0.9551 | 0.8730 | 1.0354 | 1.0000 | 1.0354 |
| University of Sussex | 2016 | 0.9965 | 1.0000 | 0.9965 | 0.9897 | 0.9737 | 1.0164 | 0.9965 | 1.0000 | 0.9965 |
| University of Tübingen | 2011 | |||||||||
| University of Tübingen | 2012 | 1.1367 | 1.0764 | 1.0560 | 1.0126 | 1.0014 | 1.0112 | 1.1367 | 1.0764 | 1.0560 |
| University of Tübingen | 2013 | 1.0913 | 1.1137 | 0.9799 | 0.9947 | 0.9826 | 1.0123 | 1.0913 | 1.1137 | 0.9799 |
| University of Tübingen | 2014 | 0.9729 | 0.9659 | 1.0072 | 1.0178 | 0.9889 | 1.0292 | 0.9737 | 0.9712 | 1.0025 |
| University of Tübingen | 2015 | 1.0586 | 1.0622 | 0.9965 | 1.0248 | 1.0240 | 1.0008 | 1.0548 | 1.0565 | 0.9985 |
| University of Tübingen | 2016 | 1.0768 | 1.0395 | 1.0359 | 1.0159 | 0.9902 | 1.0259 | 1.0768 | 1.0395 | 1.0359 |
| University of Twente | 2011 | |||||||||
| University of Twente | 2012 | 1.0509 | 0.9501 | 1.1060 | 0.9631 | 0.9396 | 1.0250 | 1.0341 | 0.9287 | 1.1136 |
| University of Twente | 2013 | 1.0914 | 1.0460 | 1.0434 | 1.0123 | 1.0839 | 0.9340 | 1.0914 | 1.0460 | 1.0434 |
| University of Twente | 2014 | 0.9968 | 1.0543 | 0.9455 | 1.1994 | 1.1369 | 1.0550 | 1.0092 | 1.0844 | 0.9306 |
| University of Twente | 2015 | 1.0635 | 1.0594 | 1.0039 | 0.8912 | 0.8872 | 1.0044 | 1.0398 | 1.0300 | 1.0095 |
| University of Twente | 2016 | 1.0798 | 1.0775 | 1.0021 | 1.0687 | 1.0632 | 1.0051 | 1.0798 | 1.0775 | 1.0021 |
| University of Würzburg | 2011 | |||||||||
| University of Würzburg | 2012 | 1.0250 | 0.9889 | 1.0365 | 0.9977 | 0.9696 | 1.0290 | 1.0250 | 0.9889 | 1.0365 |
| University of Würzburg | 2013 | 1.1244 | 1.1498 | 0.9779 | 0.9704 | 0.9664 | 1.0041 | 1.1244 | 1.1498 | 0.9779 |
| University of Würzburg | 2014 | 1.0860 | 1.0788 | 1.0067 | 1.0185 | 0.9904 | 1.0284 | 1.0860 | 1.0788 | 1.0067 |
| University of Würzburg | 2015 | 1.0574 | 1.0653 | 0.9926 | 1.0219 | 1.0079 | 1.0140 | 1.0574 | 1.0653 | 0.9926 |
| University of Würzburg | 2016 | 0.9717 | 0.9530 | 1.0196 | 1.0099 | 0.9870 | 1.0232 | 0.9717 | 0.9530 | 1.0196 |
| University of York | 2011 | |||||||||
| University of York | 2012 | 0.8835 | 0.8938 | 0.9885 | 1.0080 | 0.9653 | 1.0442 | 0.8890 | 0.8912 | 0.9974 |
| University of York | 2013 | 1.1014 | 1.1019 | 0.9996 | 0.8685 | 0.8919 | 0.9738 | 1.0910 | 1.1010 | 0.9909 |
| University of York | 2014 | 1.0287 | 1.0802 | 0.9522 | 0.9785 | 0.9191 | 1.0646 | 1.0310 | 1.0802 | 0.9544 |
| University of York | 2015 | 1.0105 | 0.9715 | 1.0401 | 0.9494 | 0.9543 | 0.9948 | 1.0098 | 0.9726 | 1.0382 |
| University of York | 2016 | 0.9359 | 0.9127 | 1.0255 | 1.0838 | 1.0855 | 0.9985 | 0.9384 | 0.9184 | 1.0218 |
| Uppsala University | 2011 | |||||||||
| Uppsala University | 2012 | 0.9847 | 0.9519 | 1.0345 | 1.0019 | 0.9787 | 1.0236 | 0.9666 | 0.9410 | 1.0271 |
| Uppsala University | 2013 | 0.9708 | 0.9435 | 1.0289 | 0.9745 | 0.9711 | 1.0035 | 0.9533 | 0.9555 | 0.9976 |
| Uppsala University | 2014 | 0.9764 | 1.0235 | 0.9540 | 1.0272 | 0.9997 | 1.0275 | 0.9733 | 0.9907 | 0.9824 |
| Uppsala University | 2015 | 1.0505 | 1.0378 | 1.0123 | 0.9783 | 0.9589 | 1.0203 | 1.0348 | 1.0169 | 1.0176 |
| Uppsala University | 2016 | 1.1425 | 1.0734 | 1.0644 | 1.0445 | 1.0264 | 1.0177 | 1.1357 | 1.0667 | 1.0647 |
| Utrecht University | 2011 | |||||||||
| Utrecht University | 2012 | 1.3740 | 1.3267 | 1.0356 | 1.0458 | 1.0155 | 1.0298 | 1.0518 | 1.0155 | 1.0358 |
| Utrecht University | 2013 | 1.0370 | 1.0510 | 0.9867 | 1.0596 | 1.0093 | 1.0499 | 1.0427 | 1.0093 | 1.0331 |
| Utrecht University | 2014 | 0.9979 | 1.0246 | 0.9740 | 1.0429 | 1.0000 | 1.0429 | 1.0214 | 1.0000 | 1.0214 |
| Utrecht University | 2015 | 0.9801 | 0.9844 | 0.9956 | 0.9900 | 1.0000 | 0.9900 | 0.9929 | 1.0000 | 0.9929 |
| Utrecht University | 2016 | 1.0933 | 1.0169 | 1.0751 | 1.0108 | 1.0000 | 1.0108 | 1.0313 | 1.0000 | 1.0313 |
| VU University Amsterdam | 2011 | |||||||||
| VU University Amsterdam | 2012 | 0.9843 | 0.9397 | 1.0474 | 1.0399 | 0.9940 | 1.0462 | 1.0162 | 0.9768 | 1.0403 |
| VU University Amsterdam | 2013 | 1.0151 | 1.0303 | 0.9852 | 1.0051 | 0.9898 | 1.0155 | 1.0018 | 0.9934 | 1.0084 |
| VU University Amsterdam | 2014 | 0.9981 | 1.0232 | 0.9754 | 1.0776 | 1.0731 | 1.0041 | 1.0157 | 1.0012 | 1.0145 |
| VU University Amsterdam | 2015 | 1.0139 | 0.9886 | 1.0256 | 1.0146 | 1.0122 | 1.0024 | 1.0207 | 1.0052 | 1.0154 |
| VU University Amsterdam | 2016 | 1.1810 | 1.1220 | 1.0526 | 1.0910 | 1.0719 | 1.0178 | 1.1198 | 1.0643 | 1.0522 |
| Wageningen University & R. | 2011 | |||||||||
| Wageningen University & R. | 2012 | 1.0528 | 1.0000 | 1.0528 | 1.0783 | 1.0625 | 1.0149 | 1.0689 | 1.0000 | 1.0689 |
| Wageningen University & R. | 2013 | 1.0135 | 1.0000 | 1.0135 | 0.9279 | 0.9686 | 0.9580 | 0.9980 | 1.0000 | 0.9980 |
| Wageningen University & R. | 2014 | 0.9382 | 1.0000 | 0.9382 | 1.0278 | 0.9667 | 1.0632 | 0.9664 | 1.0000 | 0.9664 |
| Wageningen University & R. | 2015 | 1.0024 | 1.0000 | 1.0024 | 1.0561 | 1.0558 | 1.0003 | 1.0033 | 1.0000 | 1.0033 |
| Wageningen University & R. | 2016 | 1.0744 | 1.0000 | 1.0744 | 1.1048 | 1.1032 | 1.0014 | 1.0815 | 1.0000 | 1.0815 |
References
- Altbach, P.G.; Knight, J. The internationalization of higher education: Motivations and realities. J. Stud. Int. Educ. 2007, 11, 290–305. [Google Scholar] [CrossRef]
- Albers, S. Esteem indicators: Membership in editorial boards or honorary doctorates, discussion of quantitative and qualitative rankings of scholars by Rost and Frey. Schmalenbach Bus. Rev. 2011, 63, 92–98. [Google Scholar] [CrossRef]
- Teichler, U. Social Contexts and Systematic Consequences of University Rankings: A Meta-Analysis of the Ranking Literature. In University Rankings—Theoretical Basis, Methodology and Impacts on Global Higher Education; Shin, J.C., Toutkoushian, R.K., Teichler, U., Eds.; Springer: Dordrecht, The Netherlands, 2011; pp. 55–69. [Google Scholar]
- Klumpp, M.; de Boer, H.; Vossensteyn, H. Comparing national policies on institutional profiling in Germany and the Netherlands. Comp. Educ. 2014, 50, 156–176. [Google Scholar] [CrossRef]
- Groot, T.; García-Valderrama, T. Research quality and efficiency—An analysis of assessments and management issues in Dutch economics and business research programs. Res. Policy 2006, 35, 1362–1376. [Google Scholar] [CrossRef]
- Costas, R.; van Leeuwen, T.N.; Bordos, M. A bibliometric classificatory approach for the study and assessment of research performance at the individual level: The effects of age on productivity and impact. J. Am. Soc. Inf. Sci. Technol. 2010, 61, 1564–1581. [Google Scholar] [CrossRef]
- Krapf, M. Research evaluation and journal quality weights: Much ado about nothing. J. Bus. Econ. 2011, 81, 5–27. [Google Scholar] [CrossRef]
- Rost, K.; Frey, B.S. Quantitative and qualitative rankings of scholars. Schmalenbach Bus. Rev. 2011, 63, 63–91. [Google Scholar] [CrossRef]
- Sarrico, C.S. On performance in higher education—Towards performance government. Tert. Educ. Manag. 2010, 16, 145–158. [Google Scholar] [CrossRef]
- Kreiman, G.; Maunsell, J.H.R. Nine criteria for a measure of scientific output. Front. Comput. Neurosci. 2011, 5, 48. [Google Scholar] [CrossRef] [PubMed]
- Wilkins, S.; Huisman, J. Stakeholder perspectives on citation and peer-based rankings of higher education journals. Tert. Educ. Manag. 2015, 21, 1–15. [Google Scholar] [CrossRef]
- Hicks, D.; Wouters, P.; Waltman, L.; de Rijcke, S.; Rafols, I. The Leiden Manifesto for research. Nature 2016, 520, 429–431. [Google Scholar] [CrossRef] [PubMed]
- Parteka, A.; Wolszczak-Derlacz, J. Dynamics of productivity in higher education: Cross-European evidence based on bootstrapped Malmquist indices. J. Prod. Anal. 2013, 40, 67–82. [Google Scholar] [CrossRef]
- Dundar, H.; Lewis, D.R. Departmental productivity in American universities: Economies of scale and scope. Econ. Educ. Rev. 1995, 14, 199–244. [Google Scholar] [CrossRef]
- Hashimoto, K.; Cohn, E. Economies of scale and scope in Japanese private universities. Educ. Econ. 1997, 5, 107–115. [Google Scholar] [CrossRef]
- Casu, B.; Thanassoulis, E. Evaluating cost efficiency in central administrative services in UK universities. Omega 2006, 34, 417–426. [Google Scholar] [CrossRef]
- Sarrico, C.S.; Teixeira, P.N.F.L.; Rosa, M.J.; Cardoso, M.F. Subject mix and productivity in Portuguese universities. Eur. J. Oper. Res. 2009, 197, 287–295. [Google Scholar] [CrossRef]
- Mainardes, E.; Alves, H.; Raposo, M. Using expectations and satisfaction to measure the frontiers of efficiency in public universities. Tert. Educ. Manag. 2014, 20, 339–353. [Google Scholar] [CrossRef]
- Daraio, C.; Bonaccorsi, A.; Simar, L. Efficiency and economies of scale and specialization in European universities—A directional distance approach. J. Infometr. 2015, 9, 430–448. [Google Scholar] [CrossRef]
- Millot, B. International rankings: Universities vs. higher education systems. Int. J. Educ. Dev. 2015, 20, 156–165. [Google Scholar] [CrossRef]
- Dixon, R.; Hood, C. Ranking Academic Research Performance: A Recipe for Success? Sociol. Trav. 2016, 58, 403–411. [Google Scholar] [CrossRef]
- Lee, B.L.; Worthington, A.C. A network DEA quantity and quality-orientated production model: An application to Australian university research services. Omega 2016, 60, 26–33. [Google Scholar] [CrossRef]
- Olcay, G.A.; Bulu, M. Is measuring the knowledge creation of universities possible? A review of university rankings. Technol. Forecast. Soc. Change 2016. [Google Scholar] [CrossRef]
- Charnes, A.; Cooper, W.W.; Rhodes, E.L. Measuring the efficiency of decision making units. Eur. J. Oper. Res. 1978, 2, 429–444. [Google Scholar] [CrossRef]
- Banker, R.D.; Charnes, A.; Cooper, W.W. Some models for estimating technical and scale inefficiencies in data envelopment analysis. Manag. Sci. 1984, 30, 1078–1092. [Google Scholar] [CrossRef]
- Bessent, A.M.; Bessent, E.W.; Charnes, A.; Cooper, W.W.; Thorogood, N. Evaluation of educational program proposals by means of DEA. Educ. Admin. Q. 1983, 19, 82–107. [Google Scholar] [CrossRef]
- Johnes, G.; Johnes, J. Measuring the research performance of UK economics departments: An application of data envelopment analysis. Oxf. Econ. Pap. 1993, 45, 332–347. [Google Scholar] [CrossRef]
- Athanassopoulos, A.D.; Shale, E. Assessing the comparative efficiency of higher education institutions in the UK by means of data envelopment analysis. Educ. Econ. 1997, 5, 117–134. [Google Scholar] [CrossRef]
- McMillan, M.L.; Datta, D. The relative efficiencies of Canadian universities: A DEA perspective. Can. Public Policy 1998, 24, 485–511. [Google Scholar] [CrossRef]
- Ng, Y.C.; Li, S.K. Measuring the research performance of Chinese higher education institutions: An application of data envelopment analysis. Educ. Econ. 2000, 8, 139–156. [Google Scholar] [CrossRef]
- Feng, Y.J.; Lu, H.; Bi, K. An AHP/DEA method for measurement of the efficiency of R&D management activities in universities. Int. Trans. Oper. Res. 2004, 11, 181–191. [Google Scholar] [CrossRef]
- Johnes, J. Measuring efficiency: A comparison of multilevel modelling and data envelopment analysis in the context of higher education. Bull. Econ. Res. 2006, 58, 75–104. [Google Scholar] [CrossRef]
- Kocher, M.G.; Luptacik, M.; Sutter, M. Measuring productivity of research in economics: A cross-country study using DEA. Socio-Econ. Plan. Sci. 2006, 40, 314–332. [Google Scholar] [CrossRef]
- Malmquist, S. Index numbers and indifference surfaces. Trabajos De Estadistica 1953, 42, 209–242. [Google Scholar] [CrossRef]
- Grifell-Tatje, E.; Lovell, K.C.A.; Pastor, J.T. A quasi-Malmquist productivity index. J. Prod. Anal. 1998, 10, 7–20. [Google Scholar] [CrossRef]
- Wang, Y.M.; Lan, Y.X. Measuring Malmquist productivity index: A new approach based on double frontiers data envelopment analysis. Math. Comp. Model. 2011, 54, 2760–2771. [Google Scholar] [CrossRef]
- Castano, M.C.N.; Cabana, E. Sources of efficiency and productivity growth in the Philippine state universities and colleges: A non-parametric approach. Int. Bus. Econ. Res. J. 2007, 6, 79–90. [Google Scholar] [CrossRef]
- Worthington, A.C.; Lee, B.L. Efficiency, technology and productivity change in Australian universities, 1998–2003. Econ. Educ. Rev. 2008, 27, 285–298. [Google Scholar] [CrossRef]
- Times Higher Education. World University Rankings 2015–2016 Methodology. Available online: https://www.timeshighereducation.com/news/ranking-methodology-2016 (accessed on 12 April 2018).
- Academic Ranking of World Universities: Methodology. Available online: http://www.shanghairanking.com/ARWU-Methodology-2016.html (accessed on 12 April 2018).
- Morphew, C.C.; Swanson, C. On the Efficacy of Raising Your University’s Rankings. In University Rankings—Theoretical Basis, Methodology and Impacts on Global Higher Education; Shin, J.C., Toutkoushian, R.K., Teichler, U., Eds.; Springer: Dordrecht, The Netherlands, 2011; pp. 185–199. [Google Scholar]
- Federkeil, G.; van Vught, F.A.; Westerheijden, D.F. Classifications and Rankings. In Multidimensional Ranking—The Design and Development of U-Multirank; van Vught, F.A., Ziegele, F., Eds.; Springer: Dordrecht, The Netherlands, 2011; pp. 25–37. [Google Scholar]
- Hazelkorn, E. Rankings and the Reshaping of Higher Education: The Battle for World-Class Excellence; Palgrave Macmillan: London, UK, 2011. [Google Scholar]
- Farrell, M.J. The Measurement of Productive Efficiency. J. R. Stat. Soc. Ser. A 1957, 120, 253–290. [Google Scholar] [CrossRef]
- Ylvinger, S. Industry performance and structural efficiency measures: Solutions to problems in firm models. Eur. J. Oper. Res. 2000, 121, 164–174. [Google Scholar] [CrossRef]
- Teichler, U. The Future of University Rankings. In University Rankings—Theoretical Basis, Methodology and Impacts on Global Higher Education; Shin, J.C., Toutkoushian, R.K., Teichler, U., Eds.; Springer: Dordrecht, The Netherlands, 2011; pp. 259–265. [Google Scholar]
- Shin, J.C. Organizational Effectiveness and University Rankings. In University Rankings—Theoretical Basis, Methodology and Impacts on Global Higher Education; Shin, J.C., Toutkoushian, R.K., Teichler, U., Eds.; Springer: Dordrecht, The Netherlands, 2011; pp. 19–34. [Google Scholar]
- Yeravdekar, V.R.; Tiwari, G. Global Rankings of Higher Education Institutions and India’s Effective Non-Presence. Procedia Soc. Behav. Sci. 2014, 157, 63–83. [Google Scholar] [CrossRef]
- O’Connel, C. An examination of global university rankings as a new mechanism influencing mission differentiation: The UK context. Tert. Educ. Manag. 2015, 21, 111–126. [Google Scholar] [CrossRef]
- Bonaccorsi, A.; Cicero, T. Nondeterministic ranking of university departments. J. Informetr. 2016, 10, 224–237. [Google Scholar] [CrossRef]
- Kehm, B.M.; Stensaker, B. University Rankings, Diversity and the New Landscape of Higher Education; Sense Publishers: Rotterdam, The Netherlands, 2009. [Google Scholar]
- Hazelkorn, E. Higher Education’s Future: A New Global World Order. In Resilient Universities—Confronting Changes in a Challenging World; Karlsen, J.E., Pritchard, R.M.O., Eds.; Peter Lang: Oxford, UK, 2013; pp. 53–89. [Google Scholar]
- Federkeil, G.; van Vught, F.A.; Westerheijden, D.F. An Evaluation and Critique of Current Rankings. In Multidimensional Ranking—The Design and Development of U-Multirank; van Vught, F.A., Ziegele, F., Eds.; Springer: Dordrecht, The Netherlands, 2011; pp. 39–70. [Google Scholar]
- Times Higher Education. World University Rankings 2016–2017 Methodology. Available online: https://www.timeshighereducation.com/world-university-rankings/2017/world-ranking#!/page/0/length/25/sort_by/rank/sort_order/asc/cols/stats (accessed on 12 April 2018).
- Institute for Higher Education Policy. College and University Ranking Systems—Global Perspectives and American Challenges; Institute for Higher Education Policy: Washington, DC, USA, 2007. [Google Scholar]
- Rauhvargers, A. Global University Rankings and Their Impact—EUA Report on Rankings 2013; European University Association (EUA): Brussels, Belgium, 2013. [Google Scholar]
- Longden, B. Ranking Indicators and Weights. In University Rankings—Theoretical Basis, Methodology and Impacts on Global Higher Education; Shin, J.C., Toutkoushian, R.K., Teichler, U., Eds.; Springer: Dordrecht, The Netherlands, 2011; pp. 73–104. [Google Scholar]
- Selkälä, A.; Ronkainen, S.; Alasaarela, E. Features of the Z-scoring method in graphical two-dimensional web surveys: The case of ZEF. Qual. Quant. 2011, 45, 609–621. [Google Scholar] [CrossRef]
- University of Leiden. CWTS Leiden Ranking 2011/12—Methodology; Centre for Science and Technology Studies: Leiden, The Netherlands, 2012. [Google Scholar]
- Waltman, L.; van Eck, N.J.; Tijssen, R.; Wouters, P. Moving Beyond Just Ranking—The CWTS Leiden Ranking 2016. Available online: https://www.cwts.nl/blog?article=n-q2w254 (accessed on 12 April 2018).
- ETER Project: European Tertiary Education Register. Available online: https://www.eter-project.com>A (accessed on 12 April 2018).
- Humboldt, W. Von Über die innere und äussere Organisation der höheren wissenschaftlichen Anstalten zu Berlin. In Gelegentliche Gedanken Über Universitäten; Müller, E., Ed.; Reclam: Leipzig, Germany, 1809; pp. 273–283. [Google Scholar]
- Anderson, R. Before and after Humboldt: European universities between the eighteenth and the nineteenth century. Hist. High. Educ. Annu. 2000, 20, 5–14. [Google Scholar]
- Ash, M.G. Bachelor of What, Master of Whom? The Humboldt Myth and Historical Transformations of Higher Education in German-Speaking Europe and the US. Eur. J. Educ. 2006, 41, 245–267. [Google Scholar] [CrossRef]
- Koopmans, T.C. Analysis of Production as an Efficient Combination of Activities. In Analysis of Production and Allocation, Proceedings of A Conference; Koopmans, T.C., Ed.; Wiley: New York, NY, USA, 1953; pp. 33–97. [Google Scholar]
- Debreu, G. The Coefficient of Resource Utilization. Econometrica 1951, 19, 273–292. [Google Scholar] [CrossRef]
- Diewert, W.E. Functional Forms for Profit and Transformation Functions. J. Econ. Theory 1973, 6, 284–316. [Google Scholar] [CrossRef]
- Cohn, E.; Rhine, S.L.W.; Santos, M.C. Institutions of higher education as multiproduct firms: Economies of scale and scope. Rev. Econ. Stat. 1989, 71, 284–290. [Google Scholar] [CrossRef]
- Flegg, T.A.; Allen, D.O.; Field, K.; Thurlow, T.W. Measuring the Efficiency of British Universities: A Multi-period Data Envelopment Analysis. Educ. Econ. 2004, 12, 231–249. [Google Scholar] [CrossRef]
- Agasisti, T.; Johnes, G. Beyond frontiers: Comparing the efficiency of higher education decision-making units across more than one country. Educ. Econ. 2009, 17, 59–79. [Google Scholar] [CrossRef]
- Ramón, N.; Ruiz, J.L.; Sirvent, I. Using Data Envelopment Analysis to Assess Effectiveness of the Processes at the University with Performance Indicators of Quality. Int. J. Oper. Quant. Manag. 2010, 16, 87–103. [Google Scholar]
- Bolli, T.; Olivares, M.; Bonaccorsi, A.; Daraio, C.; Aracil, A.G.; Lepori, B. The differential effects of competitive funding on the production frontier and the efficiency of universities. Econ. Educ. Rev. 2016, 52, 91–104. [Google Scholar] [CrossRef]
- Dyckhoff, H.; Clermont, M.; Dirksen, A.; Mbock, E. Measuring balanced effectiveness and efficiency of German business schools’ research performance. J. Bus. Econ. 2013, 39–60. [Google Scholar] [CrossRef]
- Cooper, W.W.; Seiford, L.M.; Tone, K. Data Envelopment Analysis—A Comprehensive Text with Models, Applications, References and DEA-Solver Software; Springer: New York, NY, USA, 2007. [Google Scholar]
- Ding, L.; Yang, Q.; Sun, L.; Tong, J.; Wang, Y. Evaluation of the Capability of Personal Software Process based on Data Envelopment Analysis. In Unifying the Software Process Spectrum: International Software Process Spectrum; Li, M., Boehm, B., Osterweil, L.J., Eds.; Springer: Berlin, Germany, 2006; pp. 235–248. [Google Scholar]
- Fisher, I. The Purchasing Power of Money, Its Determination and Relation to Credit, Interest and Crises; MacMillan: New York, NY, USA, 1911. [Google Scholar]
- Fisher, I. The Making of Index Numbers; Houghton Mifflin: Boston, MA, USA, 1922. [Google Scholar]
- Divisia, F. L’ Indice Monétaire et la Theorie de la Monnaie. Rev. Econ. Politique 1926, 40, 49–81. [Google Scholar]
- Nordhaus, W.D. Quality Change in Price Indices. J. Econ. Perspect. 1998, 12, 59–68. [Google Scholar] [CrossRef]
- Pollak, R.A. The Consumer Price Index: A Research Agenda and Three Proposals. J. Econ. Perspect. 1998, 12, 69–78. [Google Scholar] [CrossRef]
- Giannetti, B.F.; Agostinho, F.; Almeida, C.M.V.B.; Huisingh, D. A review of limitations of GDP and alternative indices to monitor human wellbeing and to manage eco-system functionality. J. Clean. Prod. 2015, 87, 11–25. [Google Scholar] [CrossRef]
- Pal, D.; Mita, S.K. Asymmetric oil product pricing in India: Evidence from a multiple threshold nonlinear ARDL model. Econ. Model. 2016, 59, 314–328. [Google Scholar] [CrossRef]
- Petrou, P.; Vandoros, S. Pharmaceutical price comparisons across the European Union and relative affordability in Cyprus. Health Policy Technol. 2016, 5, 350–356. [Google Scholar] [CrossRef]
- Frisch, R. Annual Survey of General Economic Theory: The Problem of Index Numbers. Econometrica 1936, 4, 1–38. [Google Scholar] [CrossRef]
- Theil, H. Best Linear Index Numbers of Prices and Quantities. Econometrica 1960, 28, 464–480. [Google Scholar] [CrossRef]
- Kloek, T.; Theil, H. International Comparisons of Prices and Quantities Consumed. Econometrica 1965, 33, 535–556. [Google Scholar] [CrossRef]
- Gilbert, M. The Problem of Quality Changes and Index Numbers. Mon. Lab. Rev. 1961, 84, 992–997. [Google Scholar]
- Kloek, T.; de Wit, G.M. Best Linear and Best Linear Unbiased Index Numbers. Econometrica 1961, 29, 602–616. [Google Scholar] [CrossRef]
- Jiménez-Sáeza, F.; Zabala-Iturriagagoitia, J.M.; Zofío, J.L.; Castro-Martínez, E. Evaluating research efficiency within National R&D Programmes. Res. Policy 2011, 40, 230–241. [Google Scholar] [CrossRef]
- Juo, J.C.; Fu, T.T.; Yu, M.M.; Lin, Y.H. Non-radial profit performance: An application to Taiwanese banks. Omega 2016, 65, 111–121. [Google Scholar] [CrossRef]
- Gulati, R.; Kumar, S. Assessing the impact of the global financial crisis on the profit efficiency of Indian banks. Econ. Model. 2016, 58, 167–181. [Google Scholar] [CrossRef]
- Lazov, I. Profit management of car rental companies. Eur. J. Oper. Res. 2016, 258, 307–314. [Google Scholar] [CrossRef]
- Pasternack, P. Die Exzellenzinitiative als politisches Programm—Fortsetzung der normalen Forschungsförderung oder Paradigmentwechsel? In Making Excellence—Grundlagen, Praxis und Konsequenzen der Exzelleninitiative; Bloch, R., Keller, A., Lottmann, A., Würmann, C., Eds.; Bertelsmann: Bielefeld, Germany, 2008; pp. 13–36. [Google Scholar]
- Örkcü, H.H.; Balıkçı, C.; Dogan, M.I.; Genç, A. An evaluation of the operational efficiency of Turkish airports using data envelopment analysis and the Malmquist productivity index: 2009–2014 case. Transp. Policy 2016, 48, 92–104. [Google Scholar] [CrossRef]
- Sueyoshi, T.; Goto, M. DEA environmental assessment in time horizon: Radial approach for Malmquist index measurement on petroleum companies. Energy Econ. 2015, 51, 329–345. [Google Scholar] [CrossRef]
- Emrouznejad, A.; Yang, G. A framework for measuring global Malmquist-Luenberger productivity index with CO2 emissions on Chinese manufacturing industries. Energy 2016, 115, 840–856. [Google Scholar] [CrossRef]
- Fandel, G. On the performance of universities in North Rhine-Westphalia, Germany: Government’s redistribution of funds judged using DEA efficiency measures. Eur. J. Oper. Res. 2007, 176, 521–533. [Google Scholar] [CrossRef]
- Johnes, J. Data envelopment analysis and its application to the measurement of efficiency in higher education. Econ. Educ. Rev. 2006, 25, 273–288. [Google Scholar] [CrossRef]
- Fuentes, R.; Fuster, B.; Lillo-Banuls, A. A three-stage DEA model to evaluate learning-teaching technical efficiency: Key performance indicators and contextual variables. Expert Syst. Appl. 2016, 48, 89–99. [Google Scholar] [CrossRef]
- Alsabawy, A.Y.; Cater-Steel, A.; Soar, J. Determinants of perceived usefulness of e-learning systems. Comput. Hum. Behav. 2016, 64, 843–858. [Google Scholar] [CrossRef]
- Chang, V. E-learning for academia and industry. Int. J. Inf. Manag. 2016, 36, 476–485. [Google Scholar] [CrossRef]
- Tiemann, O.; Schreyögg, J. Effects of Ownership on Hospital Efficiency in Germany. Bus. Res. 2009, 2, 115–145. [Google Scholar] [CrossRef]
- Harlacher, D.; Reihlen, M. Governance of professional service firms: A configurational approach. Bus. Res. 2014, 7, 125–160. [Google Scholar] [CrossRef]
- Bottomley, A.; Dunworth, J. Rate of return analysis and economies of scale in higher education. Socio-Econ. Plan. Sci. 1974, 8, 273–280. [Google Scholar] [CrossRef]
- Bornmann, L. Peer Review and Bibliometric: Potentials and Problems. In University Rankings—Theoretical Basis, Methodology and Impacts on Global Higher Education; Shin, J.C., Toutkoushian, R.K., Teichler, U., Eds.; Springer: Dordrecht, The Netherlands, 2011; pp. 145–164. [Google Scholar]
- Osterloh, M.; Frey, B.S. Academic Rankings between the Republic of Science and New Public Management. In The Economics of Economists; Lanteri, A., Fromen, J., Eds.; Cambridge University Press: Cambridge, UK, 2014; pp. 77–78. [Google Scholar]
- Harmann, G. Competitors of Rankings: New Directions in Quality Assurance and Accountability. In University Rankings—Theoretical Basis, Methodology and Impacts on Global Higher Education; Shin, J.C., Toutkoushian, R.K., Teichler, U., Eds.; Springer: Dordrecht, The Netherlands, 2011; pp. 35–53. [Google Scholar]
- Eisend, M. Is VHB-JOURQUAL2 a Good Measure of Scientific Quality? Assessing the Validity of the Major Business Journal Ranking in German-Speaking Countries. Bus. Res. 2011, 4, 241–274. [Google Scholar] [CrossRef]
- Lorenz, D.; Löffler, A. Robustness of personal rankings: The Handelsblatt example. Bus. Res. 2015, 8, 189–212. [Google Scholar] [CrossRef]
- Schrader, U.; Hennig-Thurau, T. VHB-JOURQUAL2: Method, Results, and Implications of the German Academic Association for Business Research’s Journal Ranking. Bus. Res. 2009, 2, 180–204. [Google Scholar] [CrossRef]
- Blackmore, P. Universities Face a Choice between Prestige and Efficiency, 5 April 2016. Available online: https://www.timeshighereducation.com/blog/universities-face-choice-between-prestige-and-efficiency (accessed on 12 April 2018).
- Destatis. Education and Culture—University Finances, 11(4.5) Bildung und Kultur, Finanzen der Hochschulen, Fachserie 11, Reihe 4.5; Statistisches Bundesamt: Wiesbaden, Germany, 2014. [Google Scholar]
- Abramo, G.; Cicero, T.; D’Angelo, C.A. A sensitivity analysis of researchers’ productivity rankings to the time of citation observation. J. Informetr. 2012, 6, 192–201. [Google Scholar] [CrossRef]
- Baruffaldi, S.H.; Landoni, P. Return mobility and scientific productivity of researchers working abroad: The role of home country linkages. Res. Policy 2012, 41, 1655–1665. [Google Scholar] [CrossRef]
- Beaudry, C.; Larivière, V. Which gender gap? Factors affecting researchers’ scientific impact in science and medicine. Res. Policy 2016, 45, 1790–1817. [Google Scholar] [CrossRef]
- Fedderke, J.W.; Goldschmidt, M. Does massive funding support of researchers work: Evaluating the impact of the South African research chair funding initiative. Res. Policy 2015, 44, 467–482. [Google Scholar] [CrossRef]
© 2018 by the author. Licensee MDPI, Basel, Switzerland. This article is an open access article distributed under the terms and conditions of the Creative Commons Attribution (CC BY) license (http://creativecommons.org/licenses/by/4.0/).