Abstract
Agriculture is the primary sector sustaining the Indonesian economy. However, appropriate policies are also required to support the service sector. Therefore, this study aims to analyze two central policies: the impact of trade openness and the role of the service sector on agriculture and agro-industry in Indonesia. A Computable General Equilibrium (CGE) model with 2016 input–output tables cover 141 regions and 65 sectors based on the Global Trade Analysis Project (GTAP) Version 10 database. The results show that trade openness in the services sector significantly improves the performance and quality of service provision. The improved performance of the services sector will, in turn, encourage increased production in the agricultural and agro-industrial sectors, which rely heavily on service inputs in the production process. This suggests that trade openness in the services sector is important to sustain the performance of the agricultural sector.
1. Introduction
The agricultural sector is an important pillar in the Indonesian economy, not only as the primary source of employment for a large proportion of the population but also as a driver of improved social welfare (Sayifullah & Emmalian, 2018; Siregar et al., 2024). Despite ongoing industrialization, Indonesia is still classified as an agrarian country, indicating that its overall development depends heavily on agriculture (Kusumaningrum, 2019). For Indonesia, which has a large population, the agricultural sector has a strategic and diverse role in ensuring national food security and nutrition (Mukhlis & Gurcam, 2022) while contributing to poverty alleviation (Sulistyowati & Yuliyadi, 2019). Therefore, agriculture is an inseparable component of economic stability, growth, and development.
The agricultural sector plays a strategic role in the Indonesian economy, not only as a major contributor to the Gross Domestic Product (GDP) but also as a provider of employment and a pillar of national food security. By 2023, the agricultural sector will contribute around 13.7% to the total national GDP while absorbing around 30% of the total Indonesian workforce (Statistics Indonesia, 2025). This significance is further reinforced by the latest data in the first quarter of 2025, where the agricultural sector’s contribution to GDP by the business sector was recorded at 10.52%, the highest figure in the history of national statistics (Statistics Indonesia, 2025). This increase reflects the effectiveness of policies that support domestic production while affirming the role of agriculture as the sector with the highest labor absorption rate, at 28.54% of the national labor force. These findings suggest that the agricultural sector remains an important foundation for Indonesia’s economic and social stability.
According to the Ministry of Agriculture (2022), the agricultural sector has comparative and competitive advantages in producing high-value commodities in high demand in international markets and as raw materials for domestic industries. In international trade, Indonesia’s agricultural exports have a significant global performance, especially in plantation commodities (e.g., palm oil, cocoa, coffee, tea, etc.). In 2022, Indonesia’s agricultural exports reached USD 51,842.11 million, an increase of 5.39% compared to the previous year (UN Comtrade, 2024). In the same year, Indonesia exported USD 9801.76 million worth of agricultural products to China, making it the top export destination with a share of 18.91%, followed by India (11.35%) and the United States (11.33%) (UN Comtrade, 2024). This underscores the strategic role of agriculture in the Indonesian economy, which must be aligned with national development priorities. One of the eight main missions of Nawacita focuses on advancing downstream industries and industrialization to drive domestic value-added creation (Bappenas, 2024). The agricultural sector needs to boost production and productivity to fulfill the food supply and supply raw materials for industry. Increasing the production and productivity of the agricultural sector cannot be separated from the role of the service sector. Servicification has emerged as a key strategy to improve agricultural productivity and global competitiveness (Widodo, 2020).
The services sector can function as a direct lever through its contribution to national output or as an indirect catalyst through second-order productivity effects in the agricultural sector (Khanna, 2016). Due to the inter-sectoral causality effect, the agricultural sector can be optimized by leveraging the services sector (Tekilu et al., 2018; Degu, 2019). Prasetyo et al. (2023) highlighted countries such as Japan, the United States, and Australia, calling for increased service provision in logistics, certification, and technical support to fulfill country-specific market regulations. The services sector not only facilitates more efficient trade relations such as transport services (sea, air, and land), logistics and supply chain, distribution services, financial services, and telecommunication services but also ensures that Indonesian products can compete in highly regulated markets, which will ultimately benefit exporters and consumers. Research and Development (R&D) services that provide services for certification of agricultural products have an important role to play.
Several previous studies suggest that global certification requirements for sustainability, sanitary and phytosanitary (SPS) requirements, and Technical Barriers to Trade (TBT), including packaging and labeling of agricultural products, are significant barriers for agricultural producers, increasing trade costs (Makita, 2016; Lee et al., 2020; Y. Chen et al., 2024). The use of digital technologies generated by the R&D services sector drives efficiency and productivity in the agricultural sector, such as using soil and weather sensors. Soil and weather sensors allow farmers and agricultural practitioners to monitor and collect real-time data on environmental conditions at the farming site. The data obtained from these sensors can provide deep insights into soil moisture levels, pH, nutrients, air temperature, air humidity, rainfall, and wind speed. With this accurate and continuous monitoring, farmers can make more intelligent and timely decisions in crop growth management. Given the role of the service sector in improving the performance of the agricultural sector, the availability of service sector services at competitive prices is essential.
Referring to the term servicification by Elms and Low (2013), ‘The large proportion of services inputs used in manufacturing production is described as ‘servicification of manufacturing,’ servicification in this study will be used in the context of services used as inputs to the agricultural and agroindustry sector. The increasing role of services in the agricultural sector is inseparable from the availability of services at competitive prices. Based on the latest Input–output Indonesia, most service sectors have limited availability (excess demand), such as telecommunication services, computer and information consulting services, financial and bank services, insurance services, other financial institution services, scientific and technical professional services, rental and business support services. One strategy to improve services is to increase the degree of openness to foreign service providers. Based on the OECD (2022), the degree of openness of Indonesia’s service sector is very restrictive compared to neighboring countries. The average restriction of Indonesia’s service sector is 0.40, Thailand 0.38, Malaysia and Vietnam 0.31. Indonesia’s service sector trade restriction index is higher than the ASEAN-5 group average of 0.323.
Meanwhile, this condition is very ironic considering that Indonesia has 20 trade cooperation agreements in the services sector, including the WTO, ASEAN, ASEAN + 1, Japan, Chile (ratification process), EFTA, AANZFTA, RCEP, Korea, and UAE. At the same time, those in the negotiation process are 10 (ASEAN India FTA, European Union, ASEAN Canada FTA, ASEAN China FTA, Eurasian Economic Union (EAEU), Turkiye, Canada, Mercosur, Peru, GCC) and 1 in the exploration process, namely ASEAN-EU. Indonesia’s various trade partnerships in the services sector can be utilized to increase the availability of Indonesia’s services sector, which experiences excess demand. The utilization of Indonesia’s service sector trade openness is predicted to increase the production and productivity of the service sector, which will impact the agricultural sector. So far, previous studies have focused more on the impact of service sector openness on increasing service sector productivity (Fu et al., 2023), economic growth (Matto et al., 2007; Papaioannou, 2018) and the manufacturing sector (servicification) (Peng et al., 2022; Taguchi & Lar, 2024; Defever et al., 2022; Hing & Thangavelu, 2023). In the case of Indonesia, research on the impact of service sector openness on the manufacturing sector (Hing & Thangavelu, 2023). Thangavelu et al. (2018), using a gravity model, found that liberalization of Indonesia’s services sector would reduce trade costs by 26% (percentage of import value). The novelty of this study is that first, it assesses the impact of services trade openness on Indonesia’s agricultural sector and macroeconomy.
Sheperd and Marel (2010) highlight the difficulty of quantifying the impact of policies on trade in services due to the rarity of transparent ad valorem measures, such as tariffs. They used the trade cost approach to calculate the restriction index in the services sector, reflecting the significant regulatory barriers present. Widyastutik (2016) analyzed Indonesia’s maritime transport services, focusing on regulatory challenges and infrastructure bottlenecks. Widyastutik (2020) applied this methodology to air transport services, identifying key barriers like air service agreements and air traffic regulations, and offering recommendations to improve Indonesia’s global competitiveness. This study measures trade openness by reducing barriers using the OECD STRI Simulator, a tool also used by Aboushady (2022) and Khachaturian and Riker (2017) to assess non-tariff barriers in services. Additionally, it introduces a general equilibrium model by linking the Global Trade Analysis Project (GTAP) model with the Computable General Equilibrium (CGE) model, providing a more comprehensive analysis than previous partial equilibrium models and allowing a detailed evaluation of how trade liberalization and servicification impact Indonesia’s economy.
Using a general equilibrium model aligns with the idea that the interaction between economic actors is complex and challenging to understand with a partial equilibrium model, so using CGE is considered more appropriate. This general equilibrium approach can analyze the market and interact with each other, involving macroeconomic variables and sectors that must be analyzed together. The CGE model includes the possibility of substitution between factors of production. Thus, if there is a change in the relative price of a factor of production, producers will change the composition of the use of factors of production towards factors of production that are relatively cheaper. The GTAP model includes global transport and investment mobility to explain the impact of policies between countries. The impact of trade openness captured in the GTAP model will affect the relative price of exports and imports. The change in the relative price of exports and imports will be used as a variable to shock in the CGE model.
2. Methodology
2.1. Data
This study applies the linking model between GTAP and CGE to measure the impacts of liberalization and the increasing role of servicification on the agricultural sector in Indonesia. The GTAP model version 10 used in this study consists of 141 regions and 65 sectors (Licensed to the Department of Economics, FEM IPB, Multiple Academic User License No. 9.0-2043). The data in GTAP version 10 are derived from input–output tables with reference years 2004, 2007, 2011, and 2014. Meanwhile, the CGE model in this study uses the 2016 input–output table published by Statistics Indonesia in 2020, which includes 185 sectors. For regional aggregation, this study will use data aggregating Indonesia and partner countries involved in the services trade cooperation, including countries in the Australia-Indonesia Comprehensive Economic Partnership Agreement (IA-CEPA) and the Regional Comprehensive Economic Partnership (RCEP). These countries are (1) Japan, (2) South Korea, (3) New Zealand, (4) the People’s Republic of China, (5) Malaysia, and (6) Thailand.
This study analyzes the liberalization and the impact of the increased role of services in the agricultural sector, which is expected to be achieved through diplomacy and services trade negotiations. One of the primary data sources used is the Services Trade Restrictiveness Index (STRI). The STRI is a measure that refers to discriminatory policies and regulations in the services trade. Quantitative restrictions refer to limitations on the number of providers, particularly those related to minimum requirements in licensing processes for professionals, as well as the absence of regulation in line with equitable access to domestic and foreign services sectors. These regulations may be applied to specific sectors or the entire sector, such as policies on the minimum percentage of domestic workers in foreign-owned companies. The level of restriction varies significantly between developed and developing countries. STRI simulations allow policymakers and experts to explore the impacts of changes in trade policy on the services sector in detail for each action and to compare a specific country with selected other countries in particular sectors.
The National CGE Model will be employed to capture more specific impacts on various sectors of the Indonesian economy. The National CGE model used in this study is based on the ORANI-F model (Horridge, 2003) and INDOF (Oktaviani, 2000). The input–output (IO) table utilized in the national CGE model is Indonesia’s 2016 IO table. The results of trade openness simulations from the GTAP model, which yield changes in export and import prices, will serve as inputs for simulations in the National CGE model (linking the GTAP model with the National CGE model).
2.2. Research Methods
To analyze the impact of liberalization and the increasing role of services (servicification) on the agricultural sector in Indonesia, the General Equilibrium model of the Global Trade Analysis Project (GTAP) is employed. The Global Trade Analysis Project (GTAP) is a multi-country and multi-sector computable general equilibrium (CGE) model used to evaluate the impact of trade policy changes (Hertel & Tsigas, 1997). Hertel (2012) asserts that the general equilibrium model integrates microeconomic and macroeconomic factors. The structural Computable General Equilibrium (CGE) model is built upon the foundations of economic theory (microeconomics), where the behavior of economic agents is specified and detailed in the form of behavioral equations. The CGE model also facilitates the depiction of interactions between agents within a country/region and between countries/regions, allowing for a comprehensive analysis of the economic impacts across sectors and regions.
The Global Trade Analysis Project (GTAP) model provides a robust multi-regional, multi-sectoral CGE framework for assessing the economic consequences of trade policy changes, especially within the agricultural sector (Hertel & Tsigas, 1997). Each GTAP “region” represents a national economy comprising a nested production structure, a single representative household, government, and investment behavior. Production structures rely on primary factors (land, labor, capital, and natural resources) and follow multi-stage processes.
Trade linkages across regions are formalized for goods and services, including cross-border financial intermediation and associated global transport demands. The model assumes constant elasticity of substitution (CES) in aggregating primary factors, which are combined with intermediate goods using a fixed-coefficient Leontief structure. While substitution is restricted among intermediate goods and between intermediates and value-added, the model permits differentiation between domestic and foreign sources of intermediates based on the Armington assumption of imperfect substitutability (Armington, 1969).
Intra-regional mobility is allowed for capital and labor, facilitating reallocation across sectors, whereas inter-regional mobility is constrained in the short run. Employment levels are held constant within regions, and labor market equilibrium is maintained via wage rate adjustments. Meanwhile, final demand allocation is governed by a regional representative who distributes income from factor earnings and net taxes across private consumption, savings, and public expenditure. The model uses a Cobb–Douglas specification for government demand and a constant difference in elasticity (CDE) functional form for private household preferences. While physical capital does not move internationally in the short run, long-term inter-regional investment flows are possible through savings reallocations, enabling global capital market integration over time.
In the GTAP model, the Armington elasticity captures how easily consumers or producers substitute domestic goods for imported (or inter-origin) goods when relative prices change. One of the GTAP model’s assumptions is that imported and domestic goods are not perfect substitutes (different even if they are of the same type, e.g., local vs. imported rice). Consumers/economic actors differentiate goods based on their country of origin. Therefore, the Armington elasticity can be used to measure sensitivity, specifically the sensitivity of demand to changes in the relative price between domestic and imported goods. In detail, Armington elasticity serves to (a) measure how responsive import demand is to changes in relative prices, (b) determine the magnitude of changes in consumption patterns or production inputs due to changes in tariffs, subsidies, or trade barriers. (3) In simulations, the higher the Armington elasticity value, the more sensitive consumers are to prices, meaning that they are more likely to switch to imported goods if domestic prices rise. A previous study employing the agricultural sector of the GTAP was conducted by Rifin et al. (2020) and CGE about impact of biodiesel policy was conducted by Sahara et al. (2022). On the other hand, Nugroho et al. (2021) using GTAP Recursive Dynamic and the Indonesia family life survey (IFLS) accessing impact trade war on poverty in Indonesia periode 2018–2020.
In this study, the potential impact of trade liberalization and the increased role of the services sector in agriculture servicification will be analyzed via a steps approach, covering (i) estimating the magnitude of services trade barrier reductions and (ii) linking of the GTAP model and national CGE model. A previous study employing the linking of the GTAP and CGE models was conducted by Zhang and Diao (2020) to measure and analyze the impacts of economic structural changes on the agricultural sector. Similarly, Delzeit et al. (2020) used the linking model to analyze and measure economic policies, particularly in addressing complex global issues affecting economic growth. Based on prior studies, the linking model between CGE and sectoral models can capture the complex interactions between sectors and countries, offering more detailed insights into the analysis of specific sectors. Therefore, applying the linking model between GTAP and CGE is highly relevant in this study to measure and identify the impacts of trade liberalization and the increasing role of servicification on Indonesia’s agricultural sector.
Accurately measuring the restrictiveness of non-tariff measures (NTMs) in service sectors remains a significant methodological challenge, primarily due to the lack of comprehensive and reliable data on bilateral services trade flow and regulatory measures. While most of the studies estimating ad valorem equivalents (AVEs) of regulatory trade barriers used a quantity-based approach with augmented gravity models, this study adopted Fontagne et al. (2016) and Benz and Jaax (2022) by utilizing OECD Services Trade Restrictiveness Index (STRI) data. Further improvements are made to capture the existing schedule of commitments of Indonesia and its CEPA partners. Therefore, the trade liberalization scenario in this study is reflected by reducing trade barriers based on a specific schedule of commitments (SoC) using the OECD STRI Simulator. Several researchers have utilized the STRI simulator approach to measure trade barriers in the services sector, including studies conducted by Aboushady (2022) and Khachaturian and Riker (2017). In this context, the OECD STRI simulator addresses the challenges of quantifying regulatory measures in the services trade. This study phase will assess Indonesia’s level of commitment in various trade negotiation fora, explicitly referring to the RCEP and IACEPA scenarios. The underlying rationale of the CEPA selection is that RCEP and IACEPA modalities are considered the most progressive regarding liberalization commitments. Through this analysis, the study aims to gauge Indonesia’s progress and engagement in liberalizing services trade under these agreements.
To measure the impact of services trade liberalization on the increased role of services in the agricultural services sector, the next step is to estimate the magnitude of the shock, which is the change in the value of Indonesia’s services trade, both exports and imports. The model specification used is
This equation indicates that services imports are influenced by regulations represented by the STRI and other indicators as determinants of trade, which are represented as control variables. The trade determinants in this model are based on gravity model indicators such as the size of the economy, population, and other indicators like exchange rates. The subscript i represents the services trade sector, the subscript r represents countries, and k is the index for trade determinants. The coefficient on the STRI is interpreted as the elasticity of trade. In other words, it represents the percentage change in trade value due to changes in trade barriers as represented by the STRI (binding overhang). The magnitude of the changes in Indonesia’s services imports and exports will be used as shocks in the national CGE model.
A linking model between GTAP and CGE will be employed to analyze the potential impacts of trade liberalization and the increasing role of services in agriculture. In the global computable general equilibrium (CGE) framework, trade liberalization is modeled by implementing service barrier reductions in respective countries. This exercise yields a counterfactual global equilibrium reflected by changing world prices and adjusted service barrier structures in Indonesia and partner countries. The changes in world prices are then treated as exogenous shocks within the national CGE model. Using a “small country” assumption, producers and consumers will adjust to changes in import and export prices. Import demand will increase as the import prices become more competitive and export supply contracts due to rising export prices, and vice versa. This approach of linking global and national models to analyze trade liberalization effects is also established in the literature, with applications by Huff et al. (1995) and Oktaviani (2000).
The reduction in trade barriers represents trade liberalization. The tool used to calculate the reduction in trade barriers is the OECD STRI Simulator. Using the OECD STRI Simulator helps address the challenge of measuring tariff levels in services trade. At this stage, the extent of Indonesia’s commitment to various services trade negotiation forums (referring to RCEP and IACEPA scenarios) will be assessed by reducing services trade barriers. This study will apply three scenarios to analyze trade openness and the servicification of the services sector within Indonesia’s agricultural sector. The simulation scenarios are as follows:
- Simulation 1: Indonesia’s trade openness in services.
- Simulation 2: A combination of trade openness in services and increased productivity within the services sector.
- Simulation 3: A combination of trade openness in services, increased productivity in the services sector, and enhanced services sector involvement in agriculture.
3. Results
3.1. The Impact of Trade Openness and Increased Role of Servification Towards Macroeconomic Indicators
The impact of trade openness and the role of services on the agricultural sector is related to the transmission shown through direct and indirect service sector linkages and forward and backward linkages with the agricultural and agroindustry sectors. The openness variable and the increasing role of services further affect the output sector (agriculture and agroindustry). Further, it affects macroeconomic variables such as Gross Domestic Product (GDP), Consumption, Investment, Export, Inflation, and Balance of Trade/GDP. Based on the latest input–output (IO) data published by BPS in 2016, the following is an overview of the direct and indirect forward and backward linkages of the services sector to the agricultural sector (six groups, namely food crops, horticulture, plantations, forestry, fisheries, and livestock) and agroindustry (namely the agroindustry of livestock, horticulture, food crops, plantations, forestry, animal and vegetable oils, and other agroindustries).
Backward Direct and Indirect Linkages (KLTLB) show how an increase in final demand in the services sector will affect its upstream sectors, especially those in the agriculture sector. Based on its aggregate value, food and beverage services have the most considerable KLTB value in the agricultural sector. The KLTB value is 0.3171, which means that if there is an increase in final demand of Rp 1,000,000 in the food and beverage services sector, the service sector requires additional inputs from the agricultural sector of Rp 317,100. The total value of input requirements is Rp 92,400 from the food crop sector, Rp 51,900 from the horticulture sector, Rp 38,900 from the plantation sector, Rp 62,500 from the livestock sector, Rp 900 from the forestry sector, and Rp 70,300 from the fisheries sector. The sectors with the largest KTLB in agriculture are sea transport, agriculture, forestry, aquaculture, air, river, lake, and ferry.
Based on its aggregate value, food and beverage services again have the most considerable KLTB value in the agricultural sector. The KLTB value is 0.2554, which means that if there is an increase in final demand of Rp 1,000,000 in the food and beverage services sector, the service sector requires additional inputs from the agricultural industry sector of Rp 255,400. The total value of input requirements is Rp 52,300 from the livestock agroindustry sector, Rp 7600 from the horticulture agroindustry sector, Rp 98,400 from the crop agroindustry sector, Rp 26,500 from the plantation agroindustry sector, Rp 6200 from the forestry agroindustry sector, Rp 44,000 from the animal and vegetable oil agroindustry sector, and Rp 20,400 from other agroindustry sectors. The sectors with the largest KTLB in agriculture are river, lake, and ferry transport services; professional, scientific, and technical services; agriculture, forestry, and fisheries services; and sea transport services and computer and information technology consulting services.
Direct and Indirect Linkages Forward (KLTD) shows how an increase in final demand in the services sector will affect its downstream sectors, in this case, the agricultural sector sectors. Based on its aggregate value, trade services other than cars and motorcycles have the most considerable KLTD value in the agricultural sector. Other than cars and motorcycles, the trade services sector is the primary contributor because the service products incorporated include wholesale and retail trade services for agricultural raw materials, live animals, processed agricultural products, and food and beverage products. In terms of marketing and selling food crop products, business actors in the food crop sector will need trade services. The KLTD value of the trade sector other than cars and motorbikes is 1.0130. Therefore, if there is an increase in final demand of Rp 1,000,000 in this service sector, the total increase in output from this sector allocated as input to the agricultural sector is Rp 1,013,000. Total increase in output value will be allocated Rp 192,800 to the food crop sector, Rp 152,500 to the horticulture sector, Rp 307,200 to the plantation sector, Rp 251,900 to the livestock sector, Rp 26,600 to the forestry sector, and Rp 82,100 to the livestock sector. The sectors with the largest KLTLD in the agriculture sector are the banking financial services sector, the agriculture, forestry, and fisheries services sector, the rental and business support services sector, and the land transport services sector other than rail transport. The rail transport services sector has the lowest KLTD.
Based on its aggregate value, trade services other than cars and motorcycles also have the most considerable KLTD value in the agricultural sector. The KLTD value is 3.5851, where if there is an increase in final demand of Rp 1,000,000 in the service sector, the increase in output of the trade services sector other than cars and motorcycles allocated as input to the agricultural industry sector is Rp 3,585,100. The increase in output will be allocated by IDR 429,200 to the livestock agroindustry sector, IDR 116,500 to the horticulture agroindustry sector, IDR 139,700 to the food crop agroindustry sector, IDR 1,169,900 to the plantation agroindustry sector, IDR 713,700 to the forestry agroindustry sector, IDR 26,800 to the animal and vegetable oil agroindustry sector, and IDR 989,400 to other agroindustry sectors. The sectors with the largest KTLD in the agriculture sector are the banking financial services sector, the land transport services sector other than rail transport, the rental and business support services sector, and the telecommunication services sector. Meanwhile, the rail transport service sector has the lowest KLTD value.
Increased trade openness is expected to increase the availability of services, improving services in sectors that use services as inputs, such as agriculture and agroindustry, as well as final demand. This study assesses trade openness as an implication of Indonesia’s trade cooperation in services. For this reason, a simulation of reducing trade barriers in services is carried out under business-as-usual conditions. Simulating the reduction in trade barriers is important because of the high level of Indonesia’s trade barriers as proxied by Indonesia’s STRI (Services Trade Restriction Index) compared to peer countries. Compared to OECD peer countries, legal services, accounting, distribution, telecommunications, and maritime transport are the five service sectors with high STRI (Figure 1).
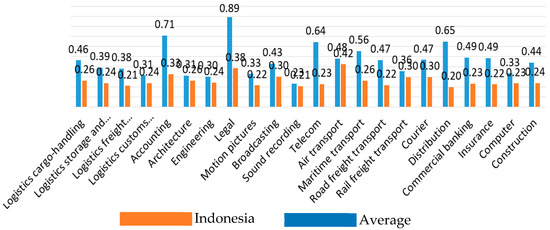
Figure 1.
STRI Indonesia compared to peer countries, 2019.
Trade openness implies a reduction in trade barriers and regulatory reforms, thereby reducing trade costs in the services sector. This improves resource allocation through specialization with comparative advantage and has significant knock-on effects on the economy. Khanna (2016) found that the service sector can act as a leverage sector directly through the contribution of the service sector to the formation of national output, as well as indirectly (induced effect) through second-order productivity in the agricultural sector, especially in the era of Industry 4.0 and Society 5.0. As an illustration, servification in the agriculture sector totals 22.37%. Plantations and Horticulture tend to use service inputs more (servicification). The variation in servicification within the agriculture subsector shows its characteristics. The increasing role of the service sector in agriculture and agro-industry aligns with the concept of the smile curve in the Global Value Chain (GVC). The service sector is present in the form of R&D, branding, and design in various agricultural and agro-industrial commodities, which are distributed to the agricultural input user sector and final demand. The presence of this service sector provides higher added value and thus contributes to the formation of national output. In the Global Value Chain (GVC), countries that can master R&D, Branding, and Design will achieve a potential added value of 40% and production by 20%. Meanwhile, distribution, marketing, and sales/after-service will achieve 40% of the potential added value.
In Sim 1, trade openness in services gives the agricultural sector and industries that process agricultural products the choice to use domestic and/or foreign services. The increase in services leads to an increase in the output of the agricultural and agro-industry sectors that use service sector inputs, resulting in a 0.064 percent increase in GDP and a 0.02% decrease in inflation. The highest contribution to the increase in GDP came from consumption by 0.10 percent, investment by 0.06 percent, government spending by 0.009 percent, and exports by 0.006 percent. Trade openness is predicted to increase the output of the agricultural and agro-industry sectors, thus encouraging an increase in household consumption by 0.10 percent. Food availability is expected to increase along with the expansion of services in the country. According to the Ministry of Agriculture (2024), Indonesian households’ average monthly per capita expenditure in 2023 is IDR 1,451,870, with IDR 711,282 (48.98%) allocated to food. The proportion of food expenditure by commodity is as follows: Rice (11.30%), fish (8.14%), vegetables (8.03%), eggs and milk (5.27%), meat (5.01%), fruits 4.57%, beverages (2.86%), oils and fats (2.64%), herbs (2.12%), nuts (2.09%), other consumption (1.95%), and um-bi-roots (1.26%.) Rice is the largest commodity in food expenditure per household. Rice is the commodity with the largest share in food expenditure per household.
Free trade in services will provide incentives for investors, resulting in increased investment. Investment is estimated to increase due to Indonesia’s trade openness in the services sector by 0.06%. Trade openness in the services sector provides opportunities for the services sector to access international markets, thereby increasing services exports. Meanwhile, trade openness also improves domestic services, fuelling growth in other sectors, including agriculture and agro-industry, resulting in higher export growth, which leads to a favorable trade/GDP balance ratio, increasing by 0.01%.
The combination of simulated trade openness and improved sector productivity provides a larger leveraging effect, as shown in Table 1. Indonesia’s real GDP is estimated to increase by 2.01%, with a larger increase in agricultural labor productivity. As with Simulation 1, in Simulations 2 and 3, household consumption experiences the highest increase, leading to an increase in inflation of less than 1%. Other macro variables that experience increases are government spending, investment, and exports. Increased openness, service sector productivity, and the role of the service sector (such as R&D services, telecommunications, transport and logistics, distribution, finance, e-commerce, etc.) will increase the adoption of various technologies in the agricultural and agro-industry sectors, thereby increasing production and contributing to higher real GDP growth.

Table 1.
Impact of trade and services openness on Indonesia’s macroeconomic indicators.
In Simulations 2 and 3, trade openness accompanied by increased productivity and service sector involvement in the agricultural sector will encourage increased imports so that the trade balance experiences a deficit. However, the value is relatively small (less than 0.5% of GDP). The deficit occurs because of trade openness, increased productivity, and the role of services in the agricultural sector encourage an increase in foreign services and raw, auxiliary, and capital materials sourced from imports.
3.2. The Impact of Trade Openness and Value-Added Services (Servification) on Indonesian Sectors
The “winning sectors” that benefit from the impact of trade openness and servicification on agricultural output are fruits, vegetables, and coconuts, which show a higher contribution to services than the average agricultural sector. The incremental effect of output in scenarios that combine trade openness, increased value-added, and agricultural labor productivity provides a higher incentive for resource reallocation to the agricultural sector. Simulation 3 shows the highest increase in output in the Coconut (8.18%), Fruits (8.06%), and Vegetables (7.24%) sectors, as shown in Table 2.
Table 2.
The impact of services trade openness, value added, and labor productivity on the agricultural sector.
The coconut sector responds with the highest increase in output. This is in line with the relatively high contribution of coconut and its derivatives to Indonesia’s GDP in 2023, which is 4.89%. In order to downstream coconut, the Indonesian government is collaborating on research and innovation to encourage the coconut processing industry. Coconut oil is the dominant coconut derivative product in Indonesia. With increased R&D, especially the discovery of superior coconut seeds, Indonesia can increase the availability of whole coconuts to produce coconut milk, nata de coco, coconut shell charcoal, activated carbon, and coir fiber. In addition to R&D, telecommunication services in the form of improved internet access for coconut are expected to support the provision of supply chain information in 16 provinces in Indonesia. Coconut centers and agro-industries are not located in the same region. Therefore, increasing the efficiency of the domestic supply chain supported by logistics efficiency is needed. Trade openness, increased value-added services, and increased labor productivity are important in supporting the down streaming of the coconut sector.
One of the flagship programs related to agricultural digitalization is also being implemented by the Ministry of Communication and Information Technology, which involves all relevant stakeholders to create a comprehensive ecosystem in the agricultural sector, from upstream to downstream, including operators, banks, insurance, and off-takers. The program aims to address challenges in the agriculture sector by facilitating the use of appropriate applications to support farmers’ and fish farmers’ businesses, as well as the performance of the agriculture and fisheries sectors.
Target beneficiaries are horticultural farmers with a land area of ≤2 hectares. Educational efforts include assistance in using applications through the ‘Farmers Go Online’ ecosystem, including the Agricultural Extension Application, Stock Control Application, and Agricultural Marketplace Application. In practical terms, the Ministry of Communication and Information Technology also conducted a digitalization program for recording horticultural commodity auctions. This program aims to record auction results, thus encouraging transparency and healthy price competition. Local and central governments can predict demand and formulate policies through digital auction records.
The responsiveness of agro-industry output is lower than that of the agricultural sector in the services trade openness simulation. Some key winning sectors are rice, fish drying, and fruit and vegetable processing. Meanwhile, the sectors that are responsive to the combination of the openness scenario with an increase in value-added and agricultural productivity are the slaughter products and livestock products processing sectors.
The Indonesian government has also developed at least five digitized platforms relevant to farmers. On the supplier side, a technology provider has an information system (an Internet of Things (IoT)-based device attached to a cow’s neck) that can be used to monitor livestock movement, count the number of livestock, create virtual fences, record environmental temperature and livestock health and feeding information (Permani et al., 2021). Processors/slaughterhouses have also started to partially implement digital technology, using tools to put cattle down and use stunning equipment automatically, and carcasses are lifted using hydraulics. Meanwhile, at the off-taker/investment platform level, the storage service sector plays a central role as it helps to collect livestock products and store them as frozen food in the cold chain system. The most significant use of digital technology in this sector is to attract investment (crowdfunding) (Table 3).
Table 3.
The impact of services trade openness, value added, and labor productivity on agroindustry sector.
4. Discussion
The services sector plays an important role in improving the performance of the agricultural and agro-industrial sectors in Indonesia. Trade openness in the services sector positively impacts the economy, including service users being freer to choose the right one and encouraging producers to improve quality and develop technology, information, and management. Spurring orderly business competition and improving good corporate governance, professionals and educated labor will have wider employment opportunities, and the economy will be injected with outside capital. Based on the static approach, trade effects will increase welfare through specialization following comparative advantage so that firms expand. This process leads to efficient allocation of resources and an increase in GDP. Consumers will be better off because of lower prices and greater choice. Likewise, producers who act as exporters can access large markets and high-price incentives. Producers competing with imports will be worse off, but a simple model suggests that aggregate losses are always balanced by aggregate gains (Sheperd & Marel, 2010). Several studies have shown that reducing trade barriers in the service sector, such as transport services, will increase trade volume and vice versa. Limao and Venables (2001) mentioned that an increase in transport costs of more than 10% would reduce trade volume by more than 20%. According to Geloso-Grosso and Shepherd (2009), reducing transaction costs in air transport services trade in APEC member economies encourages an increase in exports of goods. High quality and cost-efficiency in the transport sector improve access of other service providers and manufacturers to foreign markets.
For the agricultural sector, T. Chen et al. (2022) emphasize that agricultural services can significantly improve production efficiency, mainly if supported by a well-functioning agricultural services ecosystem. In addition, agricultural services are critical to realizing the Digitalisation of Agriculture 4.0, which can potentially eradicate poverty in the agricultural sector (Boix-Fayos & de Vente, 2023). In parallel, trade openness is expected to increase knowledge accessibility and attract foreign direct investment (FDI), with specific implications for agricultural development (Soomro et al., 2022). From an international trade perspective, several studies have also assessed the impact of servicification on trade performance.
Rajanayagam (2016) revealed that services, defined as integrating services into international trade, have played an important role in supporting and improving the efficiency of the manufacturing and agricultural sectors. In addition, servicification encourages innovation, improves product quality, and strengthens international relations through more integrated trade in services (Rubalcaba et al., 2016). Countries that can integrate services effectively into global value chains, including Indonesia, tend to show better economic performance. Therefore, increasing trade openness in the services sector can overcome excess demand. The existence of a wide selection of competitive services will have a knock-on effect on improving the performance of the agricultural and agro-industry sectors so that it has an impact on the economy as a whole.
This study found that trade openness, which has implications for reducing trade barriers in the services sector, will increase the availability of services in the country so that it contributes positively to the output of the agricultural and agro-industry sectors, which in turn encourages an increase in macroeconomic indicators such as real GDP, consumption, investment, and exports. According to Borojo and Weimin (2025), increased digitization in trade origin and destination countries is a transformative force in lowering trade costs through various channels. This reduces the need for face-to-face interaction in commercial activities, creating greater flexibility. Digital innovations are also significantly lowering communication costs, with tools such as automated translation services bridging the language gap and reducing cross-border communication’s financial and logistical challenges. In addition, digital technologies are revolutionizing the efficiency of trade in goods by optimizing logistics and customs procedures. Advanced tracking systems and automated operations at ports and airports speed up transit times, while digitized customs processes minimize border delays and bureaucratic obstacles. Similarly, the rise in electronic payment systems and e-commerce platforms has simplified transactions, enabling more cost-effective procurement from international suppliers (Bellucci et al., 2023).
For the processing-level agro-industry (Processed Animal Products) sector, including abattoirs, partial digitalization is evident through automated livestock restraint systems, mechanical stunning devices, and hydraulic carcass lifting equipment reflecting gradual advances in operational efficiency and animal welfare. At the downstream level, buyers and investment platforms, particularly in the cold storage services sector, play a critical role in aggregating livestock products and maintaining their quality through an integrated cold chain system. The most prominent application of digital technology in this segment lies in its use to mobilize investment through crowdfunding platforms, which offer innovative financing mechanisms to strengthen the livestock value chain.
Meanwhile, the role of other service sectors, such as R&D, will encourage the discovery of new varieties in the agricultural sector that are pest-resistant, varieties that are adapted to climate change, packaging, and labeling for agricultural products so that they do not spoil quickly, facilitation to meet sanitary, phytosanitary and Technical Barriers to Trade requirements for agricultural products. Increased production and productivity of the agricultural sector will encourage the availability of inputs for the processing industry, which will increase the agro-industrial sector’s production and productivity. The financial services sector also plays an important role in financing the agricultural and agro-industrial sectors. It facilitates transactions for trade in agricultural and agro-industrial products domestically and abroad. Countries with higher levels of financial development tend to specialize in industries more dependent on external financing than those with weak financial sectors, assuming other factors remain constant (Beck, 2002; Do & Levchenko, 2007). Liberalization in the financial services sector helps improve the ability of businesses to finance investments in agriculture and agro-industries that have comparative advantage potential for the country, especially in middle-income countries. Labor-intensive industries are generally highly dependent on external financing, and limited access to credit can be a serious obstacle to leveraging comparative advantage in relatively labor-rich countries. This aligns with Nordas (2008) findings for the manufacturing sector.
5. Conclusions
The study concludes that trade liberalization in the services sector significantly improves the performance and quality of service provision. The improved performance of the services sector, in turn, has the potential to boost output in the agriculture and agro-industry sectors, which rely heavily on services inputs during their production process. Several services subsectors show strong forward and backward linkages with the agriculture and agro-industry sectors, namely agriculture, forestry, and fisheries services; wholesale and retail trade (excluding motor vehicles and motorcycles); land transport (excluding railways); banking and financial services; rental and business support services; telecommunications; sea transport; ferry and ferry transport services; air transport; and food and beverage services.
Output expansion in the agricultural and agro-industrial sectors driven by increased services inputs contributed positively to Indonesia’s macroeconomy, as indicated by real GDP growth, household consumption, investment, exports, and trade-to-GDP ratio. Simulation 1 represents trade openness in the services sector; there is a potential increase in GDP, consumption, and investment. Simulation 2: There is a significant jump in consumption and GDP by initiating an additional element of productivity improvement in the services sector. This situation indicates that service sector trade openness combined with productivity improvement is the primary driver of growth in the servitisation process. The most significant impact is reflected in Simulation 3, which combines trade openness, increased services productivity, and increased services sector involvement in agriculture. This scenario generates the highest GDP and consumption growth with higher investment and exports than the other scenarios. Increased openness, value added in the services sector, and increased agricultural labor productivity will strengthen the role of services, including adopting various technologies in the agricultural sector, thereby increasing production and contributing to real GDP growth.
In terms of sectors, openness to trade in services increased value-added, and labor productivity in the services sector significantly impacted the output of both agriculture and agro-industry, with the impact increasing with the complexity of the policy intervention. In simulation 1, the impact is still limited to the agriculture and agro-industry sectors. The analysis results also show the same phenomenon as the macroeconomy, where the potential impact on Indonesia’s sectors reaches its highest position in Simulation 3. Commodities such as coconut, fruits, and vegetables experience the highest jump in output. The high contribution of the services sector to specific agricultural co-commodities suggests that the integration of the services sector plays a crucial role in driving agricultural sector productivity and growth. Thus, this result underscores the importance of policies that promote the role of the services sector by utilizing Indonesia’s various service sector trade cooperation schemes to boost Indonesia’s agricultural sector and economic performance.
Author Contributions
Conceptualization, W. and S.A.; methodology, W. and S.A.; software, H.; validation, S.A. and H.; formal analysis, W.; investigation, W. and S.A.; resources, S.A., and H.; data curation, W. and A.R.; writing—original draft preparation, W. and B.S.M.; writing—review and editing, W. and B.S.M.; visualization, W., B.S.M. and S.A.; supervision, W. and A.R.; project administration, B.S.M.; funding acquisition, W. All authors have read and agreed to the published version of the manuscript.
Funding
Corresponding author (W.) pay full of this journal.
Informed Consent Statement
Not applicable.
Data Availability Statement
The data of the present study is unavailable as participants did not provide their permission to share raw data. The covariances matrix and analysis code are available upon request from the first author.
Acknowledgments
This study part of collaborative partnership between International Trade Analysis and Policy Studies (ITAPS), Faculty of Economics and Management, IPB University, and the Directorate of Trade in Services Negotiations, Directorate General of International Trade Negotiations, Ministry of Trade of the Republic of Indonesia.
Conflicts of Interest
The authors declare no conflicts of interest.
References
- Aboushady, N. (2022). Services liberalization and global value chains participation: Evidence from Egypt. International Journal of Economics and Management Sciences (IJEMS), 15(2), 245–279. [Google Scholar]
- Armington, P. S. (1969). A theory of demand for products distinguished by place of production. IMF Staff Papers, 16(1), 159–178. [Google Scholar]
- Bappenas. (2024). The national medium-term development plan for 2020–2024: Appendix Presidential Regulation No. 18 of 2020. Ministry of National Development Planning (Bappenas). Available online: https://www.bappenas.go.id (accessed on 1 November 2024).
- Beck, T. (2002). Financial Development and International Trade: Is There a Link? Journal of International Economics, 57(1), 107–131. [Google Scholar] [CrossRef]
- Bellucci, C., Rubínová, S., & Piermartini, R. (2023). Better together: How digital connectivity and regulation reduce trade costs (ERSD Staff Working Paper 07). World Trade Organization. [Google Scholar]
- Benz, S., & Jaax, A. (2022). The costs of regulatory barriers to trade in services: New estimates of ad valorem tariff equivalents. Economics Letters, 212, 110057. [Google Scholar] [CrossRef]
- Boix-Fayos, C., & de Vente, J. (2023). Challenges and potential pathways towards sustainable agriculture within the European Green Deal. Agricultural Systems, 207, 103634. [Google Scholar]
- Borojo, D. G., & Weimin, H. (2025). From Click to Cargo: The Role of Digitalization, Cross-Border E-Commerce, and Logistics in Deepening the China–Africa Trade. Economies, 13(6), 171. [Google Scholar]
- Chen, T., Rizwan, M., & Abbas, A. (2022). Exploring the role of agricultural services in production efficiency in Chinese agriculture: A case of the socialized agricultural service system. Land, 11(3), 347. [Google Scholar] [CrossRef]
- Chen, Y., Fiankor, D. D. D., & Tan, F. (2024). Assessing the effect of the Round Table on Responsible Soy certification on soybean exports. The World Economy, 47(7), 2970–2994. [Google Scholar]
- Defever, F., Michele, I., & Richard, K. (2022). Trade liberalization, input intermediaries and firm productivity: Evidence from China. Journal of International Economics, 126(1), 103329. [Google Scholar] [CrossRef]
- Degu, A. A. (2019). The causal linkage between agriculture, industry and service sectors in Ethiopian economy. American Journal of Theoretical and Applied Business, 5(3), 59–76. [Google Scholar]
- Delzeit, R., Beach, R., Bibas, R., Britz, W., Chateau, J., Freund, F., Lefevre, J., Schuenemann, F., Sulser, T., Valin, H., van Ruijven, B., Weitzel, M., Willenbockel, D., & Wojtowicz, K. (2020). Linking global CGE models with sectoral models to generate baseline scenarios: Approaches, challenges, and opportunities. Journal of Global Economic Analysis, 5(1), 162–195. [Google Scholar]
- Do, Q. T., & Levchenko, A. A. (2007). Comparative advantage, demand for external finance, and financial development. Journal of Financial Economics, 86(3), 796–834. [Google Scholar]
- Elms, D. K., & Low, P. (Eds.). (2013). Global value chains in a changing world. World Trade Organization. ISBN 978-92-870-3882-1. Available online: https://www.wto.org/english/res_e/booksp_e/aid4tradeglobalvalue13_intro_e.pdf (accessed on 1 November 2024).
- Fontagne, L., Mitaritonna, C. E., & Signoret, J. E. (2016). Estimated tariff equivalents of services NTMs. CEPII working paper. Available online: https://hal.science/hal-01476543/ (accessed on 1 November 2024).
- Fu, X., Wang, T., & Yang, H. (2023). Does service trade liberalization promote service productivity? Evidence from China. Sustainability, 15(8), 6440. [Google Scholar] [CrossRef]
- Geloso-Grosso, M., & Shepherd, B. (2009). Liberalizing air cargo services in APEC. MPRA Paper. Available online: http://mpra.ub.uni-muenchen.de/17781/ (accessed on 1 November 2024).
- Hertel, T. W. (2012). Global applied general equilibrium analysis using the GTAP framework; chapter 12. In P. Dixon, & D. Jorgenson (Eds.), The handbook of computable general equilibrium modeling (Vol. 1B). Handbook of Economics Series. Elsevier Publishers. [Google Scholar]
- Hertel, T. W., & Tsigas, M. E. (1997). Structure of GTAP. In T. W. Hertel (Ed.), Global trade analysis: Modeling and applications (pp. 13–73). Cambridge University Press. [Google Scholar]
- Hing, V., & Thangavelu, S. M. (2023). Does servicification enhance firm productivity? Evidence from Indonesia. Journal of Southeast Asian Economies, 40(3), 299–317. [Google Scholar] [CrossRef]
- Horridge, M. (2003). ORANI-G: A generic single-country computable general equilibrium model. Centre of Policy Studies and Impact Project, Monash University, Australia. [Google Scholar]
- Huff, K. M., McDougall, R., Pearson, K. R., Powell, A. A. L., & Adams, P. D. (1995). Medium-run consequences for Australia of an APEC free-trade Area: CGE Analyses using the GTAP and MONASH models. Centre of Policy Studies and The IMPACT. [Google Scholar]
- Khachaturian, T., & Riker, D. (2017). The impact of liberalizing international trade in professional services. Journal of International Commerce and Economics, 1. [Google Scholar]
- Khanna, Papadavid, A. P., Tyson, J., & te Velde, D. W. (2016). The role of services in economic transformation—With an application to Kenya. ODI. [Google Scholar]
- Kusumaningrum, S. I. (2019). Utilisation of the agricultural sector to support Indonesia’s economic growth. Jurnal Transaksi, 11(1), 80–88. Available online: https://ejournal.atmajaya.ac.id/index.php/transaksi/article/view/477/283 (accessed on 1 November 2024).
- Lee, J. S. H., Miteva, D. A., Carlson, K. M., Heilmayr, R., & Saif, O. (2020). Does oil palm certification create trade-offs between environment and development in Indonesia? Environmental Research Letters, 15(12), 124064. [Google Scholar]
- Limao, N., & Venables, A. J. (2001). Infrastructure, geographical disadvantage, and transport cost. The World Bank Economic Review, 15(3). Available online: https://hdl.handle.net/10986/17438 (accessed on 1 November 2024).
- Makita, R. (2016). A role of fair trade certification for environmental sustainability. Journal of Agricultural and Environmental Ethics, 29, 185–201. [Google Scholar]
- Matto, H., Miller, K. A., & Spera, C. (2007). Examining the relative importance of social context referents in predicting intention to change substance abuse behavior using the EASE. Addictive Behaviors, 32(9), 1826–1834. [Google Scholar] [CrossRef]
- Ministry of Agriculture. (2022). Agricultural sector performance report 2022. Ministry of Agriculture.
- Ministry of Agriculture. (2024). Macro statistic for agricultural sector 2024. Ministry of Agriculture. Available online: https://satudata.pertanian.go.id/assets/docs/publikasi/Buku_Statistik_Makro_2024.pdf (accessed on 1 November 2024).
- Mukhlis, I., & Gurcam, Ö. S. (2022). The role of agricultural sector in food security and poverty alleviation in Indonesia and Turkey. Asian Journal of Agricultural Extension, Economics and Sociology, 40(11), 430–436. [Google Scholar]
- Nordas, H. K. (2008). The impact of services trade liberalisation on trade in non-agricultural products. OECD Trade Policy Working Paper No. 81. OECD Publishing. [Google Scholar]
- Nugroho, A., Widyastutik, Irawan, T., & Amaliah, S. (2021). Does the US–China trade war increase poverty in a developing country? A dynamic general equilibrium analysis for Indonesia. Economic Analysis and Policy, 71, 279–290. [Google Scholar]
- Oktaviani, R. (2000). The impact of APEC trade liberalization on Indonesian economy and its agricultural sector [Ph.D. Thesis, The Sydney University]. [Google Scholar]
- Organisation for Economic Co-operation and Development (OECD). (2022). Trade facilitation. Available online: https://www.oecd.org/ (accessed on 1 November 2024).
- Papaioannou, S. K. (2018). EU services liberalization and TFP growth: Industry level evidence. Economics Letters, 172, 16–18. [Google Scholar] [CrossRef]
- Peng, S., Shu, Z., & Zhang, W. (2022). Does service trade liberalization relieve manufacturing enterprises’ financial constraints? Evidence from China. Economic Modelling, 106, 105710. [Google Scholar] [CrossRef]
- Permani, R., Sahara, S., Bryceson, K., & Wegener, M. (2021). Digital technology options for Indonesia’s and Australia’s beef and cattle sector. Indonesia Australia Red Meat and Cattle Partnership. The University of Queensland Australia. [Google Scholar]
- Prasetyo, H., Sari, D., & Wibowo, E. (2023). Export Requirements and Servicification in Indonesian Agriculture: Insights from Key Partner Countries. International Journal of Trade and Commerce, 15(2), 78–92. [Google Scholar]
- Rajanayagam, S. (2016). The ‘servicification’ of trade. Research note 2016/4. Ministry of Foreign Affairs and Trade.
- Rifin, A., Feryanto, Herawati, & Harianto. (2020). Assessing the impact of limiting Indonesian palm oil exports to the European Union. Journal of economic structures, 9, 1–13. [Google Scholar]
- Rubalcaba, L., Gago, D., Ariano, M., & Tripathi, A. K. (2016). Services and innovation for the competitiveness of the Ecuadorian economy (WPS7767). World Bank Group. Available online: http://documents.worldbank.org/curated/en/915381469468620713/Servicesand-innovation-for-the-competitiveness-of-the-Ecuadorian-economy (accessed on 1 November 2024).
- Sahara, Dermawan, A., Amaliah, S., Irawan, T., & Dilla, S. (2022). Economic impacts of biodiesel policy in Indonesia: A computable general equilibrium approach. Journal of Economic Structures, 11(1), 22. [Google Scholar] [PubMed]
- Sayifullah, S., & Emmalian, E. (2018). The effect of agricultural labour and government expenditure on agricultural gross domestic product in Indonesia. Jurnal Ekonomi dan Keuangan, 8(1), 4962. [Google Scholar] [CrossRef]
- Sheperd, B., & Van den Marel, E. (2010). Trade in services in the APEC region: Pattern, determinants, and policy implications. APEC Policy Support. [Google Scholar]
- Siregar, A. P., Darwanto, D. H., Mulyo, J. H., Utami, A. W., Pranyoto, A., Perwitasari, H., Wirakusuma, G., Widada, A. W., Fadhliani, Z., & Widjanarko, N. P. A. (2024). The Trend of Agricultural Sector Resilience in Indonesia During 2008–2020. Journal of Agricultural Sciences–Sri Lanka, 19(2), 336–357. [Google Scholar]
- Soomro, A. N., Kumar, J., & Kumari, J. (2022). The dynamic relationship between FDI, ICT, trade openness, and economic growth: Evidence from BRICS countries. The Journal of Asian Finance, Economics and Business, 9(2), 295–303. [Google Scholar]
- Statistics Indonesia. (2025). Indonesia’s economy sustains growth amid global uncertainty. Available online: https://www.bps.go.id/en/news/2025/05/05/703/ekonomi-indonesia-tetap-tumbuh-di-tengah-ketidakpastian-global.html (accessed on 15 June 2025).
- Sulistyowati, L., & Yuliyadi, S. (2019). Factors influencing the level of food security of rice farming households in Patokbesi Sub-district, Subang Regency, West Java. Jurnal Agribest, 3(2), 116–124. [Google Scholar] [CrossRef]
- Taguchi, H., & Lar, N. (2024). Servicification in Global Value Chains in Emerging and Developing Asian Economies. Economies, 12(6), 125. [Google Scholar] [CrossRef]
- Tekilu, T., Wondaferahu, M., & Jibril, H. (2018). The link between financial development and sectoral output growth in Ethiopia: The case of agriculture, industry and service sectors. International Journal of Economics and Management Sciences, 7(5), 1–12. [Google Scholar]
- Thangavelu, S. M., Wang, W., & Oum, S. (2018). Servicification in global value chains: Comparative analysis of selected Asian countries with OECD. World Economy, 41(11), 3045–3070. [Google Scholar] [CrossRef]
- UN Comtrade. (2024). Indonesia’s export growth continues to increase 2022. Foreign Service. (2024). “Indonesia: Long-Term Prospects for U.S. Agricultural Exports.” USDA. Available online: https://comtradeplus.un.org/USDA (accessed on 1 November 2021).
- Widodo, S. (2020). Agricultural transformation through servicification: An indonesian case study. Jurnal Ekonomi Pertanian Indonesia, 45(1), 89–102. [Google Scholar]
- Widyastutik, W. (2016). The Economic Impact of Regulatory Barriers to Trade in Transport Services: The Case of ASEAN and ASEAN’s Dialogue Partner [PhD Thesis, Universitas Indonesia]. [Google Scholar]
- Widyastutik, W. (2020). Trade liberalisation in ASEAN air transport services and ASEAN FTA partners: IC-IRTS CGE model. Buletin Ilmiah Litbang Perdagangan, 14(1), 147–176. [Google Scholar] [CrossRef]
- Zhang, Y., & Diao, X. (2020). The changing role of agriculture with economic structural change—The case of China. China Economic Review, 62, 101504. [Google Scholar] [CrossRef]
Disclaimer/Publisher’s Note: The statements, opinions and data contained in all publications are solely those of the individual author(s) and contributor(s) and not of MDPI and/or the editor(s). MDPI and/or the editor(s) disclaim responsibility for any injury to people or property resulting from any ideas, methods, instructions or products referred to in the content. |
© 2025 by the authors. Licensee MDPI, Basel, Switzerland. This article is an open access article distributed under the terms and conditions of the Creative Commons Attribution (CC BY) license (https://creativecommons.org/licenses/by/4.0/).