Abstract
The purpose of this study is to investigate the potential effects of corporate governance (CG) elements on corporate social responsibility (CSR) disclosure. The annual reports of companies for the year 2007–2011 are examined to analyze the relationship between CG and CSR reporting. It considers the elements of CG such as board size, independent directors, foreign nationalities and women representation in the board, ownership concentration, institutional ownership, firm size and profitability. The multiple regression technique is used to measure the impact of CG elements on companies’ CSR reporting. The results of the study demonstrate that overall CSR reporting by Pakistani companies are rather moderate however, the assortments of CSR items are really impressive. The study found positive and significant impact from board size, institutions ownership, ownership concentration and firm size on CSR reporting. The results also display contrary relationships between the women and foreign director’s representation in the board and CSR reporting. This study suggests that organizations should audit their CG activities related to CSR in order to prove themselves good corporate citizens to all stakeholders.
JEL Classification:
M140; G340
1. Introduction
Corporate Social Responsibility (CSR) is the relationship of a company with society as a whole. It is a growing area of activity for management [1]. CSR is the actions of a corporation to do good for the society beyond the compulsion of the law and the primary objective of corporation which is to perform for the interests of its shareholders [2]. It has been recognized that the people usually face several environmental issues and this has led to environmental related legislation over the years. One prominent corporate response to this enhancement in environmental interest has been the appearance of deliberate environmental disclosures in a corporation’s annual reports. This issue now has become a crucial topic for many researchers, mainly in the last two decades [3]. Therefore CSR has become a significant area under discussion in a corporation’s activities. The relationships of KSE 100 Index companies to society are of great importance because many small companies are following the lead of these large companies. Lack of research in this regard is the main motivation of this study.
Nature and level of CSR disclosure have been the focused area of this study. Most of previous work has been done in developed economies [4]. In comparison, a small number of studies e.g., [5,6] have been conducted on nature, scope and reasons effecting CSR reporting in annual publications of corporations in developing countries. At present, a significant number of corporations are making disclosures about environmental issues in their reports by using other communication channels in both developed and developing countries [7].
It is suggested that CG and CSR are two sides of the same coin as both CSR and CG motivate firms to perform their role towards the goodness of society [8]. Companies which are making contribution towards economic growth have been thought responsible for creating social problems in areas like safety and health, waste management, environmental pro-activeness, product quality and resource depletion [9]. Due to the problems of considering profit as the ultimate indicator to compute company’s performance, in 1970s some accountancy institutions included CSR disclosures in annual reports of company.
CSR is also termed as corporate citizenship and social responsibility (SR). This offers the corporation a competitive edge within the instant market place [10]. McWilliams et al. (2006) [11] describe CSR as “situations where the firm goes beyond compliance and engage in voluntary actions for the society, beyond the interests of the firm and that which is required by law”. The performance of firms should not be evaluated only on a profit basis but also on non-economic criteria [12].
1.1. Why do Firms Engage in CSR?
For more than three decades, CSR has been capturing increasingly the attention of community and firms as they are being held answerable for their actions affecting the society, the community and environment. For this reason, firms are considered as an element of a larger economic system in which their operations might distress the overall system [13]. Society nowadays is putting pressure on companies for their irresponsible actions toward the society and environment that ultimately become a cost to the society [14]. As a result, today CSR and corporate environmental governance practices in business are used to attain a competitive advantage over rivals [9]. CSR has meant that corporations no longer detach themselves from their external environment.
Despite the large amount of literature on CSR, there is no cohesive theory regarding CSR engagement and reporting [15]. There are two different views about its existence. The first based on agency theory [16] and second is on stakeholder theory. According to [17] CSR involvement is a principal agent relationship between top management and stockholders. They argue that top management must have a personal concern in investing in CSR, engaging in activities to gain personal benefit from building reputation as good, socially responsible citizens, perhaps at the cost of stockholders. These over confident top managers occasionally make value destroying investments so the proactive monitoring by using different governance methods should decrease the incentive for over investment in CSR engagement. The secondly view is that, since it may not be easy to convince all associated stakeholders, there is an increasing amount of literature on conflict resolution based on stakeholder theory [18] in which the responsibility of the firm is to safeguard the well-being of other non-investing stakeholders as well. Top management can use helpful governance mechanisms along with CSR engagement for resolution of the conflicts among different stakeholders. If different governance and monitoring methods build CSR involvement as an attempt to reduce possible conflict resolution among the stakeholders, then it is anticipated that there would be an affirmative relationship between CG and CSR practices [19].
1.2. CSR Reporting in Pakistan
The concept of CSR is new for the emerging economies like Pakistan [20]. The concept of CSR in Pakistan is still in its initial stage. Only a small number of firms have a CSR strategy and these are mostly the multinationals that have their own standards regarding CSR. Corporations and the general public are less aware of their rights and responsibilities and firms are taking CSR as a liability instead of a source for long term benefits for the firms and general public [21]. This author further adds that local industry is not aware of the benefits brought by CSR and they think that there is no danger even if they do not adopt such policies.
In Pakistan, most of the CSR work is done in the context of corporate philanthropy. Corporate donations have been considered as a significant tool to improve corporate image in a competitive environment [22]. Almost all companies report their various social activities and concerns like charity, aids, environment protection projects, education, hospitals/health providing services, community/societal betterment programs under the heading of donations in Pakistan and this data is available in their audited financial annual reports. These firms are also taking good care of their employees in order to build their trust and confidence. Consecutively, these social expenditures facilitate the firms in attaining continuous and long term sustainable development as well as in achieving financial benefits [23].
Firms are now more willing to build a positive image for CSR in the minds of stakeholders as compared to just promoting the product line [20]. This particular study is intended to examine the impact of a variety of dimensions of CG (e.g., board directors, non-executive directors, independent directors, institution ownership and ownership concentration) on CSR practices in Pakistan. The research question of this study is as follows:
Do corporate governance attributes have an impact on corporate social responsibility disclosure?
The aim of the study is to find out the impact of corporate governance elements on the CSR reporting in Pakistani companies. The study also explains the extent of CSR reporting in Pakistan.
2. Literature Review
2.1. Theoretical Framework
Finding an appropriate theory is not an easy task for explaining a phenomenon [24]. For this reason, some researchers adapt a multi-theoretical framework to expound the scope and significance of environmental disclosure [25]. Here, we discussed two theories related to CSR, legitimacy theory and social and political cost theory. It has been considered that Legitimacy Theory (LT) is a widely accepted theory to explain CSR reporting practices of a corporation [26]. This theory can be considered as a system-oriented approach that considers firms as a part of a wider social system. Following this point of view, some authors find that firms are affected by the community in which they run their business. Therefore, LT emphasizes ways in which senior corporate management will respond toward community expectations and human resource management [27] and their annual reports support CSR for environmental situations [28].
Social and political cost theory is another explanation for CSR disclosure. A variety of causes increase the political costs which affect top management’s decision regarding the choice of accounting methods [29]. Bigger corporations are more visible in the eyes of the public and consequentially are more politically responsive. This opinion is followed by senior management of larger corporations. Senior managers may report CSR issues in the annual reports as part of a policy to handle or cut the political costs. More responsive corporations prefer accounting methods that are part of this responsibility crusade; therefore it reduces the reported profits to ultimately decrease political costs.
2.2. Corporate Governance Elements and CSR Disclosure
2.2.1. Board Size
The board of directors is very important regarding CG practices of any corporation [30]. Sometimes, the board size informs about the level of disclosure and transparency in corporation. In examining the linkage between board size and CSR reporting, Aktaruddin, Hossain and Yao (2009) [31] report that a large board size means higher CSR disclosure. Whereas Said, Yuserrie and Hasnah (2009) [32] examine a weak relationship between board size and the CSR disclosure. Depending upon the literature, the hypothesis will be as follows:
H1 = All else being equal, companies with larger board tend to have higher degree of CSR reporting.
2.2.2. Independent Directors
Independent directors are defined as the directors who are neither employed by, nor affiliated to the firm in any other way [33]. In the CG perspective, independent directors are likely to carry out an observing function to ensure that the interests of stockholders are taken into consideration while making the board decisions. Still, the association between independent directors and the CSR reporting is vague. A number of past researchers have reported a considerable positive relationship between independent directors and deliberate CSR reporting [34,35]. While others [36,37] observe contradictory results. Depending upon the literature the hypothesis will be as follows:
H2 = All else being equal, companies with higher proportion of independent directors tend to have lower degree of CSR reporting.
2.2.3. Women Directors
From the CG literature, it has been evidenced that diversity of the board has turned into an important component of CG arrangement in recent years. Past research pointed out that board diversity is linked with corporate social reporting and result in high intensity of social performance [38]. Carter et al. [39] supports board diversity and documents that ‘‘it increases board independence for the reason that with a unlike gender ethnicity or cultural background might ask questions that would not appear from directors with more traditional backgrounds”. They further expose experimental proof of a considerable positive association between board diversity in terms of percentage of women on board of directors and firm values. The hypothesis will be as follows:
H3 = All else being equal, companies with higher proportion of women directors tend to have higher degree of CSR reporting.
2.2.4. Foreign Nationals
The research work of Fields and Keys (2003) [40], it reveals that diverse experiences, ideas and innovations resulting from individuals coming from diverse areas, have an influence on a firm’s performance. From the CSR perspective, Haniffa and Cooke (2005) [5] uncover practical support of affirmative relationship between the percentage of Malay directors and the level of voluntary reporting by companies in Malaysia and argue that foreign directors are understood to perform a vital job in sustaining reporting strategies for CSR. Thus based on the above discussed literature, the hypothesis will be as follows:
H4 = All else being equal, companies with higher proportion of foreign nationals on the board tend to have higher degree of CSR reporting.
2.2.5. Ownership Concentration
The previous study of Said, Yuserrie, and Hasnah (2009) [32] report a considerable positive relationship of OC and CSR disclosure in Malaysian public listed companies. This particular work is utilizing the percentage of shares held by the five major stockholders to calculate and posit that concentration of ownership may have impact on CSR reporting in Pakistan.
H5 = All else being equal, companies with higher ownership concentration tend to have higher degree of CSR reporting.
2.2.6. Institutional Ownership
The behavior of investors is represented by institutional ownership and it is measured by the quantity or percentage of shares retained by institutional investors. Various researchers state that institutional investors consider CSR a means of vital information for a specific company when making decisions regarding retaining or releasing of their shares [41]. Cox, Brammer and Millington (2004) [42] examine the institutional ownership pattern in the UK and its link with CSR behavior of firms. They investigate positive relationship between long run institutional investment and the social performance of the companies and conclude that institutional investors will prefer to invest in the shares of firms with good social achievement and release their investment from the companies with poor social performance.
H6 = All else being equal, companies with higher institutional ownership tend to have higher degree of CSR reporting.
2.3. Control Variables
2.3.1. Company Size
Large firms are supposed to have more activities and a greater impact on society. It is a fact that big firms have more shareholders who may have concern about social programs undertaken by the firm [5,32,43,44]. Based on the outcomes of these previous studies, a constructive relation is anticipated between company size measured in terms of sales [45] and CSR disclosure.
H7 = All else being equal, companies with larger size tend to have higher degree of CSR reporting.
2.3.2. Profitability
Socially responsible firms can be anticipated to be highly profitable as these firms have the key success factors [46]. Haniffa and Cooke (2005) [5] and Said et al. (2009) [32] disclose a considerable and constructive association between profitability and the levels of CSR reporting. They argue that profitable firms disclose CSR information to portray their role in the welfare of the community and validate their survival. Continuing these studies in more recently, the findings of Ehsan and Kaleem (2012) [23] about the nature of association between CSR and firm performance suggest a positive relationship.
H8 = All else being equal, companies with greater profitability tend to have higher degree of CSR reporting.
3. Research Design and Methodology
3.1. Sample Size and Data
This study used the sample size of 100 Pakistani companies listed on the Karachi Stock Exchange (KSE). The data involves the examination of annual reports for five years (2007–2011) for these listed companies. The annual reports are downloaded from the web sites of companies and KSE. In the case of companies where only incomplete annual reports were available (only financial information) on the web, emails were sent to their head offices, addressed to the companies secretary, requesting their complete annual reports. After several weeks of sending the mails, reports were received from a few companies concerned. However, there are many companies who did not respond to the emails. In that case, reports were collected personally from their head offices situated in Lahore and Karachi. As a result, annual reports of the entire population of KSE 100 Index were examined in the study.
The CSR disclosure may be done through several mediums such as an internet, newspaper, media separate reports or sections in the annual report and online version in the companies’ web sites. This study focuses on published annual reports because annual reports were found to be the main medium for the disclosure of CSR practices to stakeholders [43]. Moreover, numerous user groups of annual reports considered voluntary environmental disclosures while decision making [47]. Belal (2000) [48] demonstrates that annual reports are considered as the most important way for the communication of information about the company. Therefore the choice of annual reports as source for date collection is consistent with other prior researches [49]. One more argument for choosing annual reports is that it is the widespread and accepted document created on a regular basis by the firms in Pakistan.
3.2. Measurement of Variables
3.2.1. Dependent Variable—CSR Disclosure
CSR disclosure is the dependent variable of this study and the technique of content analysis is applied to examine the CSR reporting of the selected firms from the annual reports. Content analysis is a technique of codifying the text of piece of writing into various groups (or categories) based on special criterion [50]. It is a familiar method for analyzing annual reports and has been used widely and considered to be empirically suitable in the CSR reporting fields of accounting research [49].
In past studies, content analysis methods of CSR reporting included different unit of analysis such as words count [7], number of sentences [51], number of pages [49,52] and quantity of pages [49]. Al-Tuwaijri, Christensen and Hughes (2004) [53] examine that a page may contain an image that does not have information about CSR, whereas sentences and words may perhaps not take into account a graph or necessary table. An inspection of annual reports recognized large dissimilarities in length of sentence both within and between companies. Studies considered ‘‘frequency’’ and ‘‘words count’’ as the unit of communication due to its greater practicability and categorization ease [7,54]. The frequency is decided by the number of times a particular CSR reporting item is narrated either qualitatively or quantitatively. The frequency provides the intensity (quantity) of a given CSR reporting item while the words count indicates the space allocated for a given CSR reporting item (volume). With the aim of avoiding complication in accounting for these discrepancies, words were used as the measurement unit in this study. Therefore, in this study, the frequency is taken in such a way that, in a single sentence, the word related to CSR is counted once.
The development of categories is an essential component of content analysis in which units of content can be categorized. The categories and items follow from earlier research in the area [20,43,49]. The final checklist instrument (see in Appendix A) consists of 40 CSR disclosure items. The research instrument contain seven categories of CSR reporting (health sector contribution, education contribution sector, work during natural calamities, other contributions, activities for employees, environmental related issues and product/services statements). An effort is also made to ensure that each of the items is unambiguous and mutually exclusive.
3.2.2. Independent Variables
The construction of independent variables with control variables and their measurement technique are elaborated in Table 1.

Table 1.
Independent Variables.
| Sr. # | Variable | Description | Symbol | Measurement |
|---|---|---|---|---|
| 1 | X1 | Board size | BS | Total directors |
| 2 | X2 | Composition of independent directors | IND | Percentage of independent directors to total directors on the board |
| 3 | X3 | Composition of women directors | WD | Percentage of women directors to total directors on the board |
| 4 | X4 | Composition of foreign directors | FD | Percentage of non-Pakistani directors to total directors on the board |
| 5 | X5 | Ownership concentration | OC | Sum of squares of highest five shareholdings’ percentages |
| 6 | X6 | Institution ownership | IO | Sum of percentages of institutions’ ownership |
Note: BS: board Size, IND: independent directors, WD: women directors, FD: non-Pakistani directors, OC: Ownership concentration, IO: Institution ownership.
3.2.3. Control Variables
Control variables of the study are explained in Table 2.
Table 2.
Control Variables.
| Sr. # | Variables | Description | Symbol | Measurement |
|---|---|---|---|---|
| 1 | X7 | Size | Sales | Size based on total Sales |
| 2 | X8 | Profitability | ROE | Return on equity = Net profit after tax/total equity |
Figure 1 depicts that CG is the independent variable and CSR is the dependent variable. Both of these are measured in term of different aspects that are derived from the literature. Hypotheses are made on the basis of these variables and supported by past studies. CG is measured in terms of board size, independent directors, foreign directors, women directors, ownership concentration and institution ownership. Company size and the firm performance in terms of return on assets are used as control variables. The dependent variable is CSR. That is further divided into sub classes so that it could be measured easily. The main headings included in CSR are: education sector, health sector, contributions for natural disaster, environmental issues, and activities for employees and other donations. All these headings are measured in terms of further points that are explained in Appendix B.
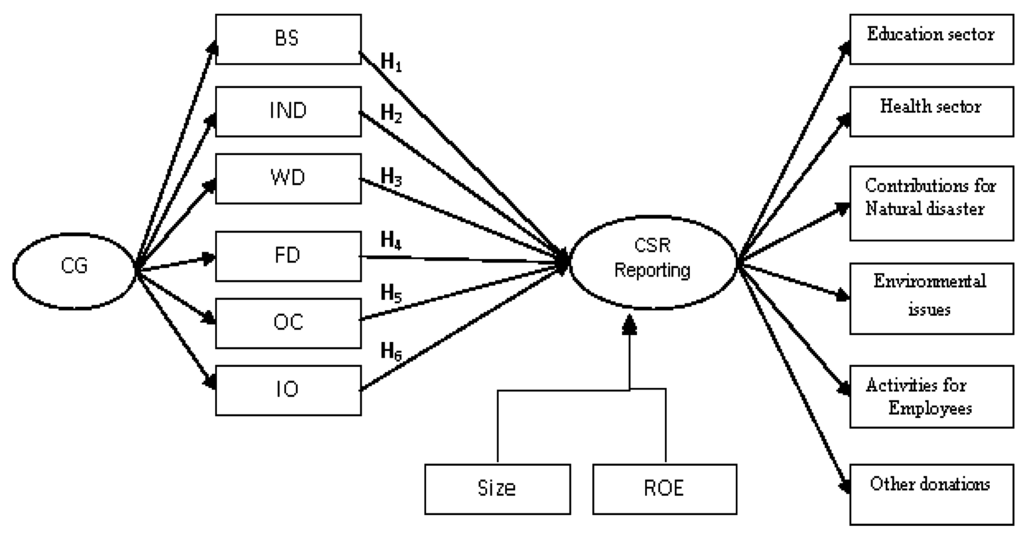
Figure 1.
Graphical representation of the model.
3.3. Regression Model Equation
Regression analysis is used in this study to investigate the relationship between the range of independent variables and the overall CSR disclosure. The regression line provides an assessment of the link between a dependent variable and independent variables or covariates. The regression assumptions were tested for multicollinearity based on correlation matrix as well as Variance Inflation Factor (VIF). The collinearity test is applied through SPSS. Neter and Kutner (1989) [55] considered collinearity as a problem if the VIF go beyond 10. In this study the values of VIF in all years are less than 5.00 which indicate strong independence of variables. Durbin Watson (DW) test is performed to identify first order autocorrelation problem. A value of DW closer to 2 in all years indicates that the regression model is the suitable technique [56]. Therefore, this study can rely on results of regression. The equation for multiple regression equation for population is:
where ei is the disturbance term and β1…… β8 is the beta coefficient.
CSRDI = β0 + β1BS + β2IND + β3FD + β4WD + β5OC + β6IO + β7Size + β8ROE + ei
3.4. CSR Disclosure Index (CSRDI)
For the purpose of ensuring the reliability in coding, the researcher and a research assistant both were involved in the coding process. Basically, an item in the research tool is coded “1” if disclosed and “0” if it is not. In other words, if a company reports an item of CSR (e.g., donation for education or hospital) in the annual report, it is awarded “1” and otherwise “0”. The scores of all items are then added to get the ultimate score for the company. The number of words in each sentence relating to each CSR item is included in the list, and any items relating to graphical representation in annual report were also included in this respect. The reporting model for the CSR disclosure thus measures the total disclosure score for a company as follows:
where di is 1, if the item di is disclosed and 0 if the item di is not disclosed, nj is the maximum number of items for jth firms and nj ≤ 40.
CSRDI = ∑di40/nj
To get a company’s score, the scores for each item is added and the sum is divided by the maximum likely scores, and then multiplied by 100 to gather the scores in percentage. In this work, 40 items represent the maximum number of possible disclosures. Therefore, for instance, if a company discloses not a single item (0) out of 40 items, the score for dependent variable will be 0 per cent. Similarly, if almost half items are disclosed, then the dependent variable’s score will be 50 per cent.
4. Data Analysis and Results
4.1. Descriptive Analysis
Appendix A has all 40 CSR items used in this study for measuring the CSRDI. These 40 items are classified into 7 classes depending on the nature of the items. These classes are about the contribution of companies to health, education, natural disaster, donations, employee activities, environmental issues and product/service statements. Appendix B shows the degree of CSR disclosure in all the five years separately. It shows that there are also some firms showing disclosure index of more than 50 percent. The companies having more than 50 percent index throughout five years are Pak Petroleum, Nestle Pakistan Ltd. and Attock Refinery Ltd. Additionally, Appendix B also highlights that a few companies disclosed more than 50 percent in recent years as compared to earlier years such as MCB Bank and Lucky Cement. Those companies having improved CSR reporting in recent years are Fauji Fertilizer Bin, Hub Power Co., Atlas Honda, Marry Glass, Pak Suzuki Motor and Silk bank. These results propose that CSR disclosure in the Pakistan KSE 100 Index has improved. Appendix C shows category wise reporting volume of companies to measure the company’s greater propensity for reporting CSR items. It also shows the extent of disclosure as measured by the word count in all 5 years showing that the trend of CSR reporting is increasing in recent years.
Table 3 shows the descriptive statistics of all variables for 5 years respectively. There are 100 measures in all years except in 2007. There are 99 measures in 2007 because the Fatima Fertilizer company was not operationalized in 2007. In 2011 the mean of board size is 8.79 and the mean value of proportion of independent directors, foreign and women directors is 44.15, 14.34 and 5.46 respectively. The lowest women’s contribution is in 2010 that is only 4.69 percent as an average. The overall representation of women directors in the governance is low for all five years. The maximum value of concentration of ownership is 9798 from 2007 to 2010 and it is highest in 2011 with a value of 13,748. The maximum institutional ownership is 99% in all five years representing the greatest institutional control. The highest values of CSRDI are 63, 62, 65, 60 and 62 in 2011, 2010, 2009, 2008 and 2007 respectively. Its mean value is highest in 2011, that is 30.07, and the lowest mean value is 23.52 in 2007. It is also disclosed that the CSR reporting is improved in 2011 as compared to 2007. However the variation in CSRDI is 15.002 in 2011 and 13.98 in 2007 which also shows the less variation as compared to other year’s figures.
Table 3.
Descriptive Statistics.
| Variables | N | 2011 | 2010 | 2009 | 2008 | 2007 | |||||
| Mean | Std. Deviation | Mean | Std. Deviation | Mean | Std. Deviation | Mean | Std. Deviation | Mean | Std. Deviation | ||
| BS | 100 | 8.79 | 1.986 | 8.78 | 2.082 | 8.72 | 1.918 | 8.72 | 1.918 | 8.77 | 1.916 |
| IND | 100 | 44.15 | 32.996 | 46.72 | 32.461 | 44.8 | 32.196 | 44.8 | 32.196 | 44.64 | 32.696 |
| FD | 100 | 14.34 | 18.239 | 13.35 | 18.049 | 13.96 | 19.041 | 13.96 | 19.041 | 15.43 | 22.763 |
| WD | 100 | 5.46 | 11.154 | 4.69 | 10.626 | 5.76 | 11.118 | 5.76 | 11.118 | 5.46 | 10.916 |
| OC | 100 | 3138.15 | 2587.096 | 2844.63 | 2245.467 | 2950.86 | 2268.515 | 2950.86 | 2268.515 | 2940.22 | 2319.934 |
| IO | 100 | 71.41 | 28.155 | 70.6 | 28.89 | 70.54 | 27.069 | 70.54 | 27.069 | 69.51 | 27.853 |
| Size | 100 | 41,966,846,875 | 90,791,374,024 | 35,281,800,996 | 81,302,729,747 | 30,689,433,583 | 68,200,418,806 | 30,689,433,583 | 68,200,418,806 | 21,322,422,293 | 41,697,873,392 |
| ROE | 100 | 21.82 | 45.14047 | 43.2718 | 279.09081 | 15.6496 | 220.45856 | 15.6496 | 220.45856 | −1.179 | 275.2021 |
| CSRDI | 100 | 30.07 | 15.002 | 30.2 | 15.024 | 27.62 | 14.219 | 27.62 | 14.219 | 23.52 | 13.985 |
Note: BS: board Size, IND: independent directors, WD: women directors, FD: non-Pakistani directors, OC: Ownership concentration, IO: Institution ownership, ROE: Return on equity, CSRDI: Corporate social responsibility disclosure index.
4.2. Multivariate Analysis
4.2.1. Correlation Matrix
Table 4 contains the results of correlation of 2011. There is considerable positive association between BS and CSR at the 1% level which means that the larger board size leads to higher CSR reporting. Larger boards may discuss CSR more widely and fruitfully and consequently invest more in these activities [57]. These results are consistent with [32,57,58]. There is a negative but significant relationship between IND and CSR. Conceivably IND directors preferably focus on corporate financial performance rather than social. These results are consistent and provide some support to previous result by Said, Yuserrie and Hasnah (2009) [32], Arora and Dharwadkar (2011) [45]. In this analysis, FD and CSR are positively related [32,59]. Table 4 shows 27% negative but a significant relationship in WD and CSR reporting. This is contrary to prior studies of Ehsan and Kaleem (2012) [23]. The reason of this negative relationship is that in Pakistan, there is very low representation of women in governance. OC is positively and significantly correlated with CSR disclosure which is consistent with Said, Yuserrie and Hasnah (2009) [32] studies. There is a positive significant association between IO and CSR in 2011 in Pakistan’s KSE 100 Index. This means that the institutions in Pakistan encourage social disclosure. These results are consistent with [60]. Size, has a positive significant relationship with CSR reporting information and these outcomes are consistent with [45,54]. ROE is also positively correlated with CSR information.
Table 4.
Pearson Correlations.
| Variables | 2011 | 2010 | 2009 | 2008 | 2007 |
|---|---|---|---|---|---|
| CSRDI | CSRDI | CSRDI | CSRDI | CSRDI | |
| CSRDI | 1 | 1 | 1 | 1 | 1 |
| Sig (2 Tailed) | |||||
| BS | 0.384 *** | 0.374 *** | 0.383 *** | 0.357 *** | 0.370 *** |
| Sig (2 Tailed) | 0.000 | 0.000 | 0.000 | 0.000 | 0.000 |
| IND | −0.211 ** | −0.278 ** | −0.177 * | −0.157 | −0.162 |
| Sig (2 Tailed) | 0.035 | 0.005 | 0.078 | 0.119 | 0.109 |
| FD | 0.103 | 0.102 | 0.068 | 0.032 | −0.003 |
| Sig (2 Tailed) | 0.308 | 0.311 | 0.499 | 0.755 | 0.980 |
| WD | −0.271 *** | −0.244 ** | −0.196 * | −0.159 | −0.246 ** |
| Sig (2 Tailed) | 0.006 | 0.014 | 0.051 | 0.114 | 0.014 |
| OC | 0.244 ** | 0.246 ** | 0.360 *** | 0.331 *** | 0.360 *** |
| Sig (2 Tailed) | 0.015 | 0.014 | 0.000 | 0.001 | 0.000 |
| IO | 0.373 *** | 0.452 *** | 0.461 *** | 0.390 *** | 0.469 *** |
| Sig (2 Tailed) | 0.000 | 0.000 | 0.000 | 0.000 | 0.000 |
| Size | 0.323 *** | 0.301 *** | 0.321 *** | 0.288 *** | 0.412 *** |
| Sig (2 Tailed) | 0.001 | 0.002 | 0.001 | 0.004 | 0.000 |
| ROE | 0.235 ** | 0.177 * | 0.002 | 0.167* | 0.104 |
| Sig (2 Tailed) | 0.018 | 0.079 | 0.986 | 0.096 | 0.307 |
* Significance at 10% (1.645); ** Significance at 5% (1.96); *** Significance at 1% (2.576). CSRDI: Corporate social responsibility disclosure index, BS: board Size, IND: independent directors, WD: women directors, FD: non-Pakistani directors, OC: Ownership concentration, IO: Institution ownership, ROE: Return on equity.
In the results of correlation of 2010, there is a positive significant relationship between BS and CSR reporting, meaning that the greater number of directors leads to higher CSR reporting. These results are consistent with [32,57,58]. IND directors also have the same negative and significant relationship with CSR reporting as in 2011. These results are consistent with Arora and Dharwadkar (2011) [45] studies. In this analysis FD and CSR are positively related [59]. Table 4 shows negative but significant relationship in WD and CSR reporting. The reason of this negative relationship is low representation of women in governance. OC is positively and significantly correlated with CSR disclosure which is in consistent with the studies of Said, Yuserrie and Hasnah (2009) [32]. IO and CSR have 45.2% correlation in 2010. These results are consistent with [60]. Size has a positive significant relationship with CSR reporting information [54]. ROE is positively correlated with CSR information and this relationship is significant.
In the results of correlation of 2009 there is a positive significant connection of BS, OC, IO and size of company with CSR reporting. These are same results as of 2011 and 2010. IND and women directors have same negative relationship with CSR reporting as of [32,45] and FD and CSR reporting are positively related as in 2011 and 2010. ROE is positively correlated with CSR information but this relationship is not significant. The same results are reported by Said, Yuserrie and Hasnah (2009) [32].
In 2008, there is a positive significant association of BS, OC, IO and size of company with CSR reporting at 1% level. These are same results as of 2011, 2010 and 2009. IND and women directors also negatively related with CSR reporting as in 2009 and FD and CSR reporting are positively associated. ROE is positively correlated with CSR information.
In 2007, there is a positive and significant relationship of BS, OC, IO and size of company with CSR reporting. These are same results as of 2011, 2010 and 2009. Women directors are negatively associated with CSR. It is significant. IND directors are also negatively related with CSR reporting. These findings are in support to the prior studies of Said, Yuserrie and Hasnah (2009) [32] and then Arora and Dharwadkar (2011) [45]. FD and CSR reporting are negatively associated. This negative association is reasoned to be due to the very low proportion of foreign directors in 2007. ROE is positively correlated with CSR information but it is not significant. The same results are reported by Said, Yuserrie and Hasnah (2009) [32].
4.2.2. Regression Analysis
The results of regression are shown in Table 5. Test of non-linearity of the data indicated no major problem for regression analysis. Based on VIF found in the study, it is unlikely that multicollinearity influence the regression results. The VIFs of all independent variables are below 2. Collinearity is regarded as problematic only when VIF exceeds 10 [61,62]. The values of Durbin Watson and of VIF are nearly 2 which mean that there is lack of multicollinearity in all five years in the regression model.
CSRDI2011 = 8.397 + 1.427 (BS) − 0.031 (IND) + 0.006 (FD) − 0.225 (WD) + 0.000 (OC) + 0.123 (IO) + 2.601 (Size) + 0.030 (ROE) + ei
Table 5.
Multiple Regressions.
| Variables | 2011 | 2010 | 2009 | 2008 | 2007 | ||||||||||
|---|---|---|---|---|---|---|---|---|---|---|---|---|---|---|---|
| Beta Coef | t-Value | p-Value | Beta Coef | t-Value | p-Value | Beta Coef | t-Value | p-Value | Beta Coef | t-Value | p-Value | Beta Coef | t-Value | p-Value | |
| Constant | 8.397 | 1.154 | 0.250 | 6.952 | 1.024 | 0.310 | 3.899 | 0.579 | 0.560 | 2.485 | 0.346 | 0.730 | 3.311 | 0.502 | 0.620 |
| BS | 1.427 | 1.899 * | 0.060 | 1.541 | 2.342 ** | 0.020 | 1.323 | 1.899 * | 0.060 | 1.450 | 1.885 * | 0.060 | 1.137 | 1.716 * | 0.090 |
| IND | −0.031 | −0.730 | 0.470 | −0.070 | −1.590 | 0.120 | −0.040 | −0.940 | 0.350 | −0.060 | −1.530 | 0.130 | −0.040 | −1.180 | 0.240 |
| FD | 0.006 | 0.071 | 0.940 | −0.010 | −0.130 | 0.900 | −0.070 | −1.010 | 0.320 | −0.050 | −0.640 | 0.520 | −0.040 | −0.770 | 0.450 |
| WD | −0.225 | −1.747 * | 0.080 | −0.210 | −1.689 * | 0.100 | −0.190 | −1.550 | 0.120 | −0.050 | −0.430 | 0.670 | −0.080 | −0.750 | 0.460 |
| OC | 0.000 | 0.590 | 0.560 | 0.001 | 0.789 | 0.430 | 0.001 | 1.847 * | 0.070 | 0.001 | 1.781 * | 0.080 | 0.001 | 2.012 ** | 0.050 |
| IO | 0.123 | 2.151 ** | 0.030 | 0.163 | 3.050 *** | 0.000 | 0.162 | 2.778 *** | 0.010 | 0.122 | 2.151 ** | 0.030 | 0.119 | 2.251 ** | 0.030 |
| Size | 2.601 | 1.657 * | 0.100 | 2.208 | 1.319 | 0.190 | 3.164 | 1.663 * | 0.100 | 3.350 | 1.392 | 0.170 | 8.052 | 2.678 *** | 0.010 |
| ROE | 0.030 | 0.961 | 0.340 | 0.002 | 0.509 | 0.610 | 0.006 | 1.060 | 0.290 | 0.028 | 0.855 | 0.400 | 0.001 | 0.319 | 0.750 |
| Durbin Watson | 1.921 | 1.837 | 1.904 | 1.852 | 2.176 | ||||||||||
| R2 (%) | 30.6 | 36 | 36.3 | 29.5 | 37.9 | ||||||||||
| Adjusted R2 (%) | 24.5 | 30.3 | 30.7 | 23.3 | 32.4 | ||||||||||
| F Statistics | 5.021 | 6.389 | 6.488 | 4.752 | 6.863 | ||||||||||
| Significance | 0.000 | 0.000 | 0.000 | 0.000 | 0.000 | ||||||||||
* Significance at 10% (1.645); ** Significance at 5% (1.96); *** Significance at 1% (2.576). BS: board Size, IND: independent directors, WD: women directors, FD: non-Pakistani directors, OC: Ownership concentration, IO: Institution ownership, ROE: Return on equity.
Regression equation 2011 has 30.6% R2 and 5.021 F Statistic that is significant at 1% level. The R2 implies that the 30.6 percent of the variation in CSR disclosure is explained by CG characteristics. The value of R2 is greater than the value measured by Said, Yuserrie and Hasnah (2009) [32], so it is quite significant. In this regression model the value of beta coefficient of BS is positive [32,57,58]. WD is also significantly related to CSRD but the relationship is negative. These results are in contrast to prior studies [59]. The reason is that the trend for women’s participation in Pakistan is low; mostly they act as sleeping partner or dormant partner in businesses. Size of firm is also positively and significantly correlated to CSRD. The same results are found by Arora and Dharwadkar (2011) [45] and Suttipun and Stanton (2012) [54]. Another CG variable that is IO is positively associated with CSRD and it is significant which is consistent with the results of [60]. The value of IND directors is negative in 2011 but it is not significant [36,37,57]. Arora and Dharwadkar (2011) [45] also found negative but significant association between independent directors and CSR disclosure showing that independent directors are a cost efficient substitute for information disclosure. The result may entail that commitment to CSR activities are not the primary concern of independent directors. Conceivably independent directors prefer to focus more on corporate financials rather than the social performance. However, this finding should be interpreted carefully as the result is not significant.
The value of beta coefficient of FD is positive and insignificant in 2011. This is supported with the previous studies of Said, Yuserrie and Hasnah (2009) [32], HU Zaman (2010) [59] and Sufian and Zahan (2013) [63]. The variables OC and ROE are also positively but insignificantly related to CSRD. These findings are same as of Said, Yuserrie, and Hasnah (2009) [32] and Ehsan and Kaleem(2012) [23] respectively. The value of Durbin Watson is 1.921 in the year of 2011.
CSRDI2010 = 6.952 + 1.541 (BS) − 0.066 (IND) − 0.010 (FD) − 0.213 (WD) + 0.001 (OC) + 0.163 (IO) + 2.208 (Size) + 0.002 (ROE) + ei
Regression equation of 2010 has 36% R2 and 6.389 F Statistic that is significant at 1% level. The R2 implies that the 36 percent of the variation in CSR disclosure is explained by CG characteristics. Like 2011, in this regression model BS, WD, IO and size of firm are significant. The only difference of results from the year of 2011 is that the value of FD is negative in 2010 to 2007. It shows that in Pakistan FD has little interest in CSRD. The value of Durbin Watson is 1.837 and of VIF also nearly 2 so it means that there is no collinearity in the model.
CSRDI2009 = 3.899 + 1.323 (BS) − 0.037 (IND) − 0.074 (FD) − 0.188 (WD) + 0.001 (OC) + 0.162 (IO) + 3.164 (Size) + 0.006 (ROE) + ei
Regression equation of 2009 has 36.3% R2 and 6.488 F Statistic that is significant. The R2 implies that the 36 percent of the variation in CSR disclosure is explained by CG characteristics in 2009. Here BS, OC, size and IO is significant.
CSRDI2008 = 2.485 + 1.450 (BS) − 0.063 (IND) − 0.050 (FD) − 0.053 (WD) + 0.001 (OC) + 0.122 (IO) + 3.350 (Size) + 0.028 (ROE) + ei
Regression equation of 2008 has 29.5% R2 and 4.752 F Statistic that is significant. The R2 implies that the 29.5 percent of the variation in CSR disclosure is explained by CG characteristics in 2008. In 2008 variables: BS, OC and IO are significant at 5%.
CSRDI2007 = 3.311 + 1.137 (BS) − 0.044 (IND) − 0.040 (FD) − 0.084 (WD) + 0.001 (OC) + 0.119 (IO) + 8.052 (Size) + 0.001 (ROE) + ei
Regression equation of 2007 has 37.9% R2 and 6.863 F Statistic. The R2 implies that the 38 percent of the variation in CSR disclosure is explained by CG characteristics in 2008.
5. Conclusions
5.1. Discussion
This study examines the particular characteristics of the CG of the firm to the reporting of CSR practices in which the firm engages. This research extends the previous studies on the development of CSR index in Pakistan by taking the KSE 100 Index. Outcomes based on the multiple regression models showing that variables that are positively linked with the degree of disclosures are board size, ownership concentration, institution ownership and firm size. The mainly significant variables that influence the level of CSR disclosure are board size (supported with the previous studies of [32,57,58]) and institution ownership (supported with the findings of [60]). Board size implies that the greater size of the board of directors in a firm, the higher the extent of CSR disclosure will be. This study also proves a significant positive association between IO and CSR disclosure. This validates that the interests of stakeholders bring an increased engagement and support in CSR activities. CSR Disclosure vice versa can also be utilized as a source to attract institutional investors to aggressively invest in companies that have well-founded platforms for CSR practices. All the results of hypothesis are shown in Table 6.
Table 6.
Results of Hypothesis.
| Hypotdesis | 2011 | 2010 | 2009 | 2008 | 2007 |
| H1 | Accept | Accept | Accept | Accept | Accept |
| H2 | Reject | Reject | Reject | Reject | Reject |
| H3 | Reject | Reject | Reject | Reject | Reject |
| H4 | Reject | Reject | Reject | Reject | Reject |
| H5 | Reject | Reject | Accept | Accept | Accept |
| H6 | Accept | Accept | Accept | Accept | Accept |
| H7 | Accept | Accept | Accept | Reject | Accept |
| H8 | Reject | Reject | Reject | Reject | Reject |
The outcomes of regression showing that there are positive relationship of ownership concentration and firm size with the degree of disclosures. These findings are same as of Arora and Dharwadkar, (2011) [45] and Suttipun and Stanton (2012) [54] respectively. The development of CSR goes to the heart of the debate on the shifting role of firms towards the community. This development has allowed the appearance of a latest public-private sphere for complex CSR. A number of self-regulatory rules and stakeholder oriented programs are presently being developed to control CSR related issues. The execution of these regulations, in turn, unlocks the door to strengthen spaces of business citizenship that contain stakeholder monitoring and control.
The hypotheses (variable wise) are accepted on the basis of beta coefficient and t-value as discussed in regression analysis in detail.
Literature supports all the hypotheses that are accepted. The second sub hypothesis, that corporations with higher percentage of independent directors tend to have high degree of CSR reporting, is rejected in all of the five year’s disclosures which show, that in Pakistan, independent directors have no interest in CSR reporting. Therefore, in the case of Pakistan, independent directors prefer to focus more on corporate financials rather than the social performance.
The third sub hypothesis, that corporations with high proportion of women directors tend to have higher degree of CSR reporting, is also rejected in all of the five year’s disclosures which show that in Pakistan, women’s participation in governance matters is not like the other countries. The reason is that the trend of women’s participation in Pakistan is low; mostly they act as sleeping partner or dormant partner in businesses.
The fourth sub hypothesis, that corporations with higher proportion of foreign nationals on the board tend to have higher degree of CSR reporting, is also rejected in all five years. It discloses that non-Pakistani directors have no interest in socially responsible actions.
The eighth sub hypothesis, that companies with higher profitability tend to have higher degree of CSR reporting, is also rejected in all five years. It reveals the nature of Pakistani companies about reinvesting in business activities rather than social activities. There may be other reasons, such as political crises and unstable government that may have resulted in dragging the investment outside of Pakistan.
5.2. Practical Implications, Limitations and Suggestions for Further Research
From the above results, it can be easily understood that this study makes a number of possible implications to the CSR literature. First, this study added an insight into CSR reporting practices of developing countries and thus expands the previous literature that has focused mostly on developed countries. Thus it opens up further research opportunities to evaluate and contrast these results with the companies of other developing or developed countries. Second, it has broadened the previous CSR research to the Pakistani industry. Third, the findings documented that a number of companies in Pakistan have contributed to different sectors of the country; in particular education, health and others so as to enhance their citizenship.
Despite this study’s ability to look at some practical implications, it has also some limitations. These limitations however, can be used by researchers for future research. The major limitations of the research are that it considers data from only one country and the disclosure of CSR in annual reports may not be treated as an absolute and accurate measure of engagement in citizenship. That is perhaps due to the fact that a company may use other channels like company newsletters, websites and newspapers to communicate its social involvement. Therefore, a prospect comes up for future research on CSR to examine different channels of corporate communication. Moreover, involvement in CSR practices may not essentially transform into disclosure of those practices. Consequently, it should not be perceived that corporations with no CSR disclosure were not involved in any CSR activities. Additionally, even though the findings show that larger size companies have higher disclosure about CSR information; small scale firms may also in some other way be engaged in CSR practices by the simple basis that they give jobs to local people in the community. This could be particularly so in rural areas.
Given the limitations of this research, future studies could include in-depth analysis for the reporting of CSR issues by considering all listed companies of Pakistan to conclude the impact of CG on firm CSR Reporting and to increase the generalizability of the results. Much insight could be gained by comparing corporations of different sectors with other champions of CSR in order to conclude how much efforts are needed to meet the benchmark. Future research may explore some in-depth thinking usable for external as well as internal stakeholders to evaluate the socialism of a firm.
Author Contributions
Sadia Majeed contributes towards the trend of CSR disclosure in Pakistan in KSE 100 index companies. Tariq Aziz collects data of KSE 100 index. Sadia Majeed put the data into SPSS and calculates the dependent and independent variables. Tariq Aziz and Saba Saleem help in interpreting the results and collecting the literature. This study is the pioneer in CSR disclosure at KSE 100 index companies in Pakistan.
Conflicts of Interest
The authors declare no conflicts of interest.
Appendix A
Table A1.
List of CSR Factors Included in the Study.
| A: Contribution to health sector |
| 1 Health, safety & environment policy/measures |
| 2 HIV/AIDS assistance program |
| 3 Support to acid and dowry victims |
| 4 Donation of medical equipment in different medical hospitals |
| 5 Donation/work for cancer hospital |
| 6 Donation/facility of medical hospital (government/private) |
| B: Contribution to education sector |
| 7 Donation to the universities for constructing research center |
| 8 Scholarships to the research students of different universities |
| 9 Scholarship to employee’s children |
| 10 Granted fund for special education and rehabilitation |
| 11 Work for physical disabled students/employee |
| 12 Fund raising/supporting school/college/university education programs |
| 13 Donation/charity to trusts for the widows/orphans |
| 14 Internship/apprenticeship facilities for students |
| C: Activities for natural disaster |
| 15 Part time job facilities |
| 16 Efforts for reducing child labor |
| 17 Donation/work for any relief fund for the victims of natural disasters (river erosions/flood/earthquake) |
| 18 Donation/work for rehabilitation of homeless people due to natural disasters (river erosions/flood/earthquake) |
| D: Other donations |
| 19 Establishment of health care center for rural people/underprivileged |
| 20 Financial supports to the natural affected victims of neighboring countries |
| 21 Sponsoring of different national and international games and events |
| 22 Donation to different sports organizations |
| 23 Assistance to different Trusts who works for poor people of the society/social work |
| E: Activities for employees |
| 24 Employee training programs/expenses |
| 25 Career developments |
| 26 Employee benefits |
| 27 Compensation plan for employees |
| 28 Facilities to employee’s children/employee facilities |
| 29 Amount of budget allocation on employees training |
| 30 Cost of employees safety measures |
| 31 Information about support for day-care, maternity and paternity leave/family accommodation/mother health care center |
| F: Environmental issues |
| 32 Environmental protection measures |
| 33 Planting of trees to make the country green |
| 34 Support for public/private actions designed to protect the environment (e.g. CNG station establishment)/civil work |
| 35 Promoting environmental awareness to the community through promotional tools |
| G: Product/services statements |
| 36 Explanation of major products/services/segments/projects |
| 37 Product/service quality policy/improvement/assurance |
| 38 Improvement of customer service/focus |
| 39 Receipt of awards (local or international) for CSR activities |
| 40 Information for conducting research/development on the company’s products |
Appendix B
Table A2.
List of Companies Included in the Study and Number of CSR Items Disclosed of Each Company.
| Sr. # | Company Names | No. of Items Disclosed (2011) | No. of Items Disclosed (2010) | No. of Items Disclosed (2009) | No. of Items Disclosed (2008) | No. of Items Disclosed (2007) |
|---|---|---|---|---|---|---|
| 1 | Oil & Gas Development Co. | 15 | 17 | 15 | 15 | 18 |
| 2 | Pak Petroleum | 24 | 25 | 26 | 24 | 25 |
| 3 | Nestle Pakistan Ltd. | 20 | 21 | 21 | 21 | 20 |
| 4 | MCB Bank | 20 | 19 | 20 | 20 | 5 |
| 5 | Fauji Fertilizer | 22 | 20 | 20 | 17 | 17 |
| 6 | Habib Bank Limited | 10 | 10 | 9 | 7 | 6 |
| 7 | UniLever Pak | 13 | 14 | 14 | 15 | 14 |
| 8 | United Bank | 15 | 13 | 12 | 5 | 5 |
| 9 | Pak Oilfields | 15 | 17 | 16 | 16 | 17 |
| 10 | National Bank Pak | 14 | 13 | 13 | 12 | 12 |
| 11 | Allied Bank Ltd. | 16 | 16 | 16 | 15 | 15 |
| 12 | P.T.C.L.A | 18 | 18 | 13 | 12 | 11 |
| 13 | Engro Corporation | 15 | 18 | 15 | 15 | 16 |
| 14 | National Foods | 14 | 17 | 18 | 10 | 9 |
| 15 | Fatima Fertilizer | 18 | 17 | 13 | ||
| 16 | Hub Power Co. | 13 | 14 | 5 | 5 | 9 |
| 17 | P.S.O | 22 | 20 | 19 | 18 | 23 |
| 18 | Standard Charter Bank | 11 | 11 | 11 | 11 | 11 |
| 19 | Lucky Cement | 22 | 20 | 19 | 3 | 3 |
| 20 | KotAddu Power | 7 | 6 | 9 | 5 | 8 |
| 21 | Fauji Fertilizer Bin | 10 | 12 | 14 | 4 | 4 |
| 22 | Colgate Palmolive | 4 | 4 | 4 | 4 | 4 |
| 23 | Attock Petroleum | 9 | 8 | 8 | 6 | 7 |
| 24 | Bank AL-Habib | 10 | 11 | 7 | 8 | 8 |
| 25 | Rafhan Maize | 18 | 13 | 13 | 9 | 10 |
| 26 | Meezan Bank Ltd. | 12 | 12 | 10 | 2 | 5 |
| 27 | Bank Al-Falah | 7 | 10 | 6 | 5 | 5 |
| 28 | Indus Motor Company | 20 | 19 | 19 | 17 | 17 |
| 29 | NIB Bank Limited | 6 | 6 | 6 | 6 | 6 |
| 30 | National Refinery | 11 | 7 | 8 | 9 | 10 |
| 31 | D.G.K. Cement | 6 | 10 | 3 | 3 | 3 |
| 32 | ICI Pakistan Ltd. | 19 | 21 | 16 | 19 | 16 |
| 33 | Habib Metropolitan | 10 | 14 | 10 | 10 | 10 |
| 34 | Sui South Gas | 21 | 16 | 13 | 17 | 17 |
| 35 | Unilever Food | 11 | 10 | 8 | 10 | 10 |
| 36 | Nishat Mills Limited | 9 | 7 | 7 | 7 | 7 |
| 37 | Ibrahim Fibers | 8 | 8 | 8 | 8 | 8 |
| 38 | Dawood Hercules | 3 | 14 | 18 | 16 | 18 |
| 39 | Millat Tractors | 12 | 9 | 8 | 9 | 9 |
| 40 | Pakistan International Container Terminal Ltd. | 16 | 16 | 16 | 12 | 10 |
| 41 | GlaxoSmithKline Pakistan | 18 | 19 | 15 | 15 | 15 |
| 42 | Bestway Cement | 16 | 17 | 16 | 16 | 16 |
| 43 | Dream world | 4 | 4 | 4 | 4 | 4 |
| 44 | Arif Habib Co. | 10 | 9 | 7 | 7 | 7 |
| 45 | Pak Tobacco | 12 | 15 | 16 | 15 | 14 |
| 46 | Lotte Pak PTA | 19 | 15 | 19 | 12 | 12 |
| 47 | Jahangir Siddiqiue and Company Limited | 2 | 3 | 11 | 8 | 3 |
| 48 | Askari Bank | 14 | 14 | 12 | 13 | 13 |
| 49 | Shell Pakistan Ltd. | 19 | 21 | 21 | 15 | 16 |
| 50 | Abbott Laboratories | 19 | 20 | 17 | 16 | 16 |
| 51 | Sui North Gas | 12 | 13 | 15 | 10 | 10 |
| 52 | EFU General Ins. | 12 | 11 | 11 | 4 | 4 |
| 53 | Atlas Honda Ltd. | 21 | 22 | 16 | 14 | 13 |
| 54 | Attock Refinery Ltd. | 22 | 21 | 23 | 21 | 19 |
| 55 | Faysal Bank | 11 | 14 | 8 | 5 | 5 |
| 56 | Byco Petroleum | 4 | 12 | 14 | 14 | 12 |
| 57 | Philip Morris Pak | 2 | 2 | 2 | 2 | 2 |
| 58 | AL-Ghazi Tractor | 12 | 17 | 12 | 15 | 15 |
| 59 | Tandlianwala Sugar | 2 | 2 | 2 | 2 | 2 |
| 60 | Adamjee Ins | 8 | 11 | 9 | 11 | 11 |
| 61 | Fauji Cement | 12 | 9 | 7 | 8 | 5 |
| 62 | Mari Gas Company | 25 | 24 | 18 | 17 | 17 |
| 63 | Packages Ltd. | 20 | 21 | 16 | 7 | 7 |
| 64 | K.E.S.C | 17 | 21 | 19 | 17 | 17 |
| 65 | Engro Polymer | 21 | 18 | 17 | 17 | 16 |
| 66 | Pak Suzuki Motor | 15 | 17 | 9 | 9 | 7 |
| 67 | Soneri Bank Ltd. | 8 | 8 | 8 | 6 | 5 |
| 68 | Indus Dyeing | 1 | 1 | 1 | 1 | 1 |
| 69 | Thal Limited | 18 | 17 | 13 | 14 | 15 |
| 70 | IGI Insurance Ltd. | 14 | 10 | 10 | 7 | 6 |
| 71 | Attock Cement | 12 | 14 | 17 | 15 | 15 |
| 72 | Universal Insurance Co. | 3 | 3 | 3 | 3 | 3 |
| 73 | Jubilee General Ins. | 14 | 14 | 13 | 13 | 13 |
| 74 | Ghani Glass Ltd. | 6 | 6 | 5 | 5 | 5 |
| 75 | Tri-Pack Films | 11 | 10 | 10 | 9 | 9 |
| 76 | P.I.A | 12 | 15 | 14 | 9 | 8 |
| 77 | Bawany Air Products | 4 | 3 | 2 | 2 | 2 |
| 78 | EFU Life Assurance Ltd. | 8 | 10 | 7 | 9 | 5 |
| 79 | Silk Bank Limited | 13 | 18 | 8 | 5 | 5 |
| 80 | Siemens Pakistan Ltd. | 17 | 18 | 12 | 12 | 14 |
| 81 | Nishat Chun Power | 1 | 1 | 1 | 1 | 1 |
| 82 | Clariant Pak | 10 | 9 | 14 | 14 | 13 |
| 83 | J.D.W.Sugar Mills | 11 | 10 | 10 | 19 | 3 |
| 84 | Nishat Power Ltd. | 7 | 3 | 3 | 3 | 3 |
| 85 | Pak Services | 13 | 12 | 11 | 11 | 11 |
| 86 | Siddiqsons Tin Plate Ltd. | 7 | 7 | 7 | 7 | 7 |
| 87 | Pak Reinsurance | 10 | 11 | 12 | 19 | 6 |
| 88 | Bata (Pak) Limited | 6 | 4 | 4 | 1 | 1 |
| 89 | Feroze 1888 Mills | 7 | 8 | 4 | 4 | 4 |
| 90 | PICIC Gro Fund | 2 | 2 | 2 | 2 | 2 |
| 91 | Murree Brewery | 6 | 4 | 4 | 4 | 6 |
| 92 | Security Paper | 14 | 14 | 15 | 16 | 15 |
| 93 | Media Times Ltd. | 3 | 3 | 3 | 3 | 3 |
| 94 | Al Abbas Cement | 5 | 2 | 2 | 2 | 3 |
| 95 | ShifaInt.Hospitals | 11 | 11 | 14 | 14 | 14 |
| 96 | Pakistan Cables | 11 | 10 | 9 | 10 | 12 |
| 97 | Netsol Technologies | 19 | 10 | 10 | 10 | 10 |
| 98 | Pace (Pak) Ltd. | 5 | 5 | 5 | 5 | 5 |
| 99 | Grays of Cambridge | 5 | 5 | 5 | 4 | 5 |
| 100 | Pak Telephone | 5 | 5 | 5 | 5 | 5 |
Appendix C
Table A3.
CSR Reporting Based on Each Category of CSRD Index.
| Categories | 2011 | 2010 | 2009 | 2008 | 2007 | |||||
|---|---|---|---|---|---|---|---|---|---|---|
| Reporting Co. at least two items | No. of Words Reported | Reporting Co. at least two items | No. of Words Reported | Reporting Co. at least two items | No. of Words Reported | Reporting Co. at least two items | No. of Words Reported | Reporting Co. at least two items | No. of Words Reported | |
| A: Contribution to health sector | 57 | 668 | 57 | 652 | 48 | 504 | 42 | 425 | 42 | 408 |
| B: Contribution to education sector | 39 | 344 | 38 | 267 | 37 | 249 | 29 | 239 | 15 | 130 |
| C: Activities for natural disaster | 24 | 181 | 33 | 210 | 15 | 84 | 7 | 46 | 2 | 5 |
| D: Other donations | 36 | 249 | 35 | 231 | 33 | 229 | 28 | 161 | 28 | 68 |
| E: Activities for employees | 85 | 2069 | 60 | 1716 | 57 | 1517 | 79 | 1703 | 79 | 1560 |
| F: Environmental issues | 31 | 394 | 31 | 319 | 36 | 339 | 29 | 288 | 23 | 196 |
| G: Product/services statements | 78 | 417 | 77 | 390 | 77 | 338 | 76 | 326 | 72 | 285 |
| Total | 4322 | 3785 | 3260 | 3188 | 2652 | |||||
References
- L. Webb, J. Cohen, L. Nath, and D. Wood. “The Supply of Corporate Social Responsibility Disclosure among US Firms.” J. Bus. Ethics 84 (2009): 497–527. [Google Scholar] [CrossRef]
- J.I. Pearce, and J. Doh. “The High Impact of Collaborative Social Initiatives.” MIT Sloan Manag. Rev. 46 (2005): 30–38. [Google Scholar]
- C.A. Tilt. “The Content and Disclosure of Australian Corporate Environmental Policies.” Account. Audit. Accountable. J. 14 (2001): 190–212. [Google Scholar] [CrossRef]
- M. Newson, and C. Deegan. “Global Expectations and their Association with Corporate Social Disclosure Practices in Australia, Singapore and South Korea.” Int. J. Account. 37 (2002): 183–213. [Google Scholar] [CrossRef]
- R. Haniffa, and T. Cooke. “The Impact of Culture and Governance on Corporate Social Reporting.” J. Account. Public Policy 24 (2005): 391–430. [Google Scholar] [CrossRef]
- Y. Lim, M. Talha, J. Mohamaed, and A. Sallehuddin. “International Journal of Behavioral Accounting and Finance.” Corp. Soc. Responsib. Discl. Corp. Gov. Malays. 1 (2008): 67–89. [Google Scholar]
- C. Deegan, and B. Gordon. “A Study of the Environmental Disclosure Policies of Australian Corporation.” Account. Bus. Res. 26 (1996): 187–199. [Google Scholar] [CrossRef]
- D. Jamali, A. Safieddine, and M. Rabbath. “Corporate Governance and Corporate Social Responsibility Synergies and Interrelationships.” Corp. Gov. Int. Rev. 16 (2008): 443–459. [Google Scholar] [CrossRef]
- S. Mitra, S. Dhar, and K.M. Agrawal. “Assessment of Corporate Environmental Proactiveness.” South Asian J.Manag. 15 (2008): 99–135. [Google Scholar]
- M. Porter, and M. Kramer. “Strategy and Society: The Link between Competitive Advantage and Corporate Social Responsibility.” Harv. Bus. Rev. 84 (2006): 78–89. [Google Scholar] [PubMed]
- A. Mcwilliams, D. Siegel, and P. Wright. “Corporate Social Responsibility: Strategic Implications.” J. Manag. Stud. 43 (2006): 1–18. [Google Scholar] [CrossRef]
- G. Lantos. “The Boundaries of Strategic Corporate Social Responsibility.” J. Consum. Mark. 18 (2001): 595–630. [Google Scholar] [CrossRef]
- P. Hawken. The Ecology of Commerce: A Declaration of Sustainability. New York, NY, USA: Harper Collins Publishers, 1993. [Google Scholar]
- A. Beltratti. “The Complementarily between Corporate Governance and Corporate Social Responsibility.” Geneva Pap. Risk Insurance 30 (2005): 373–386. [Google Scholar] [CrossRef]
- D. Whetten, G. Rands, and P. Godfrey. “What Are the Responsibilities of Business to Society? ” In Hand Book of Strategy and Management. Edited by A. Pettigrew, H. Thomas and R. Whittington. London, UK: Sage, 2002, pp. 373–408. [Google Scholar]
- M. Jensen, and W. Meckling. “Theory of Firm: Managerial Behavior, Agency Costs, and Capital Structure.” J. Financ. Econ. 3 (1976): 305–360. [Google Scholar] [CrossRef]
- A. Barnea, and A. Rubin. “Corporate Social Responsibility as a Conflict between Shareholders.” J. Bus. Ethics 97 (2010): 71–86. [Google Scholar] [CrossRef]
- M. Jensen. “Value Maximization, Stakeholder Theory and the Corporate Objective Function.” Bus. Ethics Quart. 12 (2002): 235–256. [Google Scholar] [CrossRef]
- J. Hoje, and M.A. Harjoto. “Corporate Governance and Firm Value: The Impact of Corporate Social Responsibility.” J. Bus. Ethics 103 (2011): 351–383. [Google Scholar]
- S.M. Nazir. “Corporate Social Disclosure in Pakistan: A Case Study of Fertilizers Industry.” J. Commer. 2 (2011): 1–11. [Google Scholar]
- A. Waheed. Evaluation of the State of Corporate Social Responsibility in Pakistan and a Strategy for Implementation. Lahore, Pakistan: Responsible Business Initiative, 2007, pp. 1–75. [Google Scholar]
- M.A.M. Makki, and S.A. Lodhi. “Determinants of corporate philanthropy in Pakistan.” Pak. J. Commer. Soc. Sci. 1 (2008): 17–24. [Google Scholar]
- S. Ehsan, and D.A. Kaleem. “An Empirical investigation of the relationship between Corporate Social Responsibility and Financial Performance: Evidence from Manufacturing Sector of Pakistan.” J. Basic Appl. Sci. Res. 2 (2012): 2909–2922. [Google Scholar]
- M. Tilling. “Corporate Social Reporting: A Cook’s Tour.” In Proceedings of the Governance and Social Responsibility Conference, Deakin University, Melbourne, Australia, 18 May 2001.
- M.A. Islam, and C. Deegan. “Motivations for an Organisation within a Developing Country to Report Social Responsibility Information: Evidence from Bangladesh.” Account. Audit. Account. J. 21 (2007): 850–874. [Google Scholar] [CrossRef]
- V. Murthy, and I. Abeysekera. “Corporate Social Reporting Practices of Top Indian Software Firms.” Australas. Account. Bus. Financ. J. 2 (2008): 36–50. [Google Scholar]
- C. Deegan, M. Rankin, and J. Tobin. “An Examination of the Corporate Social and Environmental Disclosures of BHP from 1983–1997: A Test of Legitimacy Theory.” Account. Audit. Account. J. 15 (2002): 312–343. [Google Scholar] [CrossRef]
- C. Deegan, and M. Rankin. “Do Australian Companies Report Environmental News Objectively? An Analysis of Environmental Disclosures by Firms Prosecuted Successfully by the Environmental Protection Authority.” Account. Audit. Account. J. 9 (1996): 52–69. [Google Scholar] [CrossRef]
- R.L. Watts, and J.L. Zimmerman. “Towards a Positive Theory of the Determination of Accounting Standards.” Account. Rev. 53 (1978): 112–143. [Google Scholar]
- S.H. Hussain, and C. Mallin. “The Dynamics of Corporate Governance in Bahrain: Structure, Responsibilities and Operation of Corporate Boards.” Corp. Gov. Int. Rev. 11 (2003): 249–261. [Google Scholar] [CrossRef]
- M. Aktaruddin, M.A. Hossain, and L. Yao. “Corporate Governance and Voluntary Disclosure in Corporate Annual Reports of Malaysian Listed Firms.” J. Appl. Manag. Account. Res. 7 (2009): 1–20. [Google Scholar]
- R. Said, H.Z. Yuserrie, and H. Hasnah. “The Relationship between Corporate Social Responsibility Disclosure and Corporate Governance Characteristics in Malaysia Public Listed Companies.” Soc. Responsib. J. 5 (2009): 212–226. [Google Scholar] [CrossRef]
- Y. Chen. “Corporate Governance and Cash Holdings: Listed New Economy Versus old Economy Firms.” Corp. Gov. Int. Rev. 16 (2008): 430–442. [Google Scholar] [CrossRef]
- E.C. Cheng, and S.M. Courtenay. “Board Composition, Regulatory Regime and Voluntary Disclosure.” Int. J. Account. 41 (2006): 262–289. [Google Scholar] [CrossRef]
- R. Donnelly, and M. Mulcany. “Board Structure, Ownership and Voluntary Disclosure in Ireland.” Corp. Gov. Int. Rev. 16 (2008): 416–429. [Google Scholar] [CrossRef]
- L.L. Eng, and Y.T. Mak. “Corporate Governance and Voluntary Disclosure.” J. Account. Public Policy 22 (2003): 325–345. [Google Scholar] [CrossRef]
- D.G. Barako, P. Hancock, and H.Y. Izan. “Factors Influencing Voluntary Corporate Disclosure by Kenyan Companies.” Corp. Gov. Int. Rev. 14 (2006): 107–125. [Google Scholar] [CrossRef]
- J.I. Sicilian. “The Relationship of Board Member Diversity and Organization Performance.” J. Bus. Ethics 15 (1996): 1313–1320. [Google Scholar] [CrossRef]
- D. Carter, B. Simkins, and W. Simpson. “Corporate Governance, Board Diversity and Firm Value.” Financ. Rev. 38 (2003): 33–53. [Google Scholar] [CrossRef]
- M.A. Fields, and P.Y. Keys. “The Emergence of Corporate Governance From Wall St to Main St: Outside Directors, Board Diversity, Earnings Management and Managerial Incentives to Bear Risk.” Financ. Rev. 38 (2003): 1–24. [Google Scholar] [CrossRef]
- B.S. Coffey, and G.E. Fryxell. “Institutional Ownership of Stock and Dimensions of Corporate Social Performance: An Empirical Examination.” J. Bus. Ethics 10 (1991): 437–444. [Google Scholar] [CrossRef]
- P. Cox, S. Brammer, and A. Millington. “An Empirical Examination of Institutional Investor Preferences for Corporate Social Performance.” J. Bus. Ethics 52 (2004): 27–42. [Google Scholar] [CrossRef]
- S.S. Cowen, L.B. Ferreri, and L.D. Parker. “The Impact of Corporate Characteristics on Social Responsibility Disclosure: A Typology and Frequency-Based Analysis.” Account. Organ. Soc. 12 (1987): 111–122. [Google Scholar] [CrossRef]
- A. Nazli, and M. Ghazali. “Ownership Structure and corporate Social Responsibility Disclosure: Some Malaysian Evidence.” Corp. Gov. 7 (2007): 251–266. [Google Scholar]
- P. Arora, and R. Dharwadkar. “Corporate Governance and Corporate Social Responsibility (CSR): The Moderating Roles of Attainment Discrepancy and Organization Slack.” Corp.Gov. Int. Rev. 19 (2011): 136–152. [Google Scholar] [CrossRef]
- A. Belkaoui, and P. Karpik. “Determinants of the Corporate Decision to Disclose Social Information.” Account. Audit. Account. J. 2 (1989): 36–51. [Google Scholar] [CrossRef]
- C. Deegan, and M. Rankin. “The Materiality of Environmental Information to Users of Annual Reports.” Account. Audit. Account. J. 10 (1997): 562–583. [Google Scholar] [CrossRef]
- A. Belal. “Environmental Reporting in Developing Countries: Empirical Evidence from Bangladesh.” Eco-Manag. Audit. (UK) 7 (2000): 114–121. [Google Scholar] [CrossRef]
- J. Guthrie, and L. Parker. “Corporate Social Disclosure Practice: A Comparative International Analysis.” Adv. Public Interest Account. 3 (1990): 159–175. [Google Scholar]
- R.P. Weber. “Basic Content Analysis.” In Sage University Paper Series on Quantitative Applications in the Social Sciences. Beverly Hills, CA, USA; London, UK: Sage, 1988. [Google Scholar]
- D. Hackston, and M.J. Milne. “Some Determinants of Social and Environmental Disclosures in New Zealand Companies.” Account. Audit. Account. J. 9 (1996): 77–108. [Google Scholar] [CrossRef]
- D.M. Patten. “Intra-Industry Environmental Disclosures in Response to the Alaskan Oil Spill: A Note on Legitimacy Theory.” Account. Organ. Soc. 17 (1992): 471–475. [Google Scholar] [CrossRef]
- S.A. Al-Tuwaijri, T.E. Christensen, and K.I. Hughes. “The Relations among Environmental Disclosure, Environmental Performance and Economic Performance: A Simultaneous Equations Approach.” Account. Organ. Soc. 29 (2004): 447–471. [Google Scholar] [CrossRef]
- M. Suttipun, and P. Stanton. “Determinants of Environmental Disclosure in Thai Corporate Annual Reports.” Int. J. Account. Financ. Rep. 2 (2012). [Google Scholar] [CrossRef]
- J. Neter, and M. Kutner. Applied Linear Regression Models. Illinois, IL, USA: Irwin, 1989, pp. 1–220. [Google Scholar]
- J. Neter, M.H. Kutner, C.J. Nachtsheim, and W. Wasserman. Applied Statistical Models, 4th ed. Homewood, IL, USA: Irwin, 1996. [Google Scholar]
- E. Elinda, and N.A. Mohd Ghazali. “Corporate Social Responsibility and Corporate Governance in Malaysian Government-linked Companies.” Corp. Gov. 12 (2012): 292–305. [Google Scholar]
- K.S. Bukhari, H.M. Awan, and F. Ahmed. “An Evaluation of Corporate Governance Practices of Islamic Banks vs. Islamic Bank Windows of Conventional Banks: A Case of Pakistan.” Manag. Res. Rev. 36 (2013): 400–416. [Google Scholar]
- K.M. Habib-Uz-Zaman. “The Effect of Corporate Governance Elements on Corporate Social Responsibility (CSR) Reporting: Empirical Evidence from Private Commercial Banks of Bangladesh.” Int. J. Law Manag. 52 (2010): 82–109. [Google Scholar]
- S. Mustaruddin, Z. Norhayah, and M. Rusnah. “Corporate Social Responsibility Disclosure and its Relation on Institutional Ownership: Evidence from Public Listed Companies in Malaysia.” Manag. Audit. J. 25 (2010): 591–613. [Google Scholar]
- J. Neter, W. Wasserman, and M. Kutner. Applied Linear Regression Models. Edited by D. Richard. Homewood, IL, USA: Irwin, 1983. [Google Scholar]
- D. Gujarati. Basic Econometrics, 3rd ed. New York, NY, USA: McGraw-Hill, 1995. [Google Scholar]
- M.A. Sufian, and M. Zahan. “Ownership Structure and Corporate Social Responsibility Disclosure in Bangladesh.” Int. J. Econ. Financ. Issues 3 (2013): 901–909. [Google Scholar]
© 2015 by the authors; licensee MDPI, Basel, Switzerland. This article is an open access article distributed under the terms and conditions of the Creative Commons Attribution license (http://creativecommons.org/licenses/by/4.0/).