Abstract
Carbon emission intensity is an important index reflecting an entity’s low-carbon competitiveness. This paper presents an extended logarithmic mean divisia index (LMDI) model to dissect carbon intensity within China’s civil aviation from 1998 to 2019, revealing a significant reduction in CO2 emissions per air transport revenue. It attributes this decrease to technological advancements, optimized fleet structures, and improved operational efficiencies, highlighting the impact of larger, more efficient aircraft and enhanced load factors. The study also explores economic factors influencing carbon efficiency, suggesting a comprehensive approach encompassing technological innovation and strategic operational improvements for sustainable aviation development.
1. Introduction
The global imperative to mitigate climate change has necessitated increasingly stringent carbon reduction targets, leading to constrained carbon budgets worldwide. The tightening of carbon allowances has underscored the pivotal role that the remaining space for carbon emissions plays in determining the future competitiveness of entities across various sectors. Among these, the civil aviation sector stands out due to its characteristics of cross-border emissions and rapid growth. According to the International Energy Agency (IEA), aviation emissions increased at an average of 2.3% per year from 1990 to 2019, and the proportion of aviation emissions in the transport sector will gradually increase by 2070 [1]. The Climate Action Tracker (CAT) estimated that international aviation emitted more than 600 million tons of carbon dioxide in 2019, accounting for about 1.2% of global greenhouse gas emissions. The CAT also rated the 2030 climate targets for both international shipping and aviation sectors as critically insufficient and projected that emissions from international aviation will double to triple between 2015 and 2050 [2]. Therefore, international organizations and the public are highly concerned about aviation carbon reduction targets.
Since the 1990s, reducing emissions from civil aviation has been a critical issue in global climate negotiations, culminating in the International Civil Aviation Organization (ICAO) imposing mandatory carbon reduction requirements on international flights. Notably, the 39th General Assembly of the ICAO adopted the Carbon Offsetting and Reduction Scheme for International Aviation (CORSIA) in 2016, marking a significant step towards regulating the sector’s carbon footprint [3]. Furthermore, the 41st ICAO Assembly’s adoption of a long-term global aspirational goal (LTAG) of achieving net-zero carbon emissions by 2050 aligns with the United Nations Framework Convention on Climate Change (UNFCCC) Paris Agreement’s temperature objectives, underscoring the sector’s commitment to combating climate change [4]. ICAO will develop more active and effective measures to reduce emissions in international civil aviation in the future. Given the nature of civil aviation emissions, wherein over 90% originate from the operation of airline aircraft, the sector is at a critical bifurcation, particularly considering its ongoing expansion globally, with China being a notable example of rapid growth [5]. Under these global trends, the imperative for civil aviation is to prioritize the reduction in carbon emission intensity across airlines. This strategy must be pursued vigorously, ensuring that the pace of development within the sector remains unaffected. The dual objectives of sustaining growth while significantly lowering emission intensity present a nuanced challenge, underscoring the necessity for innovative approaches in technological, operational, and policy frameworks that support sustainable aviation practices [6].
While the total carbon emissions of an entity are a critical measure of its environmental impact, this metric alone does not capture the entity’s resource use efficiency or the reasons behind changes in emission levels, which may result from either positive or negative economic growth. This gap highlights the need for more nuanced indicators, such as carbon intensity and carbon efficiency, which account for technological progress, economic development, and structural changes. Carbon intensity, defined as the amount of carbon dioxide emitted per unit of Gross Domestic Product (GDP), offers insights into the relationship between national economic activity and carbon emissions. Conversely, carbon efficiency, which gauges an entity’s carbon emission levels relative to its output, provides a measure of how effectively an entity manages its carbon footprint in relation to its economic performance.
The determinants of carbon efficiency are complex, reflecting the interplay of technical, operational, environmental, and economic factors. Identifying the determinants of carbon emissions constitutes a fundamental step in the strategic formulation of effective emission reduction measures and the optimization of pathways towards low-carbon development. Some scholars have used a variety of methods to analyze the influencing factors of carbon intensity or carbon efficiency, such as the environment/economy single ratio method, the index system method, the data envelopment analysis (DEA) model, and the factor decomposition method [7]. Lee and Worthington employed bootstrap data envelopment analysis truncated regression, providing insights into the technical efficiency of mainstream and low-cost carriers [5]. Yue and Byrne investigated air passenger flows and flight frequency, emphasizing their influence on carbon emissions and efficiency, thereby highlighting the correlation between passenger demand and environmental impact [6]. Li et al. adopted the Virtual Frontier Network Slack-based Measure (SBM) model, which focused on benchmarking and frontier analysis to understand the determinants of airline efficiency [8]. Kwan and Rutherford assessed U.S. domestic airline fuel efficiency, utilizing deterministic and stochastic frontier approaches to comprehensively evaluate the determinants of fuel efficiency and airline performance [9]. Kim and Son analyzed the environmental efficiency of global airlines by continent, providing insights into regional variations in environmental efficiency and the determinants influencing sustainability [10]. Cui addressed airline energy efficiency measures, underscoring the importance of considering aviation carbon emissions and highlighting the relevance of energy efficiency determinants in the aviation sector [11]. Chen et al. conducted an empirical study on environmental efficiency measurements, defining airline environmental efficiency and reflecting on the influencing factors, thus contributing to a comprehensive understanding of determinants in the airline industry [12]. These investigations reveal the critical interplay between passenger demand, operational practices, and sustainability efforts, underscoring the significant impact of technical, operational, environmental, and economic factors on airline performance and environmental footprint.
Building upon this foundation, this paper aims to delve deeper into the specific context of China’s civil aviation industry. This paper employs the logarithmic mean divisia index (LMDI) method to perform a detailed decomposition of carbon intensity in China’s civil aviation sector over a span of two decades (1998–2019). This approach allows for granular analysis of multiple influencing factors, such as load factors and operational efficiencies, by digging into the contribution of each factor and changes over time, providing insights that are more precise than previous studies. Additionally, the extended temporal analysis captures the effects of significant policy and technological changes, offering actionable policy recommendations based on robust, longitudinal data.
2. Methodology
2.1. Estimation Model of CO2 Emissions Intensity of China’s Civil Aviation
To estimate CO2 emissions in the civil aviation industry, methodologies typically fall into two categories: “top-down” and “bottom-up” approaches [13]. This study adopts the “top-down” approach, leveraging aviation-grade kerosene consumption data to calculate CO2 emissions. Following the Intergovernmental Panel on Climate Change (IPCC) guidelines for carbon emission calculations, we identify the primary emission factor by referencing default values specified by the IPCC.
The formula for calculating CO2 emissions intensity is defined as follows:
where the following definitions apply:
- represents the CO2 emission intensity in year for the China civil aviation sector.
- denotes the total CO2 emissions in year for the China civil aviation sector.
- signifies the total air transport revenue for the China civil aviation sector.
- is the annual fuel consumption for China’s civil aviation sector.
- is the emission factor of CO2 for fuel, based on the assumption that the mean molecular formula of aviation fuel (C12H23) results in the production of 3.15 kg of CO2 per kg of fuel consumed.
2.2. Integrated Decomposition Model for Carbon Intensity
This study develops an integrated decomposition model that merges index decomposition analysis (IDA) of carbon intensity with historical operation-based indicators. This approach allows for a nuanced analysis of how individual factors contribute to changes in carbon intensity, situating this within a broader context of CO2 emissions relative to revenue. By analyzing the interplay between carbon efficiency gains and overall energy intensity changes, this model provides a comprehensive framework for understanding the dynamics at play.
Utilizing data on energy consumption, carbon emissions, and operation-based indicators of China’s civil aviation from 1998 to 2019, the model offers a detailed examination of the sector’s evolution over two decades. The model employs the Kaya approach, a formula that breaks down CO2 emissions into components attributable to technological progress, economic affluence, and population scale, by analyzing energy intensity per capita GDP and population factors [14,15].
The logarithmic mean divisia index (LMDI) method was chosen for this study due to its several distinct advantages over other decomposition methods. Firstly, LMDI is recognized for its ability to handle zero and negative values without leading to undefined results, which is a significant limitation in many other index decomposition approaches. This robustness is particularly crucial in the context of analyzing carbon emissions data, which can occasionally include zero or negative changes due to various factors such as operational shifts or policy impacts. Secondly, the LMDI method allows for perfect decomposition without any residual terms. This characteristic ensures that all changes in carbon intensity can be accurately attributed to specific factors, enhancing the clarity and precision of our analysis. By providing a clear and exact breakdown of the contributions from various factors, LMDI offers a comprehensive understanding of the dynamics at play. Furthermore, the LMDI approach is flexible and can be applied to a wide range of multiplicative and additive decomposition analyses, making it a versatile tool for examining changes in energy and environmental indicators [16,17,18]. In the context of China’s civil aviation industry, this flexibility allows for a detailed examination of multiple factors influencing carbon intensity, including technological advancements, operational efficiencies, and economic variables.
The carbon intensity in this study is defined as the ratio of carbon emission to total operating revenue, indicating the amount of carbon emissions produced by an airline for each unit of operating revenue generated. The inverse of this indicator can be used to demonstrate airline carbon efficiency. The carbon intensity model is decomposed in Equation (2), where each variable represents an aspect of China’s civil aviation industry:
where the following definitions apply:
- : Carbon emissions per unit of air operating revenue, providing a metric for assessing the environmental efficiency of aviation operations.
- : Carbon emissions per revenue ton–kilometers, offering a direct measure of emissions relative to air transport operation.
- : Load factor, indicating the utilization efficiency of average aircraft capacity.
- : The average available capacity per flight, which influences fuel consumption and, consequently, carbon emissions.
- : The average transport distance (km), reflecting the operational range and its impact on carbon emissions.
- : The average flights operated by aircraft, reflecting the operational utilization of the aircraft.
- : The ratio of the total number of aircraft to the total operation cost, indicating the cost efficiency of the fleet.
- The ratio of total operation cost to total operation revenue, which reflects the financial efficiency of aviation operations.
This approach provides a comprehensive framework for analyzing the carbon efficiency of China’s civil aviation, integrating operational and economic metrics to assess environmental performance. The seven variables here are mainly based on the assessment indicators of the airliners, which can reflect the operational efficiency of airliners to a certain extent. Among them, and reflect the carbon intensity of the aircraft; , , and reflect the operational management efficiency of airline routes and aircraft; and and reflect the financial management ability of civil aviation. There is a certain correlation between the seven variables, and the change in different variables will also lead to a change in carbon emission intensity. Therefore, it is necessary to find appropriate ways to quantify these effects and use the results to guide future actions to reduce emissions.
In order to measure the contribution of the above factors to the intensity of CO2 emissions, an extended LMDI model is introduced. Equation (2) can be rewritten as follows based on the LMDI model:
Each formula from (3) to (10) represents a different factor’s contribution to the change in CO2 intensity between two time periods (t and 0). These factors include changes in energy intensity, economic structure, and other specified variables. This decomposition aligns with the structure of Formula (2), which expresses CO2 intensity as a product of various factors. By applying these formulas, we can quantitatively assess the impact of each factor on the overall change in CO2 emissions intensity.
The contribution of these seven different indicators to changes in carbon intensity can be rewritten as follows:
Formulas (11)–(17) further refine the analysis by calculating the contribution ratios of the different factors to changes in carbon intensity. These formulas essentially normalize the contributions of each factor (energy efficiency, economic structure, etc.) by the total change in CO2 intensity, allowing for a comparison of the relative importance of each factor.
3. Empirical Study
3.1. Data Collection
The primary data for this study were derived from the “Statistical Data on Civil Aviation of China (1998–2020)” published by the Civil Aviation Administration of China (CAAC, 1998–2020). This comprehensive dataset provides detailed records on national aircraft energy consumption, the total turnover of air transport, types and numbers of aircraft, and annual aircraft movements covering both commercial and charter flights within domestic and international scopes. However, our research specifically focuses on the Chinese civil aviation sector, excluding foreign aircraft operations, to maintain a consistent analytical framework.
When analyzing the development trends of various parameters, we have relied on historical growth patterns observed over the past decades. Notably, the unprecedented disruptions caused by the COVID-19 pandemic represent an abnormal deviation in the sector’s development trajectory. After the outbreak of the epidemic, the global civil aviation traffic decreased significantly. The International Civil Aviation Organization (ICAO) reported a 50% drop in the number of seats provided by airlines in 2020 and a 60% drop in passenger traffic, with 1.8 billion passengers transported worldwide throughout the year compared to 4.5 billion in 2019 [19]. The International Air Transport Association (IATA) forecasts that the global civil aviation industry will not recover to 2019 levels until 2024 [20]. Consequently, this study delineates the impact of the pandemic as beyond its scope.
3.2. Temporal Distribution Characteristics of CO2 Intensity of China’s Civil Aviation
This section examines the fluctuations in CO2 emissions intensity from 1998 to 2019, a period marked by significant growth in China’s civil aviation sector. As identified in Section 2.2, seven independent variables were analyzed concerning their impact on carbon emission intensity, a dependent variable. Among them, the fuel consumption per ton–kilometer and the average capacity per flight are indicators that are directly related to the level of aircraft technology and operational efficiency. Average distance mainly represents the route structure of Chinese civil aviation and the proportion of international routes. Load factor and average flights per aircraft are mainly related to the utilization rate of the aircraft. The ratio of the number of aircraft to the total operating cost is the inverse of the annual operating cost per aircraft and reflects the operating cost of the aircraft. The financial indicators, such as the ratio of the number of aircraft to the total transport cost and the ratio of transportation cost to revenue, offer insights into the economic sustainability of airline operations.
Setting 1998 as the base year with an index value of 100, our analysis reveals a general downward trend in CO2 emissions per unit of air transport revenue despite fluctuations. This trend, illustrated in Figure 1, underscores the sector’s gradual move towards greater carbon efficiency amidst rapid development.
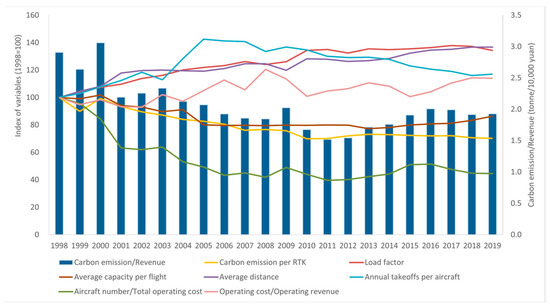
Figure 1.
Trend of carbon emission intensity of China civil aviation during 1998–2019.
3.3. Decomposition Analysis of CO2 Emissions per Unit of Air Transport Revenue
This section provides a detailed decomposition analysis of CO2 emission per air transport revenue for China’s civil aviation sector from 1998 to 2019. The analysis reveals that various factors have differing impacts on carbon intensity changes over time, as shown in Table 1. Basically, it can reflect the positive and negative effects of different variables, as well as the degree of impact.

Table 1.
The decomposition of CO2 emissions per unit of operating revenue.
In addition, the results of the decomposition for each five-year period were further analyzed, as shown in Table 2 and Figure 2. Carbon emissions per revenue ton–kilometer (RTK) and available capacity per flight have changed significantly, reflecting changes in technology and operational efficiency. Significant changes were also observed in the load factor and the ratio of the number of aircraft to total operating costs, indicating improved fleet utilization and cost efficiency. These findings highlight the complex interplay of technological advances, operational practices, and economic factors that have influenced the carbon intensity of Chinese civil aviation over the past two decades.

Table 2.
The contribution of varying effects on CO2 emission by time period.
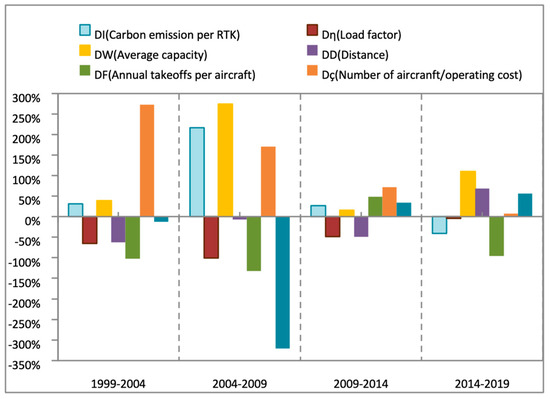
Figure 2.
The contribution of the varying effects on CO2 emission per transport revenue.
This analysis investigates the impact of seven key factors on the carbon intensity trends within China’s civil aviation industry, namely carbon emission per revenue ton–kilometer (RTK), load factor, average capacity per flight, average transport distance, annual takeoffs per aircraft, the ratio of aircraft number to total operating cost, and the ratio of total operating cost to operating revenue. The role of the influencing factors and their trends can be summarized as follows:
The reduction in carbon intensity is largely driven by decreased carbon emissions per RTK. Over the last three decades, particularly since the mid-1990s, China’s civil aviation has witnessed unprecedented growth, with transport turnover increasing annually by more than 10% and RTK rankings second only to the United States. Despite the rapid expansion in transportation scale and associated carbon emissions, there has been a marked decrease in carbon emission intensity, as evidenced by both carbon emissions per transport revenue and per RTK. This demonstrates a significant improvement in carbon efficiency, indicating a progressive decoupling of industry growth from carbon emissions, as illustrated in Figure 3.
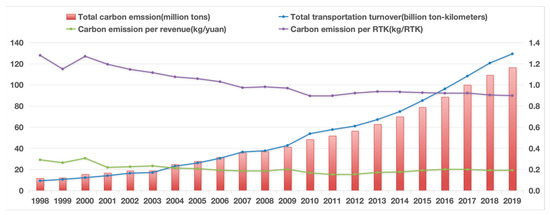
Figure 3.
Trend of total transport turnover, total carbon emission, and carbon intensity of China civil aviation during 1998–2019.
The analysis reveals a significant negative contribution of load factor on carbon intensity. Both passenger and aircraft total load factors have consistently increased over recent decades. This trend, depicted in Figure 4, suggests that higher capacity utilization—carrying more passengers and cargo—enhances operational efficiency. Consequently, this optimization leads to reduced emissions per unit of revenue, underscoring the importance of load factor management in improving the environmental sustainability of aviation operations.
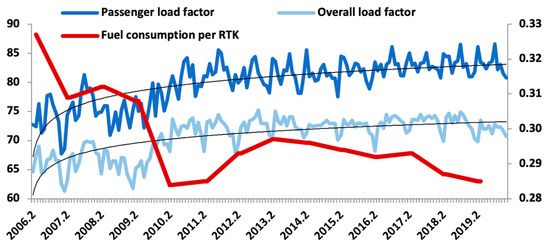
Figure 4.
Average load factor for civil aviation in China.
The analysis suggests that the average capacity of aircraft load per flight positively affects carbon intensity [21,22]. The increasing trend towards larger fleet sizes and a higher proportion of large- and medium-sized aircraft in China implies an enhancement in the average capacity per flight, as shown in Figure 5. However, larger aircraft models inherently produce more emissions due to larger engines and higher fuel consumption, and therefore, need to be optimized in balance with passenger and cargo demand and load factor; otherwise, simply increasing capacity without increasing load factor may result in increased emissions per unit of revenue.
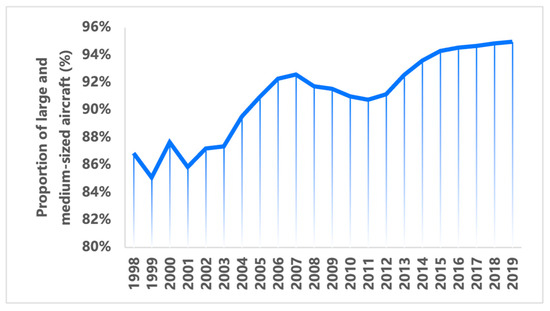
Figure 5.
The proportion of large- and medium-sized aircraft in China’s fleet.
The analysis highlights that average flying distance exerts a slightly negative effect on carbon intensity, implying that longer distances result in lower emissions per unit of revenue, thus enhancing carbon efficiency. Over the last two decades, the expansion of international routes in China has led to an increase in flight distances for both passenger and cargo transport, as depicted in Figure 6. This development has played a part in reducing carbon intensity, underscoring the importance of optimizing route efficiency in contributing to the aviation sector’s environmental sustainability.
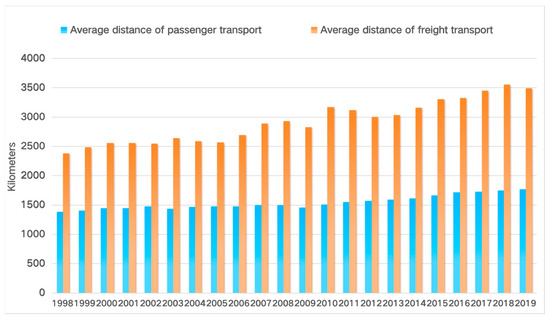
Figure 6.
Average transport distance for civil aviation in China.
The analysis points out that the frequency of annual departures per aircraft inversely affects carbon intensity, indicating higher carbon intensity with fewer departures, hence lower carbon efficiency. This frequency is a critical measure of aircraft utilization efficiency. As shown in Figure 7, Over the past 20 years, there has been an initial increase followed by a decrease in departures per aircraft, suggesting a decline in the utilization rate of transport aviation aircraft since 2005. This trend may stem from an oversaturation of airlines competing for limited routes and flight times, leading to intensified competition.
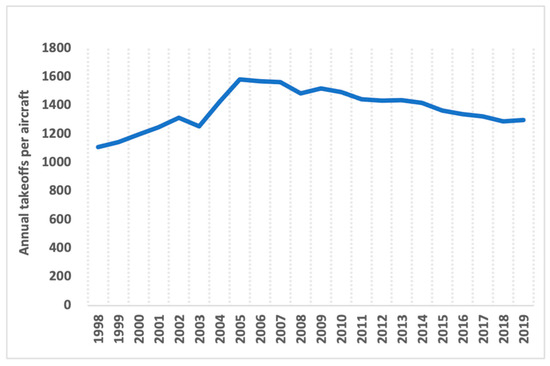
Figure 7.
Annual takeoffs per aircraft in China’s civil aviation.
The analysis highlights a significant relationship between the aircraft-to-operating-cost ratio and carbon emissions per unit of operating revenue, indicating that a higher ratio correlates with increased carbon intensity. The period from 1998 to 2019, illustrated in Figure 8, shows a marked decrease in the ability to support aircraft per unit of cost, implying rising operational costs. In response, airlines have shifted towards newer, more economically and environmentally efficient aircraft, leading to better fuel efficiency and reduced carbon intensity, demonstrating a strategic adaptation to financial and environmental challenges.
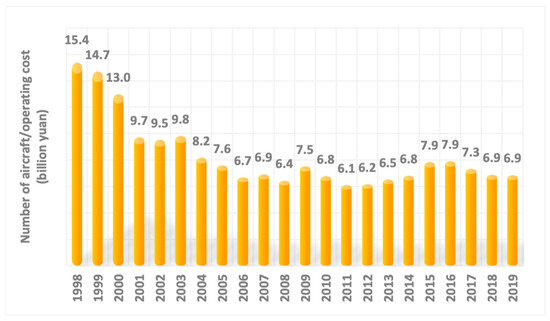
Figure 8.
Ration of aircraft number to total operating cost for civil aviation in China.
The analysis reveals that the ratio of airline operating costs to revenues has a negative impact on carbon intensity. This suggests that an increase in the revenue-to-cost ratio is associated with higher carbon intensity, meaning there are greater carbon emissions per unit of revenue generated, as shown in Figure 9. This relationship underscores the importance of managing operating costs not only for financial sustainability but also for environmental efficiency, highlighting the need for airlines to optimize operations and invest in fuel-efficient technologies to mitigate their carbon footprint.
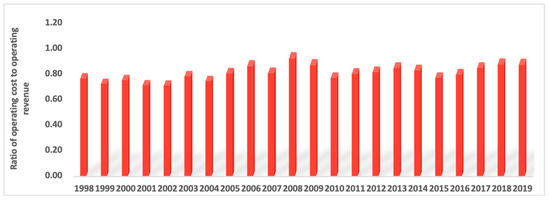
Figure 9.
Ratio of total transport cost to total transport revenue in China’s civil aviation.
4. Policy Implication
The above breakdown of the various factors affecting carbon intensity in aviation suggests that a comprehensive, multifaceted approach is required to develop an effective carbon reduction strategy within the aviation sector. Such a strategy must integrate technological advances, operational improvements, financial strategies, and a commitment to sustainable development to address the complex challenges of carbon emissions.
The cornerstone of reducing emissions lies in advancing aircraft technology. Modernizing fleets by phasing out older models in favor of advanced aircraft equipped with the latest in aerodynamic designs, materials, and propulsion systems, such as new-generation open engines and configurations, is crucial. Moreover, the exploration and integration of clean-power aircraft, including those powered by hydrogen–electric systems, represent a forward-thinking approach to drastically reducing the aviation industry’s carbon footprint. Governments play a pivotal role in fostering these technological advancements through incentives and support for research and development (R&D) efforts focused on next-generation engines and sustainable aviation fuels. These fuels, as short- and medium-term alternatives, are instrumental in the aviation sector’s transition towards greener energy sources, aligning with global trends and international emission reduction mandates.
Enhancing the efficiency of civil aviation operations is another critical component. Airlines can contribute by improving the maintenance and cleaning of aircraft engines, which in turn enhances fuel performance. Optimizing the route network structure is also vital; by focusing on long-haul and international flights and improving airspace utilization, emissions per flight can be significantly reduced. This involves strengthening management to enhance load factors and passenger load factors, thereby increasing operational efficiency and reducing emission intensity. Air traffic control’s continuous advancement in airspace management, including the addition of temporary flight routes and the reduction in the non-linear coefficient of flight routes, further supports this goal by improving the efficiency of aircraft’s horizontal and vertical operations.
Balancing air transportation revenues with costs requires strategic financial planning. Airlines should focus on enhancing flight revenue levels without compromising on operational and environmental efficiencies. This involves adopting strategies that lower operational expenses while maximizing revenue from ton–kilometers, ensuring the economic sustainability of environmental initiatives.
Finally, the aviation sector’s commitment to sustainability is paramount. Beyond technological and operational measures, a significant reduction in emission intensity involves a clean energy transformation. The adoption of sustainable aviation fuels is a critical step in this direction, offering a revolutionary potential to drastically reduce carbon emissions from civil aviation. This shift not only complies with global civil aviation trends but also meets the urgent need for international emission reduction efforts.
5. Conclusions
This paper’s comprehensive analysis through an extended LMDI model reveals significant insights into the carbon intensity dynamics of China’s civil aviation from 1998 to 2019. By decomposing carbon intensity into specific influencing factors, this research digs into the contribution of each factor and changes over time. The extended temporal scope and the detailed factor analysis offer new perspectives and targeted recommendations for reducing carbon emissions in the aviation sector. It demonstrates a substantial decrease in CO2 emissions per air transport revenue, attributing major contributions to technological advancements, fleet optimization, and improved operational efficiencies. The analysis underscores the importance of modernizing aircraft and enhancing load factors as pivotal strategies for reducing carbon intensity. Furthermore, it highlights the economic dimensions of aviation operations, suggesting future challenges in maintaining these gains amid evolving cost structures and emphasizing the need for strategic measures to augment aircraft utilization and sustain environmental progress.
Author Contributions
Conceptualization, methodology, formal analysis, writing—original draft preparation, funding acquisition, J.Y.; validation, investigation, writing—review and editing, M.L.; resources, supervision, K.W., J.G., and Z.T.; project administration, Z.X. and L.C. All authors have read and agreed to the published version of the manuscript.
Funding
The work of this paper was supported by the National Key Research and Development Project (NO.2022YFB2602000) and the National Nature Science Foundation of China (U2333217).
Data Availability Statement
The raw data supporting the conclusions of this article will be made available by the authors on request.
Conflicts of Interest
The authors declare no conflict of interest. The funders had no role in the design of the study; in the collection, analyses, or interpretation of data; in the writing of the manuscript; or in the decision to publish the results.
References
- International Energy Agency (IEA). Energy Technology Perspectives 2020. 2020. Available online: https://iea.blob.core.windows.net/assets/7f8aed40-89af-4348-be19-c8a67df0b9ea/Energy_Technology_Perspectives_2020_PDF.pdf (accessed on 3 January 2024).
- Climate Action Tracker. International Shipping and Aviation Emissions Goals Both “Critically Insufficient”. 2020. Available online: https://climateactiontracker.org/documents/711/CAT_bunkers_webinar_20200625_ZrdXKAf.pdf (accessed on 3 January 2024).
- International Civil Aviation Organization. Resolution A41-22: Consolidated Statement of Continuing ICAO Policies and Practices Related to Environmental Protection—Carbon Offsetting and Reduction Scheme for International Aviation (CORSIA). 2016. Available online: https://www.icao.int/environmental-protection/CORSIA/Documents/Resolution_A41-22_CORSIA.pdf (accessed on 3 January 2024).
- International Civil Aviation Organization. Resolution A41-21: Consolidated Statement of Continuing ICAO Policies and Practices Related to Environmental Protection—Climate Change. 2022. Available online: https://www.icao.int/environmental-protection/Documents/Assembly/Resolution_A41-21_Climate_change.pdf (accessed on 30 January 2024).
- Lee, B.; Worthington, A. Technical efficiency of mainstream airlines and low-cost carriers: New evidence using bootstrap data envelopment analysis truncated regression. J. Air Transp. Manag. 2014, 38, 15–20. [Google Scholar] [CrossRef]
- Yue, X.; Byrne, J. Linking the determinants of air passenger flows and aviation-related carbon emissions: A European study. Sustainability 2021, 13, 7574. [Google Scholar] [CrossRef]
- Zhou, P.; Ang, B.W.; Poh, K.L. A Survey of Data Envelopment Analysis in Energy and Environmental Studies. Eur. J. Oper. Res. 2008, 189, 1–18. [Google Scholar] [CrossRef]
- Li, Y.; Wang, Y.; Cui, Q. Evaluating airline efficiency: An application of virtual frontier network SBM. Transp. Res. Part E Logist. Transp. Rev. 2015, 81, 1–17. [Google Scholar] [CrossRef]
- Kwan, I.; Rutherford, D. Assessment of U.S. domestic airline fuel efficiency since 2010. Transp. Res. Rec. J. Transp. Res. Board 2015, 2501, 1–8. [Google Scholar] [CrossRef]
- Kim, H.; Son, J. Analyzing the environmental efficiency of global airlines by continent for sustainability. Sustainability 2021, 13, 1571. [Google Scholar] [CrossRef]
- Cui, Q. Airline energy efficiency measures using a network range-adjusted measure with unified natural and managerial disposability. Energy Effic. 2020, 13, 1195–1211. [Google Scholar] [CrossRef]
- Chen, Y.; Li, L.; Yu, J.; Tsai, S.; Wang, J. An empirical study on environmental efficiency measurements and influencing factors. Ecol. Chem. Eng. S 2020, 27, 543–553. [Google Scholar] [CrossRef]
- Cai, B.; Yang, W.; Cao, D.; Liu, L.; Zhou, Y.; Zhang, Z. Estimates of China’s national and regional transport sector CO2 emissions in 2007. Energy Policy 2012, 41, 474–483. [Google Scholar] [CrossRef]
- Kaya, Y. Impact of Carbon Dioxide Emission Control on GNP Growth: Interpretation of Proposed Scenarios; IPCC Energy and Industry Subgroup, Response Strategies Working Group: Paris, France, 1989. [Google Scholar]
- Pui, K.L.; Othman, J. The influence of economic, technical, and social aspects on energy-associated CO2 emissions in Malaysia: An extended Kaya identity approach. Energy 2019, 181, 468–493. [Google Scholar] [CrossRef]
- Yang, J.; Cai, W.; Ma, M.; Li, L.; Liu, C.; Ma, X.; Chen, X. Driving forces of China’s CO2 emissions from energy consumption based on Kaya-LMDI methods. Sci. Total Environ. 2020, 711, 134569. [Google Scholar] [CrossRef] [PubMed]
- Ang, B.W. The LMDI approach to decomposition analysis: A practical guide. Energy Policy 2005, 33, 867–871. [Google Scholar] [CrossRef]
- Li, J.; Zeng, T. Analysis on Yunnan Carbon Emission Factors Based on Kaya Identity. Sci. Technol. Manag. Res. 2016, 36, 260–266. [Google Scholar] [CrossRef]
- International Civil Aviation Organization. Presentation of 2020 Air Transport Statistical Results. 2020. Available online: https://www.icao.int/annual-report-2020/Documents/ARC_2020_Air%20Transport%20Statistics_final_sched.pdf (accessed on 30 January 2024).
- International Air Transport Association. Air Passenger Numbers to Recover in 2024. 2022. Available online: https://www.iata.org/contentassets/0276e81943f34f12b515bf84eb42b60b/2022-03-01-01-cn.pdf (accessed on 30 January 2024).
- Morrell, P. The potential for European aviation CO2 emissions reduction through the use of larger jet aircraft. J. Air Transp. Manag. 2009, 15, 151–157. [Google Scholar] [CrossRef]
- Liu, X.; Hang, Y.; Wang, Q.; Zhou, D. Drivers of civil aviation carbon emission change: A two-stage efficiency-oriented decomposition approach. Transp. Res. Part D Transp. Environ. 2020, 89, 102612. [Google Scholar] [CrossRef]
Disclaimer/Publisher’s Note: The statements, opinions and data contained in all publications are solely those of the individual author(s) and contributor(s) and not of MDPI and/or the editor(s). MDPI and/or the editor(s) disclaim responsibility for any injury to people or property resulting from any ideas, methods, instructions or products referred to in the content. |
© 2024 by the authors. Licensee MDPI, Basel, Switzerland. This article is an open access article distributed under the terms and conditions of the Creative Commons Attribution (CC BY) license (https://creativecommons.org/licenses/by/4.0/).