1. Introduction
Typical supersonic transport (SST) configurations have wings with large backward-swept angles such as a delta, arrow, and backward-swept wings. This design aims to reduce wave drag at transonic and supersonic speeds. Numerous studies regarding the aerodynamic design of SSTs were performed considering the utilization of wings with large backward-swept angle [
1,
2]. In the United States, the National Aeronautics and Space Administration (NASA) launched the X-59 QuessT (Quiet SuperSonic Technology) project in 2018 to demonstrate advanced low-boom flight technologies. X-59 is equipped with wings with large backward-swept angles. [
1] discusses the comparison between computational fluid dynamics (CFD) and wind tunnel experiment concerning the X-59. In [
2], a robust low-boom design method using reversed equivalent area based on off-body pressure distribution was proposed to consider off-track sonic boom. This method was applied to an SST configuration with an arrow wing and without a tail wing and engine. However, these wings with large sweep angles have difficulty significantly reducing sonic boom because of the lift caused by the horizontal tail and the tip of the main wing, located near the tail wing. Thus, the backward-swept wing cannot be realized with ideal equivalent cross-sectional area distribution along the longitudinal direction, which is called “Darden’s rule”, for sonic boom reduction. Therefore, innovative and unconventional configurations are expected to reduce drag and sonic boom simultaneously.
Forward-swept wings remain a potential concept for low-drag, low-boom SST configurations. In a supersonic cruise, the aerodynamic center of the forward-swept wing shifts forward. Therefore, the horizontal tail wing requires a positive lift. This indicates that a forward-swept wing can potentially solve the trimming issue [
3]. However, there is little research concerning an SST with forward-swept wings. Originally, forward-swept wings had been studied for the improvement in the maneuverability of fighter jets and for the reduction in the drag under the transonic flight as backward-swept wings. In the 1980s, Grumman Aerospace Corporation built an advanced technology demonstrator called “X-29” with a forward-swept wing and it was flight tested in 1991 by NASA and the United States Air Force (USAF) for tomorrow’s fighter jet [
4]. From an aerodynamic perspective, the integration of aeroelastically tailored composites, a close coupled, variable incidence canard, relaxed static stability, variable wing camber in conjunction with a thin supercritical airfoil, Reynolds number effects at high angles of attack and the implementation of three surface trimming were demonstrated [
5]. In the 2010s, the German Aerospace Center (DLR) proposed a concept of a transonic transport “LamAiR” with forward-swept wings which had low drag due to a natural laminar flow [
6].
We performed a parametric study to investigate the relationship between the sonic boom performance and backward-swept/forward-swept angle [
7]. The results showed that the forward-swept wing could reduce the sonic boom strength owing to the stepwise-pattern pressure signature of the trailing boom while maintaining an equal level of aerodynamic drag as the backward-swept wing. In addition, optimal airfoil distributions for the forward-swept and backward-swept wings were designed using multi-objective optimization based on the evolutionary algorithm (EA). The forward-swept wing obtained a lower-boom solution than the conventional backward-swept wing [
8].
In general, the sonic boom derives from the volume and lift. The sonic boom owing to the volume can be reduced by considering the equivalent area distribution owing to the volume along the body axis. However, there is limited room for the improvement in the equivalent area distribution owing to the volume, for the constraints to provide sufficient cabin and cargo space for passengers. On the other hands, the sonic boom owing to the lift can be reduced by considering the equivalent area distribution owing to the lift along the body axis which was directly affected by the lift distribution. In this study, we focused on the redesign of the lift distribution to reduce the sonic boom.
There are several methodologies for low-boom design. In [
8], the sonic boom strength was defined as an objective function as well as drag, wing geometry was directly optimized using the EA. While this approach facilitates the discovery of low boom solutions, improving the local pressure signature artificially without a thorough review of the design space remains challenging. Another technique for low boom design involves a theoretical approach. One of the established theoretical methods is based on the Seebass George Darden (SGD) theory [
9,
10]. The SGD theory transforms the ideal pressure waveform associated with a low boom into an equivalent area distribution using Whitham’s
function [
11]. In [
12], the wing planform was optimized to minimize the drag and sonic boom strength. This was accomplished by employing an improved
function that considers trim capability in conjunction with the EA. These theoretical approaches enable the enhancement of the local pressure signature by comparing it to the target equivalent distribution.
From an aerodynamic perspective, there is scope for a forward-swept wing to reduce the sonic boom. This is a stronger pressure-increase that affects the leading part of the boom signature than that of the backward-swept wing. Thus, the optimal wing design could not significantly reduce the drag and sonic boom strength simultaneously [
8]. Therefore, for a forward-swept wing, a reduction in the pressure-increase in the boom signature at the leading part or further improvement of the boom signature at the trailing part is required.
One of the leading boom reduction methods is the application of a canard wing configuration. The canard wing generates lift at the front of the body. This allows for a wider range of lift distribution designs. This indicates the feasibility of improving the boom signature at the leading part and reducing the trim drag. Several studies have been conducted on canard wings [
13,
14,
15]. [
13] discussed an integrated design method for wing-fuselage canard wing configurations using the adaptive range multi-objective genetic algorithm (ARMOGA) [
16]. In [
14], the lift-to-drag ratio and sonic boom strength in a supersonic cruise were improved by applying a canard wing to a supersonic business jet (SSBJ) with an arrow wing. In [
15], only canard wings were designed considering their structural, thermal, and aeroelastic performance. Although this type of knowledge is effective as a fundamental understanding, there is negligible research focused on the aerodynamics of SSTs with canard and forward-swept wings.
Thus, this study aims to obtain design knowledge for an SST with a forward-swept wing to improve the pressure-increase affecting the leading part of the boom signature. We improved the equivalent area distribution of the SST-applied canard wing using a forward-swept wing. To improve the equivalent area distribution, we compared the target equivalent area distribution based on the SGD theory with the total equivalent area calculated from the CFD-based lift distribution and the cross-sectional distribution along the body axis.
Excluding this introduction, this paper consists of four chapters. In Chapter 2, we describe the details of the SSBJ as the design target. Chapter 3 introduces the methodology of this study, such as the evaluation methods of the aerodynamics and sonic boom and low-boom design method based on the equivalent area distribution. Chapter 4 presents the results and discussion. In this chapter, the equivalent area distributions and pressure signatures for several configurations were compared. Finally, Chapter 5 discusses the conclusions of this study.
4. Results and Discussion
4.1. Equivalent Area Distribution of Baseline Configuration and Target Equivalent Area Distribution
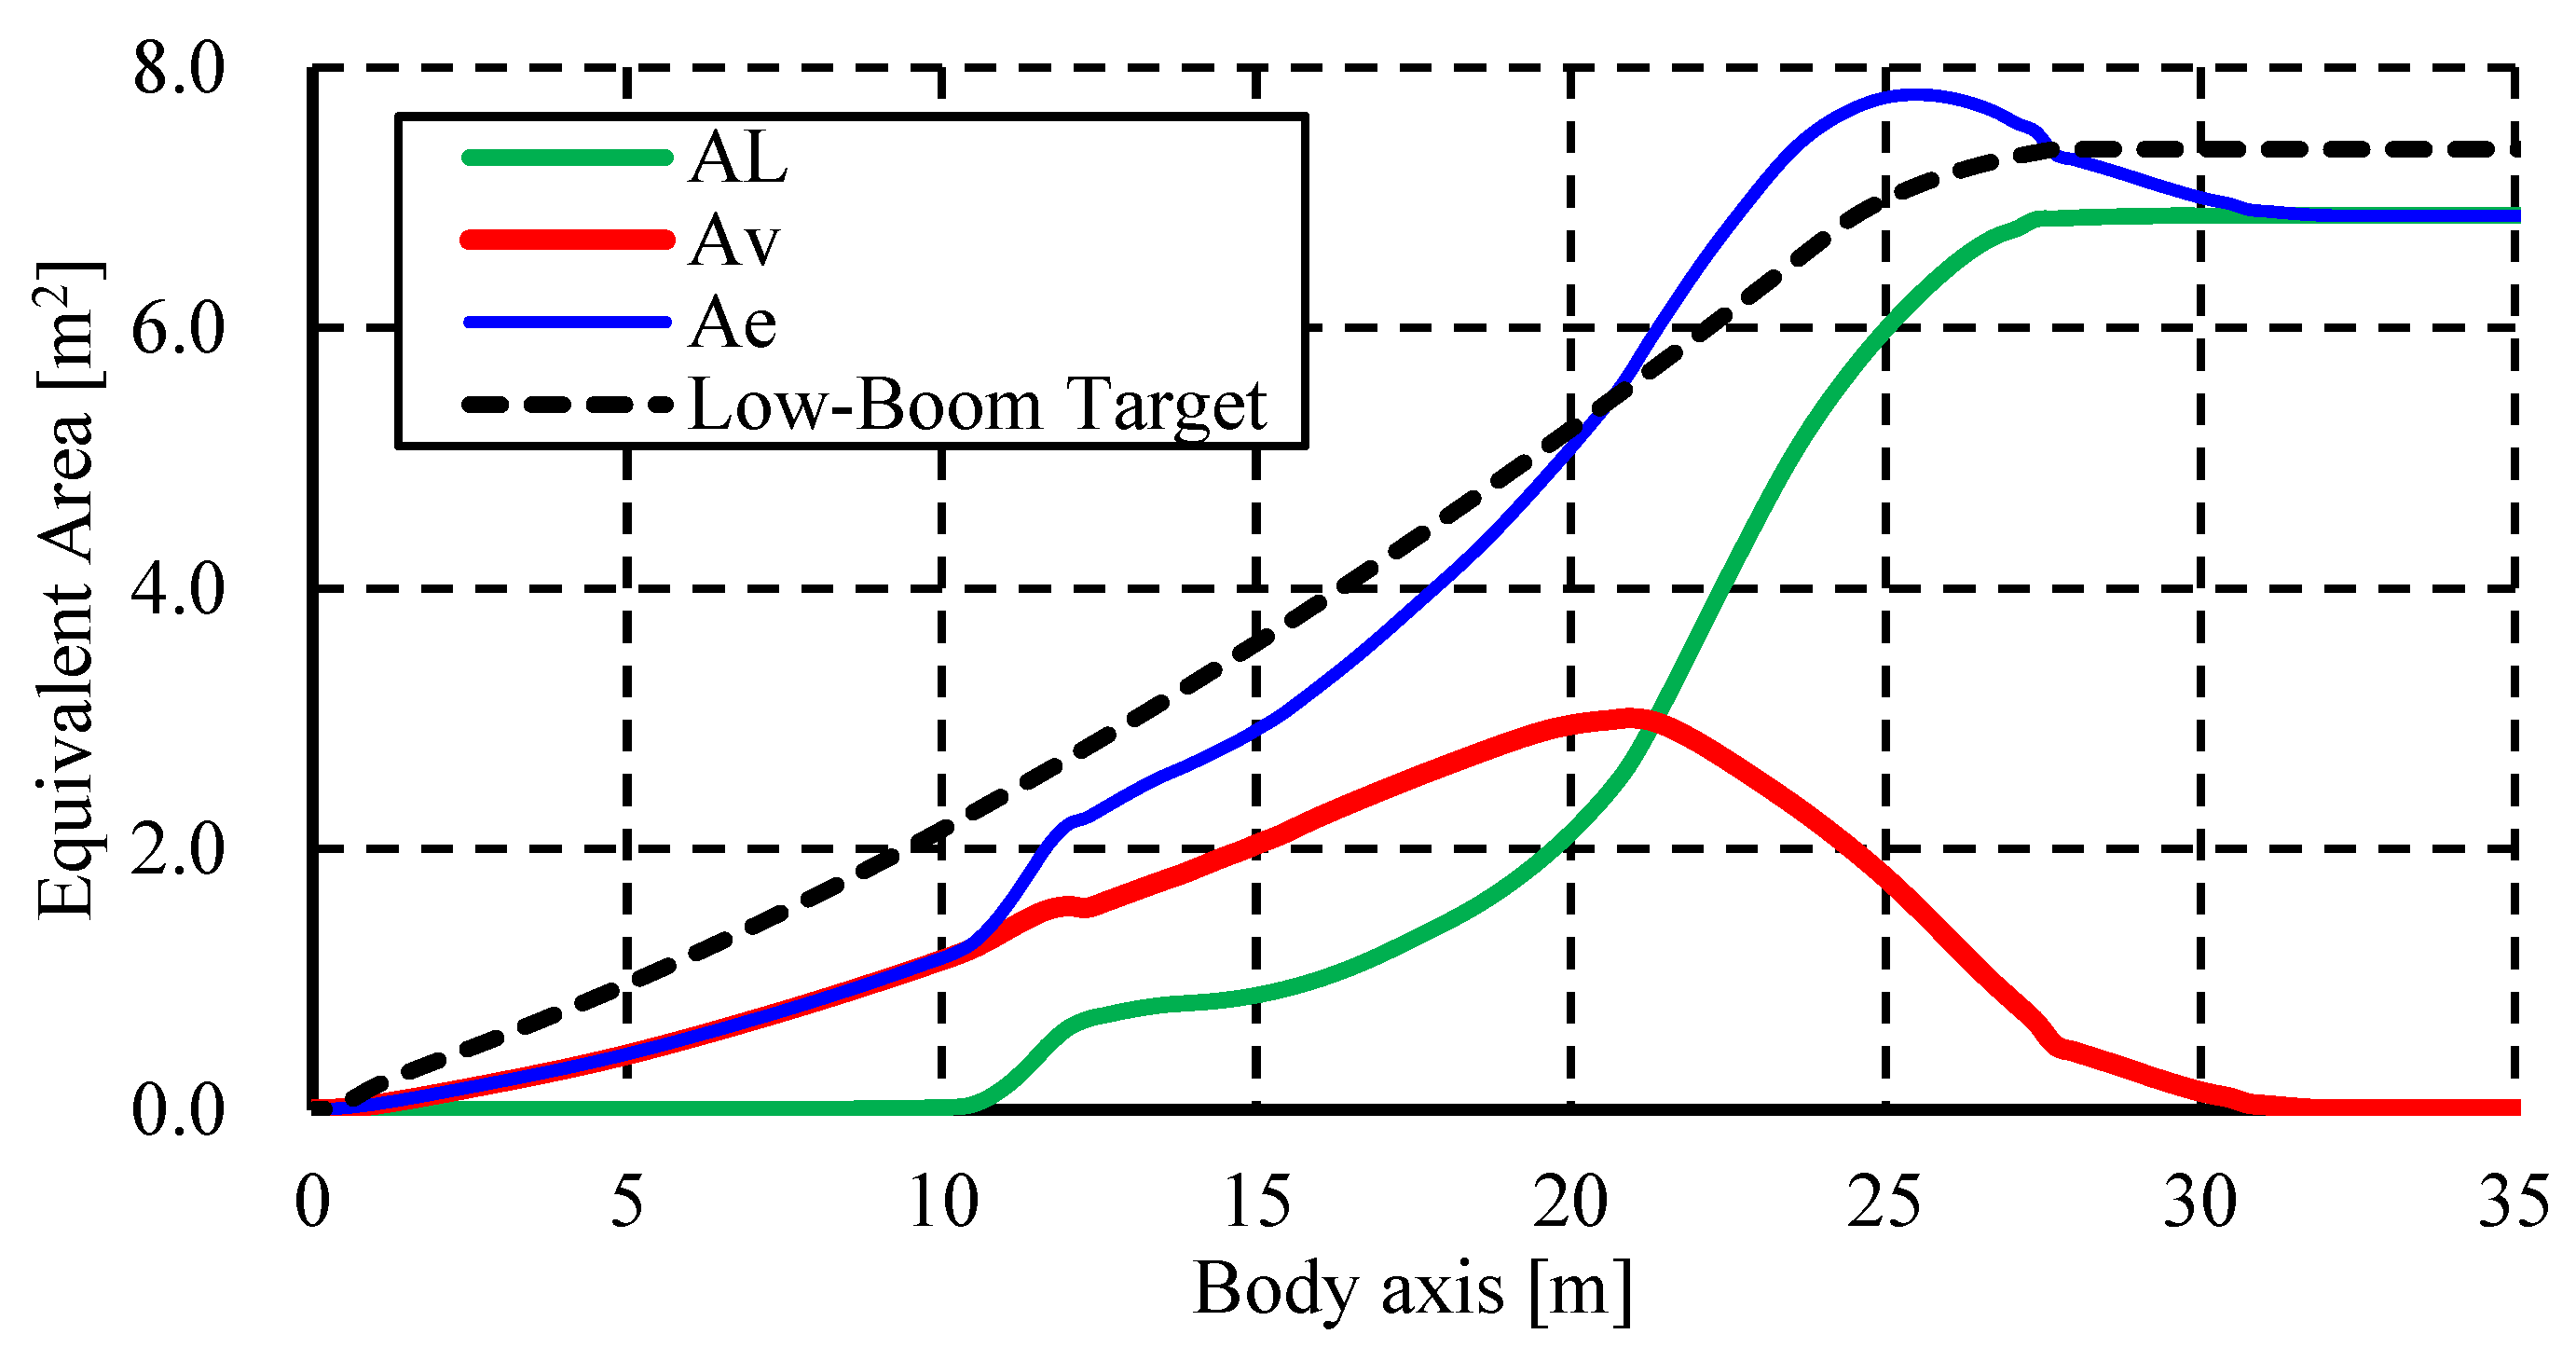
Figure 5 shows the equivalent area distribution of the Baseline configuration owing to the lift, that owing to the volume, the total equivalent area distribution of this configuration, and the target equivalent area distribution. After the total equivalent area distribution increased monotonically to 10 m, because of the increase in the equivalent area distribution owing to the volume, the gradient of the total equivalent area distribution increased from 10 m to 12 m. This occurred because the canard wing generated lift, and the equivalent area distribution owing to the lift increased. Behind the canard wing, the gradient of the total equivalent area distribution decreased, and the total equivalent area distribution increased monotonically.
From the leading edge of the wing, located at a distance of approximately 15 m, the gradient of the equivalent area distribution became large. This occurred because the equivalent area distribution owing to the lift caused by the wing was added to that owing to the volume, which increased monotonically from the nose. From the leading edge of the kink of the wing (located at a distance of approximately 21 m), the equivalent area distribution owing to the volume decreased, and the gradient of the equivalent area distribution owing to the lift increased. At this time, the gradient of the total equivalent area distribution remained constant. This was because of the decrease in that owing to the volume and the increase in that owing to the lift canceled out. The gradient of the equivalent area distribution owing to the lift became gentle at 24 m. Thus, the total equivalent area distribution attained a maximum value near 25 m. This was because the decrease in the equivalent area distribution owing to the volume was larger than the increase in that owing to the lift. Until the trailing edge of the wing was located at approximately 28 m, the decrease in the equivalent area distribution owing to the volume and the increase in that owing to that lift continued to cancel each other out, and the total equivalent area distribution decreased gradually. The total equivalent area distribution decreased linearly with the decrease in the equivalent area distribution owing to the volume. This occurred because the equivalent area distribution owing to lift became constant owing to the absence of a horizontal tail wing behind 28 m. Finally, the total equivalent area distribution became constant behind 30.77 m (the tail end of the aircraft).
4.2. Target Equivalent Area Distribution and Redesign Principle
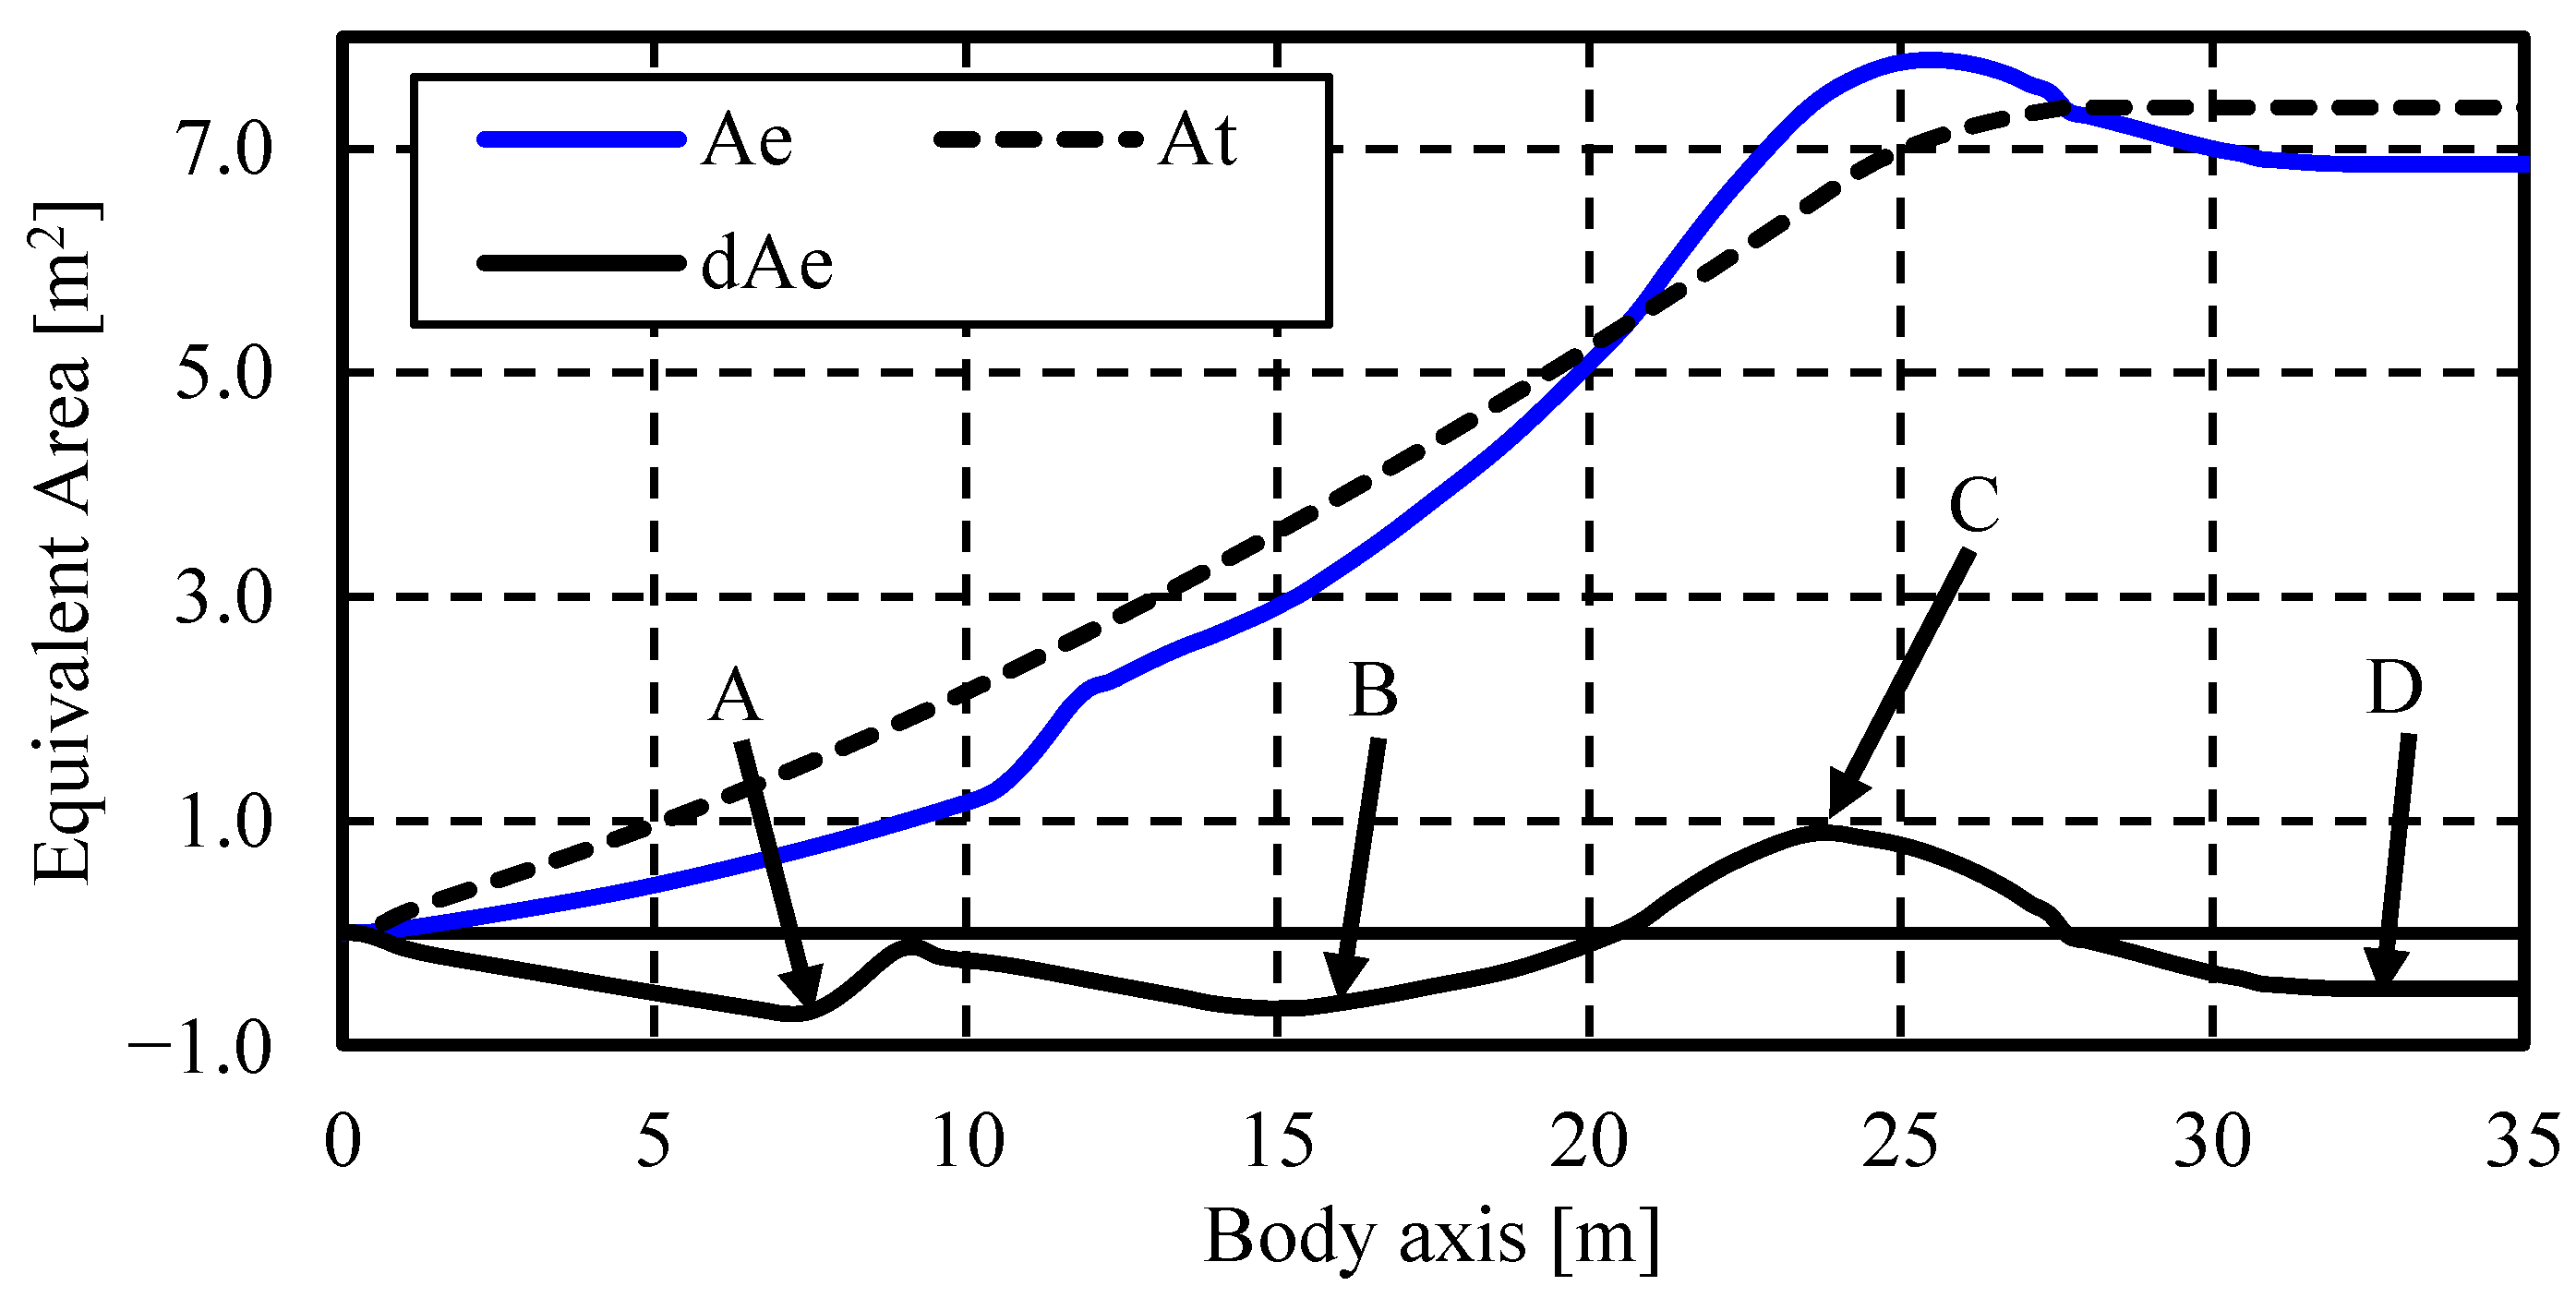
Figure 6 shows the total equivalent area distribution for the Baseline configuration
, target equivalent area distribution
, and the difference between them along the body axis
. Four large regions of
were identified: regions A (0–9 m), B (9–20 m), C (20–28 m), and D (≥28 m). To reduce the strength of the sonic boom, we redesigned the aircraft geometry by minimizing the area enclosed by the
curve and body axis. However, region D was not considered in this study. This was because it was not feasible to reduce the area enclosed by the
curve and body axis in this region without redefining the weight of the aircraft and target equivalent area distribution.
Region A was located between the nose and the leading edge of the canard wing. Therefore, we attempted to reduce the area enclosed by the curve and body axis in this region by shifting the lift caused by shifting the canard wing forward. Region B was located between the rear of the canard wing and the leading edge of the kink on the wing. To reduce the area enclosed by the curve and body axis in this region, it was necessary to increase the lift at the front of the wing because . Region C was located between the leading and trailing edges of the kink in the wing. In this region, we redesigned the geometry of the aircraft to decrease the maximum value of because .
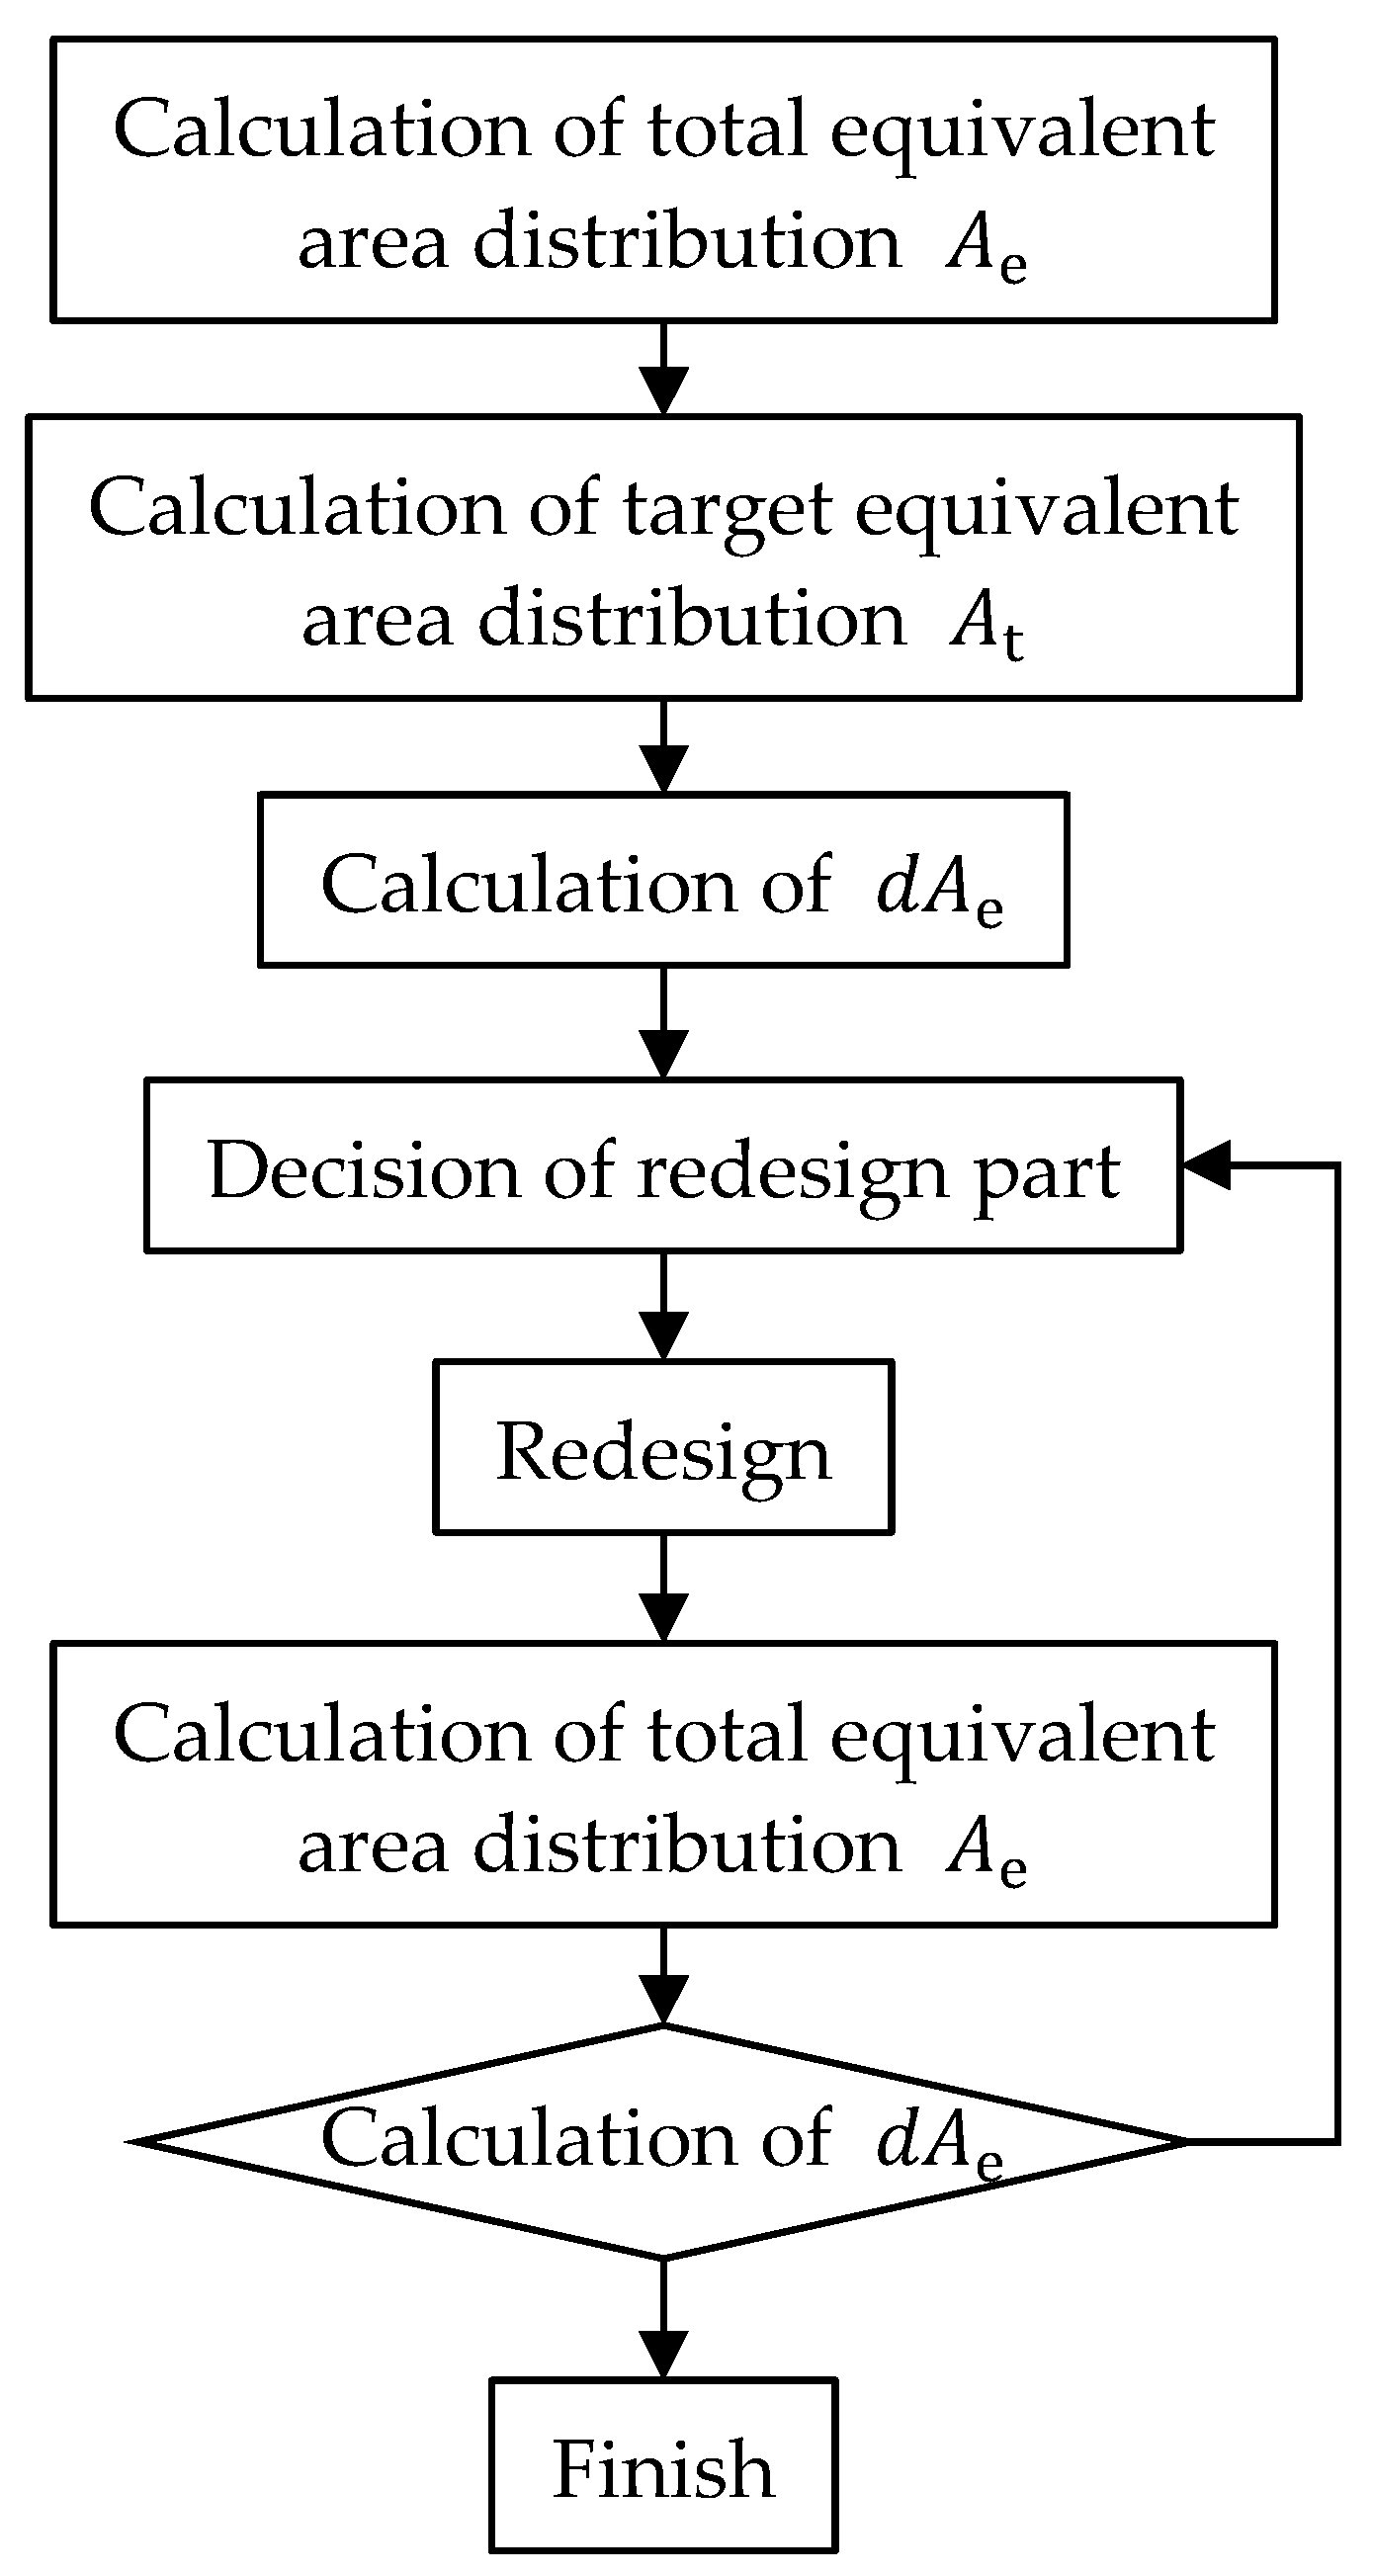
To achieve this, we sequentially redesigned the geometry of the aircraft using the following three steps for each of the three regions:
For region A, we shifted the position of the canard wing forward from the Baseline configuration and then shifted the lift distribution of the canard wing forward.
For region B, while maintaining the wing span length constant, we moved the position of the kink inside the wing to increase the wing area of the outboard wing with a forward-swept angle and shift the lift distribution forward. Simultaneously, we increased the chord length of the kink and modified that of the root to maintain a constant wing area.
For region C, we further stretched the chord length of the kink and expanded the wing area of the forward-swept wing to reduce the maximum value of and make its gradient gentler. This also shifted the lift distribution forward and strengthened the effect of Step 2. In addition, we decreased the leading edge swept-back angle and the chord length of the root to decrease the wing area of the inboard wing. This canceled out the increase in the outboard wing area. We also moved the wing-mounted position backward to shift the lift distribution caused by the wing backward and further reduce the maximum value of .
4.3. Local Lift Distributions of Redesigned Configurations
To improve regions A, B, and C in
Figure 6, the redesign was conducted three times based on Steps 1, 2, and 3 in the previous section. We named these configurations “desC1”, “desW1”, and “desW2”, respectively. In addition, a configuration without the canard wing, “w/o canard”, was evaluated.
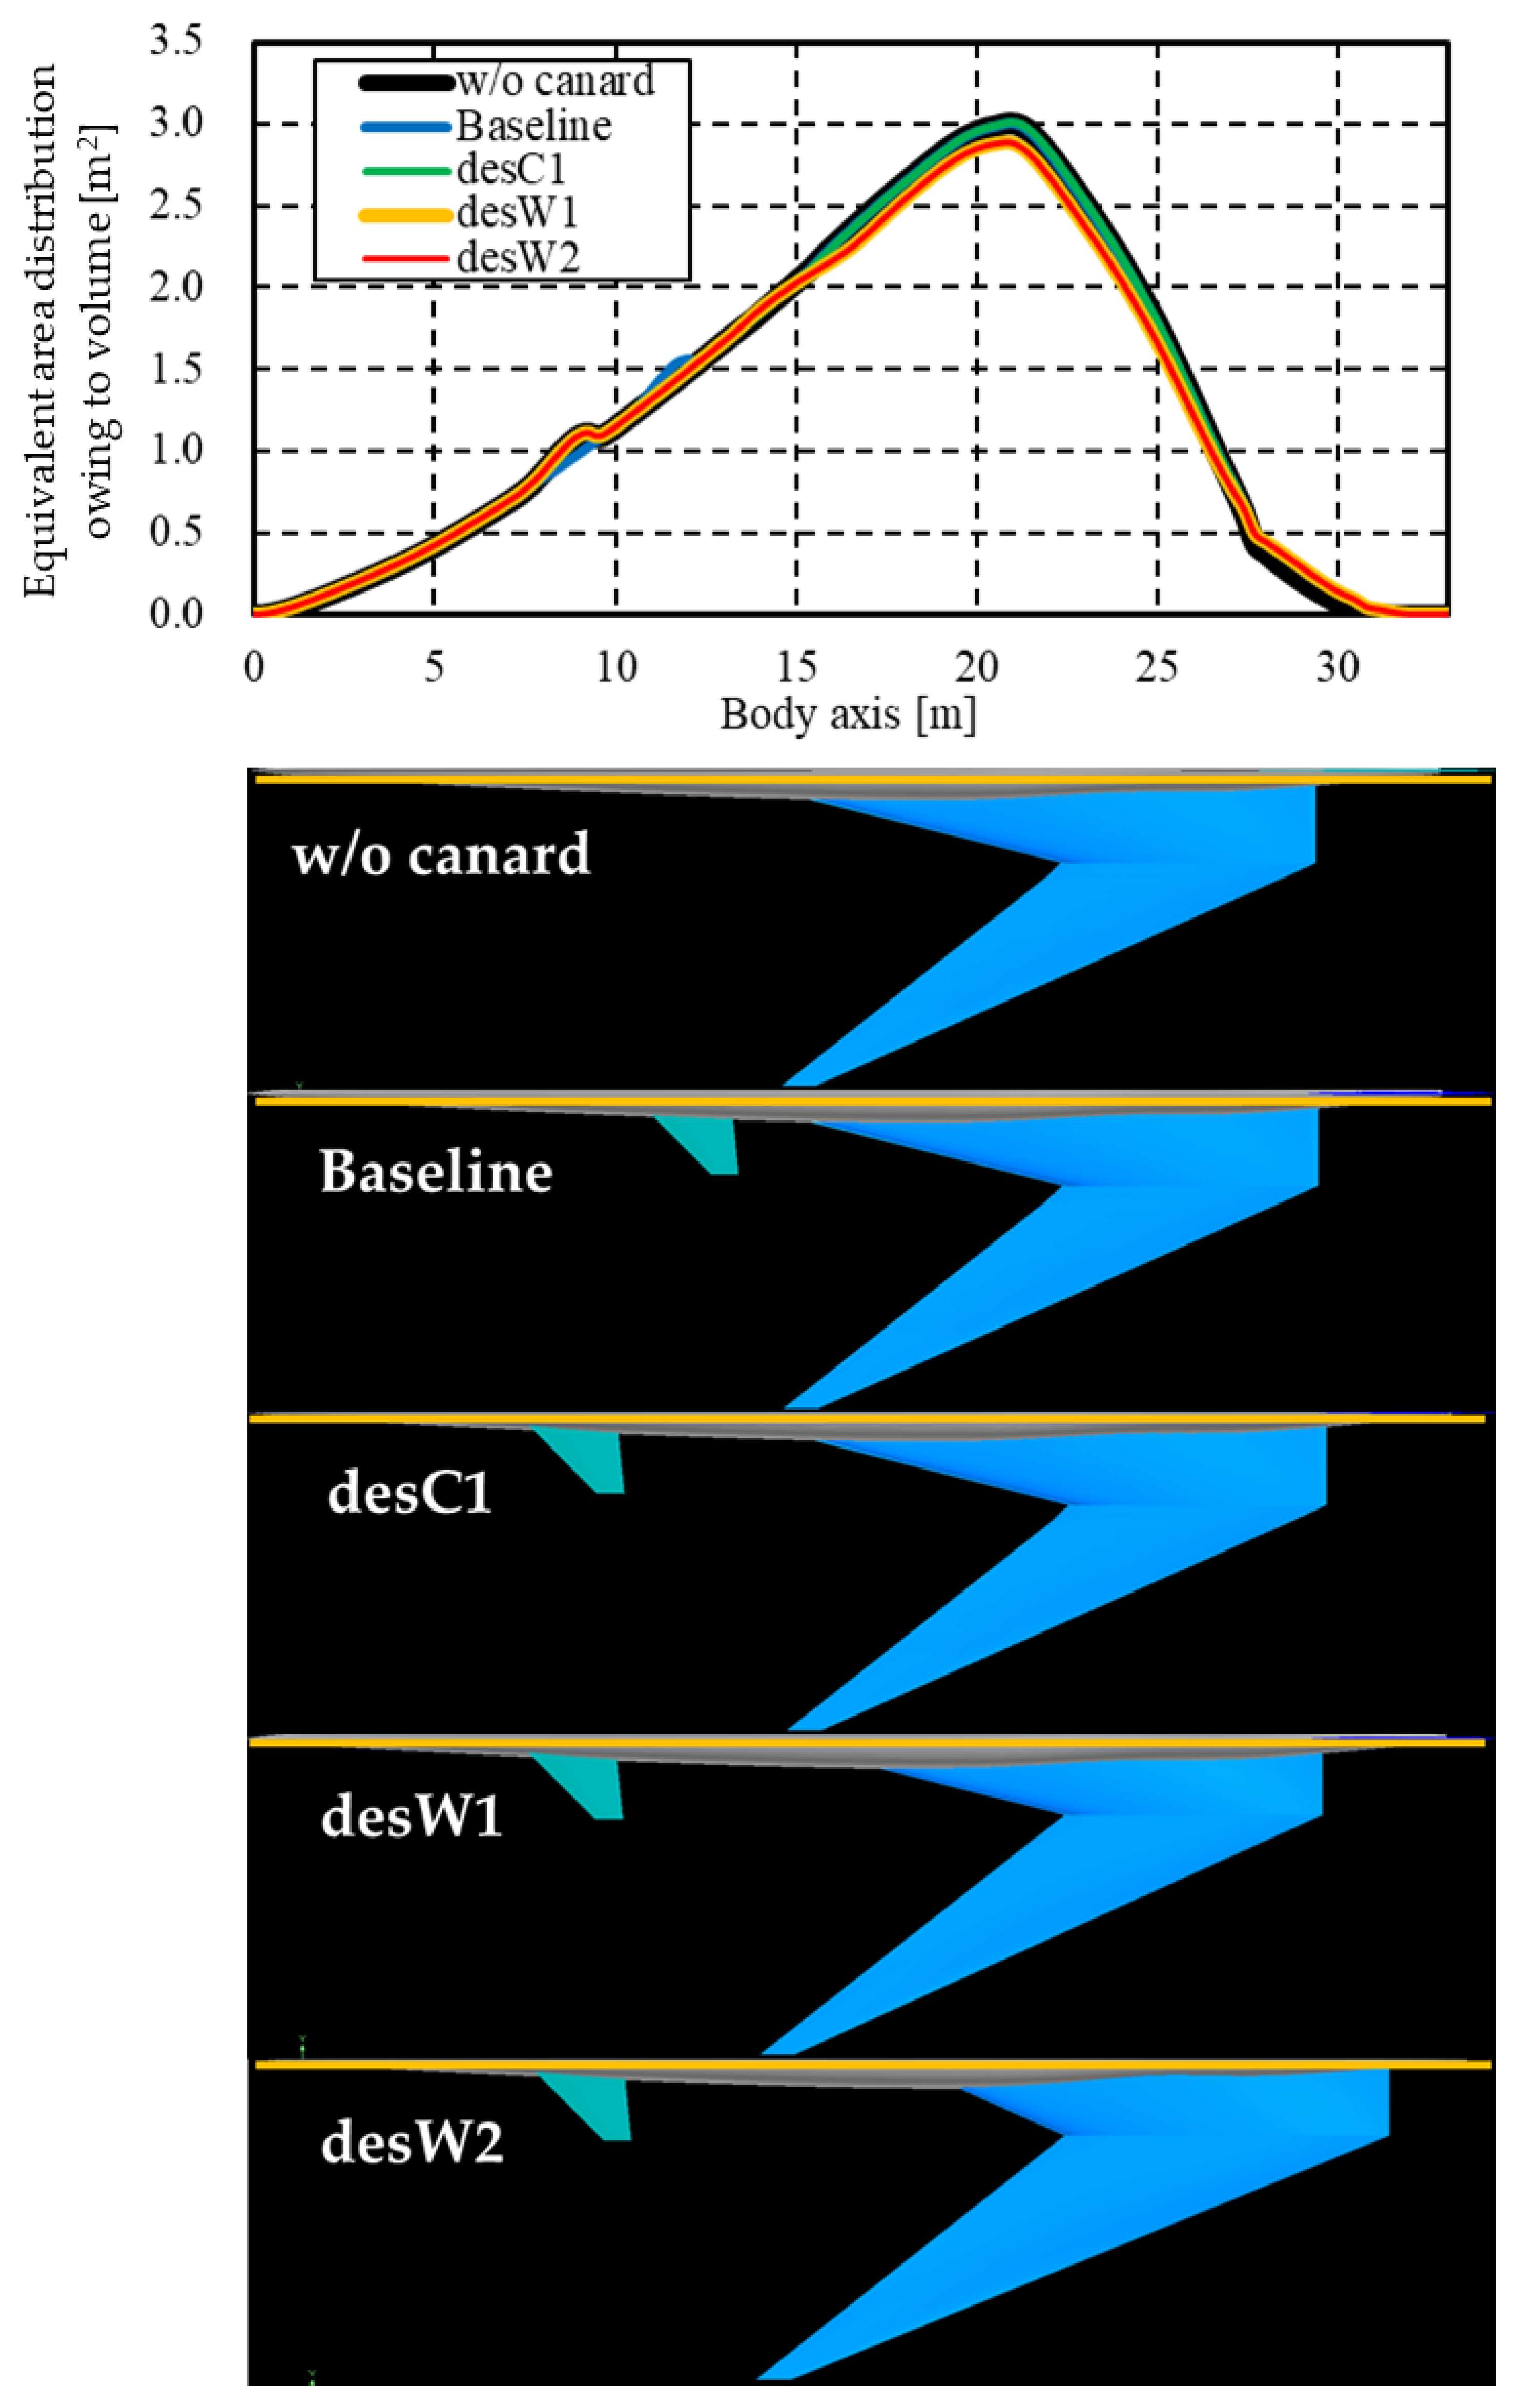
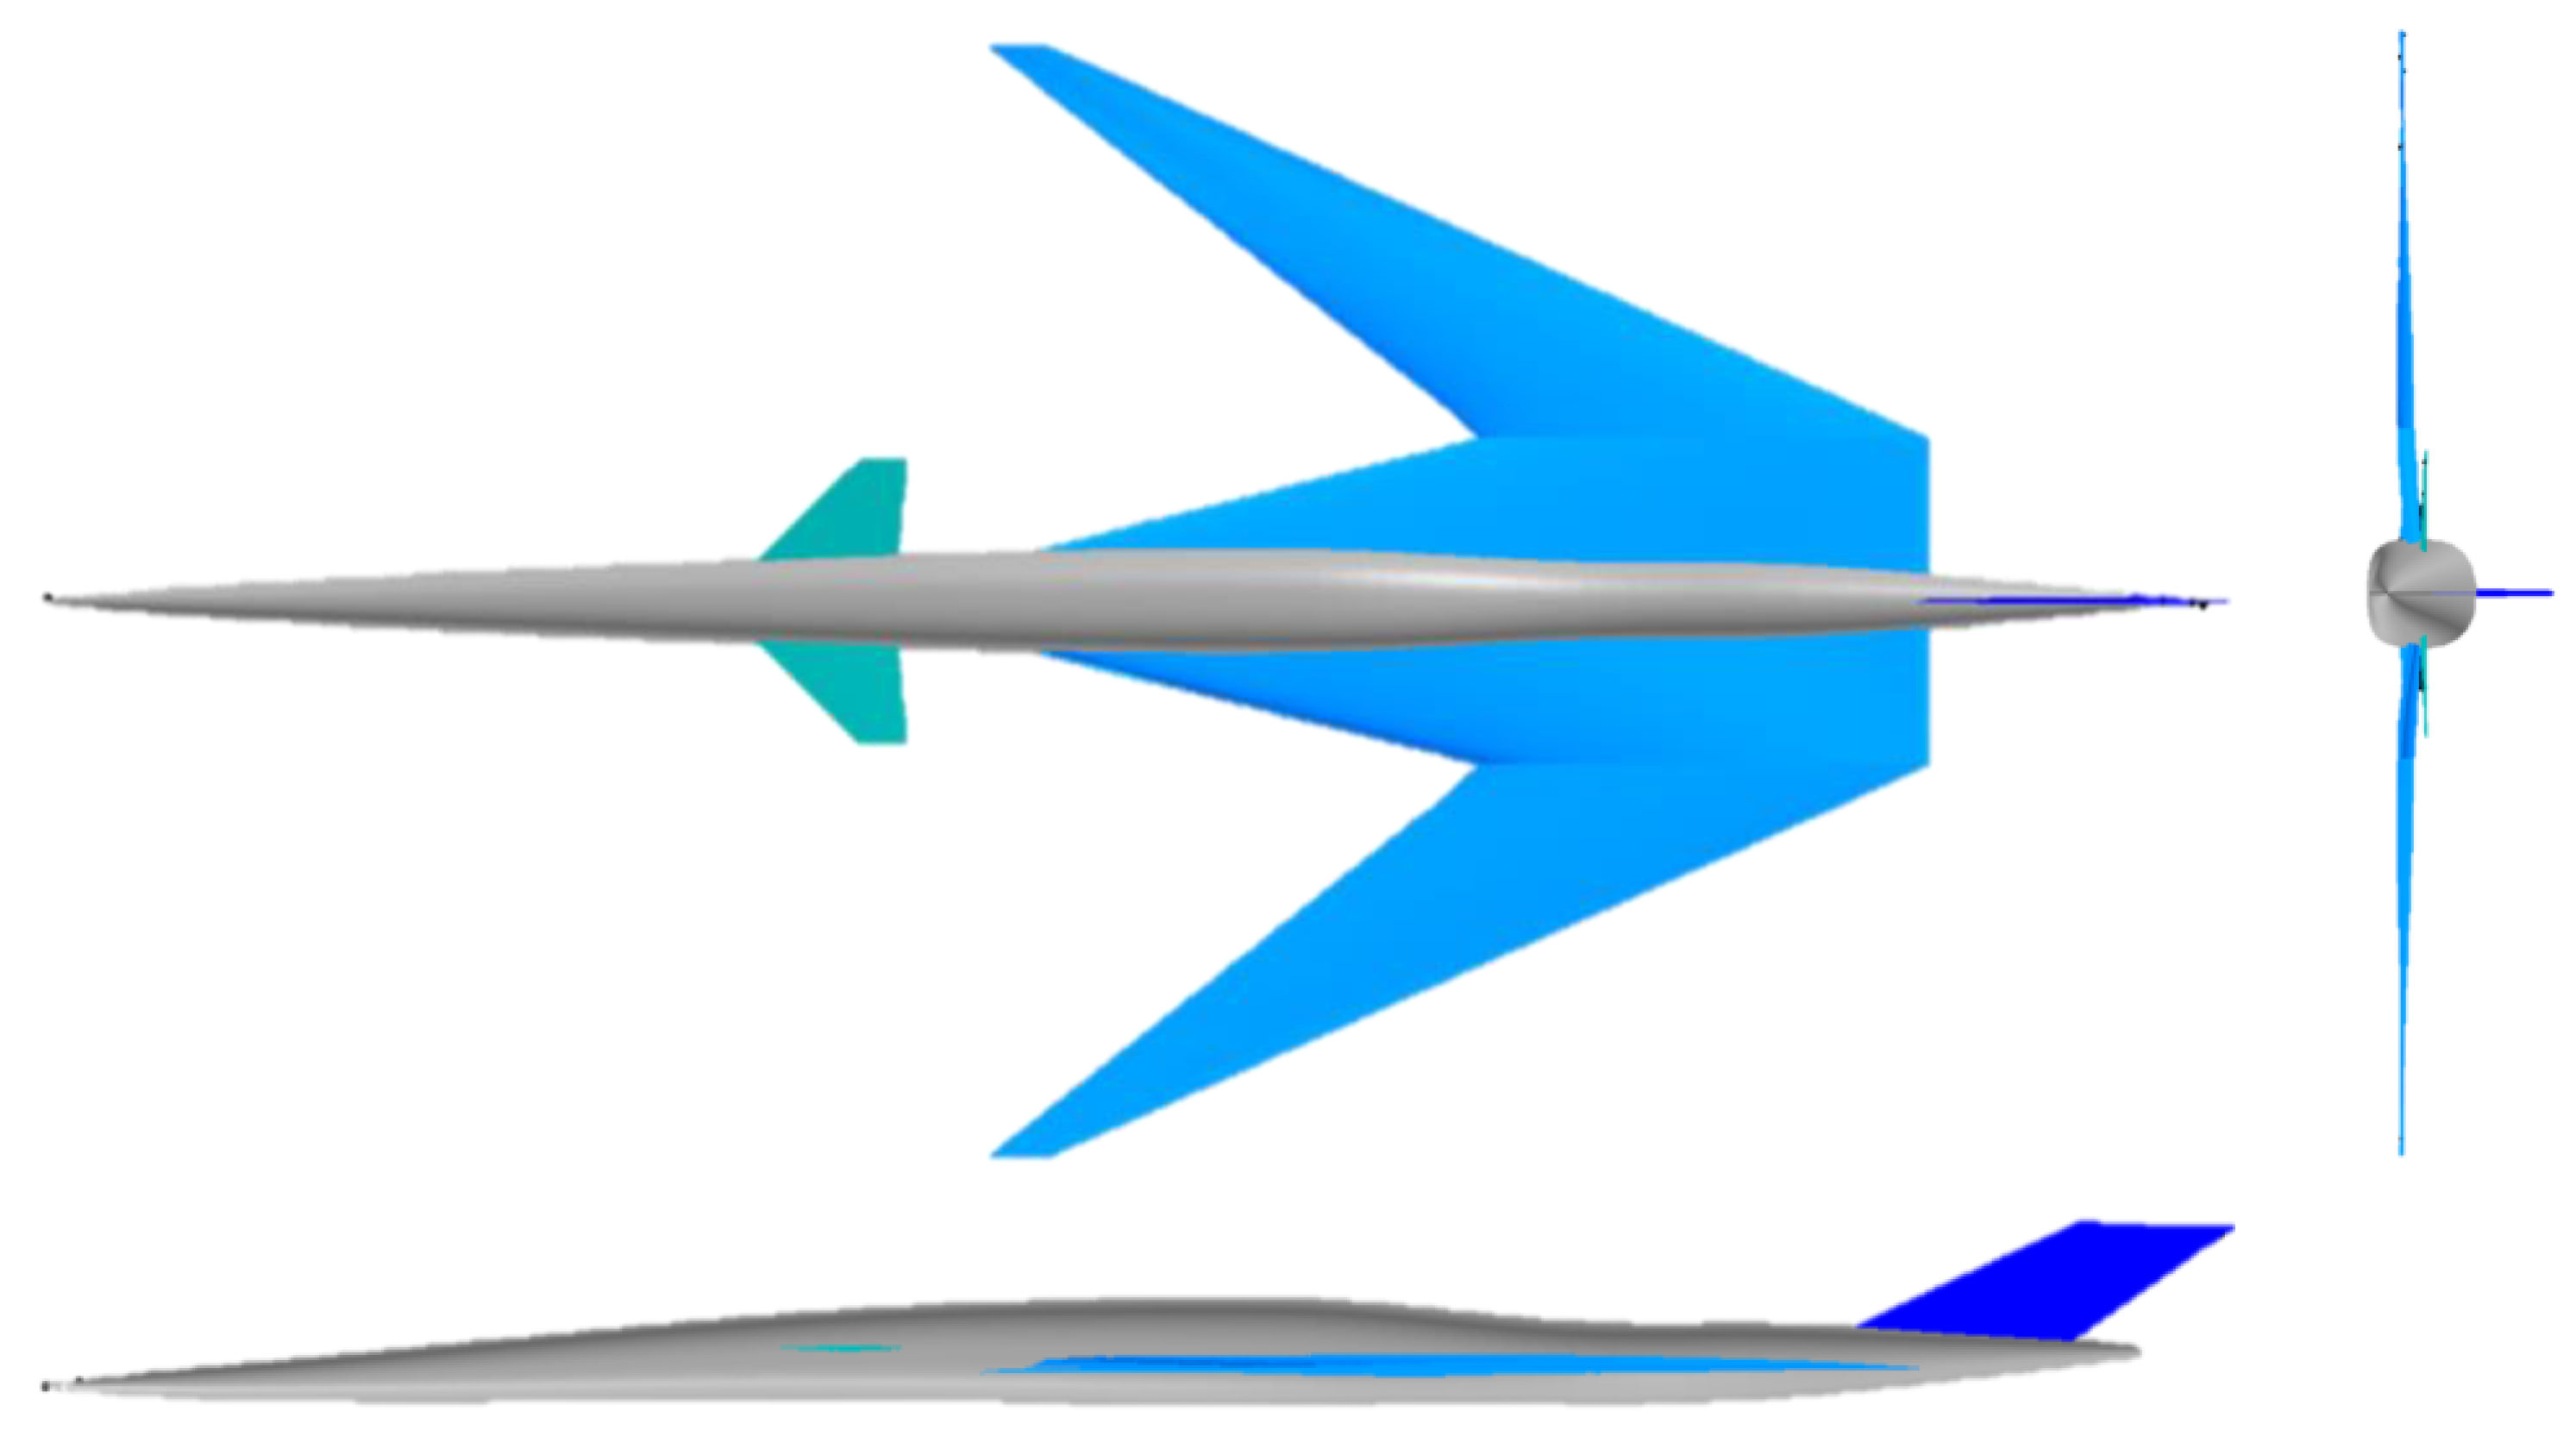
Figure 7 shows the top view of each configuration. The w/o canard configuration consists of a fuselage, wing, and vertical tail wing. Meanwhile, the other configurations include a canard wing, fuselage, wing, and vertical tail wing. The canard wing of the desC1 configuration is mounted forward compared with that of the Baseline configuration. The desW1 configuration has a kink in the wing located inboard the Baseline configuration and has a shorter chord length at the root than the Baseline configuration. The desW2 configuration has a longer chord length at the kink and a smaller inboard leading edge swept-back angle than the desW1 configuration. Therefore, the wing mounting position of the desW2 configuration is located further back than that of the desW1 configuration.
The equivalent area distribution owing to the volume of each configuration is shown in
Figure 8. According to this figure, the volume difference before and after the redesign is marginal. The wing volumes of the desW1 and desW2 configurations decreased because the chord length of the wing root, which was thick, decreased.
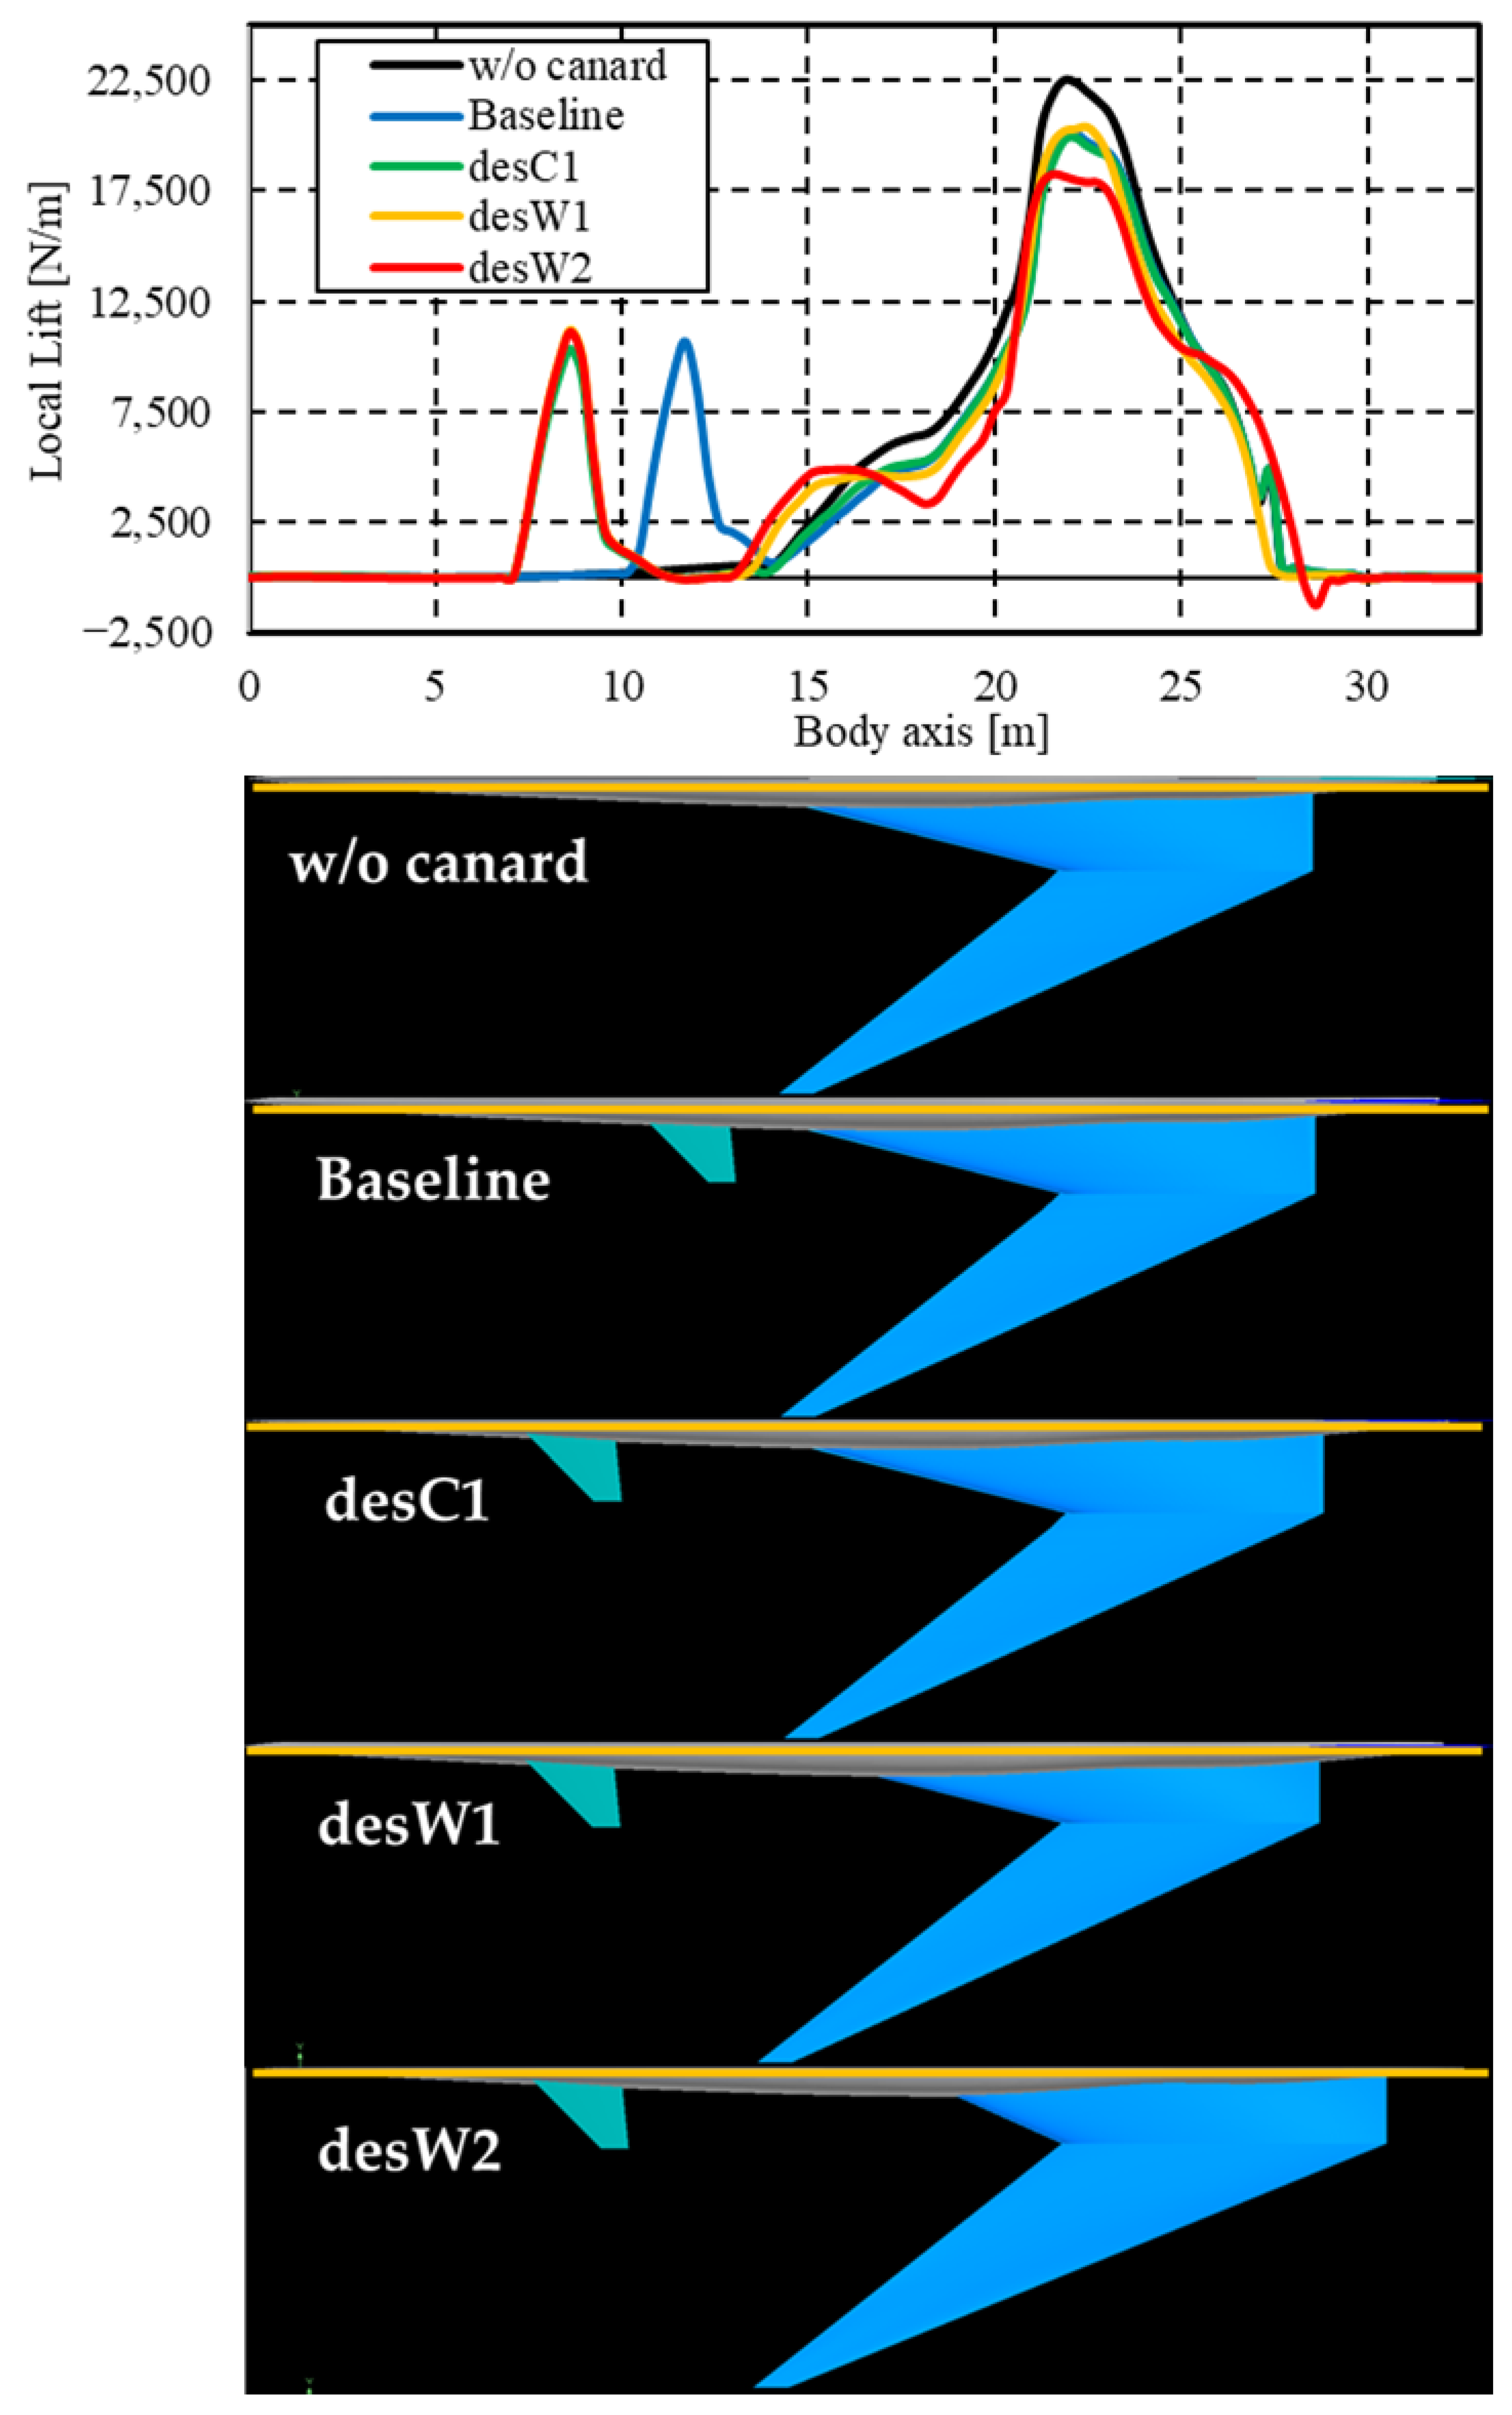
Figure 9 shows the local lift distribution along the body axis of each configuration. In this figure, the first peak of each configuration with the canard wing corresponds to the lift generated by the canard wing. The peak lift for the desC1, desW1, and desW2 configurations was located forward compared with that for the Baseline configuration because the canard wings of these configurations shifted forward. In this study, the area of the main wing, wing planform, and the geometry of the canard wing did not vary. Thus, the lift distribution for all the configurations, which corresponded to the lift generated by the wing, had similar shapes. In the w/o canard configuration, although a lift peak between 7–15 m owing to the canard wing was not observed, the asymmetric fuselage generated a lift of approximately 10 m.
Focusing on the lift distribution at approximately 9–21 m (which corresponds to region B of the
distribution in
Figure 6), the shapes of the lift distributions of the desW1 and desW2 configurations (which were modified by the wing planform) were different from those of the w/o canard, Baseline, and desC1 configurations. The lift generated by the outboard wing of the desW1 configuration was stronger than that of the desC1 configuration because the kink of the desW1 configuration shifted away from the desC1 configuration. Then, the area of the outboard wing increased. At this time, the wing tip of the desW1 configuration shifted forward from the desC1 configuration and the position at which the lift started shifted from 14 to 13 m. In the desW2 configuration, a local minimum lift was observed at approximately 18 m. Although both desW1 and desW2 configurations had redesigned wings, a local minimum was observed only in the desW2 configuration because of the decreased area of the inboard wing. This occurred because the chord length and leading edge swept-back angle of the inboard wing of desW2 decreased compared with those of desW1. Comparing the local lift distributions of the desC1 and Baseline configurations at approximately 14–17 m, the lift of the desC1 configuration was larger than that of the Baseline configuration. The only difference between the desC1 and Baseline configurations is the mounting position of the canard wing. Thus, the difference in local lift distribution between the desC1 and Baseline configurations could be attributed to the aerodynamic effect of the canard wing on the leading edge of the forward-swept wing.
Focusing on region C of the
distribution in
Figure 6, the maximum value of the local lift of the desW2 configuration was smaller than those of the configurations. This was particularly so when the position attained a maximum value of 25 m. Considering that the maximum value of the total equivalent area distribution of the Baseline configuration was 25 m (as shown in
Figure 6), redesigning desW2 was expected to reduce the maximum value of the total equivalent area distribution. Because the wing-mounting position shifted backward, the local lift of approximately 25–28 m in the desW2 configuration was larger than those of the other configurations. Expanding the area of the outboard wing with a forward-swept angle and shifting the wing backward caused the desW2 configuration to lift more than the other configurations at approximately 13–17 m and 25–28 m. The widely distributed lift along the body axis reduced the maximum value of the local lift distribution.
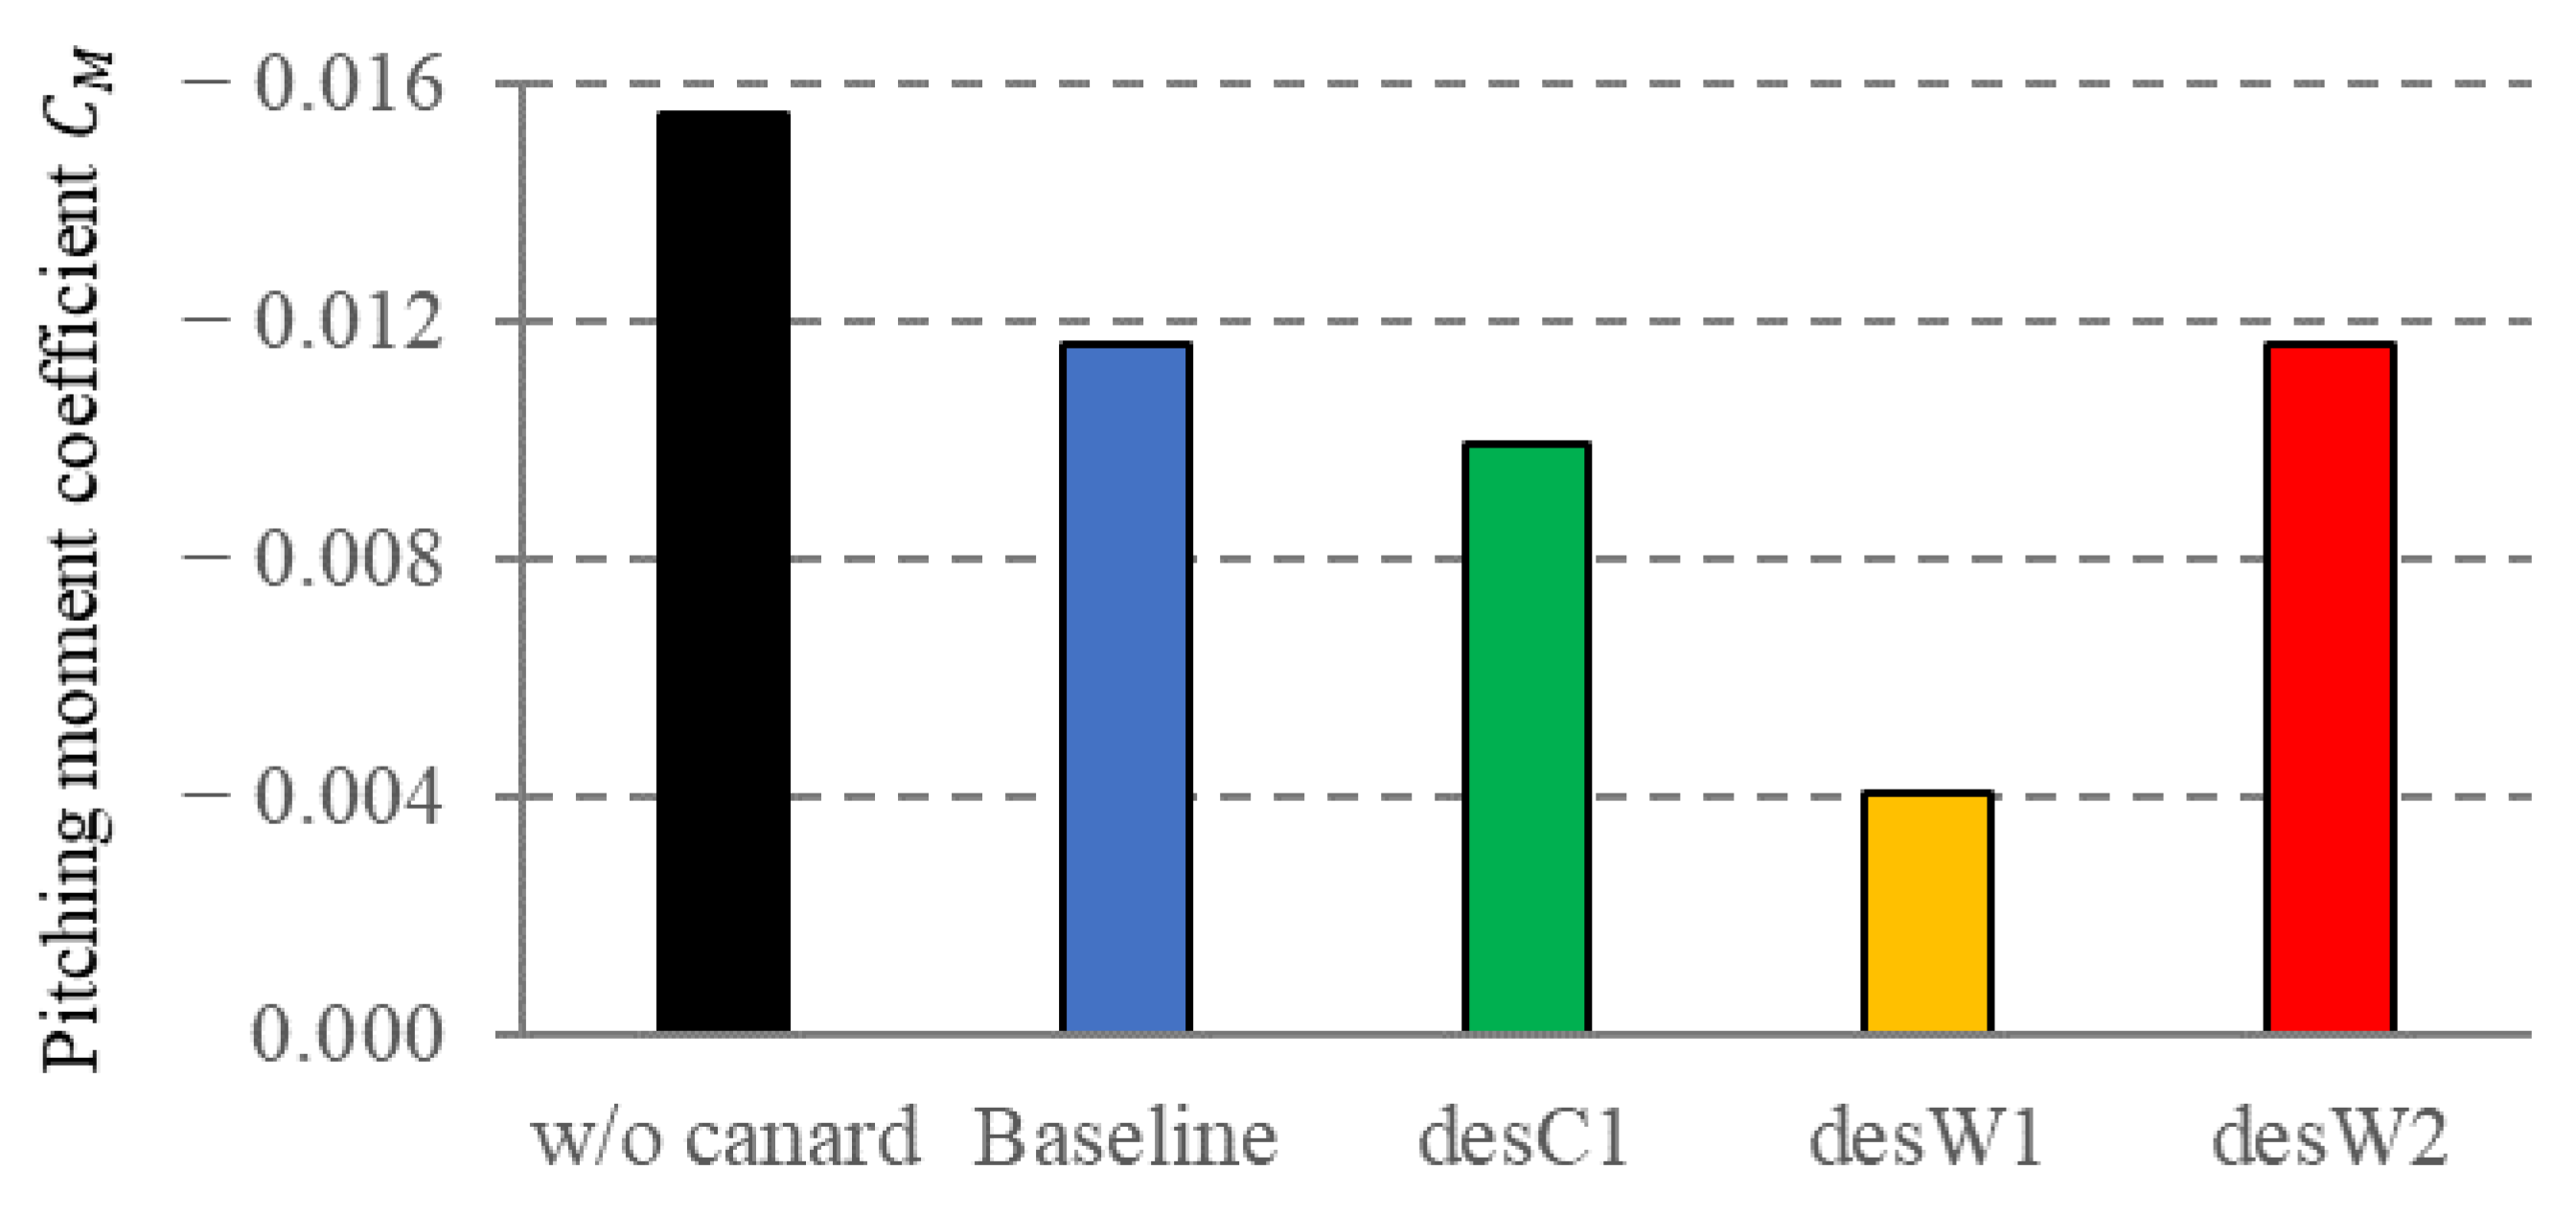
Figure 10 shows the
of each configuration.
is within 0.016 for any configuration. In the future, the sonic boom and aerodynamic performance of SSTs with the forward-swept wing and canard wing should be investigated, considering the pitching trim and the balance between gravity and lift.
4.4. Equivalent Area Distributions of Redesigned Configurations
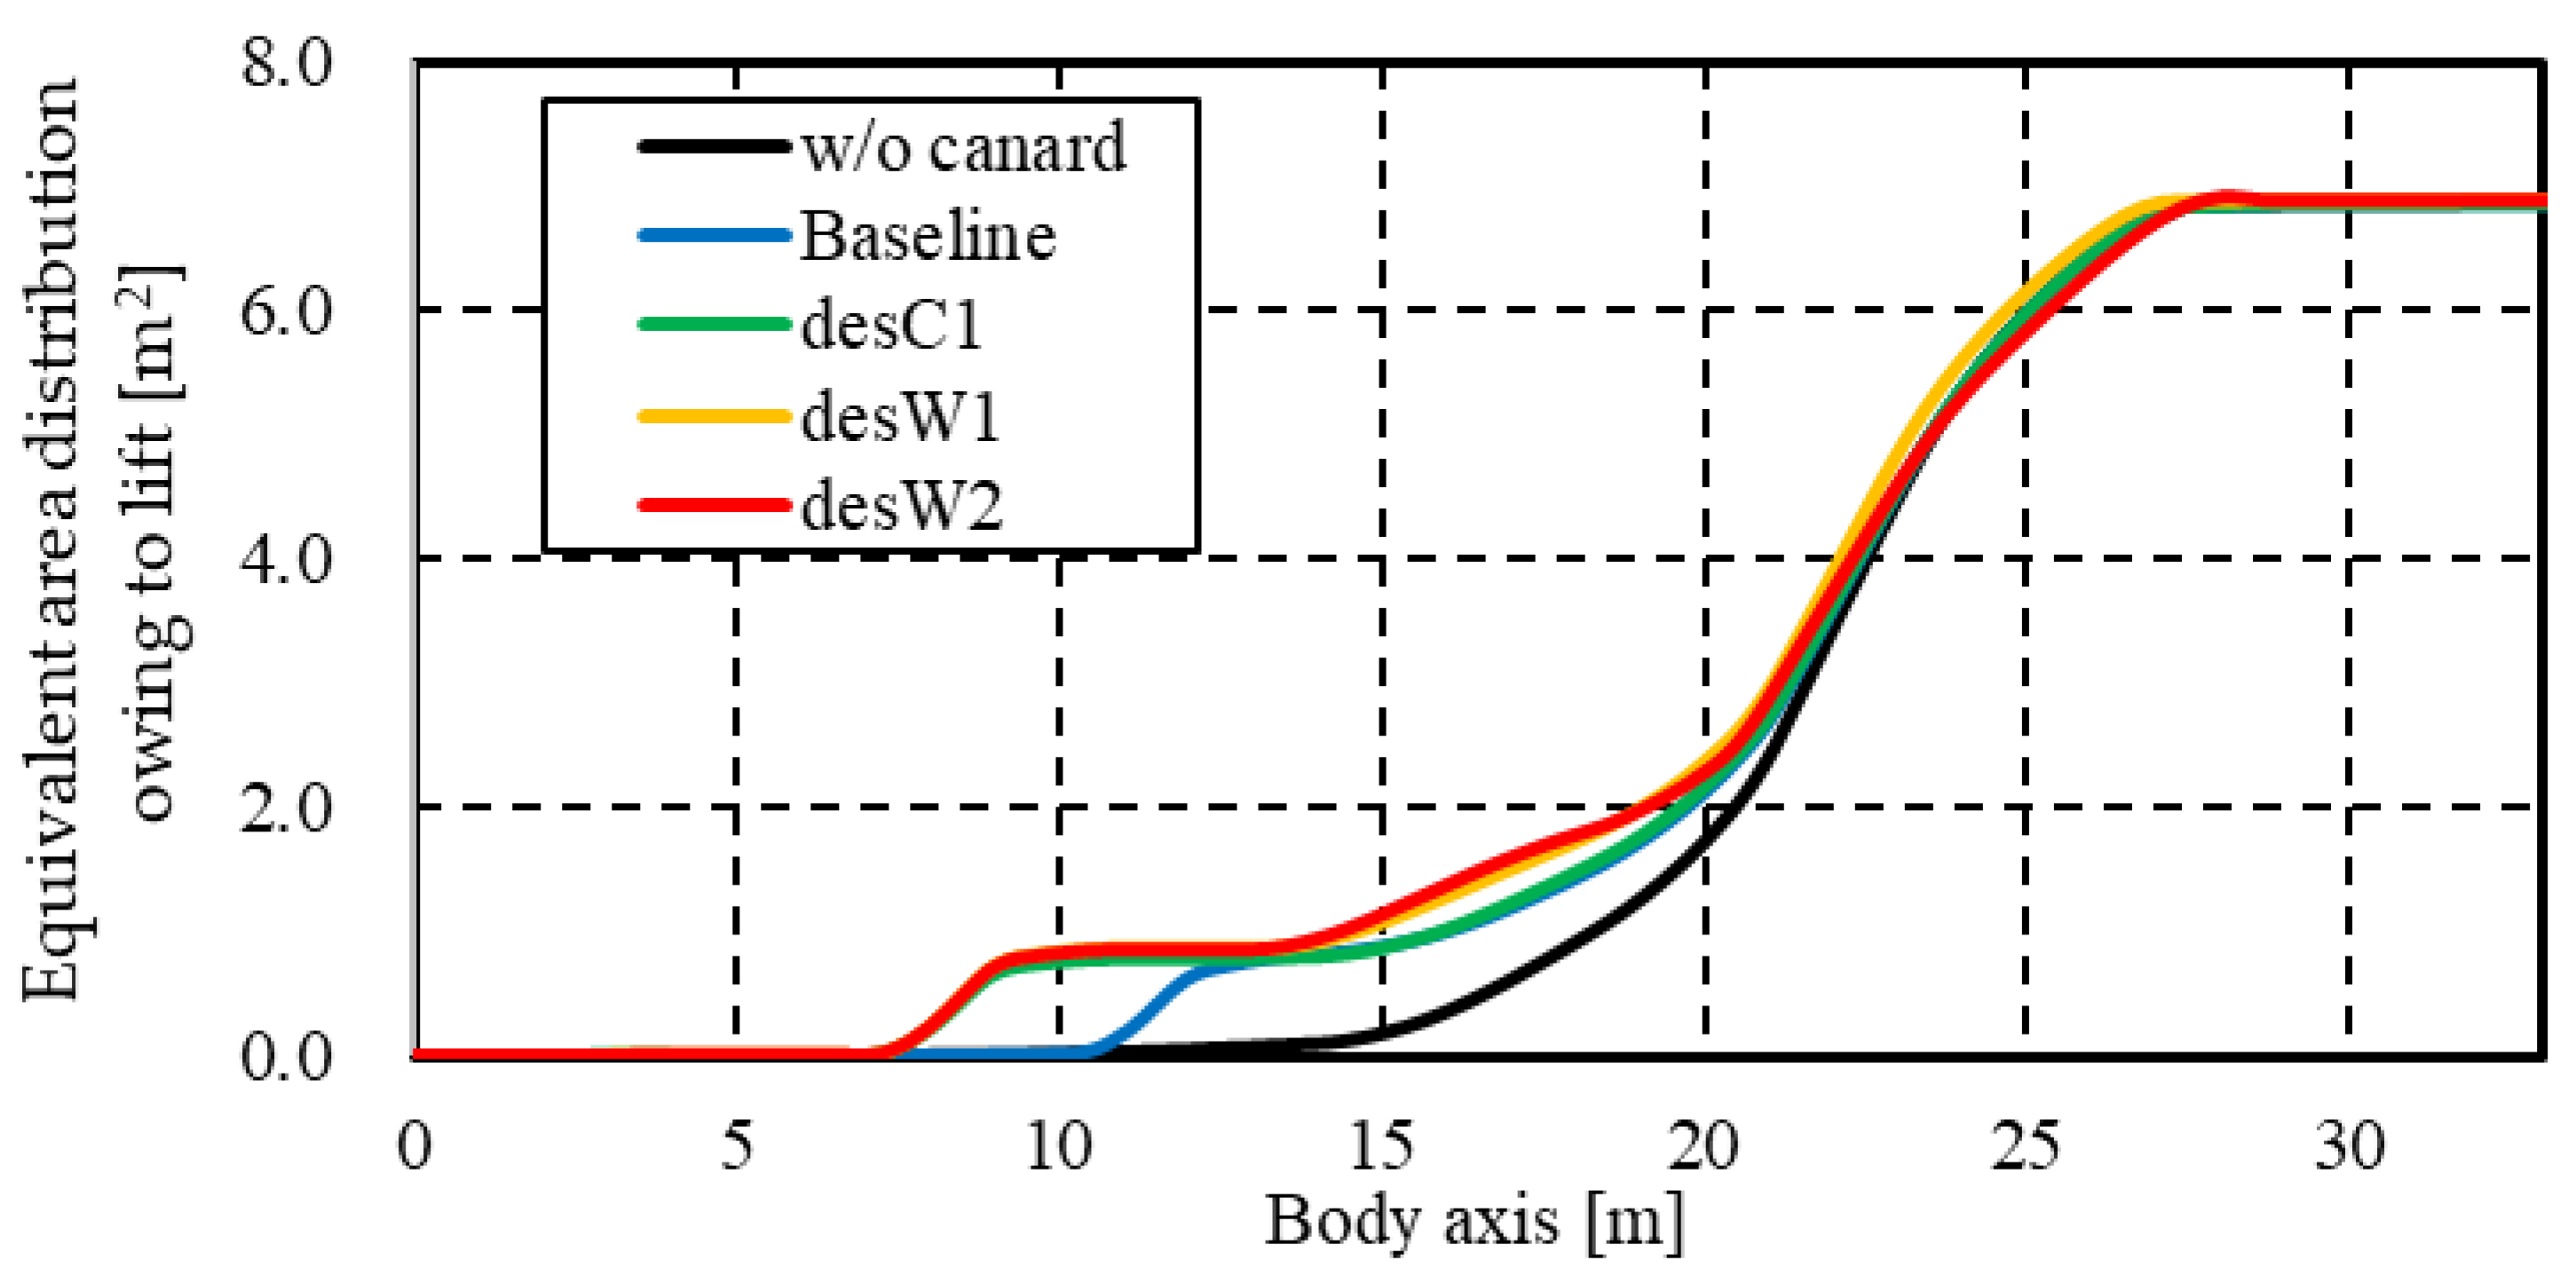
Figure 11 shows the equivalent area distribution owing to the lift along the body axis of each configuration. The shape of
was modified by altering the local lift distribution. Focusing on the nose to 9 m corresponding region A in
Figure 6, the differences in the total equivalent distribution originated between the Baseline and Target distributions because
was zero. That is, the total equivalent area consisted of only
in this range. However, in the desC1, desW1, and desW2 configurations, the canard wings shifted forward. Thus, the equivalent area distribution owing to the lift increased from 7 m to 11 m. This expanded the design range of
. A comparison of each
distribution from 13 to 21 m corresponding to region B in
Figure 6 revealed that the
of the desW1 and desW2 configurations expanded the outboard wing area. The forward-swept angle was larger than that of the other configurations. The outboard wing area of the desW2 configuration expanded more than that of the desW1 configuration. Moreover, the
of the desW2 configuration was higher than that of the desW1 configuration within this range. Focusing on the
distributions from 21 to 28 m corresponding to region C in
Figure 6, no remarkable differences were observed between the configurations in region B. The exception was that the
distributions of the desW2 configuration were smaller than those of the other configurations in this range.
The total equivalent area distribution for each configuration is shown in
Figure 12. Comparing the desW2 and Baseline configurations, the shape of the desW2 configuration was closer to the target equivalent area distribution from 7 to 28 m. To validate the effect of the canard wing, the w/o canard and Baseline configurations were focused on. At approximately 11–22 m, the shape of the Baseline configuration was closer to that of the target distribution than that of w/o canard configuration. This indicated that the application of a canard wing can achieve a good total equivalent area distribution. Comparing the Baseline and desC1 configurations (in which the canard wing was shifted forward from the Baseline configuration to improve region A in
Figure 6), the
shape of the desC1 configuration was closer to that of the target distribution from 7 to 12 m than that of the Baseline configuration because of the increase in
owing to the movement of the canard wing.
A comparison between the desC1 and desW1 configurations (in which the position of the kink shifted to the root of the wing from the desC1 configuration to improve region B in
Figure 6) shows that the
shape of the desW1 configuration was closer to that of the target distribution from 13 to 21 m than that of the desC1 configuration because of the increase in
. This variation in
was smaller than that in
from w/o canard to the Baseline, Baseline to desC1, and desW1 to desW2.
We compared the
shapes of the desW1 configuration and desW2 configuration whose outboard wing area was expanded, inboard wing area was contracted, and wing planform was swept back from the desW1 configuration to improve region C (see
Figure 6). In the region behind 9 m, the
shape of the desW2 configuration was closer to that of the target distribution than that of the desW1 configuration because of the increase in the lift from the canard wing. From 14 to 18 m, the
of the desW2 configuration was larger than that of the desW1 configuration because of the increase in the outboard wing area. From 22 to 27 m, the maximum value of
for the desW2 configuration decreased because the lift distribution of the desW2-configuration axis widened along the body owing to the redesign of the wing.
The
distribution for each configuration is shown in
Figure 13. Regions A, B, and C of the
distribution decreased in the following order: w/o canard, Baseline, desC1, desW1 and desW2 configurations. Moreover, the
distribution approached the target distribution. To quantitatively evaluate the difference between
and
, the integrated value of
along the body axis was calculated (as listed in
Table 3). According to this table, the integrated value of the
distribution along the body axis decreased with the performance of the redesign process based on the principles described in
Section 4.2. If the integrated value of the
distribution is used as an objective function of the optimization problem that can be solved using an evolutionary algorithm (EA), a low-boom configuration is likely to be obtained based on the SGD theory.
4.5. Near-Field Pressure Signature of Redesigned Configuration
The near-field pressure signatures of desW2 and Baseline configurations are shown in
Figure 14. In both configurations, similar magnitudes of pressure-increase can be observed from 0.8 to 8.0 m (which corresponds to the location of the aircraft’s nose). Intense pressure increases were observed at different positions owing to each canard wing behind the nose.
A pressure increase occurred in the Baseline configuration at approximately 16 m that was similar to the pressure increase owing to the nose. In the desW2 configuration, this type of pressure increase shifted to 18 m. This was caused by a shock wave generated from the leading edge of the wing root. In the desW2 configuration, the leading edge swept-back angle and chord length at the wing root decreased. Thus, the pressure increase in the desW2 configuration shifted backward compared with the Baseline configuration.
The maximum value of was observed at approximately 20 m in the Baseline and desW2 configurations owing to the propagation of the shock wave generated from the wing tip. This peak of the desW2 configuration was located further forward than that of the Baseline configuration. This was because the wing tip of the desW2 configuration was in front of that of the Baseline configuration. Although the desW2 and Baseline configurations had an identical wing span and geometry as the wing tip, the amount of pressure increase owing to the propagation of the shock wave generated from the wing tip differed between these configurations. Thus, this phenomenon was caused by the pressure fluctuations in front of the wing tip. In both configurations, a pressure increase was observed at approximately 23 m owing to the compression wave caused by the kink. The increase in pressure in the desW2 configuration was larger than that in the Baseline configuration. From the discussion regarding the shock wave from the wing tip, the shock wave from the kink of the desW2 configuration was stronger than that of the Baseline configuration because the shock wave from the wing tip of the desW2 configuration became weaker and was located more forward than that of the Baseline configuration. At approximately 26–31 m, the signature of the pressure increase corresponding to the fuselage was different for each configuration because of the difference in the position of the trailing edge of the wing. In the Baseline configuration, the position of the pressure increase on the lower side of the fuselage and the shock wave from the trailing edge of the wing were similar. Thus, after the pressure decrease became gradual at approximately 26 m, the pressure increased dramatically at 29 m. In the desW2 configuration, the trailing edge of the wing shifted backward. Subsequently, the effect of the lower side of the fuselage increased the pressure to approximately 27 m. Moreover, a pressure increase was observed owing to the trailing edge of the wing at approximately 31 m.
4.6. Pressure Signature on the Ground and Perceived Level of Sonic Boom
The pressure signature on the ground for each configuration is shown in
Figure 15. Only the w/o configuration had an N-shaped signature. It is a typical sonic boom waveform with a two-stage pressure jump [
29]. Canard-wing-mounted configurations such as the Baseline, desC1, desW1, and desW2 configurations had two-stage pressure jumps at the leading boom. Furthermore, their pressure peak values were lower than those of the w/o canard configuration. The only difference between the w/o canard and Baseline (or desC1) configurations was the presence or absence of canard wings. This revealed that the canard wing could divide the leading boom into two stages and reduce its peak pressure.
In the desC1 configuration, where the canard wing shifted forward from the position of the Baseline configuration, the first-stage leading boom also shifted forward. This resulted in a lower peak value compared with the Baseline configuration. The second-stage leading boom of the desC1 configuration was shifted backward and had a lower peak value than that of the Baseline configuration. In the desW1 and desW2 configurations with the modified wings, the position and strength of the first-stage leading boom were almost identical. However, the second-stage leading boom of the desW2 configuration was located behind that of the desW1 configuration and had a lower peak value. This indicates that redesigning the mounted position of the canard wing and wing planform can control the leading boom. This, in turn, can result in an improvement in the sonic boom performance.
Each configuration had a strong single-stage trailing boom. Moreover, the bottom peak values of the trailing boom were almost identical. The bottom peak value of the trailing boom of the w/o canard configuration was the lowest among the evaluated configurations because the pressure jump position of the trailing boom of the w/o canard configuration was located farther back than that of the other configurations. As shown in
Figure 15, the Baseline and desW2 configurations exhibited multi-stage trailing booms in the near-field, and their positions and strengths were different. However, these multi-stage trailing booms were unified as single-stage trailing booms during their propagation from the near-field to the ground. To achieve larger sonic boom reduction, it is necessary to convert the single-stage trailing boom at the ground into a multi-stage trailing boom. Several redesigns are required to improve the trailing boom around the near-field. This includes the addition of a horizontal tail to consider the trim stability and the shifting of the position of the trailing edge of the wing.
The perceived level of the sonic boom for each ground configuration is presented in
Table 4. The redesign of each configuration resulted in a decrease in
and a subsequent decrease in the PLdB value. The Baseline configuration had a PLdB value that was 2.41 PLdB lower than that of the w/o canard configuration because of the multi-stage leading boom that contributed to the effect of the canard wing. The reduction from the w/o canard configuration to the Baseline configuration was larger than that for the other configurations. Dividing a strong leading boom into multiple-stages is important for sonic boom reduction. Thus, the application of a canard wing is effective. The PLdB value of the desW2 configuration was 0.16 PLdB lower than that of the Baseline configuration. Although the
value of the desW1 configuration was lower than that of the desC1 configuration; no reduction in the PLdB value was observed. The variation in the total equivalent area distribution (shown in
Figure 12) from the desC1 configuration to the desW1 configuration was marginal. Furthermore, no difference in the signature of the first-stage leading boom was observed. In addition, the difference in the signature of the second-stage leading boom was marginal compared with the other redesign processes. Therefore, the variation in wing planform from the desC1 configuration to the desW1 configuration was likely to have been inadequate to affect the PLdB. To reduce the PLdB value further, radical redesign should be required, such as the simultaneous modification of wing and fuselage. If the mounting angle of the canard wing is added to the design variables, the relationship between
and PLdB values would vary. This is because the flow field of the canard wing and the equivalent area distribution area owing to the lift around the canard wing affect the flow around the forward-swept wing. At this point, the trim stability should be considered.
5. Conclusions
In this study, to obtain design knowledge for an SST with a forward-swept wing to improve the pressure increase affecting the leading part of the boom signature, the application of a canard wing to an SST with a forward-swept wing was validated. By comparing the equivalent area distribution and target equivalent area distribution based on the SGD theory, the equivalent area distribution was improved by adding the canard wing and redesigning the wing planform and mounted-wing position. Consequently, the sonic boom was reduced by 2.41 PLdB. Three observations were obtained in this study. The canard wing can divide the leading boom on the ground into a multi-stage signature. Considering the mounting position of the canard wing, the pressure jump position of the two-stage leading boom could be altered, and its strength could be controlled. The shape of the equivalent area distribution and its maximum value could be reduced by redesigning the planform of the forward-swept wing. Thus, the position of the second-stage leading boom on the ground and the pressure increase could be improved and reduced. When the lift distribution was redesigned to reduce the difference in the integrated value of the equivalent area distribution along the body axis between the design object and design target, the PLdB values generally decreased with each design.
In this study, for simplicity, the SSTs were redesigned without altering the mounted angle of the canard wing. Next, an integrated design including the fuselage and wing of an SST with a forward-swept wing and canard wing should be carried out using evolutionary computation to minimize sonic boom and aerodynamic drag simultaneously, considering the pitching trim and the balance between the gravity and lift by varying the mounting angle of the canard and the angle of attack of the aircraft. At this time, an equivalent area distribution method that can control leading and trailing booms simultaneously by modifying the geometries of the wing needs to be applied to reduce the sonic boom further.


