1. Introduction
Countless pages have been dedicated to lamenting the lack of public support for greenhouse gas abatement policies within the United States (US). Without public support, there is little incentive for elected officials, particularly those in highly competitive districts, to pursue such climate policies. A seemingly exponentially growing body of research has dedicated itself to pursuing answers for this lack of support. While these studies have approached this important topic from a variety of avenues, the research on risk perceptions seems particularly promising.
In simplest terms, if an individual does not perceive any risk associated with an issue, there is little reason to alter the status quo to address a non-issue. Research is finding that risk perceptions directly influence climate policy support or opposition [
1,
2] and an individual’s willingness to overcome the collective action problem to become active in environmental causes [
3]. Risk perceptions have similar effects on a number of other complex issue domains [
4,
5,
6].
This project seeks to understand the extent to which risk perceptions might be influenced by familiarity and geo-spatial considerations. In other words, to what extent will an individual’s evaluation of risk change as the unit analyzed is scaled up to become much larger and less familiar to the individual? Relying upon in-group/out-group bias theory and optimism bias, which is quite consistent with various risk studies, we outline why we anticipate that individuals evaluate risk differently based upon familiarity and spatial considerations.
Climate change poses many different risks. We focus on the health risks associated with climate change. Will the public view the health risks associated with climate change differently when evaluating this risk in terms of their family, community, the US in general, and the world? If there is a meaningful difference in these evaluations, what predicts these differences? The subsequent statistical analyses reveal that the public does perceive health risks differently based upon the spatial level evaluated and that the determinants of these perceptions differ in important and meaningful ways. The implications of these findings on the ability to legislate on climate change are discussed.
1.1. Familiarity and Spatial Evaluations
To understand why people perceive the health risk of climate change differently for themselves as opposed to their communities, country, and the world, it is helpful to examine in-group bias theory. In-group bias provides evidence that individuals are more persuaded by their “groups”. Out-group members have less influence in opinion formation. Psychological research on the in-group/out-group bias examines whether individuals inside of a group are more likely to be more supportive of members of their own group than outsiders [
7]. This in-group/out-group bias has been found to influence a number of characteristics related to social identity and self-interest [
8].
In-group/out-group theory makes the case that individuals are more sympathetic or persuaded by people they perceive to be like them. For our purposes, there is a large body of literature that suggests that there is a spatial component to in-group bias, which reflects an individual being more likely to evaluate individuals from their own country or community differently than those who are not members of those groups. For example, Lindholm and Christianson found that Swedish students were more likely to mistakenly identify an innocent immigrant than they were to mistakenly identify an innocent Swede as the perpetrator during a line-up [
9]. Additionally, Chiasson
et al. asked French Canadian students to rank eight ethnically diverse persons in terms of likability [
10]. Students ranked the people that looked the most similar to them as more likable. Lee and Ottati provide further evidence of this bias when they determined that Mexican citizens were more likely than US citizens to grant illegal Mexican immigrants privileges associated with US citizenship [
11]. Basically, the argument that the local is more influential than the outsider is consistently reinforced by the scientific community [
7,
10,
11,
12,
13,
14,
15,
16,
17,
18].
While the above studies illustrate the in-group bias rooted in ethnic and cultural differences related to spatial scaling, a similarly robust body of literature has examined the dynamics of in-group bias within a community. In particular, this line of research has emphasized the importance of familiarity on in-group bias. For example, Schruijer
et al. found that members of the Italian Communist Party were more sympathetic when members of their own party were involved in an altercation [
18]. In an extreme example, this in-group bias has even been found to influence attitudes regarding the level of punishment assigned to in-group members convicted of sexual violence [
14].
While familiarity can result in disproportionate favoritism toward members of one’s group, research suggests that more frequent interactions can reduce, or even eliminate, the out-group bias. For example, Lei and Vesely looked at in-group bias in income inequality [
19]. They found that rich in-group members trusted other rich members more than they trusted the poor. Interestingly, the poor in-group was less discriminatory to their rich out-group and, with experience, ultimately trusted them more than their own. The poor group in this study found legitimacy in the status structure of the experiment, which mitigated their in-group bias.
Though rarely linked in this manner, the literature exploring the reduction of in-group/out-group tensions is similar to social contact theory. The basics of social contact theory rely upon the idea that the more frequently members of different groups interact, the more these members will realize that the perceived differences between the groups are less severe than the members originally thought [
20]. This literature consistently finds that greater levels of exposure between members of out-groups reduce the perceptions of differences between these groups [
21].
Furthermore, studies suggest that self-interest and self-definitions are related to perceptions of an individual’s social identity [
8,
22]. These social identities are directly related to the in-group/out-group bias, where the group one associates most strongly with helps define an individual’s self-categorizations and behaviors [
8]. In turn, this familiarity with one’s group influences an individual’s perception of self-interest through a process called self-anchoring [
23]. In short, the literature increasingly indicates that individuals’ self-identities directly relate to their collective identity, or in-group [
24], and that the greater their familiarity and interaction with their in-group, the greater the connection of the group’s interest to their self-interest [
25]. What is interesting about this process is that individuals can manage the cognitive dissonance that is created by the desire to conform to the group with their desire to be an individual [
26,
27], which is why it can be difficult to separate self-interest from this in-group bias. Additionally, a recent study illustrates that when individuals have a purpose to which they are committed, which is often associated with or defined by their collective identity, the more likely they will be to self-assess higher levels of well-being and a positive outlook toward life [
28]. This is likely related to the optimism bias, which will be discussed below (This discussion is important because some might worry that these evaluations are actually reflections of self-interest, and not necessarily in-group/out-group bias. As the psychological literature indicates, one’s understanding of self-interest is connected to one’s collective identify, or in-group bias, which suggests that an in-group bias approach to this examination is the most appropriate approach).
For our purposes, these bodies of literature illustrates the mitigating role that familiarity plays in reducing the unknowns between groups, while also recognizing that spatial differences actively divide the public. This results in two basic expectations. First, the spatial dynamics of the in-group bias indicate that an individual will be less familiar with groups that are further away from their local area, which will increase perceptions of differences between groups and decrease the connection to self-interest. Second, despite the potential in-group/out-group friction, individuals will have greater interaction with members of their own community, and clearly their family, than members of the global or nation-wide group. The mitigating influence of these interactions should cause individuals to view their community and their family differently than they view the entire country or the world. Together, these expectations suggest that individuals would view the health risk associated with climate change differently for the in-group (i.e., themselves and their families or their local community) than the out-group (the entire US or the world). Furthermore, recognizing the importance of familiarity in this process, we expect that there will be differences in evaluations of the health risks within both the in-group and out-group. For example, individuals living in the US will likely be more familiar with the US than the world, despite that fact that they should be less familiar with both of these when compared to their family or community (the same applies for the difference between their family and their community). Therefore, there is reason to believe that the predictors of the health risks for each of these groups should differ.
1.2. Health and Risk
This project will focus its attention on the perceptions of health risk caused by climate change. Recent research has consistently found that risk perceptions predict public policy preferences [
1,
2,
4,
5,
29]. Indeed, Stoutenborough
et al. argued that the connection between risk and public policy is relatively straightforward, as “those who perceive the risk associated with something as high should be more likely to oppose policies that would increase that risk, and, conversely, support policies that decrease this risk” [
6]. In terms of health risks, if an individual does not perceive the risk to be high, there is no reason to expect that they will support a policy that would reduce these risks. (A definition of “health risk” was not given to respondents. They were left to define health risk as they perceived it).
However, psychological studies into risk perceptions suggest that risk is a component of four characteristics—likelihood, severity, magnitude of harm, and level of understanding [
30]. These four components directly link to one’s knowledge, as each of these evaluations is contingent upon what is known about the specific risk scenario. For example, individuals who drive the same route to work every day should be better able to evaluate the likelihood of getting in an accident than an individual that has never driven that route.
The lynchpin for this evaluation of risk is the level of understanding, particularly for a complex issue. If an issue is complex, individuals are less likely to have a very strong understanding of the problem. Consequently, they have to rely more heavily on experts. If they do not believe that experts understand the problem, they are more likely to perceive risk. In terms of health risk, this level of understanding should be greater for groups with which an individual is most familiar. In other words, an individual should be better prepared to evaluate the health risk for their family and their community than for the US or world simply because these groups are more familiar to the individual.
Essentially, these perceptions are spatially dependent, which directly links to the above discussion on in-group/out-group theory. For example, the risk of rising sea levels will be greatest along the coasts, while lowest in the mountains. Studies indicate that the public recognizes this spatial component, as those living further away from a coast are less likely to view this risk as being high [
31]. If an individual is most familiar with that which is proximate, then they should be less familiar with groups the further away they are located. Consequently, an individual should be better able to evaluate the health risk of climate change the more proximate the group being evaluated.
When examining how individuals perceive risk toward others, we must first look at how individuals perceive personal risk. Another line of scholarship suggests that risk perceptions are often affected by “dramatic media presentations, controllability, catastrophic potential, equity, uncertainty and threat to future generations” [
32]. In other words, as individuals see that potential threats are uncontrollable and there is uncertainty of outcomes, risk perceptions tend to increase.
Based on this literature, we argue that risk perceptions toward others can be affected by two main elements: uncontrollability and uncertainty. Several scholars have noted that if individuals feel that outcomes are beyond their control, risk perceptions increase [
32,
33]. Therefore, as individuals evaluate how potential threats may affect individuals outside of their group, they likely see the situation as out of their control and thus have elevated risk perceptions toward others.
Uncertainty of outcomes is another factor that drives risk perception. Uncertainty has been defined as “a lack of sure knowledge about the course of past, present, future, or hypothetical events” [
34] (p. 41). Uncertainty likely increases as individuals evaluate the health risks of those outside their group and especially for those who are not proximate. Thus, as the uncertainty of outcomes increases, so does the risk perception for those who are outside one’s family, community, or country.
Finally, scholars have continued to find an optimism bias when it comes to accurate risk perceptions, especially when it comes to health risks [
35,
36]. For example, Weinstein found that individuals tend to over-estimate the likelihood of positive events and under-estimate the likelihood of negative events occurring in their lives [
36], which is consistent with the Sumner
et al. study discussed above [
28]. These studies suggest that optimism bias may directly relate to in-group bias. The tendency for this to occur is in part linked with controllability as participants in this study tended to believe that they have more control over their own outcomes while not recognizing that others may have the same abilities to control their outcomes [
36]. This and similar findings have lead scholars to hypothesize that this optimism is associated with an “illusion of control” [
37,
38].
In this same vein, other scholars have noted that individuals not only overestimate positive events for themselves, but they overestimate negative outcomes for others [
35]. In their study, which examined risk perceptions toward being diagnosed with skin cancer, the authors noted that, “people are more ready to accept that others are at risk than they are themselves” [
35]. Harris and Middleton found similar results when they asked student respondents to evaluate risks of a variety of health issues for themselves and the “typical student,” noting that students evaluated their health risks as significantly lower than others [
37].
Based on previous scholarship on in-group/out-group dynamics, risk perception, and optimism bias, we expect that individuals will perceive the health risks associated with global climate change differently when considering themselves and their families, their communities, their country, and the world.
2. Analytical Strategy
We intend to examine this issue from two perspectives. First, does the public differentiate between the health risks associated with climate change based on spatial differences. Second, if there is a difference, what predicts these differences in risk perceptions? We approach this from four different spatial positions.
To answer these questions, we utilize the Institute of Science, Technology and Public Policy (ISTPP) National Climate Change Survey from 2013. Administered by GfK Custom Research, LLC, the survey was in the field from 13 November 2013, through 26 November 2013. A total of 1321 respondents participated in the survey. The sample was from KnowlegePanel®, a probability-based web panel designed to be representative of U.S. adults age 18 and older. The survey was offered in English and targeted toward adults over the age of 18. In the U.S., adults age 18 and older are eligible to vote, which makes this the most appropriate population to study.
Four dependent variables are derived from a battery of questions related to perceptions of the risk associated with climate change on health. Respondents were presented with the following question stem, “Indicate the level of risk posed by global warming and climate change to the health of the following groups.” Risk was evaluated along an 11-point scale. The groups were, (1) “you and your family”; (2) “your community”; (3) “the US”; and (4) “the world”. Each of these were coded from 0 to 10, with 0 representing “very low risk” and 10 indicating “very high risk”.
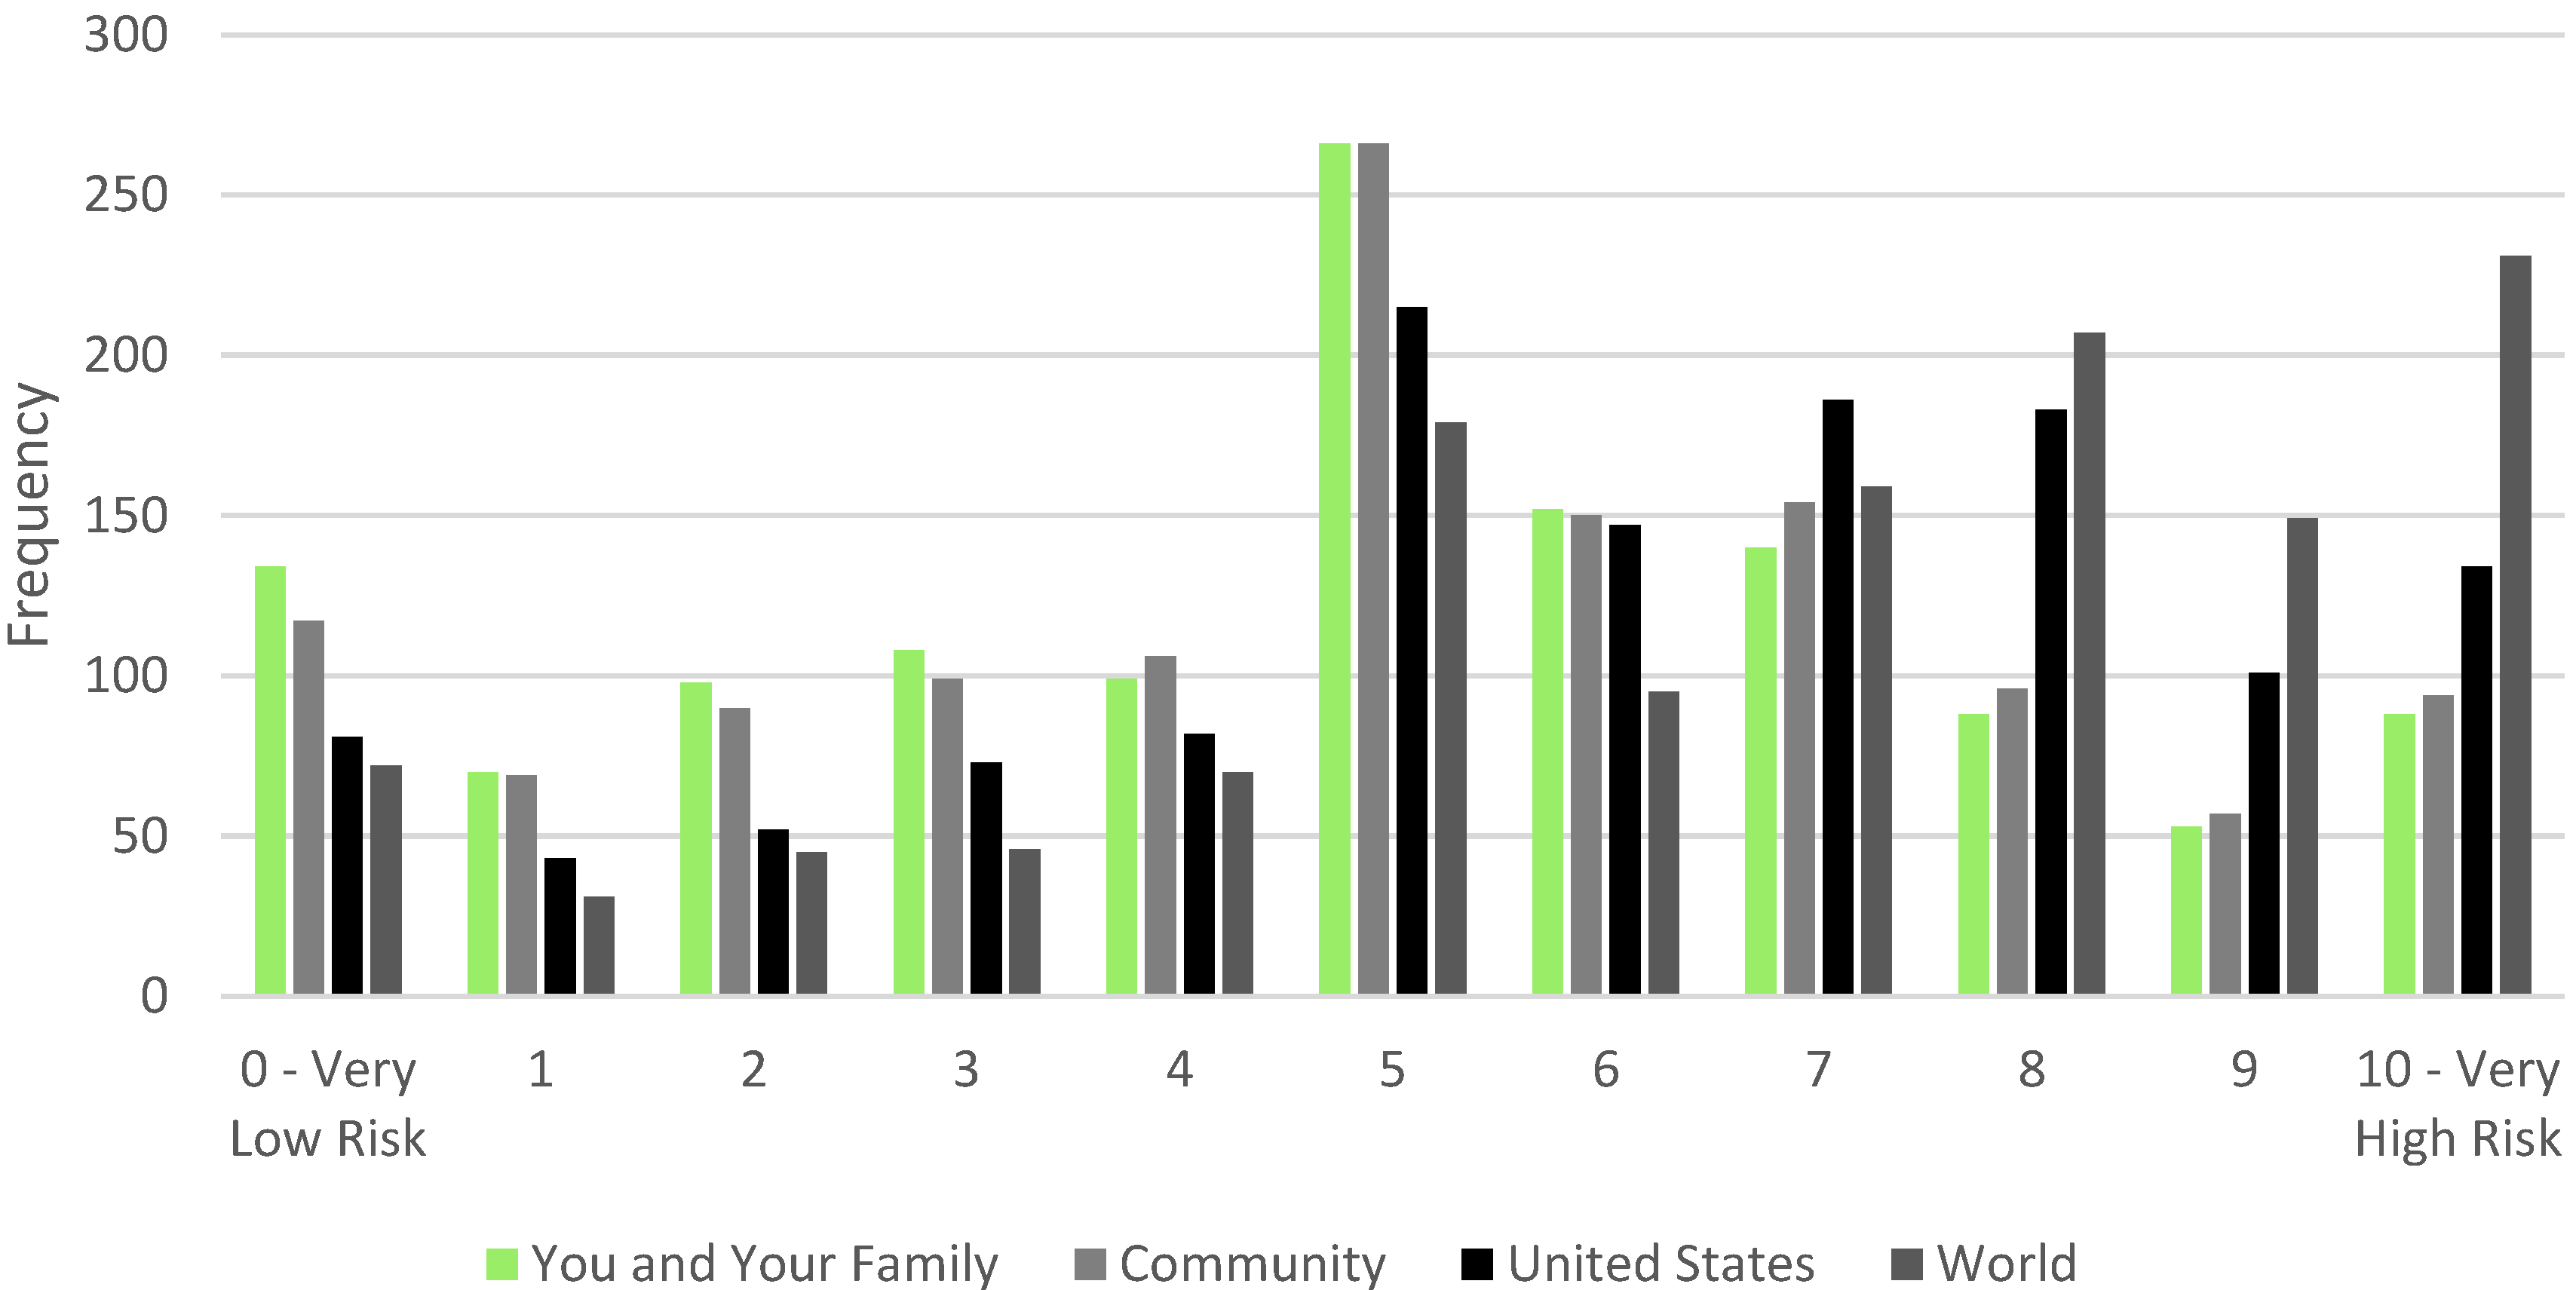
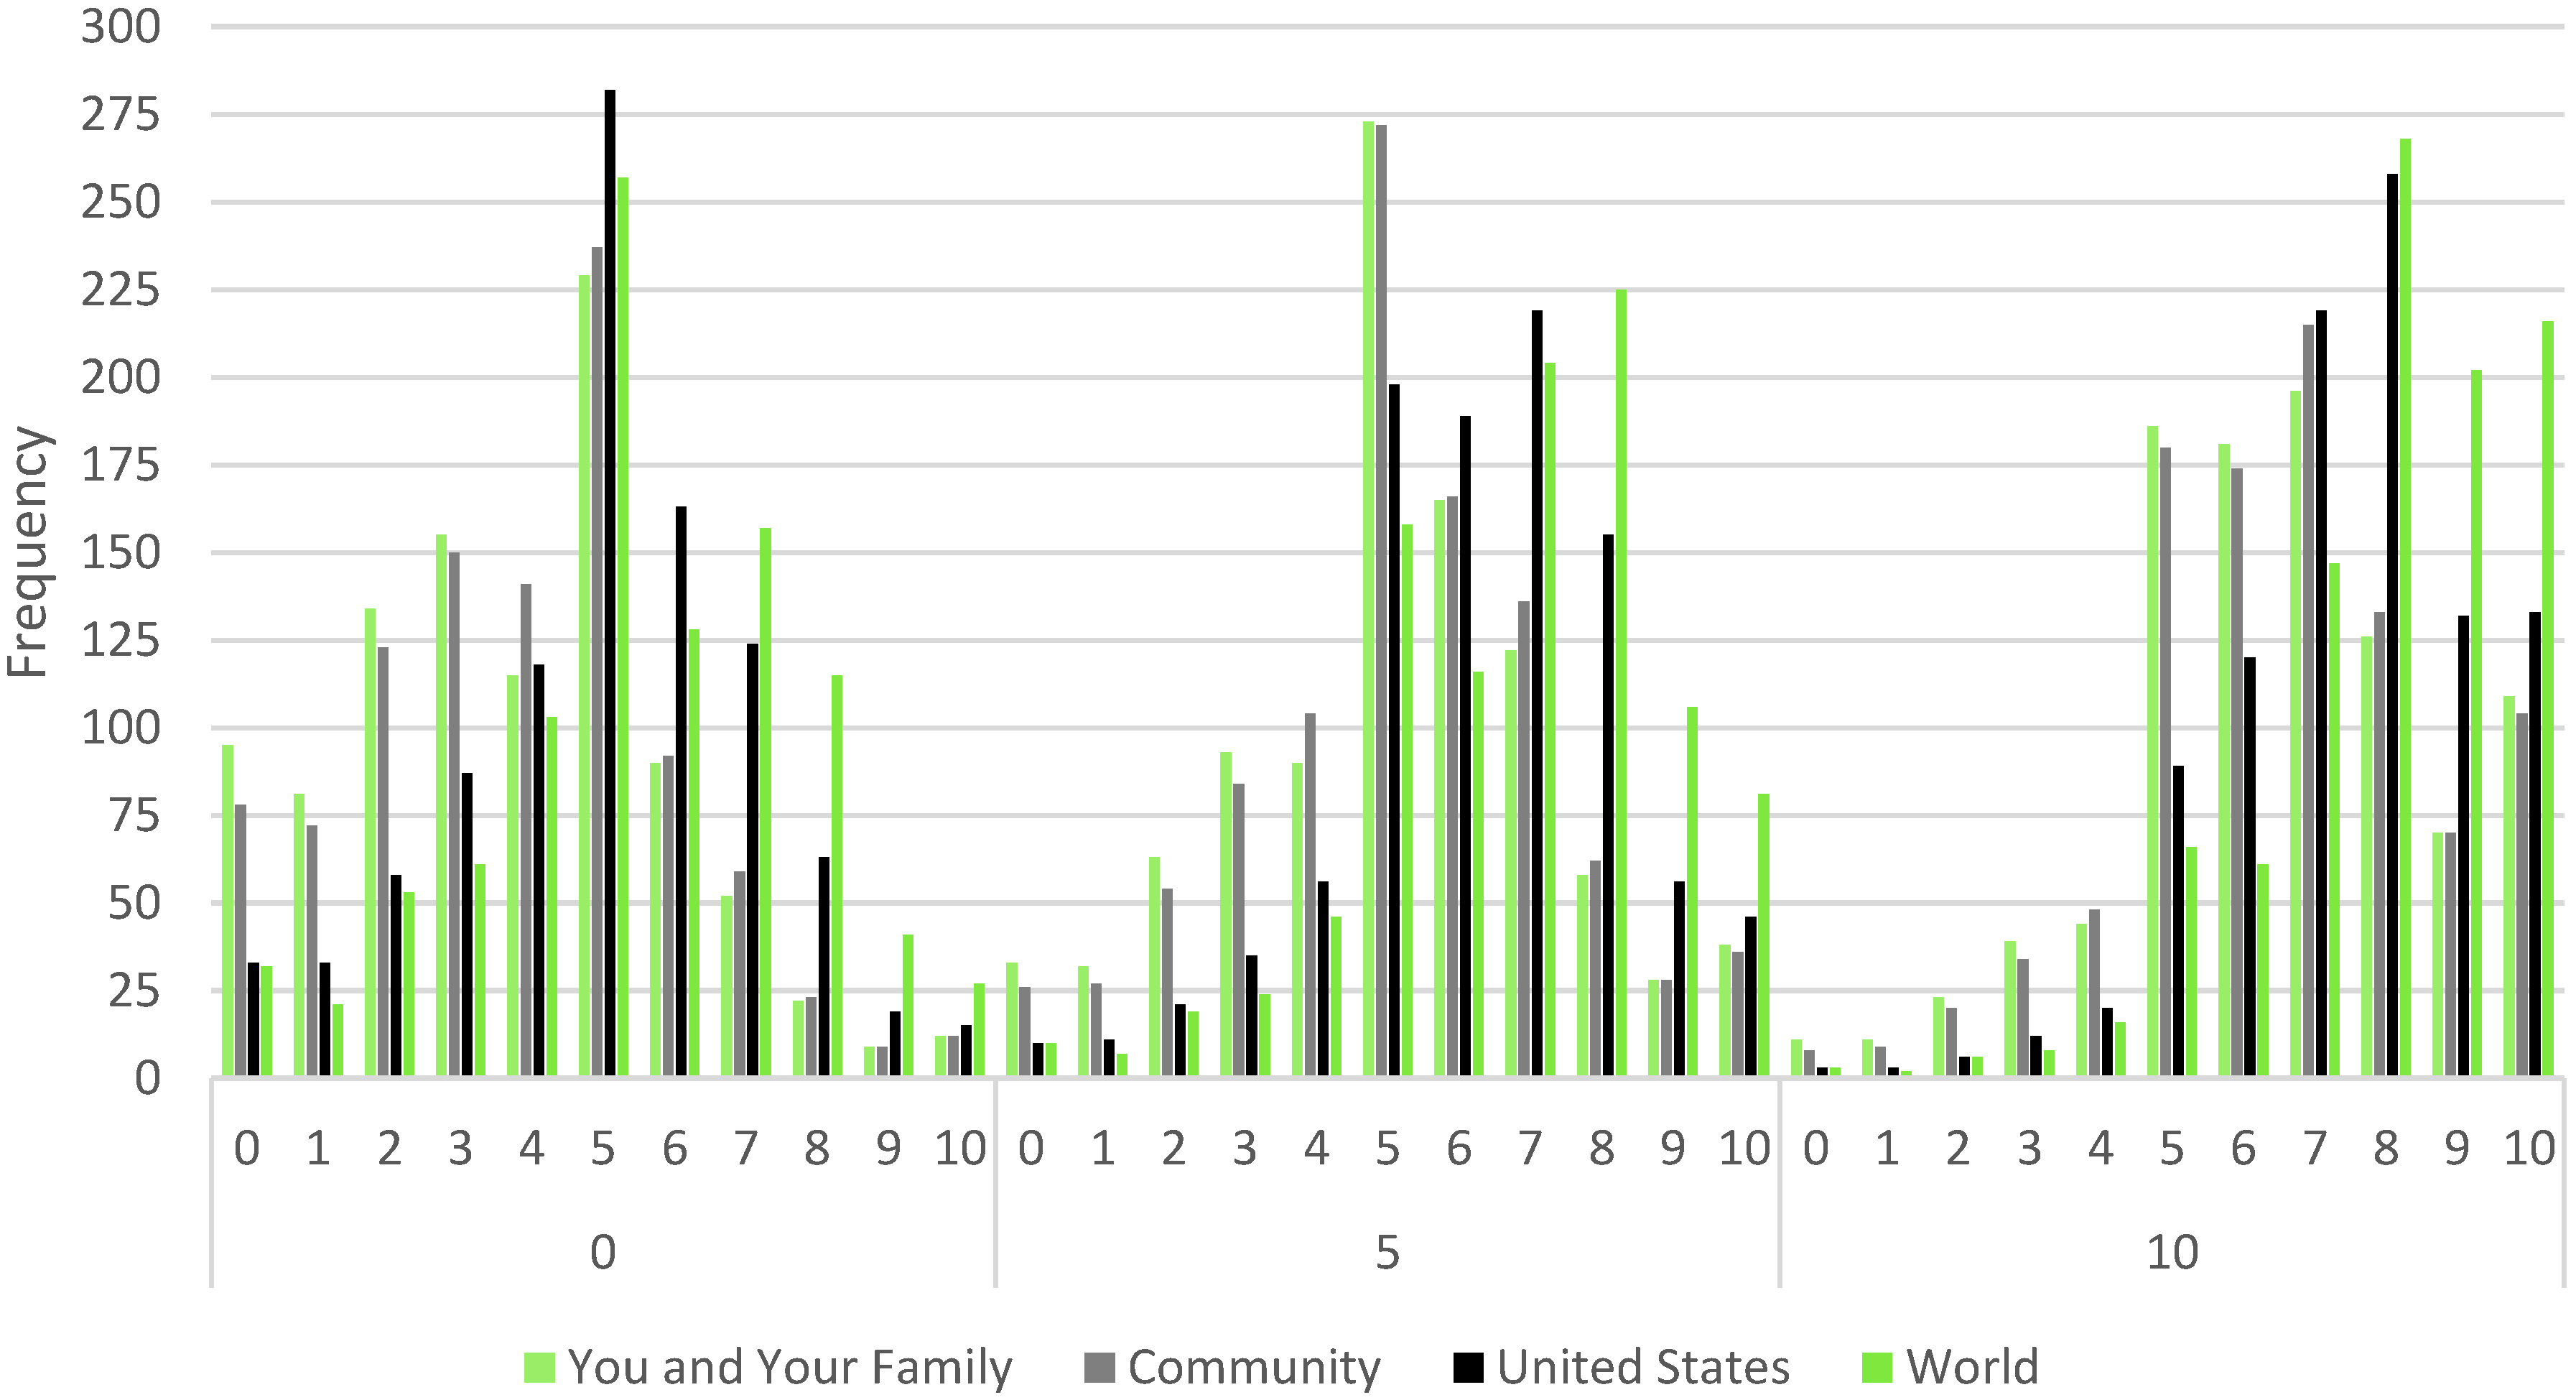
Figure 1 depicts the distribution of individual perceptions of the health risk caused by climate change by group. This illustration suggests that there will be a significant difference in risk between the US and world groups and all of the others. It is unclear whether there will be a difference between the you and your family group and the community group. To examine our first research question, we will analyze these groups using simple paired
t-tests. A paired t-test allows us to determine whether there is a statistically significant difference between the means of each group. Based on
Figure 1, we anticipate that there will be a difference for every pairing except, perhaps, the you and your family group and the community group.
Based on the distributions in
Figure 1, we believe it is safe to explain how we intend to examine our second research question, which seeks to understand the determinants of these differences in risk perceptions. Due to the noncontinuous, ordered nature of the data, an ordered logit is an appropriate analytical approach to examine the data [
39]. One common concern with ordered data is the empty bin problem [
40]. The empty bin problem is when there is an insufficient number of observations in the ordered categories, which results in first-order estimation errors (e.g., no females reporting a health risk value of 3 for the world), which will result in biased standard errors and coefficient estimates. This concern is particularly relevant given we operationalize a dependent variable with 11 ordered categories. An easy test of the empty bin problem is to run a Brant Test following an ordered logit. If the Brant Test is unable to estimate, this indicates that there is a significant empty bin problem. Fortunately, we were able to estimate a Brant Test for each of our models, which suggests that the ordered categories for each group are sufficiently populated.
Figure 1.
Perceptions of the health risk caused by climate change by geographical group.
Figure 1.
Perceptions of the health risk caused by climate change by geographical group.
Note: The frequencies are based on the question, “Indicate the level of risk posed by global warming and climate change to the health of the following groups.” The four groups were (1) “You and your family”; (2) “Your community”; (3) “The US”; and (4) “The world”.
Examinations of public opinion on climate change issues frequently identify various attitudes, risk perceptions, trust evaluations, measurements of knowledge, and demographics that influence these opinions [
2,
41,
42,
43]. The ISTPP National Climate Change Survey includes several such measures, which are integrated into the ordered logit models. We include three measures of risk, two of trust, two attitudes, a measure of knowledge, and seven demographic characteristics (Variable summaries and definitions can be found in
Appendix).
Attitudes can be powerful drivers of behavior. Tversky and Kahneman suggested that “when faced with a complex problem, people employ a variety of heuristic procedures in order to simplify the representation and evaluation of prospects” [
44]. Previous examinations of risk perceptions related to climate change reveal a strong influence of two particular attitudes, ecological values, and efficacy [
41,
45]. The ISTPP National Climate Change Survey included several questions measuring climate change efficacy, where respondents were asked to evaluate how their actions influence climate change. These variables were indexed to create a single efficacy measure (Cronbach’s alpha = 0.8325). Stoutenborough and Vedlitz argued, “Those with greater efficacy should be more aware of their impact on the environment, which should cause them to be more concerned about environmental issues” [
45]. Therefore, we anticipate that those who have greater climate change efficacy will perceive a greater health risk caused by climate change.
Similarly, measures of ecological values have been strong predictors of various climate change attitudes and beliefs [
2,
31,
41,
45]. The ISTPP National Climate Change Survey included a commonly used abbreviated version [
41] of the New Ecological Paradigm developed by Dunlap
et al. [
46]. The measure of ecological values is an index of seven questions (Cronbach’s alpha = 0.8327). The extant literature clearly indicates that those with stronger ecological values will be more likely to perceive climate change risk and support climate policy. Consequently, we anticipate that those with stronger ecological values will be more likely to perceive a health risk.
Although it may seem odd to test the predictive power of risk perceptions on a perception of health risk, we believe these baseline perceptions are essential. Specifically, we examine the influence of general risk perceptions about climate change, the environment, and health care. We anticipate that those who are more concerned about climate change will believe that the health risk associated with climate change will be higher. Similarly, those who are more concerned with health care should be more likely to believe that the health risk will be higher. Finally, those who are more concerned about the environment should be more likely to express higher levels of health risk. Though two of these measures seem very similar to the dependent variable, the specificity of the dependent variable causes them to be different. For example, an individual may be concerned about climate change, but only from the perspective that it might cause sea levels to rise, which may not be connected to health issues for that individual. Similarly, an individual may be concerned about health care because of inadequate access to quality care, which likely is not influenced by health risks caused by climate change. These risk perceptions capture preexisting perceptions about their respective issue domains.
We also include two measures of trust: trust in government and trust in scientists. Previous research suggests that those who trust scientists are more likely to perceive higher levels of climate change risk [
45] because those who trust scientists should be more likely to believe the scientific consensus that climate change is occurring and that this will cause any number of negative impacts on humans. Simply, those who do not trust scientists are less likely to believe that climate change is real, which should decrease their perception of any potential health risks associated with climate change. Conversely, when things go wrong, we turn to the government to fix the problem. With this in mind, we suspect that those who trust the US government should be less likely to perceive health risks associated with climate change because they expect the government to prevent any such risk.
Extant research also illustrates the importance of knowledge on evaluations of risk and other climate attitudes [
45]. As the risk literature consistently finds, knowledge-related issues predict risk perceptions [
30,
47,
48]. Thus, those who are knowledgeable are better able to evaluate risk. In the current study, we anticipate that knowledge will have a different predictive power based on the group evaluated. We expect that those who are more knowledgeable will perceive lower health risks for the you and your family group and the community group, as they will be much more knowledgeable of their surroundings and the localized threat of a health risk due to climate change. However, the larger the group, the more difficult it is to evaluate this risk, as familiarity with the specifics of these groups dwindles. Consequently, we expect that those with more knowledge will perceive greater health risks for the US and the world.
Finally, studies of public opinion on climate issues consistently illustrate the importance of controlling for the influence of demographic indicators [
3,
42]. Specifically, we control for the influence of gender, income, marital status, political ideology, party identification, education, and age. Unfortunately, predicting the specific directionality of these relationships has proven difficult, as demographic indicators have been shown to be inconsistent predictors of climate policy, even when using the same survey data [
2]. Due to this lack of consistency, we operate under the simple expectation that demographic indicators may predict perceptions of health risk.
3. Results
We begin with an examination of our first research question, which asked whether the public viewed the health risk associated with climate change differently depending upon the contextual differences for each evaluation. As indicated in
Figure 1, there was reason to believe that the public differed in their evaluations based upon the geographical group. However, it is possible that these perceived differences were statistically no different from one another.
We estimated paired t-tests for each combination of groups. These results are presented in
Table 1. As the results indicate, there is a statistically significant difference between all of the groupings, except the you and your family group and the community group. Although the community group did have a larger mean, the difference fell short of an accepted level of statistical significance. Overall, we find support for our first research question, as only one of the six combinations of groups was not significantly different from one another. These results suggest that we should find similar predictors for the you and your family group and the community group, while different predictors should determine health risk assessments for the US and world, which should differ from one another as well.
Table 1.
Comparison of Health Risk Means.
Table 1.
Comparison of Health Risk Means.
| n | Mean | Standard Error | Standard Deviation |
|---|
| You and Your Family | 1296 | 4.837 | 0.078 | 2.833 |
| Community | 1298 | 5.006 | 0.077 | 2.808 |
| Difference | | −0.169 | 0.110 | |
| You and Your Family | 1296 | 4.837 | 0.078 | 2.833 |
| US | 1298 | 5.909 | 0.076 | 2.774 |
| Difference | | −1.072 *** | 0.110 | |
| You and Your Family | 1296 | 4.837 | 0.078 | 2.833 |
| World | 1284 | 6.560 | 0.080 | 2.871 |
| Difference | | −1.723 *** | 0.112 | |
| Community | 1298 | 5.006 | 0.077 | 2.808 |
| US | 1298 | 5.909 | 0.076 | 2.774 |
| Difference | | −0.903 *** | 0.109 | |
| Community | 1298 | 5.006 | 0.077 | 2.808 |
| World | 1284 | 6.560 | 0.080 | 2.871 |
| Difference | | −1.554 *** | 0.111 | |
| US | 1298 | 5.909 | 0.076 | 2.774 |
| World | 1284 | 6.560 | 0.080 | 2.871 |
| Difference | | −0.651 *** | 0.111 | |
The second research question concerned the identification of the determinants of health risk perceptions. The results of each of the four analyses are all presented in
Table 2 to better enable comparisons among the models. All four models were estimated with robust standard errors to combat heteroskedasticity, and each performs quite well.
Table 2.
Determinants of the Health Risk caused by Climate Change by Geographical Group.
Table 2.
Determinants of the Health Risk caused by Climate Change by Geographical Group.
| You and Your Family | Community | United States | World |
|---|
| Coefficient | Prob. | Coefficient | Prob. | Coefficient | Prob. | Coefficient | Prob. |
|---|
| Risk | | | | | | | | |
| Climate Change | 0.223 (0.039) | 0.000 | 0.224 (0.039) | 0.000 | 0.230 (0.040) | 0.000 | 0.227 (0.036) | 0.000 |
| Environment | 0.026 (0.042) | 0.533 | 0.054 (0.041) | 0.193 | 0.071 (0.042) | 0.089 | 0.093 (0.039) | 0.018 |
| Health Care | 0.048 (0.028) | 0.088 | 0.044 (0.027) | 0.102 | 0.019 (0.028) | 0.492 | −0.011 (0.029) | 0.707 |
| Trust | | | | | | | | |
| Government | 0.129 (0.084) | 0.129 | 0.117 (0.083) | 0.161 | 0.070 (0.086) | 0.415 | 0.009 (0.085) | 0.908 |
| Scientists | 0.023 (0.005) | 0.000 | 0.023 (0.005) | 0.000 | 0.034 (0.005) | 0.000 | 0.038 (0.005) | 0.000 |
| Attitudes | | | | | | | | |
| Ecological Values | 0.348 (0.109) | 0.001 | 0.389 (0.109) | 0.000 | 0.585 (0.109) | 0.000 | 0.701 (0.111) | 0.000 |
| Efficacy | 0.639 (0.110) | 0.000 | 0.665 (0.104) | 0.000 | 0.663 (0.104) | 0.000 | 0.564 (0.108) | 0.000 |
| Knowledge | −0.732 (0.331) | 0.027 | −0.663 (0.323) | 0.040 | −0.684 (0.337) | 0.043 | −0.158 (0.328) | 0.630 |
| Demographics | | | | | | | | |
| Age | −0.009 (0.03) | 0.009 | −0.009 (0.003) | 0.005 | −0.011 (0.003) | 0.001 | −0.009 (0.003) | 0.014 |
| Female | 0.044 (0.111) | 0.691 | 0.037 (0.113) | 0.742 | 0.181 (0.118) | 0.123 | 0.165 (0.119) | 0.169 |
| Education | −0.090 (0.027) | 0.001 | −0.071 (0.026) | 0.007 | −0.062 (0.026) | 0.020 | −0.056 (0.028) | 0.045 |
| Married | 0.172 (0.126) | 0.173 | 0.121 (0.128) | 0.343 | 0.069 (0.128) | 0.590 | −0.032 (0.127) | 0.797 |
| Party Identification | −0.094 (0.034) | 0.007 | −0.089 (0.034) | 0.010 | −0.103 (0.036) | 0.005 | −0.082 (0.036) | 0.025 |
| Political Ideology | 0.069 (0.052) | 0.187 | 0.065 (0.051) | 0.200 | 0.063 (0.053) | 0.234 | 0.044 (0.053) | 0.405 |
| Income | −0.026 (0.014) | 0.077 | −0.035 (0.015) | 0.020 | −0.022 (0.015) | 0.144 | −0.018 (0.016) | 0.257 |
| Cut Point 1 | −0.782 (0.500) | | −0.624 (0.491) | | −0.759 (0.494) | | −0.486 (0.508) | |
| Cut Point 2 | −0.070 (0.492) | | 0.110 (0.487) | | −0.041 (0.489) | | 0.043 (0.502) | |
| Cut Point 3 | 0.672 (0.491) | | 0.867 (0.485) | | 0.650 (0.491) | | 0.780 (0.498) | |
| Cut Point 4 | 1.333 (0.489) | | 1.536 (0.486) | | 1.286 (0.490) | | 1.305 (0.501) | |
| Cut Point 5 | 1.800 (0.488) | | 2.106 (0.486) | | 1.891 (0.488) | | 1.915 (0.499) | |
| Cut Point 6 | 2.933 (0.491) | | 3.247 (0.492) | | 3.056 (0.495) | | 3.017 (0.507) | |
| Cut Point 7 | 3.694 (0.496) | | 3.991 (0.499) | | 3.841 (0.501) | | 3.553 (0.512) | |
| Cut Point 8 | 4.524 (0.504) | | 4.894 (0.510) | | 4.809 (0.507) | | 4.385 (0.520) | |
| Cut Point 9 | 5.223 (0.511) | | 5.637 (0.518) | | 5.923 (0.518) | | 5.499 (0.532) | |
| Cut Point 10 | 5.803 (0.519) | | 6.238 (0.526) | | 6.776 (0.526) | | 6.455 (0.542) | |
| Number of Cases | 1047 | | 1049 | | 1052 | | 1037 | |
| Wald Chi2 | 535.71 | 0.0000 | 5790.29 | 0.0000 | 7380.16 | 0.0000 | 6450.61 | 0.0000 |
| Count R2 | 0.253 | | 0.271 | | 0.275 | | 0.309 | |
| Log Pseudolikelihood | −2110.2809 | | −2093.2736 | | −1997.663 | | −1894.1244 | |
We begin with the analysis of the group that each respondent has the most familiarity with—you and your family. The model is able to correctly predict 25.3% of the cases, which represents a 178% improvement over random chance (9.09%). With 11 potential outcomes, this is a strong indicator that the model is quite robust. The analysis reveals that those who are more concerned about climate change and health care were more likely to perceive higher levels of health risk due to climate change. Additionally, those who trust scientists, and have stronger ecological values, greater efficacy, and less knowledge were more likely to report higher levels of health risk. Finally, four demographic indicators predict health risk perceptions for the you and your family group. Specifically, those who are older in age, more educated, more strongly associated with the Republican Party, and those with higher incomes were less likely to perceive a health risk.
Turning our attention to the evaluations of the health risk to an individual’s community, we find that the model is able to correctly predict 27.1% of the cases, which is a 198% improvement over chance. As noted above, given the insignificant difference with the you and your family group, we expected that the same variables would predict the community group. However, the analysis reveals that an individual’s concern about health care is no longer a predictor. There are no substantively important variations among the rest of the variables. This suggests that the small difference between the means may have been related to the connection between concern for health care and the community. This, when combined with the previous model, suggests that evaluations of general concern for health care were likely based on personal concerns (e.g., the cost or quality of coverage), and not broad-based concerns (differences in the quality of care depending upon where one lives—rural/urban, wealthy region/poor region, etc.).
The results in
Table 1 suggest that the determinants for health risk will be different when we examine them from the perspective of the US. These results indicate that this expectation was correct. This analysis also performs well, correctly predicting 27.5% of the cases, which is a 202% improvement over chance. The analysis indicates that those who are more concerned with climate change, more concerned with the environment, trust scientists, have stronger ecological values, are more efficacious, and less knowledgeable were more likely to perceive a higher health risk due to climate change. We anticipated that knowledge would lead to predictions in the opposite direction, as an individual who is truly knowledgeable should know that there are many potential health risks for many different regions of the US [
49]. It is also worth highlighting that the less proximate the group, the stronger the influence of broad-based risks on attitudes. Specifically, we find that concern for the environment predicted health risks, but health care had very little impact. This, again, suggests that concern for health care is driven by personal concerns. Finally, the models also reveal that those who are older in age, more educated, and more strongly associated with the Republican Party were less likely to perceive a health risk. An individual’s income is no longer a predictor when the geographical group is expanded to the entire country.
The final model evaluates an individual’s perception of the health risk for the world. The model correctly predicts 30.9% of the cases, which is a 239% improvement over chance. As noted, we expected that the determinants for this model would differ from the previous three because the mean level of health risk was significantly higher than all of the others. The analysis indicates that this expectation is supported. The model reveals that the predictors of the US group are similar to those of the world, except that knowledge is no longer a predictor. While this is still not what we anticipated, an insignificant knowledge measure does indicate that those with more knowledge are able to consider the nuance of these issues, as this is the only model where knowledge is not a significant, negative indicator. Additionally, concern for the environment is a much stronger predictor in this model, which suggests that concern for the environment stems from a more broad-based perspective, not a local.
It can be difficult to ascertain exactly what coefficient estimates, robust standard errors, and
p-values really mean when estimating an ordered logit model. It is often easier to interpret these results through an illustration [
50]. Simulated distributions represent the expected distribution of health risk perceptions for the respective variables. These simulations are based on predicted probabilities, which held each of the other variables in the model constant at its median. Consequently, these distributions represent the “average” person as the specifics of each respective variable changes. The predicted probabilities were used to estimate the expected distribution for 1000 responses for each of the distributions. Given the number of variables and models estimated, there are far too many potential distributions to illustrate. For parsimonious reasons, we will highlight a few to provide a substantive interpretation for several of the above statistically significant relationships.
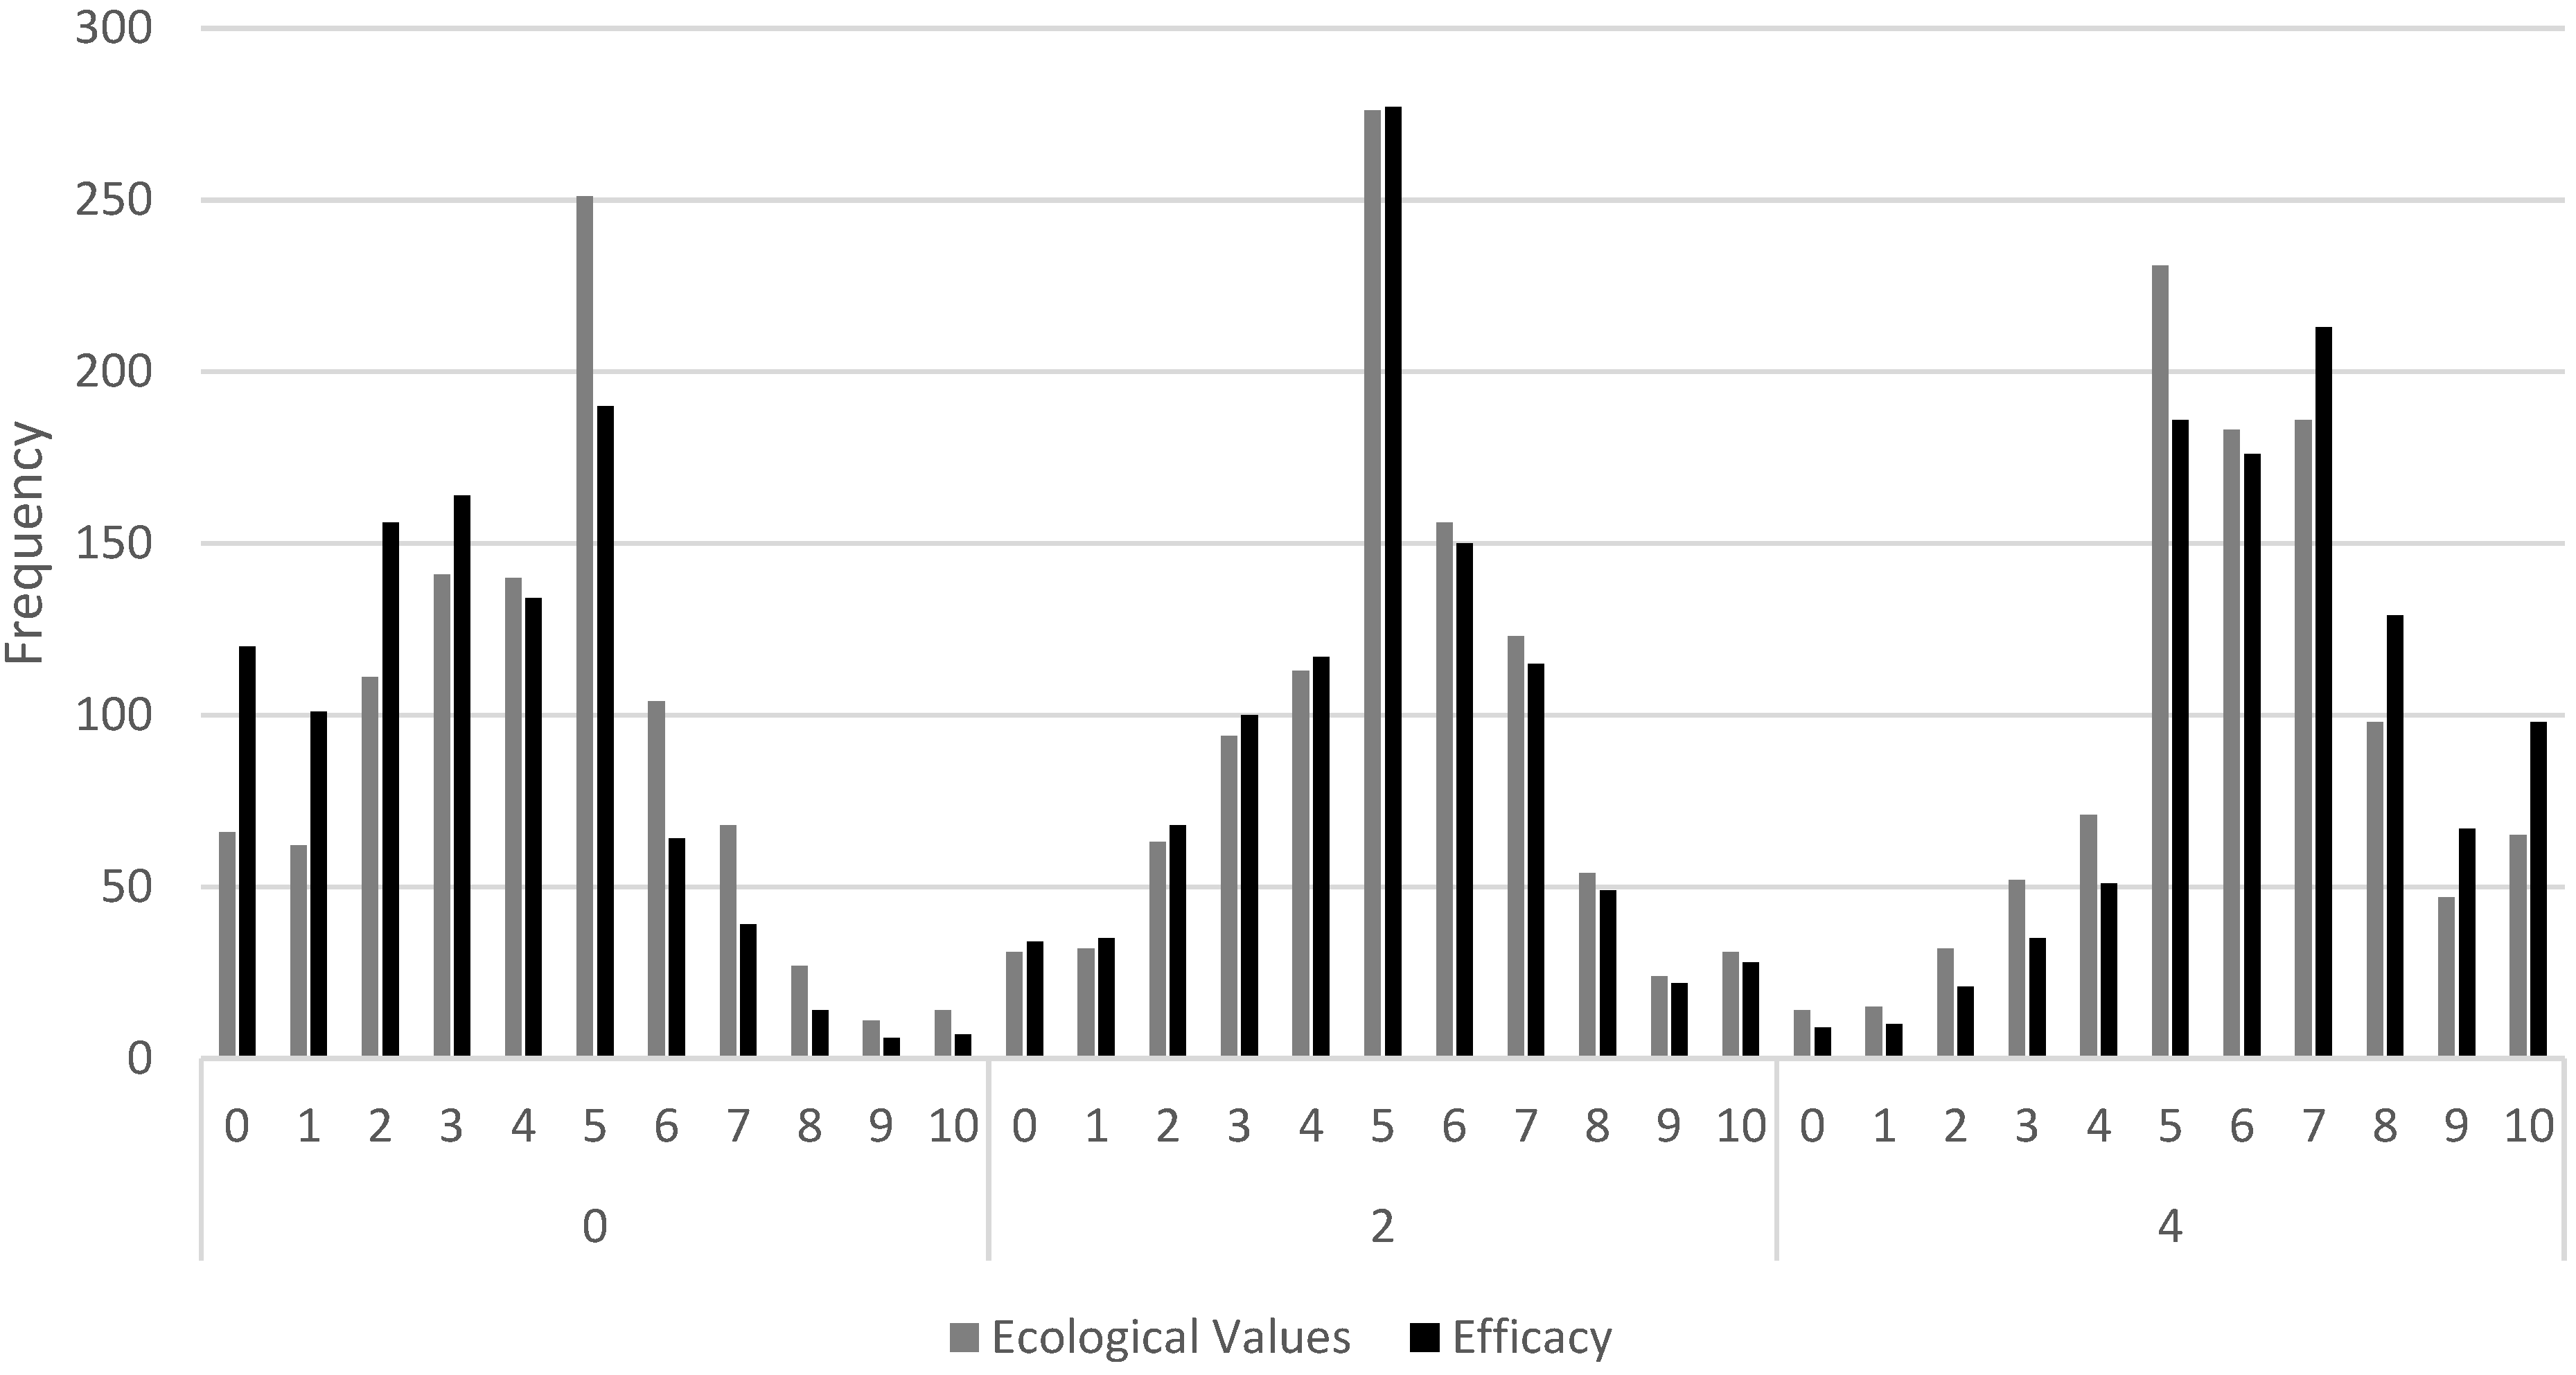
To illustrate the power of some of these predictors, we will highlight the influence of ecological values and efficacy in the community model. Recall, both variables are measured on a 0 to 4 scale, and both were strong predictors of health risk. However, as
Figure 2 illustrates, efficacy has a substantially stronger influence on health risk perceptions than ecological values, though ecological values are still very strong. To simplify the presentation of these simulated distributions, we only present three values for each of the dependent variables (the highest, lowest and middle). These sufficiently illustrate how changes to these variables influence an individual’s response to the health risk caused by climate change. The simulation for the community group predicts that, out of 1000 respondents with efficacy equal to 0 (the lowest possible score), we expect to find seven respondents view the health risk as a 10 (the highest level of risk possible). However, by the time efficacy increases to 4 (the highest possible score), the simulation predicts that 98 respondents would report a health risk at 10. This represents a 1300% increase (Similarly, you and your family increased 1150%, the US increased 1256%, and the world increased 714%). Conversely, out of 1000 respondents with ecological values equal to 0 (the lowest possible score), we expect to find 14 respondents view the health risk as a 10. When ecological values rise to 4 (the highest possible value), the simulation predicts this rate will increase to 65. Though important, this only represents a 364% increase. Finally, another way to understand the relative impact of changes to a variable is to examine shifts in the mode of the predicted distribution. When both variables are set to 0, the predicted mode for both is 5 for health risk. When both variables increase to 4, the mode for efficacy increases to be 7, while the mode for ecological values remains at 5. Although, ecological values is clearly having an important impact on perceptions of health risks within one’s community, it is not having as powerful an influence as efficacy.
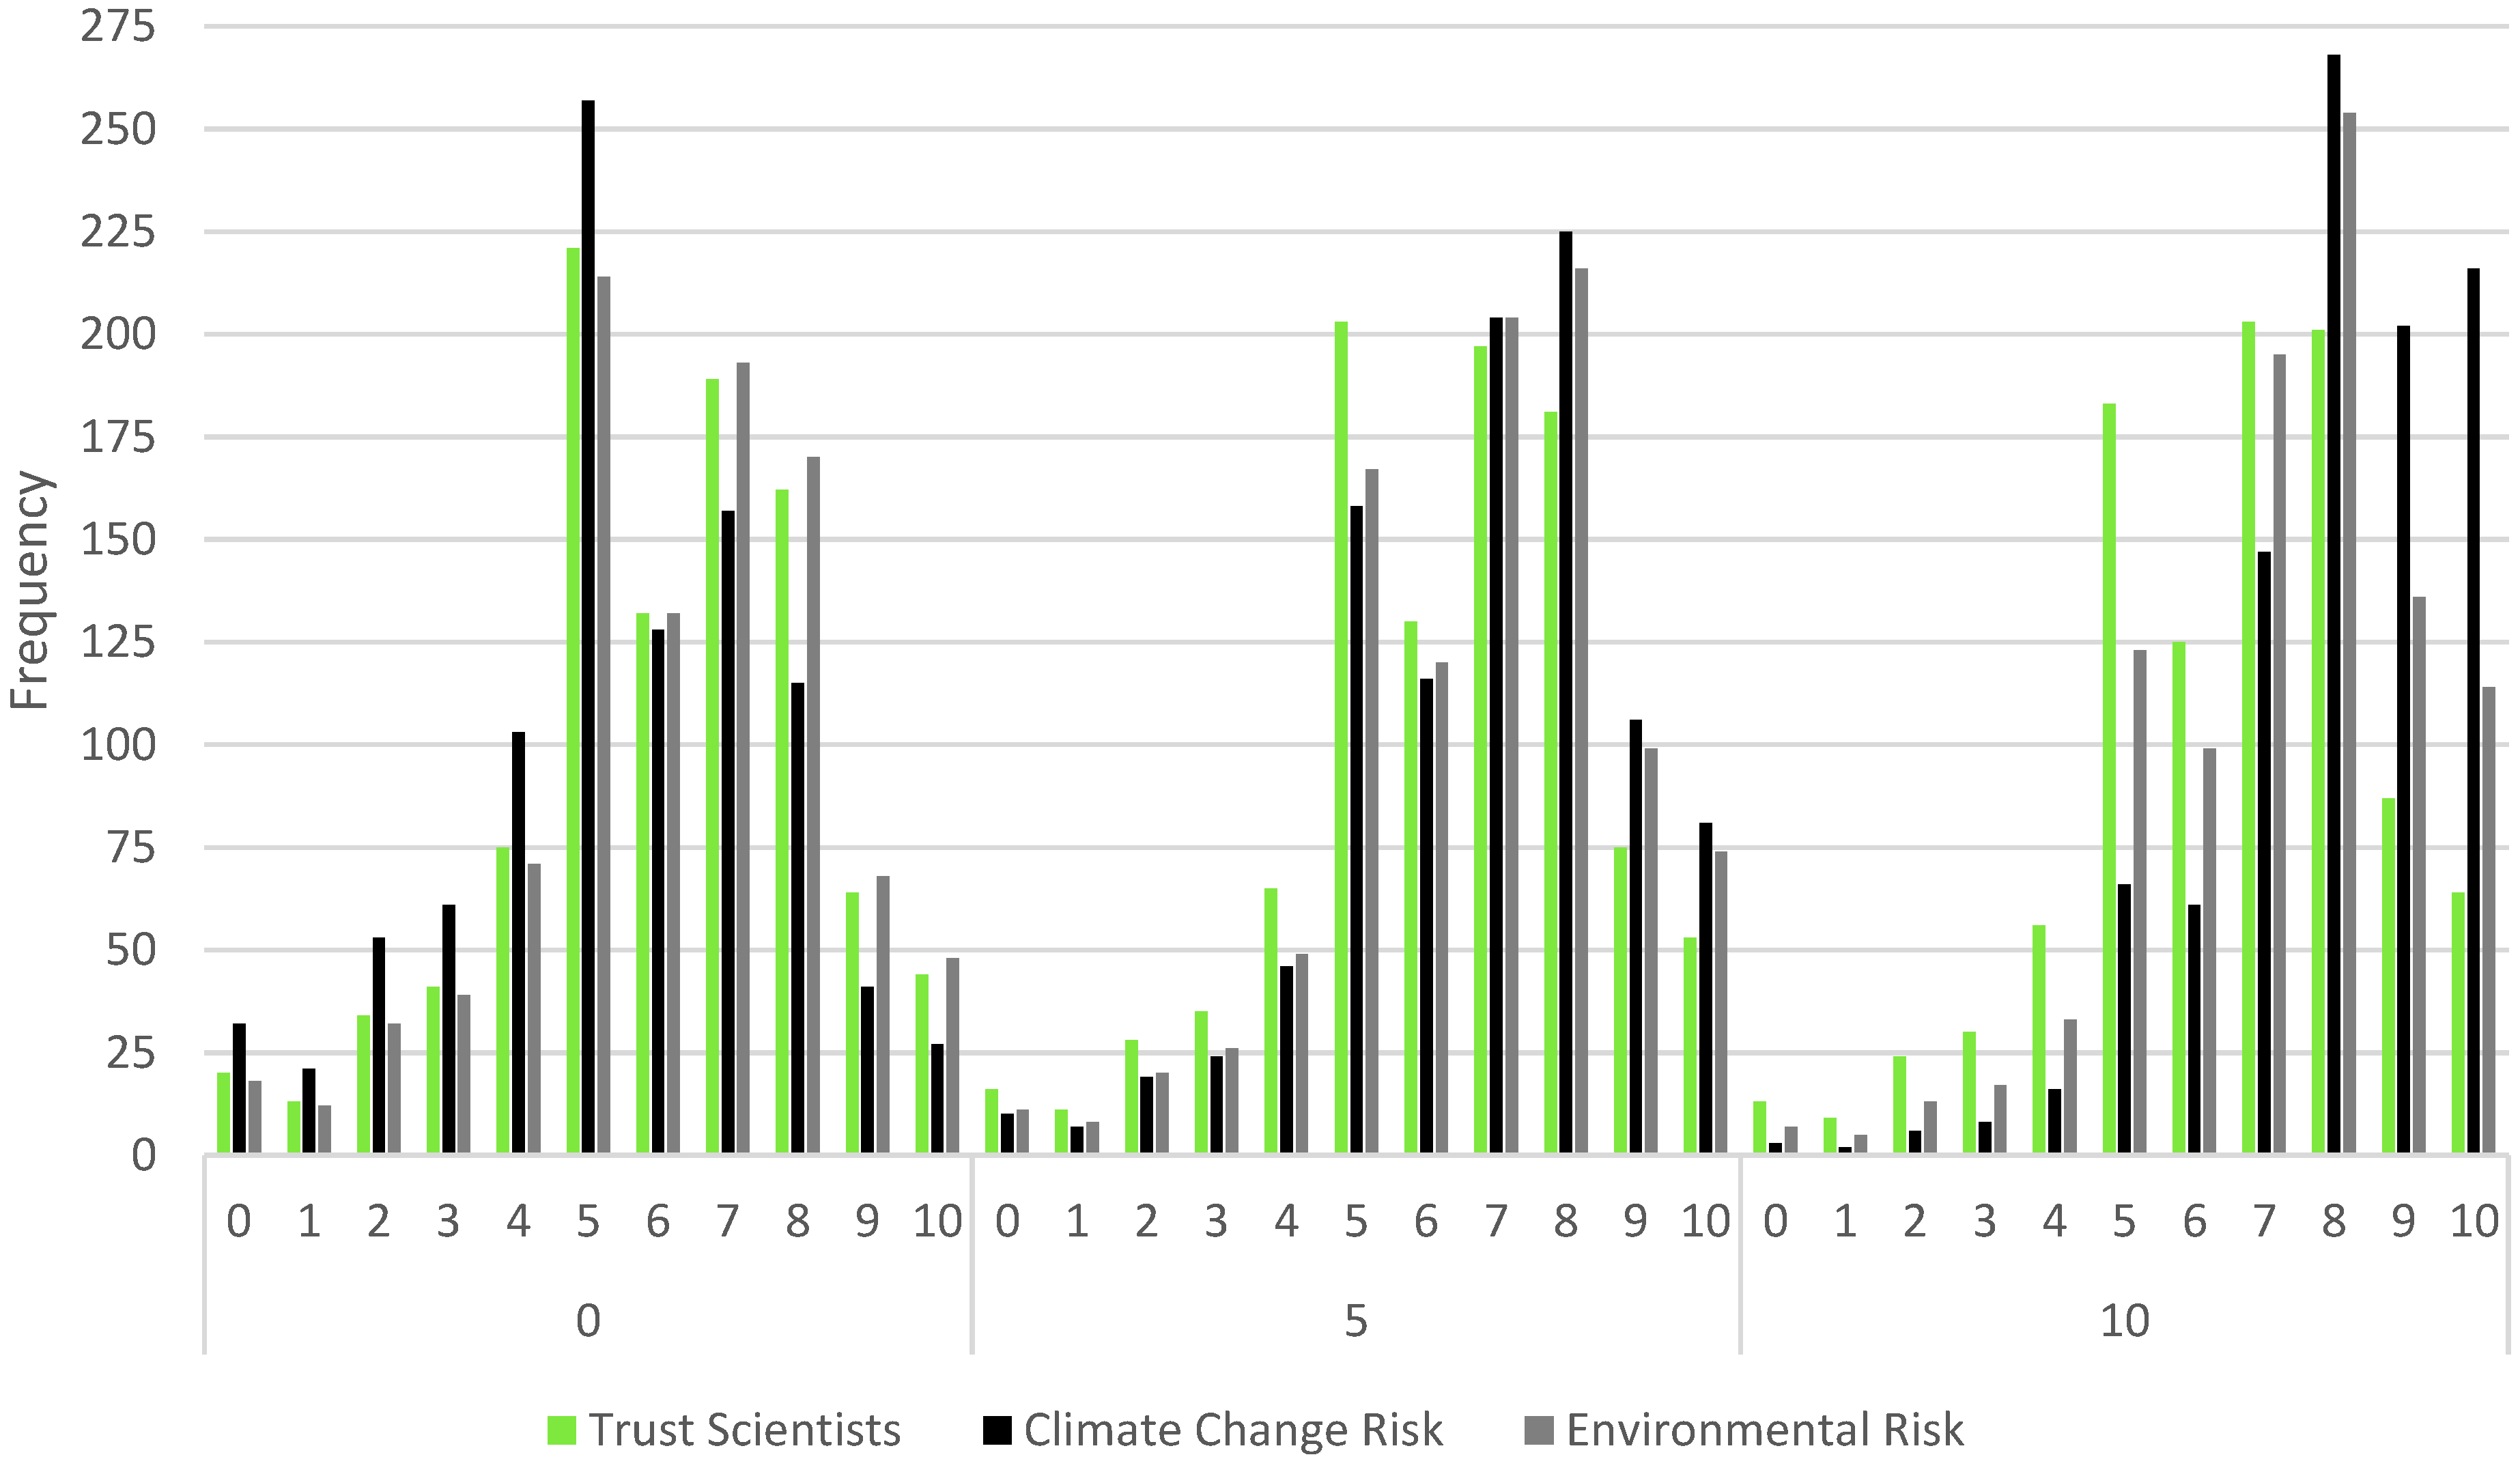
Simulations were also estimated on the ordered logit examining health risks for the world, as visualized in
Figure 3. This time, we estimated simulations for the three statistically significant variables that were each measured on a 0 to 10 scale. Although all three are statistically significant, they clearly have different influences on perceptions of health risk. For example, the simulation predicts that, out of 1000 respondents with a climate change risk perception equal to 0 (the lowest possible perception of risk), we anticipate that only 27 would report a health risk of 10. When climate change risk increases to 10 (the highest possible value), we expect to find that 216 (or more than one out of every five individuals) would report a health risk value of 10. This represents a 700% increase in health risk. In comparison, the simulation for environmental risk predicted 48 and 114, respectively—a 137% increase. Furthermore, the simulation for trust in scientists predicted 44 and 64, respectively—a 45% increase. Finally, when the values for all three variables are set to 0, the mode health risk is 5. Conversely, when all three variables increase to 10, the mode for the trust in scientists variable is 7, while the modes for the two risk variables increase to 8. These represent substantial shifts in health risks. However, despite strong statistical significance, trust in scientists has a noticeably smaller substantive impact on health risk perceptions for the world.
Figure 2.
Simulated Influence of ecological values and efficacy on health risk perceptions in the community group.
Figure 2.
Simulated Influence of ecological values and efficacy on health risk perceptions in the community group.
Figure 3.
Simulated influence of trust in scientists, climate change risk, and environment risk on health risk perceptions in the world group.
Figure 3.
Simulated influence of trust in scientists, climate change risk, and environment risk on health risk perceptions in the world group.
Figure 4.
Simulated influence of ecological values on health risk perceptions in all four groups.
Figure 4.
Simulated influence of ecological values on health risk perceptions in all four groups.
Figure 5.
Simulated influence of climate change risk on health risk perceptions in all four groups.
Figure 5.
Simulated influence of climate change risk on health risk perceptions in all four groups.
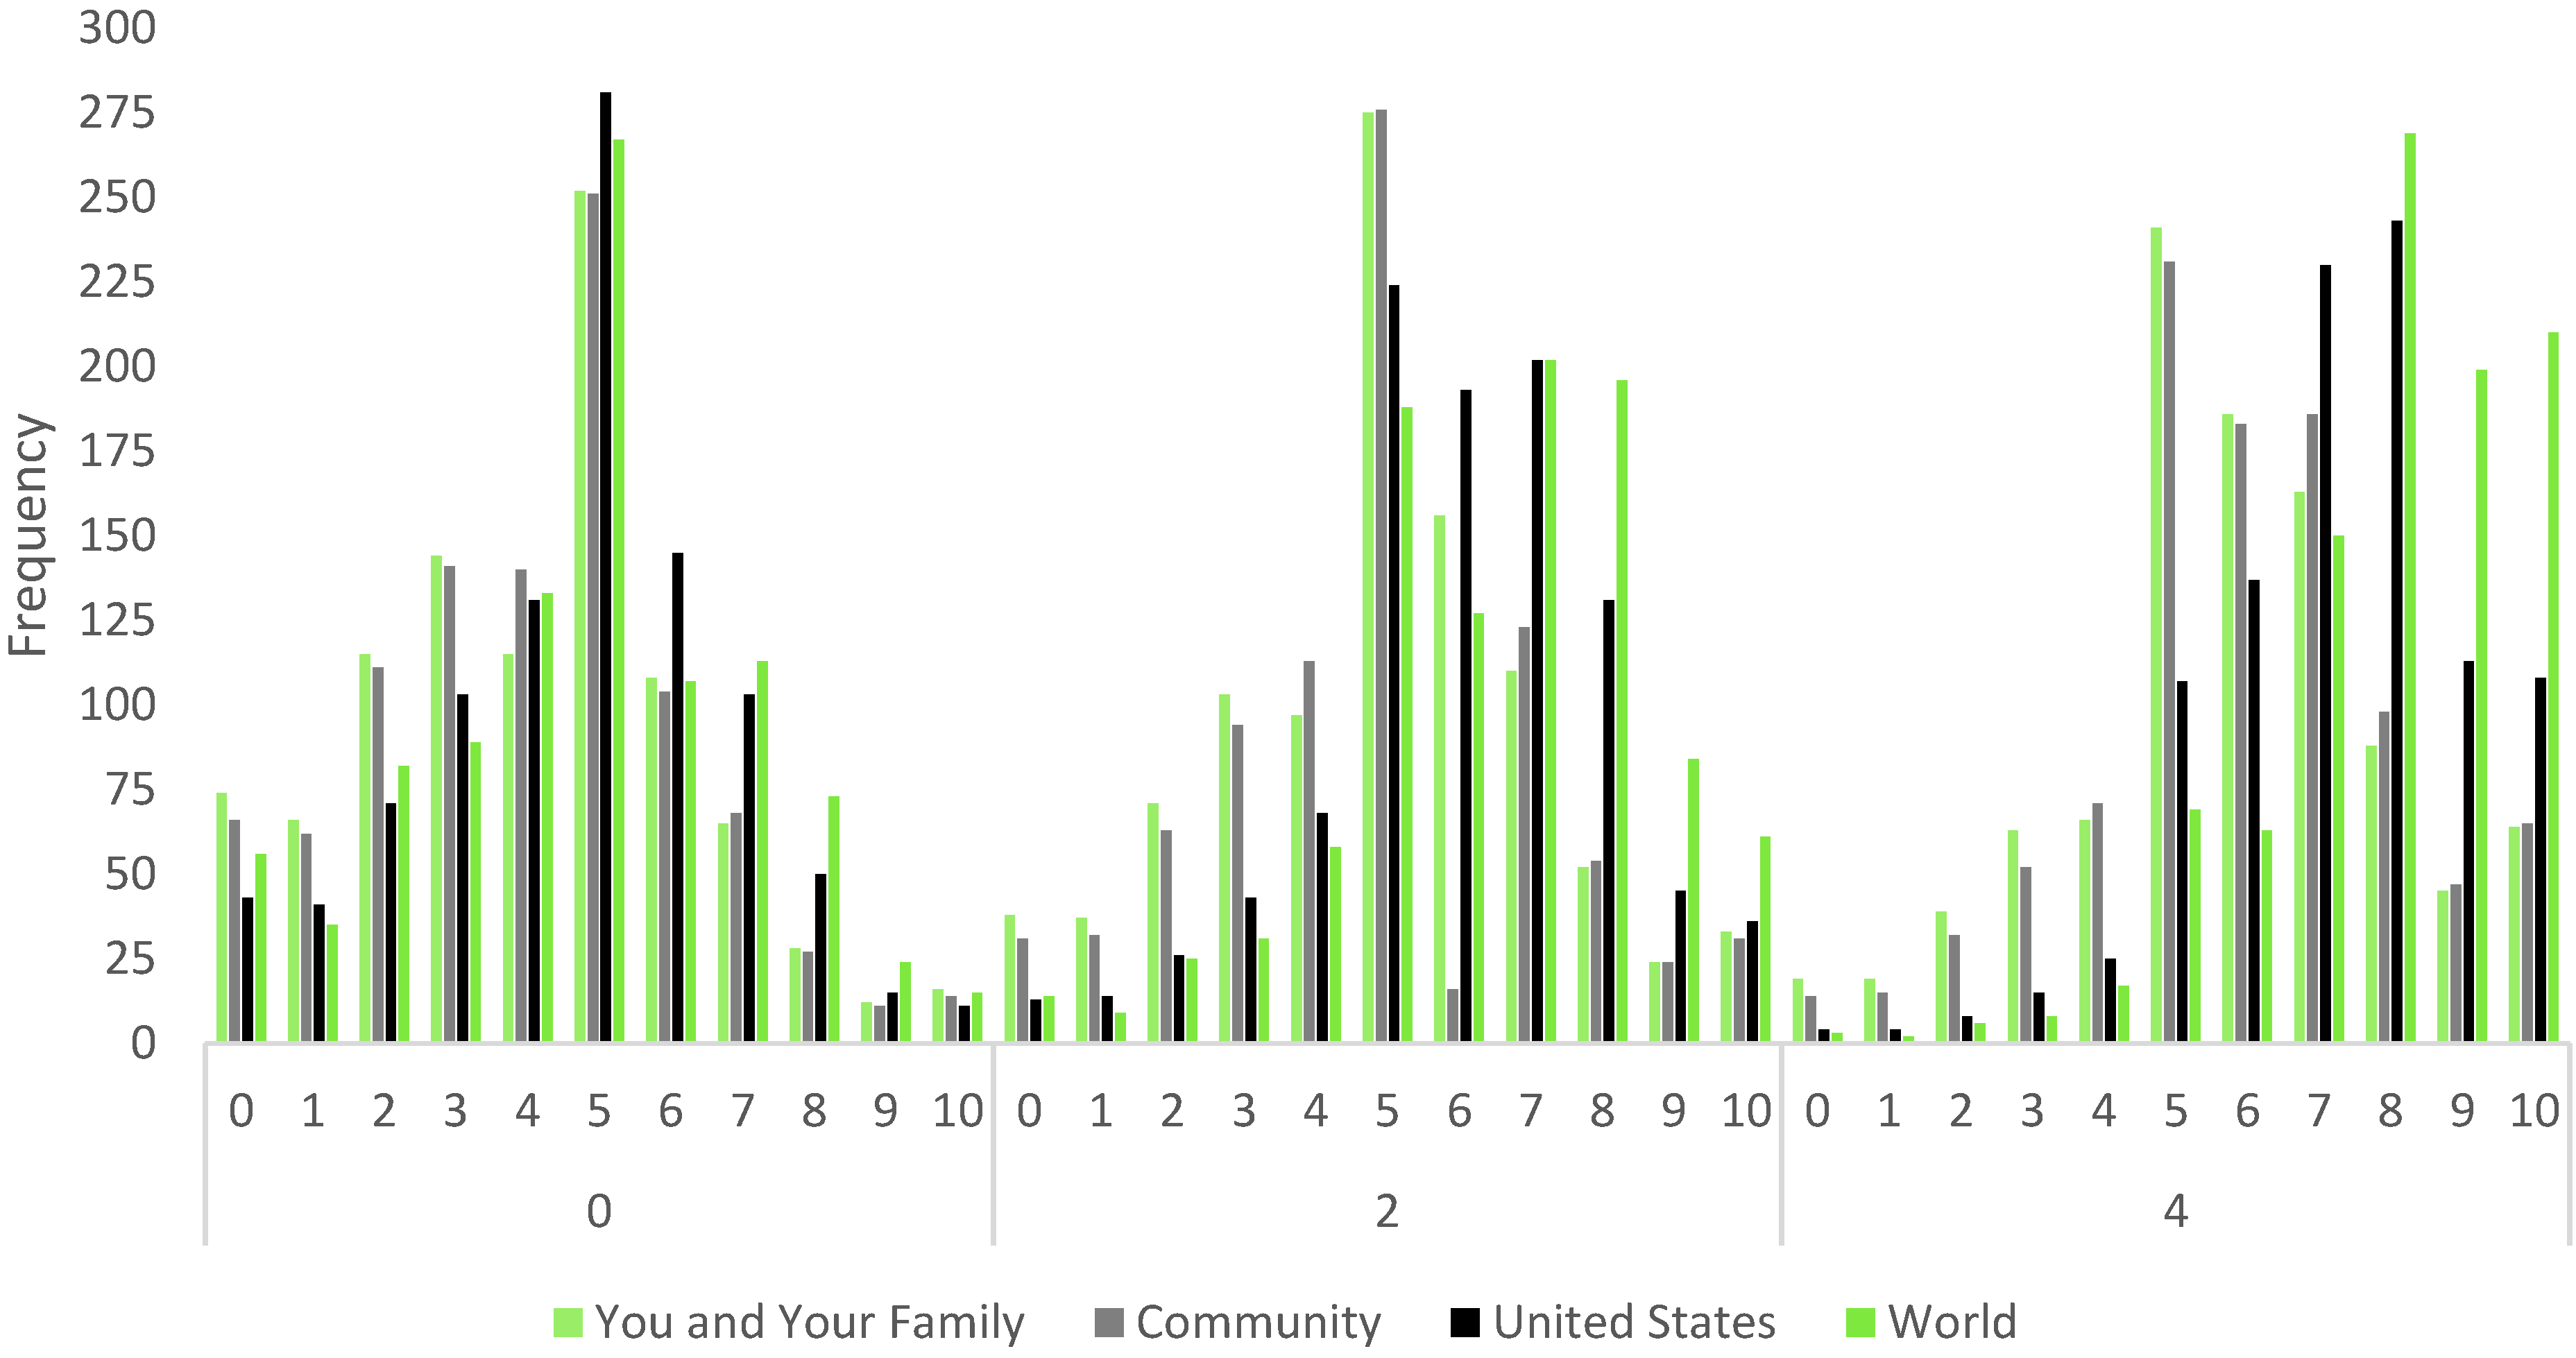
While comparing simulations within a single model can reveal interesting patterns, in terms of the relative importance of each variable, this project also permits exploring the impact of a variable across each of the four models. We highlight two such examples. First, we illustrate the influence of changes to ecological values as we change the geographic group being evaluated in terms of health risk. This is presented in
Figure 4. As the size of the evaluated group increases (from you and your family to the world), the simulations indicate that, out of 1000 respondents with an ecological values score of 0, we expect to find 16, 14, 11 and 15, respectively, would report a health risk value of 10. However, when ecological values increase to 4, we expect to find 64, 65, 108 and 210, respectively, would report a health risk of 10. These represent a 300% increase in the health risk perceptions in the you and your family model, a 364% increase in the community model, an 881% increase in the US model, and a 1300% increase in the world model. Finally, the mode health risk, when ecological values are 0, is 5 for all four groups. When ecological values increase to 4, the mode for the US and world groups shift to 8, with no change to the you and your family or community groups. These simulations suggest that ecological values are more likely to have a stronger influence on perceptions of health risk for geographical groups with which the individual is less familiar. Another way to think about this influence is that ecological values may be more big-picture in nature.
Finally, we will compare the simulations for perceptions of climate change risk on the health risks for all four groups, presented in
Figure 5. At first glance, the distributions in
Figure 5 suggest that climate change risk had the biggest influence on perceptions of the health risk for the world, though it clearly has a strong influence in all four models. However, examining these distributions without the proper context would result in an incorrect assessment. Indeed, the influence of climate change risk is actually fairly consistent across all four models. Again, as the size of the group increases, the simulations indicate that, out of 1000 respondents with a climate change risk of 0, we expect to find 12, 12, 15 and 27, respectively, reporting a health risk of 10. When climate change risk increases to 10, we expect to find 109, 104, 133 and 216, respectively, reporting a health risk of 10. These represent an 808% increase in the you and your family model, a 766% increase in the community model, a 786% increase in the US model, and a 700% increase in the world model. As noted, context is important, and the survey data suggest that the public is generally more concerned to begin with about the health risk associated with climate change at the global scale. While this simulated distribution is the highest, it also had the highest starting point. Finally, the mode health risk, when climate change risk is 0, is a 5. By the time climate change risk is increased to 10, the modes for you and your family and community are a 7, while the mode is 8 for the US and world models. These represent substantial shifts in health risk associated with changes in climate change risk. Regardless, these results suggest a fairly consistent impact for climate change risk.
4. Discussion
We began this project with the intent of understanding whether the public viewed the health risks caused by climate change differently based upon the group being evaluated. We outlined why we expected to find this relationship based upon in-group/out-group theory, optimism bias, the risk literature, and health literature. Several important implications are revealed.
First, the public clearly does not recognize the potential butterfly effect that events in one area can have on others. The results of this analysis clearly indicate that the public is perceiving the health risks associated with climate change differently depending upon the spatial level evaluated. The more proximate the group evaluated, the less likely the individual is to perceive health risk. This is consistent with the way we expect familiarity, self-interest, and the optimism bias to influence these perceptions. In particular, individuals are better able to understand and evaluate risk when they are more familiar with the group [
51,
52].
The policy implications of these findings are significant. This helps to explain the difficulty of convincing the public to support climate policy. If individuals do not believe that they will be personally affected by climate change, the literature suggests that they will be less likely to support policy. We find that the public is clearly less concerned about the health risks the more proximate the group evaluated. This suggests that campaigns in favor of climate policy need to focus on explaining the local threat of climate change on health. This is likely true for other climate-related issues, as well. Unfortunately, this will require many targeted campaigns, which will be more costly and time consuming. Furthermore, policy will have to try to address all of these specific conditions if it is to generate broad public support.
Second, the analyses reveal that individuals rely upon more individualized heuristics when evaluating health risks to more proximate groups. While this is not particularly surprising given the optimism bias, we are unaware of extant research that reveals this relationship with climate change. Similarly, the less familiar individuals are with the group, the more they rely upon broad-based heuristics. These broad-based measures tap into core values and beliefs, which help an individual to evaluate the health risks associated with climate change when an individual is less familiar with the specifics of that group.
Third, although the influence of knowledge did not perform as we anticipated, the results are consistent with theory. Those who are less knowledgeable are more likely to perceive a health risk to themselves and their family, their community, and to the US. This is consistent with the expectations outlined in the level of understanding component of risk. Although the literature generally assumes that evaluations of this level of understanding are based on expert understanding, it stands to reason that if individuals know that they do not understand a complex issue, like climate change, then they would perceive greater levels of risk. This, combined with the connection to the in-group, particularly for the family and community spatial levels, and with a lack of understanding, might cause an individual to be much more worried about the health risk caused by climate change. Similarly, Americans are well known to have some of the highest levels of national pride [
53,
54] and their belief in US exceptionalism [
55,
56], which suggests an inherent in-group bias, which is consistent with the studies finding meaningful differences in attitudes based on country of origin. The results suggest that while the public should not be as familiar with the entirety of the US, this national pride differentiates the effect of knowledge on perceptions of risk, making knowledge have a similar impact on the US as it does on more proximate groups. While the public views the risk to the world as being the greatest, the spatial level and lack of familiarity with the world mitigates the impact of knowledge, making those who are the most knowledgeable no different than those who are the least knowledgeable in their perceptions of the health risk caused by climate change. Additional research is needed to understand this relationship better.
Finally, by comparing the four groupings, this analysis reveals the nuanced substantive impact that specific predictors can have on health risk perceptions. For example, even when coefficient estimates are fairly consistent across the four models, the substantive impacts can vary (e.g.,
Figure 5). Perhaps most importantly, as alluded to above, the substantive and predictive importance of these indicators can change rather drastically when applied to different spatial groupings. This suggests that respondents were tapping into slightly different mental models based on each grouping, which indicates that respondents were actively engaged during the evaluation of each group. The implications of these nuanced findings suggest that there is still much we do not understand about public attitudes and perceptions regarding climate change.


