Abstract
The rapid urbanization processes across the world can be considered one of the most influential factors in climate change, particularly in metropolitan areas. In South America, the growing population and recurrent non-sustainable or controlled urban land management plans are even increasing the negative consequences of urban heat islands. As a representative case study, Soledad in northern Colombia is an area with recurrent strong wind events, which have caused significant damage to property and human lives, conditioning urban plans. This research aimed to assess the micrometeorological conditions in areas of Soledad, where cyclonic events are highly frequent, to gather essential data on urban planning to understand microclimate changes. We conducted in situ measurements of air temperature, surface temperature, wind speed, relative humidity, and atmospheric pressure across different Local Climate Zones (LCZs). Data were analyzed to assess the impact of urban form, vegetation, and sky openness on microclimatic variations. Our results demonstrated that urban morphology, vegetation cover, and sky openness significantly influenced local microclimates, with lower Sky View Factor (SVF) and higher Leaf Area Index (LAI) values contributing to reduced temperatures and improved airflow. Areas with denser urban canyons exhibited higher temperatures and lower wind speeds, emphasizing the need for strategic urban planning to mitigate heat stress and enhance ventilation.
1. Introduction
The rapid process of global urbanization has brought about significant changes in urban areas, exacerbating issues such as air pollution, rising infrastructure costs, the increased demand for public services, and the depletion of land resources [1,2]. Additionally, urbanization has contributed to the intensification of extreme and unexpected meteorological phenomena, including heavy rainfall and strong wind events, which have become more frequent and severe in metropolitan areas [3]. Understanding the past, current, and future atmospheric conditions associated with these events is crucial for developing effective mitigation strategies to reduce their negative impacts [4].
One of the primary meteorological challenges in urban environments is the formation of tornadoes and strong wind events, which often result from the interaction between cold, dry downdrafts and rising warm, humid air [5]. These short-lived but highly intense phenomena are typically associated with cumulonimbus clouds and low atmospheric pressure at the tornado’s core [6]. However, their sudden onset complicates monitoring and communication efforts [7]. Certain geographical similarities have been observed among tornado-prone regions, such as the Pearl River Delta [8] and the Yangtze River in China [9], as well as the Mississippi Valley in the United States [10].
Many authors affirm that since the Industrial Revolution occurred, especially in Europe, urban climate conditions have undergone significant transformations, affected by the increasing use of concrete and the reduction in green areas [11,12]. This has contributed to the urban heat island (UHI) effect, where urban areas experience higher temperatures than the surrounding rural regions [13,14,15]. The UHI effect disrupts the spatial distribution around different topographical positions of key meteorological variables such as minimum and maximum absolute temperatures, atmospheric pressure, wind patterns, cloud cover, and precipitation [16,17].
The UHI phenomenon can be categorized into two types [18,19]: (i) Surface Heat Islands, where buildings and pavements absorb heat during the day, raising surface temperatures by an average of 2 °C, with peaks up to 8 °C, and (ii) Atmospheric Heat Islands, where urban air remains warmer than the surrounding rural areas. It is well known that the intensity of the UHI varies depending on the urban morphology and has a significant impact on local livelihood conditions and thermal comfort [20,21,22].
The urban form and building typologies and materials play a crucial role in modifying local wind patterns and UHI intensity. Factors such as reduced permeable surfaces, increased solar absorption materials, anthropogenic heat release, and restricted ventilation contribute to this effect [23,24]. Public buildings, streets, and air conditioning systems contribute to heat accumulation, while vehicle emissions further increase urban temperatures [25]. The arrangement of buildings can restrict natural ventilation, preventing airflow from cooling city interiors [26]. Parameters such as building height, street width, aspect ratio, and open space availability influence solar heat gain, radiation losses, and convective cooling [27].
The urban heat island (UHI) effect influences local microclimatic conditions by generating temperature and pressure differences between urban and rural areas, mainly due to the concentration of impervious surfaces such as asphalt and concrete, which absorb and retain heat [15,24]. This thermal rise raises the air temperature over urban areas, causing it to expand and rise, which can result in areas of low atmospheric pressure in urban centers [20]. While these thermal contrasts can affect wind behavior on a local scale, it is important to note that strong wind phenomena are mainly determined by larger scale atmospheric processes.
In dense urban fabrics, the resulting airflow driven in part by local pressure gradients may be funneled through narrow streets and between tall buildings, thereby accelerating wind speed in specific corridors [2]. However, it is essential to distinguish between broader scale wind events, which are climatic in nature, and the modulation of wind patterns at the urban microclimate level, which depends heavily on the built environment.
In countries like Colombia, recent studies indicate that high wind events in the city of Soledad between 2001 and 2019 occurred predominantly at temperatures above 30 °C, with 72.4% of the cases being recorded among the three highest temperatures of their respective months [28]. This suggests a direct relationship between increasing temperatures and the occurrence of pre-storm events. Wind circulation in urban areas may mitigate the effects of the UHI, but reduced airflow may exacerbate heat accumulation [29]. Research by Pérez-Arévalo et al. [28] highlights that wind phenomena in Soledad are seasonally dependent, occurring predominantly during the rainy season while being absent in the windy season.
Target 11.9 of SDG 11 (Sustainable Cities and Communities) highlights the need to adopt and implement integrated policies and plans for climate change mitigation and adaptation, disaster resilience, and the development and implementation of holistic disaster risk management at all levels, in line with the Sendai Framework for Disaster Risk Reduction 2015–2030. Considering the above factors and the guidelines of the 2030 Agenda for Sustainable Development, the identification of cyclonic winds in specific urban areas, such as Soledad in Colombia, is essential to develop effective mitigation strategies and emergency response measures. The region’s climate, combined with rapid urbanization [30], makes it a valuable case study for analyzing the interaction between urban heat islands and strong wind events.
Therefore, the main aim of this research is to examine the influence of urban morphology and micrometeorological conditions on the frequency and intensity of cyclonic wind events in Soledad, a coastal city in northern Colombia. For this purpose, we identify areas with historically recurrent aeolian phenomena and evaluate whether local microclimates and urban configurations contribute to their occurrence.
2. Materials and Methods
2.1. Study Area
Soledad is a municipality located in northern Colombia (Figure 1), influenced by the meteorological variations in the Caribbean Sea and the Magdalena River. It is one of the five municipalities that form the metropolitan area of Barranquilla. The climate of the region is classified as warm and humid, with an average maximum temperature of 31 °C and a minimum average of 25 °C. Relative humidity ranges between 77 and 83%. Wind speeds reach 24 km h−1 during the windiest months (December to March) and are on average 11.6 km h−1 during less windy periods. In South America, the common formation is usually associated with mesoscale convective systems and micrometeorological conditions [31,32,33]. According to the Köppen climate classification, Soledad has an ‘Aw’ climate, which corresponds to a tropical savanna climate with a dry winter.
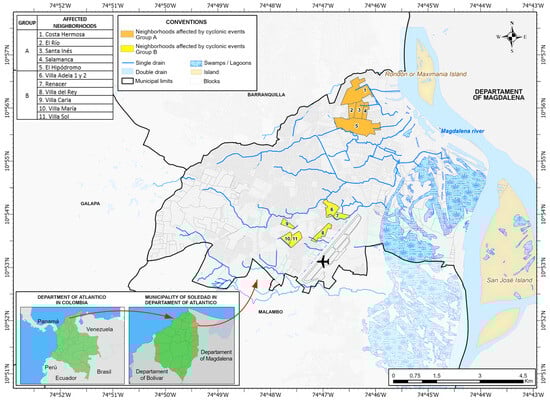
Figure 1.
Location map of the municipality of Soledad.
2.2. Methodology
This study followed a comparative observational and experimental design, combining micrometeorological on-site monitoring and Ernesto Cortissoz airport station data with spatial analysis of the urban morphology through the LCZ (Local Climate Zone) framework.
2.2.1. Incidence of Strong Wind Phenomena in Soledad-Atlántico
The identification of areas with the highest frequency of intense wind events in Soledad was based on the study by [28], which highlighted the concentrations of these events and their associated damages, such as housing destruction, injuries, and fatalities. This analysis emphasized the urgent need to understand this phenomenon to develop effective risk management and response mechanisms. Historical data reveal two groups of neighborhoods, Group A and Group B (Figure 2), both of which experience recurrent wind-related incidents.
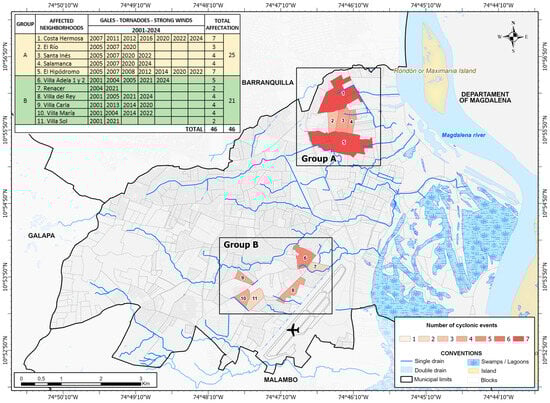
Figure 2.
Groups of neighborhoods with the highest occurrence of high wind events (2001–2024). Source: online press and the Colombian National Unit for Risk and Disaster Management (Unidad Nacional de Gestión de Riesgos y Desastres de Colombia).
The urban morphological characteristics of the points with the highest incidence of high winds reported by the online press were discriminated by two temporal assessments [28], which recorded reports from 2001 to 2019, and a second assessment compiled from the online press between 2020 and 2024.
In the period of 2001–2019, 33 events were recorded between windstorms and ephemeral tornadoes that affected a total of 93 sectors of the municipality, and which were more frequent and intense in their impacts on two groups of neighborhoods: Group A (2001–2019): El Hipódromo, Costa Hermosa, El Río, Salamanca, and Santa Inés suffered 15 incidents, accounting for 16.1% of the total neighborhood damage; and Group B (2001–2019): Villa Adela, Villa Carla, Villa del Rey, Villa Sol, San Vicente, and Renacer suffered 13 incidents, accounting for 14% of the total damage. Together, these two groups accounted for 30.1% of the total damage recorded, confirming their high vulnerability to incidents.
Over the four-year period from 2020 to 2024, a total of 11 strong wind events were recorded, resulting in 33 incidents of damage across 18 neighborhoods. A clear pattern of event recurrence was observed within the neighborhoods categorized under Groups A and B, reinforcing the importance of further analysis in these high-risk areas (Figure 2). In Group A, a total of 15 damage incidents were reported across five neighborhoods, representing 45.6% of all recorded cases as of December 2024. In Group B, eight damage incidents were recorded in Villa Adela 1 and 2, Renacer, Villa del Rey, Villa Carla, Villa María, and Villa Sol.
An unusual meteorological condition was identified where two of the reported wind events occurred at night, rather than during the typical period of peak solar radiation (10:00 a.m.–3:00 p.m.). This anomaly warranted further investigation into the atmospheric conditions that may have influenced these events. Particularly, the windstorm of 25 September 2024 caused extensive damage, affecting not only the municipalities within the Barranquilla Metropolitan Area but also the neighboring municipalities beyond its boundaries.
2.2.2. Assessment of Urban Morphology in Neighborhoods at High Risk of Wind Damage: Microclimatic Context and Susceptibility Patterns
While cyclonic winds are driven by larger scale climatic factors, their impact and damage potential can be modulated by urban morphological features that alter local airflow patterns and thermal conditions.
Given the correlation between urban morphology, intense wind events, and high temperatures [15,21,34,35], a spatial characterization of the locations where these cyclonic events occur is conducted, based on the urban morphological typologies defined by Stewart and Oke (2012). Neighborhoods in both Group A and Group B display two predominant morphological conditions: Compact Low-Rise Residential Areas (LCZ 3) and Open Bare Soil or Sand Areas (LCZ F) (Figure 3).
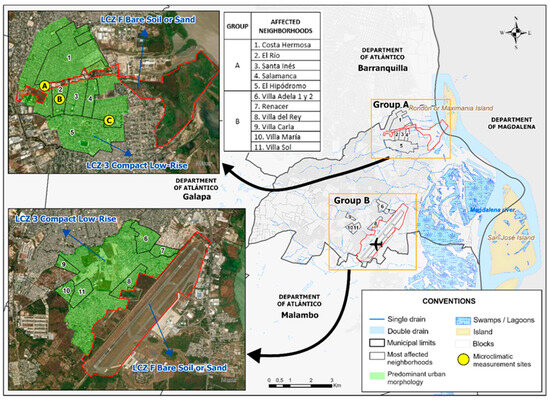
Figure 3.
Local climate zones in Groups A and B.
The urban morphology of Group A predominantly corresponds to Local Climate Zone 3 (LCZ 3—Compact Low-Rise), characterized by a dense urban fabric with narrow urban canyons. Residential structures are closely spaced, with an average separation of less than 3 m. Most buildings are single-story with an average height of 3 m, while a smaller percentage consist of two-story structures ranging between 5- and 6 m in height. This morphology applies to all Group A neighborhoods: Costa Hermosa, Santa Inés, El Hipódromo, El Río, and Salamanca.
Additionally, these neighborhoods are intersected by an open space classified as Local Climate Zone F (LCZ F—Bare Soil or Sand), which corresponds to a remnant area beneath high-voltage power lines connecting to the Corelca electrical substation.
Similarly to Group A, the Group B neighborhoods also conform to the LCZ 3 (Compact Low-Rise) typology, encompassing the neighborhoods of Villa Adela 1 and 2, Villa del Rey, Renacer, Villa Carla, Villa María, and Villa Sol. However, Group B also includes a significant open space classified as LCZ F, which corresponds to the landing and maneuvering area of Ernesto Cortissoz International Airport.
2.2.3. Selection of Sites for Micrometeorological Evaluation
Microscale samples were recorded/registered at three distinct points with different characteristics: two within Group A neighborhoods and one in an adjacent area. The objective was to establish differential patterns that could provide preliminary insights into the recurrence of strong wind events. The selected points included the following:
LCZ F-A: An open urban fabric area characterized by exposed soil and sparse vegetation coverage.
LCZ 3-B: A low-rise compact zone with asbestos–cement roofs and concrete streets. This location was characterized by a narrow urban canyon oriented along the east–west axis (canyon ratio = 1) with minimal vegetation. In this zone and in neighborhoods with this type of urban morphology, the highest number of destructive wind events were recorded in Soledad.
LCZ 3-C: Another low-rise compact zone with similar cover materials and streets; however, it presented a shallow urban canyon (canyon ratio = 0.25) and a more pronounced presence of vegetation within the canyon. Unlike LCZ 3-B, no wind-driven events were recorded in this zone.
Although each LCZ encompassed a larger area, the selected sampling points were chosen based on their homogeneity in urban form and land cover, ensuring that they were representative of the broader LCZ typology in the neighborhood. Nevertheless, we recognize this as a limitation and recommend future research to incorporate spatial averaging techniques or remote sensing-based LCZ-wide measurements.
To analyze the meteorological conditions at the microscale, data were collected from three selected points (LCZ F-A, 3B, and 3C) through simultaneous measurements taken at exact hourly intervals. This approach aimed to establish differential parameters between neighborhoods affected and unaffected by the events. All measurements were conducted using newly acquired instruments with standard factory calibration:
- Three BENETECH GM8910 8-in-1 portable anemometers equipped with LED displays were used. These compact, field-friendly instruments recorded wind speed, air temperature, relative humidity, wind chill, heat index, dew point, and barometric pressure. The devices offered an accuracy of ±2–3% for wind speed and ±1 °C for temperature.
- Three digital infrared thermometers were employed to measure the surface temperatures on both the streets and building rooftops. These instruments operated at a measurement distance of 3 to 15 cm, with an accuracy of ±0.2 °C and factory calibration.
- A Bosch laser distance meter was used to measure the width of the streets and buildings for urban canyon analysis. This device had an accuracy ranging from ±1.5 mm to ±2.0 mm and was also factory-calibrated.
Additionally, an analysis of vegetation incidence was performed using Leaf Area Index (LAI) measurements. Several methods exist to estimate the impact of vegetation on urban climates, including satellite remote sensing, SunScan canopy analysis systems, and digital photography—such as digital cover photography (DCP) or upward-facing digital cameras [35]. In this study (Table 1), indirect measurements were taken using Google Earth photogrammetric images, from which the sample surface area and leaf area were extracted. The LAI was calculated as follows [36]:
where
is the total leaf area (m2);
is the soil area over which the vegetation is distributed (m2).

Table 1.
Variables for microscale data analysis and evaluation.
Table 1.
Variables for microscale data analysis and evaluation.
| Variable | Unit | References | |
|---|---|---|---|
| MICROMETEOROLOGICAL DATA | Air 2 m (temperature at 2 m) | °C | [37] (Therán-Nieto et al., 2025) |
| Street surface temperature | °C | [15] (Peng et al., 2022) | |
| Surface temperature on the roof of the building | °C | [38] (Yang, X. et al., 2020) | |
| Wind speed (WS) | m s−1 | [39] Ng, E. et al., 2012 | |
| Atmospheric pressure | HPa | [40] (Elmes et al., 2017) | |
| Heat | °C | [41] (Arifwidodo & Chandrasiri, 2020) | |
| Air humidity at 2.00 m (RH) | mm | [42] (Johansson, E., & Emmanuel, R., 2006). | |
| TREE CANOPY AND TEMPERATURE | Permeable and impermeable zones | M2 | [43] (Zhang et al., 2023) |
| Leaf Area Index (LAI) | [44] (Krayenhoff et al., 2020) | ||
| Urban canyon | [45] (Huang et al., 2022) |
Urban temperature conditions are influenced by various urban site characteristics (USCs), including surface albedo, vegetation fraction (VF), impervious surface area (ISA), surface temperature, and air temperature [1].
To quantify the heat variations between the evaluated locations, the following temperature difference formulas were applied:
where
ΔT1 = T (LCZ 3-B) − T (LCZ F-A),
ΔT2 = T (LCZ 3-B) − T (LCZ 3-C),
ΔT3 = T (LCZ 3-B) − T(ECS),
ΔT represents the temperature difference (°C);
T (LCZ F-A) is the temperature recorded in the LCZ F open fabric area, characterized by Bare Soil or Sand;
T (LCZ 3-B) is the urban temperature measured in the Compact Low-Rise (LCZ 3) zone with sparse vegetation and a narrow urban canyon;
T (LCZ 3-C) corresponds to a Compact Low-Rise (LCZ 3-2) zone with vegetation present in the canyon;
T(ECS) refers to temperature measurements obtained from the Ernesto Cortissoz International Airport weather station (ECS).
Another key parameter affecting urban microclimates is the Sky View Factor (SVF), which quantifies the proportion of visible sky and has direct implications for radiative heat exchange, urban ventilation, and pedestrian comfort [37,44]. The SVF classification is as follows:
SVF ≈ 1: High sky visibility, minimal obstruction.
SVF 0.5–0.7: Moderate sky visibility, partial obstruction.
SVF 0–0.3: Low sky visibility, significant obstruction.
SVF ≈ 0: No visible sky, fully obstructed.
2.2.4. Contrasting Micrometeorological Evaluation Results with Data from the Ernesto Cortissoz Airport Station (ECS)
Meteorological data from the ECS were obtained through IDEAM’s POLARIS platform, ensuring that the measurements corresponded precisely to the same dates and times as the direct microscale observations. Once collected, the data underwent refinement and averaging to enhance their accuracy. The processed results were then visualized through graphs, allowing for a direct comparison between field measurements and the existing scientific literature. This comparative analysis aimed to identify trends, validate findings, and assess correlations between microscale meteorological conditions and larger scale atmospheric patterns. The methodological framework for this study is summarized in Figure 4, which outlines the data collection, processing, and analytical approach.
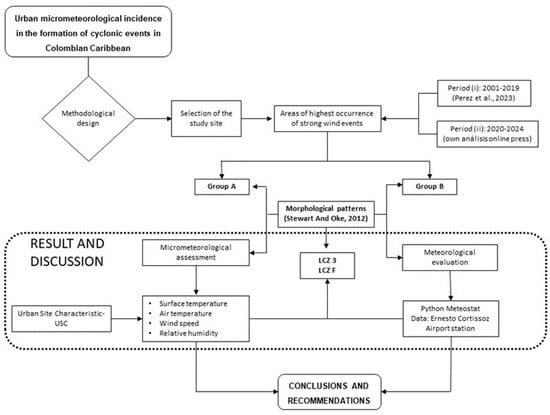
Figure 4.
Methodological design of this research.
Pérez et al. (2023) reported the occurrence of wind-related phenomena during the two rainy seasons characteristic of the metropolitan area of Barranquilla: the first occurring from April to June, and the second from August to November. Within the 20-year period analyzed, October stood out as the month with the second highest number of reported events. Additionally, online press sources indicated that these events predominantly occurred during periods of peak solar radiation. Based on this information, field measurements were conducted over eight consecutive days from 28 October to 6 November, with data collected at six-hour intervals each day between 10:00 and 15:00 h.
During the on-site measurements, data were initially recorded by hand in a logbook and were subsequently digitized using Excel 365. To facilitate interpretation, the results obtained over the eight-day period—comprising five daily measurements—were averaged. This approach enabled organized data management, analysis, and digital visualization.
As part of the analytical strategy, we established the following components:
- Correlation analysis between variables, such as the Leaf Area Index (LAI) and Sky View Factor (SVF) versus temperature differences (ΔT), and the urban canyon structure (height-to-width ratio, H/L) versus temperature;
- Spatial analysis of variable distributions, comparing the same variable across the evaluated locations (e.g., ΔT and ΔRH among LCZ-FA, 3B, and 3C);
- Data validation using the reference weather station at Ernesto Cortissoz International Airport (ECS). This final step allowed for the assessment of potential discrepancies between measurements in urban Local Climate Zones (LCZs: FA, 3B, 3C) and those taken at the urban periphery.
3. Results and Discussion
3.1. Air 2 m Temperature
The results showed that areas with a Compact Low-Rise urban fabric (LCZ 3-B and LCZ 3-C) experienced significantly higher temperatures compared to open urban areas (LCZ F-A) and the reference airport station (ECS). The temperature readings for LCZ 3-B were on average 4.6 °C higher than those recorded at ECS. This is consistent with studies on the UHI effect, where densely built environments store and re-radiate heat, leading to higher local temperatures [24,46]. Similarly, LCZ 3-B was 1.2 °C warmer than LCZ F-A, demonstrating how impervious surfaces (e.g., asphalt, concrete) and reduced vegetation amplify localized heating [15,47].
The slight difference between LCZ 3-B and LCZ 3-C (0.13 °C) suggests that vegetation within the urban canyon may play a minor role in temperature regulation. While vegetation typically mitigates heat through shading and evapotranspiration [11,48], the compact urban structure may limit these effects, reinforcing the need for more extensive greenery or different architectural adaptations. The orientation of the urban canyon (east–west) also contributes to heat retention, as narrower streets and dense buildings trap solar radiation, reducing ventilation and heat dissipation [42,49].
The largest temperature differences (Table 2) were observed between the compact urban areas (LCZ 3-B) and the airport station (ECS), averaging 4.6 °C. This difference aligns with previous studies that highlight the significant temperature gradient between urban and peri-urban areas, particularly in tropical and subtropical climates [50,51]. The ECS station, located in an open area with minimal built structures, experiences greater air circulation and lower heat retention, reinforcing its role as a more thermally stable reference point.
Table 2.
Air 2 m temperature (°C).
These findings emphasize the role of urban morphology in local temperature variations. The results confirm that compact, impervious surfaces contribute significantly to higher temperatures, reinforcing the well-documented UHI effect in rapidly urbanizing areas. While the vegetation presence in LCZ 3-C provided a minor cooling effect, its impact was not substantial enough to offset urban heating. This suggests that a combination of increased vegetative cover, reflective roofing materials, and improved urban ventilation strategies may be necessary to mitigate excessive heat accumulation in densely built areas [38,52].
3.2. Land Surface Temperature (LST)
Land Surface Temperature (LST) is a critical indicator in urban climate studies, as it directly reflects the thermal properties of surfaces and their response to solar radiation [53,54]. This study recorded two types of surface temperature measurements:
- 4.
- ST-S (Surface Temperature at Street) (Table 3): Temperature recorded at the center of the road in each urban canyon.
Table 3. Surface Temperature at Street (ST-S) (°C).
The highest surface temperature values were observed at LCZ 3-B, which had an average temperature of 39.9 °C. LCZ 3-B was 1.9 °C warmer than LCZ F-A (Bare Soil/Sand), which can be attributed to differences in the albedo and thermal inertia of the surface materials. Sand and natural surfaces have higher albedo and lower heat storage capacity than concrete and asphalt, leading to lower daytime surface temperatures [55]. LCZ 3-B was also 1.84 °C warmer than LCZ 3-C, which highlights the impact of vegetation shading in reducing surface heating. The presence of trees in LCZ 3-C limits direct solar radiation exposure, leading to cooler street temperatures, consistent with findings from studies on urban greenery and cooling effects [54,56].
- 5.
- ST-R (Surface Temperature at Roof) (Table 4): Temperature recorded on the roof surfaces of the adjacent buildings in LCZ 3-B and LCZ 3-C.
Table 4. Surface Temperature at Roof (ST-R) (°C).
Roof temperatures showed an even greater difference, with LCZ 3-B averaging 5.3 °C warmer than LCZ 3-C. The high temperatures at LCZ 3-B can be attributed to the properties of the roofing material. Most buildings in this zone had asbestos–cement roofs, which have high heat retention properties, unlike lighter colored or vegetated roofs that reflect more solar radiation [52]. In contrast, LCZ 3-C, which was surrounded by vegetation, showed significantly lower temperatures. The presence of trees can influence roof temperatures by reducing solar exposure and enhancing evapotranspiration [11,55]. The differences observed between LCZ 3-B and LCZ 3-C align with studies demonstrating the effectiveness of green roofs and tree shading in reducing heat accumulation on urban surfaces [52,56], which are even used in other parts of the world to collect water efficiently [57].
The findings highlight that urban construction materials influence LST—concrete and asphalt surfaces contribute to higher temperatures due to their low albedo and high thermal mass, exacerbating the UHI effect [47]. Additionally, vegetation presence reduces street and roof temperatures—tree shading and evapotranspiration play a key role in cooling urban surfaces, supporting strategies such as increased tree canopy cover and the implementation of green roofs [11,49]. According to these findings, urban planning strategies should consider material selection and vegetation integration—cool pavements, reflective roofing materials, and urban green infrastructure can help to mitigate excessive surface heating in dense urban areas [50,53,58,59].
3.3. Additional Heat Influence
The additional heat generated in urban environments plays a crucial role in local atmospheric dynamics, influencing convection, storm intensity, and even extreme weather events [60,61]. The UHI effect, driven by heat retention in built-up areas, enhances the lifting of warm, moist air from the surface, potentially intensifying convective processes and affecting storm development [48,62]. Table 5 presents heat values across different LCZs, showing significant temperature differences between compact urban areas and vegetated zones.
Table 5.
Additional heat influence (°C).
According to these findings on urban heat accumulation and temperature gradients, compact urban areas (LCZ 3-B) showed the highest heat values, averaging 38.8 °C, compared to 37.1 °C in both LCZ F-A (open fabric) and LCZ 3-C (vegetated canyon). The temperature gradient ΔT1 = 1.7 °C between LCZ 3-B and LCZ F-A highlights the role of surface materials in heat retention. Concrete and asphalt surfaces store heat more efficiently than natural surfaces, leading to higher thermal loads during the day [51,53]. The difference between LCZ 3-B and LCZ 3-C (ΔT2 = 1.65 °C) underscores the cooling effect of vegetation, which mitigates heat accumulation through shading and evapotranspiration [11,49].
Heat is linked to storm dynamics, as heat accumulation in dense urban environments contributes to enhanced convection, where warm air rises and interacts with cooler layers of the atmosphere [63]. The interaction of rising warm air with cooler upper layers can increase storm intensity, a phenomenon observed in multiple studies on urban-induced weather modifications [64,65]. In a tropical storm context, the urban heat gradient can contribute to the formation of vortices, which, under certain meteorological conditions, may evolve into tornadoes or cyclogenesis events [66]. High surface temperatures can also enhance downdrafts and gust fronts, affecting storm development by altering wind speed and direction [8].
Thus, the pivotal role of relative humidity in severe weather formation emerges: high relative humidity in the lower atmosphere is a key factor in storm formation, as it provides the necessary moisture for convective development [67,68]. The ECS recorded the highest relative humidity values (Section 3.5), suggesting a favorable environment for intense convective storms. Urban areas with high heat retention but lower humidity levels may experience stronger updrafts but limited moisture availability, potentially leading to dry convective processes or microbursts instead of sustained thunderstorms [69].
The observed heat patterns highlight the critical role of urban form in modifying local atmospheric processes. Key findings include how urban materials significantly impact heat retention, with denser areas experiencing higher temperatures due to lower albedo and higher thermal inertia [53]. Additionally, vegetation presence reduces urban heat, emphasizing the importance of urban greening strategies to mitigate excessive heating and promote thermal comfort [11]. Another crucial factor is urban heat, since it can intensify storm dynamics, contributing to increased convection and potential vortex formation in tropical storm environments [70]. Finally, the role of high humidity in lower atmospheric layers has been highlighted to enhance severe weather formation, with potential implications for storm forecasting in urbanized regions [71].
Given these findings, urban planning should prioritize cooling strategies such as reflective materials, green infrastructure, and heat-aware building designs to mitigate storm-enhancing effects in rapidly growing cities.
3.4. Wind Speed (Ws)
Wind speed (Table 6) plays a critical role in urban microclimate regulation, affecting thermal comfort, pollutant dispersion, and storm dynamics [72,73]. Urban environments significantly alter wind flow due to surface roughness, building density, and canyon effects, leading to lower wind speeds in compact areas and increased turbulence in open spaces [63,74].
Table 6.
Wind speed (m s−1).
These results reveal that urban density is related to wind speed reduction. The lowest wind speeds were recorded in LCZ 3-B (0.92 m s−1 on average), followed by LCZ 3-C (1.00 m s−1), with significantly higher values in ECS (2.30 m s−1). The reduced wind flow in LCZ 3-B can be attributed to its Compact Low-Rise morphology, which increases surface roughness and disrupts air circulation [75]. Conversely, LCZ F-A (open urban fabric) exhibited an average wind speed of 1.41 m s−1, higher than LCZ 3-B and LCZ 3-C, reflecting the effect of reduced building obstruction on wind penetration [76].
Likewise, the findings show the connection between the urban canyon effect and wind flow disruptions. Wind speed patterns indicate a clear canyon effect, where buildings in compact zones (LCZ 3-B and LCZ 3-C) create narrow, enclosed pathways that restrict airflow and induce wind stagnation [39]. The wind speed difference between LCZ 3-B and LCZ 3-C (0.92 m s−1 vs. 1.00 m s−1) suggests that vegetation within urban canyons can slightly enhance wind flow by reducing thermal-induced turbulence [39].
Thus, these results have implications for thermal comfort and pollution dispersion. Lower wind speeds in LCZ 3-B contribute to greater heat retention, exacerbating the UHI effect by reducing convective cooling [53,77]. Limited airflow in dense urban areas also hinders pollutant dispersion, increasing air pollution concentrations, particularly in high-emission zones [78,79]. Additionally, the higher wind speeds at ECS (2.30 m s−1) reflect the open nature of the airport environment, where minimal surface obstructions allow for stronger wind flow and improved air mixing [80].
The results underscore the importance of urban form in modulating wind speed, with compact zones experiencing significantly reduced airflow. Key considerations may include the following: (i) densely built environments (LCZ 3-B) lead to lower wind speeds, exacerbating heat retention and air stagnation [68]; (ii) urban canyons restrict airflow, but vegetation can marginally mitigate these effects by altering turbulence patterns [80]; (iii) higher wind speeds in open areas (ECS and LCZ F-A) highlight the importance of integrating open spaces in urban design to enhance ventilation and reduce UHI intensity [79]; and (iv) compact urban design should incorporate wind corridors and strategic green infrastructure to improve air circulation and mitigate pollution accumulation [53].
Future urban development should incorporate computational fluid dynamics (CFD) modeling and aerodynamic urban planning to optimize wind flow and thermal comfort in growing metropolitan areas.
3.5. Relative Humidity
Relative humidity (RH) (Table 7) is a critical factor in urban climatology, influencing thermal comfort, evaporation rates, and atmospheric stability [68]. In urban environments, RH is affected by land cover, vegetation density, surface moisture retention, and heat emissions [60]. The relationship between urban temperature, relative humidity, and wind speed determines microclimatic conditions and contributes to UHI intensity [77,81,82].
Table 7.
Relative humidity (%).
The results show a clear inverse relationship between urban density and relative humidity (ΔRH3). The urban core (LCZ 3-B) recorded the lowest RH values (58.0%), compared to LCZ F-A (60.1%) and LCZ 3-C (57.4%). ECS (77.6%) had the highest RH values, consistent with its open, non-urbanized characteristics [82,83]. Additionally, Compact Low-Rise urban zones (LCZ 3-B) exhibited lower RH values due to reduced evapotranspiration and increased surface heating, leading to enhanced moisture depletion [77].
The findings also demonstrate the relationship between the UHI effect and humidity reduction, as the lowest humidity values occurred at 12:00–14:00, coinciding with peak temperatures and reduced evaporative cooling [53,84]. The temperature–humidity interaction in LCZ 3-B and LCZ 3-C shows how dense urban areas suppress moisture retention, intensifying the UHI effect [68,76]. LCZ 3-C, despite having some vegetation, recorded humidity levels similar to LCZ 3-B, suggesting that sparse vegetation may not be sufficient to offset moisture loss under extreme heat conditions [48].
Likewise, it has been proven how vegetation influences urban humidity regulation. LCZ F-A recorded higher RH levels than LCZ 3-B, indicating the role of open spaces and soil moisture in humidity retention [85]. Vegetation contributes to RH through evapotranspiration, as demonstrated by the higher RH values in LCZ 3-C (57.36%) compared to LCZ 3-B (58.02%), albeit with a marginal difference [77,78]. Increased green infrastructure and permeable surfaces in cities can mitigate humidity loss, helping to maintain more stable microclimates in dense urban areas [42].
All the above have implications for urban comfort and health. Low RH values in compact urban zones contribute to heat stress, increasing discomfort levels, especially during midday [85]. Thus, drier urban environments can intensify respiratory issues and dehydration risks, particularly in vulnerable populations [60]. These findings highlight the need for urban cooling strategies, including the implementation of urban forests, green walls, and permeable pavements to enhance humidity retention and mitigate UHI effects [49,77].
The results demonstrate the strong influence of urban form and land cover on humidity dynamics, with compact areas experiencing significant RH reductions. Thus, official urban planning documents should consider the following: (i) densely built environments (LCZ 3-B) experience a substantial drop in RH, exacerbating heat stress and reducing urban cooling potential [63]; (ii) open areas (LCZ F-A) maintain higher RH levels, reinforcing the need for urban planners to integrate open spaces to balance urban moisture loss [86]; (iii) vegetation can mitigate humidity loss, but its impact is limited in highly compact areas, requiring a multi-layered approach to urban greening [77]; and (iv) future urban designs should prioritize water-sensitive urban design (WSUD) strategies, incorporating permeable surfaces, blue–green infrastructure, and shaded pedestrian corridors to improve humidity retention [78].
3.6. Atmospheric Pressure and Atmospheric Pressure Anomalies
Atmospheric pressure (Table 8) is a crucial factor in storm development, playing a significant role in cyclogenesis, convective activity, and severe weather formation [87,88]. In tropical regions, pressure variations are typically smaller than in mid and high latitudes due to the relative stability of temperature and solar radiation throughout the year [89]. However, localized pressure anomalies—such as those observed in this study (Table 9)—can enhance meteorological phenomena by altering wind dynamics, increasing vertical wind shear, and intensifying convection [67].
Table 8.
Atmospheric pressure (mb).
Table 9.
Atmospheric pressure anomaly (relative to 1010 mb, in mb).
An anomaly is a difference from a defined long-term average. Positive/negative values of this parameter indicate that the mean sea level pressure is higher/lower than the long-term average. The long-term average is typically derived from several decades of model data and will vary with location and time of year [90].
The mean sea level pressure is the pressure (force per unit area) of the atmosphere adjusted to the height of mean sea level; in tropical areas, its mean value is 1010 mb. For example, the values of anomalies in atmospheric pressure (APA) may indicate the arrival of storms, hurricanes, or cold fronts, helping to understand extreme weather patterns and signs of events such as tornadoes or cyclones [43]. The data revealed a consistent negative pressure anomaly across all locations, with the most significant deviations occurring at ECS (up to −6.42 mb at 15:00). LCZ F-A, LCZ 3-B, and LCZ 3-C exhibited weaker negative anomalies, reflecting the potential influence of urban structures in stabilizing pressure fluctuations [68]. ECS, located near an airport, displayed the strongest pressure anomalies, which may have been attributed to open terrain effects, reduced surface roughness, and greater exposure to mesoscale pressure systems [90].
Low-pressure systems enhance convective activity by promoting the ascent of warm, moist air, which can lead to deep convection, severe thunderstorms, and even tornado formation [40,43]. The most significant negative anomalies at 15:00 h coincided with the highest temperature differentials, suggesting an increased potential for extreme weather events [67]. Pressure gradients between urban and rural areas may intensify wind speeds and enhance vertical wind shear, which is a key ingredient in cyclogenesis and tornado formation [89].
Urban morphology plays a role in modifying local wind patterns, leading to the creation of small-scale vortices, turbulence, and wind eddies [45]. Cities can alter the trajectory of convective storms, concentrating their impact within urban areas due to surface heating and roughness effects [66]. Thus, the UHI contributes to sustained low-pressure zones, potentially strengthening storm updrafts and wind circulation [49,63]. In our study case, it had implications for tornado formation. When a tropical tornado forms near a city, urban micrometeorology can alter wind speeds, enhance turbulence, and redirect storm trajectories [71].
The interaction between urban heat, moisture retention, and pressure anomalies can contribute to the intensification of convective updrafts, potentially increasing tornado risks [86,89]. In our case, the highest temperature and humidity values at 15:00 h in ECS and LCZ F-A corresponded to the strongest pressure anomalies, reinforcing the link between low-pressure systems, urban-induced temperature differentials, and extreme weather formation [43,87].
These findings indicate that negative atmospheric pressure anomalies, urban heat effects, and wind dynamics interact to shape storm behavior in urban environments.
3.7. Impact of Vegetation and Urban Canyons on Urban Typologies
Vegetation plays a critical role in mitigating urban heat by influencing air temperature, surface temperature, and microclimatic conditions [91]. Through shading (solar radiation interception) and transpiration cooling, trees significantly reduce UHI effects, offering essential ecosystem services that enhance urban health and well-being [12].
The SVF represents the proportion of the visible sky from a given point and is a key determinant of urban climate and pedestrian thermal comfort. In urban settings, a lower SVF corresponds to increased shading and reduced solar radiation, which directly impacts local temperature regulation. In the study area (Figure 5 for LCZ 3-A, B, and C), LCZ 3-B exhibits an SVF of approximately 1, indicating a high sky visibility with minimal obstructions, whereas LCZ 3-C, with a lower SVF, benefits from shading effects due to a greater presence of vegetation and surrounding structures. These differences contribute to variations in surface and air temperatures, emphasizing the role of urban form in modifying microclimatic conditions. The results align with previous studies [48], which highlight the influence of SVF on urban heat distribution and thermal comfort.
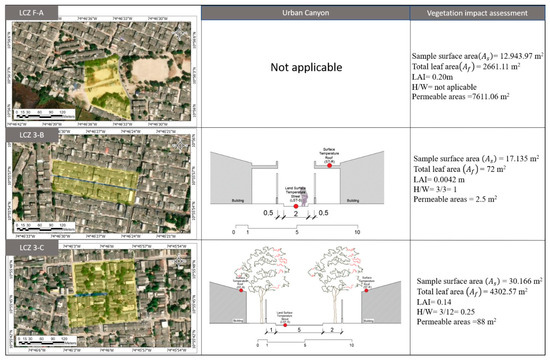
Figure 5.
Urban site characteristics (USCs).
LCZ 3-A is characterized as a recreational or open area. The sample surface area is 12,943.97 m2, with a total leaf area of 2661.11 m2, indicating a relatively low vegetation density. The calculated Leaf Area Index (LAI) of 0.20 confirms this, as it falls below the recommended range of 0.50 to 3 for effective cooling through transpiration and shading [92]. Given the large proportion of permeable surfaces (7611.06 m2), this area likely facilitates water infiltration and mitigates surface runoff. However, the absence of a defined height-to-width ratio (H/W) suggests an open environment with minimal structural obstruction, influencing microclimatic conditions differently from compact urban zones.
LCZ 3-B is a compact urban area with sparse vegetation. The sample surface area is 17,135 m2, yet the total leaf area is only 72 m2, resulting in an extremely low LAI of 0.0042. This minimal vegetation cover significantly reduces the potential for transpiration and shading, which are key factors in mitigating urban heat [45]. Additionally, the height-to-width ratio (H/W) of 1 suggests a densely built environment with restricted airflow, contributing to heat retention and reduced natural ventilation. The very limited permeable area (2.5 m2) further exacerbates surface runoff and decreases evaporative cooling, reinforcing conditions favorable to UHI effects.
LCZ 3-C represents a dense urban area with relatively higher vegetation coverage. Despite its low LAI of 0.14—still below the threshold for moderate vegetation—it is significantly higher than that of LCZ 3-B, suggesting a better capacity for shading and cooling through transpiration. The total leaf area of 4302.57 m2 further reinforces this improved vegetative presence. Additionally, the low height-to-width (H/W) ratio of 0.25 indicates a more open urban layout, promoting better air circulation and heat dissipation. These factors contribute to a microclimate that, while still impacted by urban heating, benefits from increased natural cooling mechanisms.
3.8. Vegetation Influence on Temperature and Wind Dynamics
The LAI quantifies vegetation density and its ability to intercept solar radiation, reduce urban heat, and enhance cooling through evapotranspiration. The study reveals that LAI values are consistently low across the selected sites, with LCZ 3-B exhibiting a particularly sparse vegetative cover compared to LCZ 3-C. Despite this, LCZ 3-C’s LAI is 33 times higher than LCZ 3-B, reinforcing the correlation between vegetation density and localized cooling effects. Conversely, LCZ F-A has 70% more vegetation than LCZ 3-C and 47.61 times more than LCZ 3-B. However, this comparison is limited due to distinct urban typologies—LCZ F-A represents open terrain with bare soil, which inherently alters microclimatic behavior. Prior research [92,93] has demonstrated that areas with higher LAI values experience lower surface and air temperatures due to increased shading and moisture retention. These findings underscore the necessity of integrating green infrastructure into urban planning to mitigate heat stress and enhance thermal comfort.
3.9. Urban Canyon Effects on Temperature and Wind Flow
Urban morphology plays a fundamental role in temperature distribution, ventilation patterns, and heat dissipation. Urban Canopy Models (UCMs) typically rely on the urban canyon archetype [50,94]. The height-to-width (H/W) ratio of urban canyons significantly influences air circulation and thermal exchange. In this study, LCZ 3-B presents an H/W ratio of 1, indicating a relatively enclosed urban canyon with restricted airflow, whereas LCZ 3-C has an H/W ratio of 0.25, allowing for better ventilation and heat dissipation. The data suggest that areas with higher H/W ratios tend to retain more heat, leading to elevated temperatures and reduced wind speeds, a trend consistent with previous urban climate studies [50,94]. The interplay between building configuration, surface materials, and vegetation cover highlights the importance of strategic urban design in optimizing thermal and airflow conditions within cities.
In this case study, LCZ 3-B (H/W = 1) exhibits the highest temperatures and lowest wind speeds, suggesting reduced ventilation and increased heat retention. LCZ 3-C (H/W = 0.25) experiences better ventilation and lower temperatures, aligning with findings on urban cooling through open street geometries [95]. LCZ 3-A, lacking an urban canyon structure, experiences different thermal and wind flow behaviors, making direct comparisons with built-up areas less relevant.
The data confirm that higher H/W ratios correlate with elevated surface and air temperatures, as well as lower wind speeds. In particular, LCZ 3-B exhibits the highest temperatures and the weakest wind circulation, associated with compact building layouts and impervious surfaces. Interestingly, neighborhoods with this configuration have also reported the highest recurrence of wind-related damage over the last two decades.
These findings suggest that while cyclonic winds are generated by mesoscale or synoptic-scale atmospheric processes [85], their intensity and impact at the neighborhood level may be modulated by urban morphological and microclimatic conditions. Urban form influences air turbulence, wind channeling through street canyons, and the formation of localized vortices, potentially amplifying the destructiveness of extreme wind events [44].
Although microclimatic variables alone do not generate wind phenomena, they shape the physical context in which those events unfold, especially in compact zones with reduced vegetation, limited ventilation corridors, and high surface roughness [44].
3.10. Implications for Urban Climate Adaptation
This study contributes to the understanding of how urban morphology and microclimate interact with extreme weather phenomena. In rapidly urbanizing tropical regions, unplanned growth and the use of thermally inefficient materials not only exacerbate urban heat island (UHI) effects [47,95], but also influence the behavior of atmospheric processes such as cyclonic winds at the local scale [47,48,95].
While classical authors such as Oke et al. (2017) [63] emphasize the influence of factors such as vegetation cover, Sky View Factor (SVF), Leaf Area Index (LAI), and urban geometry on thermal regulation, new theoretical perspectives suggest a multiscale approach, integrating physical and socio-ecological factors to ensure that nature-based solutions not only improve thermal comfort [96,97], but also address urban inequalities and climate resilience [22].
The contrast between LCZ 3-B and LCZ 3-C, where marked thermal differences are evident from slight variations in vegetation or building layout, corroborates the sensitivity of the urban environment to physical factors [98]. However, authors such as [99] argue that these differences can also be modulated by cultural, economic, and local governance aspects, which determine unequal access to the benefits of nature-based solutions [100].
Compact neighborhoods with high H/W ratios and low LAI values, such as LCZ 3-B, can act as microclimatic amplifiers [101], exhibiting increased heat retention, stagnant airflow, and a structural configuration conducive to wind acceleration or pressure differentials [35,42]. These conditions may not cause wind phenomena per se, but may intensify their local consequences, especially in convective scenarios [10,27].
Therefore, adaptation strategies should consider a dual lens: (i) mitigating heat stress through green infrastructure, reflective materials, and open street layouts [101,102,103]; and (ii) buffering wind effects by avoiding urban forms that concentrate or accelerate airflows in vulnerable areas [24,44]. Planning should incorporate wind vulnerability maps based on LCZ typologies and take advantage of simulation tools to assess wind–morphology interactions [104].
This research presents certain limitations. One of them lies in the temporal scope of the data collection, which was conducted over a relatively short period and may not have fully captured seasonal or interannual variability in microclimatic conditions. Furthermore, spatial resolution was constrained by the number of instruments available and logistical access to all areas of interest, potentially limiting the generalizability of some localized findings. This study also did not incorporate high-resolution computational fluid dynamics (CFD) modeling or long-term observational datasets, which could provide deeper insights into wind behavior and thermal distribution influenced by urban morphology.
To address these gaps, future monitoring periods will be extended to cover a wider range of climatic conditions across seasons, which will increase the robustness of the observed correlations. We also intend to incorporate simulation tools, such as ENVI-met V5.7.2 or CFD models, to analyze microclimatic interactions in controlled variable scenarios. In addition, future research will examine the interaction effects between SVF, LAI, and other morphological indicators, such as building height variability, street orientation, and surface albedo, to better understand their combined impact on urban microclimates. These efforts will help to build a more holistic and transferable framework for applying micrometeorological knowledge in urban planning and climate adaptation strategies.
4. Conclusions and Recommendations
This study highlights the influence of urban morphology, vegetation, and atmospheric conditions on microclimatic variations, particularly concerning extreme weather events. Areas with a compact urban fabric and low vegetation, such as LCZ 3-B, exhibit higher temperatures and lower wind speeds, whereas LCZ 3-C, with its greater vegetation density, benefits from cooling effects and improved airflow. The urban canyon effect, as reflected in the height-to-width ratio, plays a crucial role in heat retention and ventilation patterns, reinforcing its importance in urban heat island mitigation. The negative atmospheric pressure anomalies observed, especially in the ECS station, suggest a microclimatic environment conducive to intense convective activity, which can influence local storm dynamics.
Given these findings, urban planning should prioritize strategies that enhance thermal comfort and reduce localized heating. Increasing vegetation cover, particularly in high-density areas, can mitigate temperature extremes through shading and evapotranspiration. Optimizing street layouts and building configurations to enhance airflow and dissipate heat more efficiently are also essential. Additionally, integrating permeable surfaces can reduce surface temperatures and improve water retention, mitigating urban heat stress. Real-time meteorological monitoring should be expanded to provide better early warning systems for extreme weather events, particularly in areas prone to strong winds and convective activity.
This research has some limitations, including the relatively short observation period and the spatial constraints of the study area. Future research should extend the temporal scope to capture seasonal variations, incorporate high-resolution numerical models to simulate urban–atmospheric interactions, examine the effects of different types of vegetation and materials on microclimate dynamics, incorporate variables such as the influence of greenhouse gas emissions, and evaluate the effect of the materials with which houses are constructed (albedo or heat retention of different types of materials). Addressing these aspects will contribute to a more complete understanding of urban climate processes and support the development of more resilient and sustainable cities, in line with the guidelines of the 2030 agenda for sustainable development.
Author Contributions
Conceptualization, R.P.-A. and A.C.-C.; methodology, R.P.-A., J.E.J.-C., J.L.S.-M., J.R.-C., J.C.O.R. and A.C.-C.; software, J.E.J.-C. and J.C.O.R.; validation, J.L.S.-M., J.R.-C. and A.C.-C.; formal analysis, R.P.-A. and J.E.J.-C.; investigation, R.P.-A. and J.E.J.-C.; resources, R.P.-A., J.E.J.-C., J.L.S.-M., J.R.-C. and J.C.O.R.; data curation, J.L.S.-M., J.R.-C. and A.C.-C.; writing—original draft preparation, R.P.-A. and A.C.-C.; writing—review and editing, J.E.J.-C., J.L.S.-M., J.R.-C., J.C.O.R. and A.C.-C.; visualization, R.P.-A., J.E.J.-C., J.L.S.-M., J.R.-C. and J.C.O.R.; supervision, J.L.S.-M. and A.C.-C.; project administration, R.P.-A., J.E.J.-C. and J.C.O.R.; funding acquisition, R.P.-A. and J.E.J.-C. All authors have read and agreed to the published version of the manuscript.
Funding
This research received no external funding.
Data Availability Statement
The original contributions presented in this study are included in the article. Further inquiries can be directed to the corresponding author.
Conflicts of Interest
The authors declare no conflicts of interest.
References
- Ju, X.; Li, W.; Li, J.; He, L.; Mao, J.; Han, L. Future climate change and urban growth together affect surface runoff in a large-scale urban agglomeration. Sustain. Cities Soc. 2023, 99, 104970. [Google Scholar] [CrossRef]
- Parvar, Z.; Mohammadzadeh, M.; Saeidi, S. Enhancing decision-making for climate change mitigation and sustainable urban growth. Urban Clim. 2024, 58, 102223. [Google Scholar] [CrossRef]
- Strader, S.M.; Ash, K.; Wagner, E.; Sherrod, C. Mobile home resident evacuation vulnerability and emergency medical service access during tornado events in the Southeast United States. Int. J. Disaster Risk Reduct. 2019, 38, 101210. [Google Scholar] [CrossRef]
- IPCC Intergovernmental Panel on Climate Change. 2024. Available online: https://www.ipcc.ch/2024/ (accessed on 4 February 2025).
- Raker, E.J. Natural Hazards, Disasters, and Demographic Change: The Case of Severe Tornadoes in the United States, 1980–2010. Demography 2020, 57, 653–674. [Google Scholar] [CrossRef] [PubMed]
- Velotti, L. Natural Hazards: Tornadoes. In Encyclopedia of Security and Emergency Management; Shapiro, L.R., Maras, M.H., Eds.; Springer: Cham, Switzerland, 2021. [Google Scholar] [CrossRef]
- Liu, B.F.; Seate, A.A.; Iles, I.; Herovic, E. Tornado warning: Understanding the National Weather Service’s communication strategies. Public Relat. Rev. 2020, 46, 101879. [Google Scholar] [CrossRef]
- Zhang, Y.; Bai, L.Q.; Meng, Z.Y.; Chen, B.H.; Tian, C.C.; Fu, P.L. Rapid-scan and polarimetric phased-array radar observations of a tornado in the Pearl River Estuary. J. Trop. Meteorol. 2021, 27, 81–86. [Google Scholar]
- Liu, L.; Wen, Y.; Liang, Y.; Zhang, F.; Yang, T. Extreme weather impacts on inland waterways transport of Yangtze River. Atmosphere 2019, 10, 133. [Google Scholar] [CrossRef]
- Strader, S.M.; Gensini, V.A.; Ashley, W.S.; Wagner, A.N. Changes in tornado risk and societal vulnerability leading to greater tornado impact potential. npj Nat. Hazards 2024, 1, 20. [Google Scholar] [CrossRef]
- Gunawardena, K.R.; Wells, M.J.; Kershaw, T. Utilising green and blue space to mitigate urban heat island intensity. Sci. Total Environ. 2017, 584, 1040–1055. [Google Scholar] [CrossRef]
- Zięba-Kulawik, K.; Widziewicz-Rzońca, K.; Nowak, K. Urban greenery and climate adaptation. Urban For. Urban Green. 2021, 64, 127156. [Google Scholar]
- Widiastuti, R.; Zaini, J.; Caesarendra, W. Field measurement on the model of green facade systems and its effect to building indoor thermal comfort. Measurement 2020, 166, 108212. [Google Scholar] [CrossRef]
- Chen, J.; Zhan, W.; Du, P.; Li, L.; Li, J.; Liu, Z.; Huang, F.; Lai, J.; Xia, J. Seasonally disparate responses of surface thermal environment to 2D/3D urban morphology. Build. Environ. 2022, 214, 108928. [Google Scholar] [CrossRef]
- Peng, W.; Wang, R.; Duan, J.; Gao, W.; Fan, Z. Surface and canopy urban heat islands: Does urban morphology result in the spatiotemporal differences? Urban Clim. 2022, 42, 101136. [Google Scholar] [CrossRef]
- Conde, C.; Pabón, D.; Sánchez Rodríguez, R. La Importancia de la Información Climática Para la Planificación del Crecimiento y el Desarrollo Urbano. CEPAL 2013. Available online: https://repositorio.cepal.org/handle/11362/37075 (accessed on 12 December 2024).
- Senciales-González, J.; Rodrigo-Comino, J.; Smith, P. Surveying topographical changes and climate variations to detect the urban heat island in the city of Málaga (Spain). CIG 2020, 46, 521–543. [Google Scholar] [CrossRef]
- Kim, J.; Lee, D.K.; Brown, R.D.; Kim, S.; Kim, J.H.; Sung, S. The effect of extremely low sky view factor on land surface temperatures in urban residential areas. Sustain. Cities Soc. 2022, 80, 103799. [Google Scholar] [CrossRef]
- Peron, F.; De Maria, M.M.; Spinazzè, F.; Mazzali, U. An analysis of the urban heat island of Venice mainland. Sustain. Cities Soc. 2015, 19, 300–309. [Google Scholar] [CrossRef]
- He, B.J.; Ding, L.; Prasad, D. Relationships among local-scale urban morphology, urban ventilation, urban heat island and outdoor thermal comfort under sea breeze influence. Sustain. Cities Soc. 2020, 60, 102289. [Google Scholar] [CrossRef]
- Stewart, I.D.; Oke, T.R. Local Climate Zones for Urban Temperature Studies. Bull. Am. Meteorol. Soc. 2012, 93, 1879–1900. [Google Scholar] [CrossRef]
- Pérez-Arévalo, R.; Jiménez-Caldera, J.; Serrano-Montes, J.L.; Rodrigo-Comino, J.; Therán-Nieto, K.; Caballero-Calvo, A. Enhancing Urban Resilience: Strategic Management and Action Plans for Cyclonic Events through Socially Constructed Risk Processes. Urban Sci. 2024, 8, 43. [Google Scholar] [CrossRef]
- Mills, G.; Stewart, I.D.; Niyogi, D. The origins of modern urban climate science: Reflections on ‘A numerical model of the urban heat island’. Prog. Phys. Geogr. 2022, 46, 649–656. [Google Scholar] [CrossRef]
- Kang, S.; Lee, D.; Park, J.; Jung, J. Exploring Urban Forms Vulnerable to Urban Heat Islands: A Multiscale Analysis. Sustainability 2022, 14, 3603. [Google Scholar] [CrossRef]
- Dong, Y.; Coleman, M.; Miller, S.A. Greenhouse gas emissions from air conditioning and refrigeration service expansion in developing countries. Annu. Rev. Environ. Resour. 2021, 46, 59–83. [Google Scholar] [CrossRef]
- Liang, Z.; Wu, S.; Wang, Y.; Wei, F.; Huang, J.; Shen, J.; Li, S. The relationship between urban form and heat island intensity along the urban development gradients. Sci. Total Environ. 2020, 708, 135011. [Google Scholar] [CrossRef]
- Kolokotsa, D.; Lilli, K.; Gobakis, K.; Mavrigiannaki, A.; Haddad, S.; Garshasbi, S.; Mohajer HR, H.; Paolini, R.; Vasilakopoulou, K.; Bartesaghi, C.; et al. Analyzing the Impact of Urban Planning and Building Typologies in Urban Heat Island Mitigation. Buildings 2022, 12, 537. [Google Scholar] [CrossRef]
- Pérez-Arévalo, R.; Serrano-Montes, J.L.; Jiménez-Caldera, J.E.; Rodrigo-Comino, J.; Smith, P.; Caballero-Calvo, A. Facing climate change and improving emergency responses in Southern America by analyzing urban cyclonic wind events. Urban Climate. 2023, 49, 101489. [Google Scholar] [CrossRef]
- Henao, J.J.; Rendón, A.M.; Salazar, J.F. Trade-off between urban heat island mitigation and air quality in urban valleys. Urban Clim. 2020, 31, 100542. [Google Scholar] [CrossRef]
- Pérez-Arévalo, R.; Caballero-Calvo, A. El capital humano en las “ciudades creativas” latinoamericanas: El caso de Barranquilla y otras ciudades colombianas. Sociol. Urbana E Rural. 2021, 126, 79–96. [Google Scholar] [CrossRef]
- Eastin, M.D.; Hays, B.M.; Link, M.C. P1.6 Discriminating between tornadic and non tornadic soundings in tropical cyclones. In Proceedings of the 30th Conference on Hurricanes and Tropical Meteorology, Ponte Vedra Beach, FL, USA, 17 April 2012; Available online: https://ams.confex.com/ams/30Hurricane/webprogram/Paper205037.html (accessed on 12 December 2024).
- Edwards, R. Tropical cyclone tornadoes: A review of knowledge in research and prediction. Electron. J. Sev. Storms Meteor. 2012, 7, 1–61. [Google Scholar] [CrossRef]
- Diao XGMeng XGZhang LRen ZDZhao, H.J. Analysis of microscale vortex signature and early warning capability of tornadoes in the circulations of typhoons Yagi and Rumbia. J. Mar. Meteorol. 2019, 39, 19–28. [Google Scholar]
- Ortiz-Royero JCRosales, M. Severe tornadoes on the Caribbean coast of Colombia since 2001 and their relation to local climate conditions. Nat. Hazards 2012, 64, 1805–1821. [Google Scholar] [CrossRef]
- Berger, C.; Rosentreter, J.; Voltersen, M.; Baumgart, C.; Schmullius, C.; Hese, S. Spatio-temporal analysis of the relationship between 2D/3D urban site characteristics and land surface temperature. Remote Sens. Environ. 2017, 193, 225–243. [Google Scholar] [CrossRef]
- Han, D.; An, H.; Wang, F.; Xu, X.; Qiao, Z.; Wang, M.; Sui, X.; Liang, S.; Hou, X.; Cai, H.; et al. Understanding seasonal contributions of urban morphology to thermal environment based on boosted regression tree approach. Build. Environ. 2022, 226, 109770. [Google Scholar] [CrossRef]
- Therán-Nieto, K.R.; Pérez-Arévalo, R.; Marín-Carranza, J.; Caballero-Calvo, A. Variaciones del microclima local en zonas de tejido urbano abierto en clima tropical seco. Rev. AUS 2025, 36, 4. [Google Scholar] [CrossRef]
- Yang, X.; Yao, L.; Zheng, Y.; Zhang, S.; Xiao, X. Urbanization and climate change: Deciphering the temperature variability at multiple scales. Earth-Sci. Rev. 2020, 204, 103171. [Google Scholar]
- Ng, E.; Yuan, C.; Chen, L.; Ren, C.; Fung JC, H. Improving the wind environment in high-density cities by understanding urban morphology and surface roughness: A study in Hong Kong. Landsc. Urban Plan. 2012, 101, 59–74. [Google Scholar] [CrossRef] [PubMed]
- Elmes, A.; Cao, Q.; Rogan, J.; Wang, J. Effects of tree cover on urban surface temperatures. Environ. Res. Lett. 2017, 12, 034003. [Google Scholar]
- Arifwidodo, S.D.; Chandrasiri, O. Urban heat stress and human health in Bangkok, Thailand. Environ. Res. 2020, 185, 109398. [Google Scholar] [CrossRef]
- Johansson, E.; Emmanuel, R. The influence of urban design on outdoor thermal comfort in hot and humid climates: A case study in Colombo, Sri Lanka. Build. Environ. 2006, 41, 94–101. [Google Scholar] [CrossRef]
- Zhang, H.; Lin, C.; Liu, Q.; Zhao, L. Effects of vegetation on microclimate regulation. Build. Environ. 2023, 238, 110847. [Google Scholar]
- Krayenhoff, E.S.; Jiang, T.; Christen, A.; Martilli, A.; Oke, T.R.; Bailey, B.N.; Nazarian, N.; Voogt, J.A.; Giometto, M.G.; Stastny, A.; et al. A multi-layer urban canopy meteorological model with trees (BEP-Tree): Street tree impacts on pedestrian-level climate. Urban Clim. 2020, 32, 100590. [Google Scholar] [CrossRef]
- Huang, X.; Zhang, J.; Li, M. Urban canyon ventilation and temperature regulation. Atmos. Environ. 2022, 273, 118933. [Google Scholar]
- Kumar, B.; Sarkar, B. Determining the appropriate rotation angle in a vector-based method of sky-view factor calculation. Measurement. 2025, 244, 116384. [Google Scholar] [CrossRef]
- Santamouris, M. Analyzing the heat island magnitude and characteristics in one hundred Asian and Australian cities and regions. Sci. Total Environ. 2015, 512, 582–598. [Google Scholar] [CrossRef]
- Zhao, L.; Lee, X.; Smith, R.B.; Oleson, K. Strong contributions of local background climate to urban heat islands. Nature 2014, 511, 216–219. [Google Scholar] [CrossRef]
- Bowler, D.E.; Buyung-Ali, L.M.; Knight, T.M.; Pullin, A.S. Urban greening to cool towns and cities: A systematic review of the empirical evidence. Landsc. Urban Plan. 2010, 97, 147–155. [Google Scholar] [CrossRef]
- Erell, E.; Pearlmutter, D.; Williamson, T. Urban Microclimate: Designing the Spaces Between Buildings; Routledge: London, UK, 2011. [Google Scholar]
- Roth, M. Review of urban climate research in (sub) tropical regions. Int. J. Climatol. A J. R. Meteorol. Soc. 2007, 27, 1859–1873. [Google Scholar] [CrossRef]
- Akbari, H.; Pomerantz, M.; Taha, H. Cool surfaces and shade trees to reduce energy use and improve air quality in urban areas. Sol. Energy 2001, 70, 295–310. [Google Scholar] [CrossRef]
- Santamouris, M. On the energy impact of urban heat island and global warming on buildings. Energy Build. 2014, 82, 100–113. [Google Scholar] [CrossRef]
- Li, D.; Bou-Zeid, E. Synergistic interactions between urban heat islands and heat waves: The impact in cities is larger than the sum of its parts. J. Appl. Meteorol. Climatol. 2013, 52, 2051–2064. [Google Scholar] [CrossRef]
- Weng, Q. Thermal infrared remote sensing for urban climate and environmental studies: Methods, applications, and trends. ISPRS J. Photogramm. Remote Sens. 2009, 64, 335–344. [Google Scholar] [CrossRef]
- Oke, T.R. The energetic basis of the urban heat island. Q. J. R. Meteorol. Soc. 1982, 108, 1–24. [Google Scholar] [CrossRef]
- Ziter, C.D.; Pedersen, E.J.; Kucharik, C.J.; Turner, M.G. Scale-dependent interactions between tree canopy cover and impervious surfaces reduce daytime urban heat during summer. Proc. Natl. Acad. Sci. USA 2019, 116, 7575–7580. [Google Scholar] [CrossRef] [PubMed]
- Jiménez-Caldera, J.; Serrano-Montes, J.L.; Pérez-Arévalo, R.; Rodrigo-Comino, J.; Salvati, L.; Caballero-Calvo, A. A Conceptual Model for Planning and Management of Areas of Public Space and Meeting in Colombia. Land 2022, 11, 1922. [Google Scholar] [CrossRef]
- Jiménez-Caldera, J.; Durango-Severiche, G.Y.; Pérez-Arévalo, R.; Serrano-Montes, J.L.; Rodrigo-Comino, J.; Caballero-Calvo, A. Methodological proposal for the inclusion of citizen participation in the management and planning of urban public spaces. Cities 2024, 150, 105008. [Google Scholar] [CrossRef]
- Shashua-Bar, L.; Pearlmutter, D.; Erell, E. The cooling efficiency of urban landscape strategies in a hot dry climate. Landsc. Urban Plan. 2011, 100, 220–229. [Google Scholar] [CrossRef]
- Susca, T.; Gaffin, S.R.; Dell’Osso, G.R. Positive effects of vegetation: Urban heat island and green roofs. Environ. Pollut. 2011, 159, 2119–2126. [Google Scholar] [CrossRef]
- Lu, Q.-O.; Bahramloo, R.; Rodrigo-Comino, J.; Wang, J.; Talebi, A.; Tran, Q.T.P.; Ghahramani, A.; Sepehri, M. Evaluating the Impact of Roof Rainwater Harvesting on Hydrological Connectivity and Urban Flood Mitigation. Results Eng. 2025, 25, 104022. [Google Scholar] [CrossRef]
- Oke, T.R. Boundary Layer Climates; Routledge: London, UK, 1987. [Google Scholar]
- Shepherd, J.M. A review of current investigations of urban-induced rainfall and recommendations for the future. Earth Interact. 2005, 9, 1–27. [Google Scholar] [CrossRef]
- Bornstein, R.; Lin, Q. Urban heat islands and the potential for heat stress in US cities. Meteorol. Appl. 2000, 7, 369–376. [Google Scholar]
- Han, J.; Baik, J.J.; Lee, H. Urban impacts on precipitation. Asia-Pac. J. Atmos. Sci. 2014, 50, 17–30. [Google Scholar] [CrossRef]
- Bentley, M.L.; Stallins, J.A.; Ashley, W.S. Urban heat island effects on tornado occurrence in the United States. Clim. Res. 2019, 78, 31–44. [Google Scholar]
- Doswell, C.A.; Brooks, H.E.; Maddox, R.A. Flash flood forecasting: An ingredients-based methodology. Weather Forecast. 1996, 11, 560–581. [Google Scholar] [CrossRef]
- Brooks, H.E. Severe thunderstorms and climate change. Atmos. Res. 2013, 123, 129–138. [Google Scholar] [CrossRef]
- Rosenfeld, D.; Lohmann, U.; Raga, G.B.; O’Dowd, C.D.; Kulmala, M.; Fuzzi, S.; Reissell, A.; Andreae, M.O. Flood or drought: How do aerosols affect precipitation? Science 2008, 321, 1309–1313. [Google Scholar] [CrossRef]
- Grimmond CS, B.; Oke, T.R. Aerodynamic properties of urban areas derived from analysis of surface form. J. Appl. Meteorol. 1999, 38, 1262–1292. [Google Scholar] [CrossRef]
- Blocken, B. Computational Fluid Dynamics for urban physics: Importance, scales, possibilities, limitations and ten tips and tricks towards accurate and reliable simulations. Build. Environ. 2015, 91, 219–245. [Google Scholar] [CrossRef]
- Roth, M. Review of atmospheric turbulence over cities. Q. J. R. Meteorol. Soc. 2000, 126, 941–990. [Google Scholar] [CrossRef]
- Xie, X.; Luo, Z.; Huang, J. Influence of building morphology on urban ventilation and outdoor thermal comfort: A case study in a subtropical city. Sustain. Cities Soc. 2021, 72, 103010. [Google Scholar]
- Hang, J.; Li, Y.; Sandberg, M.; Buccolieri, R. The influence of building height variability on street canyon airflows: A large-eddy simulation study. Build. Environ. 2009, 44, 1982–1993. [Google Scholar]
- Huang, H.; Ooka, R.; Kato, S.; Horiguchi, K. The influence of urban heat island mitigation strategies on outdoor thermal comfort. Sol. Energy 2005, 79, 432–443. [Google Scholar]
- Wang, W.; Zhao, Z.; Chen, L. Investigating the impact of urban morphology on microclimate using CFD simulations: A case study in Nanjing, China. Sustain. Cities Soc. 2018, 42, 558–571. [Google Scholar]
- Britter, R.E.; Hanna, S.R. Flow and dispersion in urban areas. Annu. Rev. Fluid Mech. 2003, 35, 469–496. [Google Scholar] [CrossRef]
- Budhiraja, B.; Agrawal, G.; Pathak, P. Urban Heat Island effect of a Polynuclear Megacity Delhi-Compactness and Thermal Evaluation of four Sub-cities. J. Urban Clim. 2020, 32, 100634. [Google Scholar] [CrossRef]
- Kusaka, H.; Hara, M.; Takane, Y. Urban climate projections for future cities using regional climate models. Clim. Change 2012, 3, 91–112. [Google Scholar]
- Therán-Nieto, K.; Pérez-Arévalo, R.; Marín-Carranza, J.; Caballero-Calvo, A. Thermal Comfort and Microclimate in Indoor Spaces of Low-rise Residential Buildings in Dry Tropical Climate. J. Des. Built Environ. 2023, 23, 57–73. [Google Scholar] [CrossRef]
- Johansson, E.; Yahia, M.W.; Akbari, H. Outdoor thermal comfort in hot and dry cities: Microclimatic analysis of urban design strategies. Build. Environ. 2021, 202, 108025. [Google Scholar]
- Molina, I.; Gómez, F.; Jiménez, M.; Domínguez-Amarillo, S. Assessing urban overheating and its impact on human thermal comfort using local climate zones. Sustain. Cities Soc. 2021, 71, 102965. [Google Scholar]
- Rizwan, A.M.; Dennis LY, C.; Liu, C. A review on the generation, determination and mitigation of urban heat island. J. Environ. Sci. 2008, 20, 120–128. [Google Scholar] [CrossRef]
- González-Alemán, J.J.; Valero, F.; Martín León, F. Clasificación y análisis sinóptico de los ciclones subtropicales en el Atlántico Norte. Publicaciones Asoc. Española Climatol. Ser. A 2014, 9, 229–238. [Google Scholar]
- Holton, J.R. An Introduction to Dynamic Meteorology; Elsevier: Amsterdam, The Netherlands, 2004. [Google Scholar]
- Emanuel, K.A. Divine Wind: The History and Science of Hurricanes; Oxford University Press: Oxford, UK, 2005. [Google Scholar]
- European Centre for Medium-Range Weather Forecasts ECMWF. 2025. Available online: https://www.ecmwf.int/ (accessed on 12 December 2024).
- Markowski, P.; Richardson, Y. Mesoscale Meteorology in Midlatitudes; Wiley-Blackwell: Hoboken, NJ, USA, 2010. [Google Scholar]
- Fernando HJ, S. Fluid dynamics of urban atmospheres in complex terrain. Annu. Rev. Fluid Mech. 2010, 42, 365–389. [Google Scholar] [CrossRef]
- Wang, C.; Wang, Z.H.; Ryu, Y.H. A single-layer urban canopy model with transmissive radiation exchange between trees and street canyons. Build. Environ. 2021, 191, 107593. [Google Scholar] [CrossRef]
- Vélez, E.; Pérez, R.; Amaya, F.; Bula, A.; Olmos, A.; Sanjuan, M. Characterization of the thermal behavior of the materials commonly used in Colombia for the construction of building envelopes. In Energy Sustainability; American Society of Mechanical Engineers: New York, USA, 2014; Volume 45875, p. V002T06A001. [Google Scholar]
- Litardo, J.; Palme, M.; Borbor-Cordova, M.; Caiza, R.; Macias, J.; Hidalgo-Leon, R.; Soriano, G. Urban Heat Island intensity and buildings’ energy needs in Duran, Ecuador: Simulation studies and proposal of mitigation strategies. Sustain. Cities Soc. 2020, 62, 102387. [Google Scholar] [CrossRef]
- Li, X.; Zhang, Y.; Wang, F.; Liu, L. Influence of urban morphology on heat dissipation. Sustain. Cities Soc. 2024, 98, 104567. [Google Scholar]
- Li, X.; Zhou, Y.; Asrar, G.R.; Imhoff, M.; Li, X. The surface urban heat island response to urban expansion: A panel analysis for the conterminous United States. Sci. Total Environ. 2019, 695, 133780. [Google Scholar] [CrossRef] [PubMed]
- Arrau, F. Enfoques multiescalares para el estudio del clima urbano: Desafíos para la planificación en América Latina. Rev. INVI 2021, 36, 57–78. [Google Scholar]
- Grimmond, S.; Livesley, S.J.; Norton, B.A. Urban climate science for planning healthy cities: What is needed. Urban Clim. 2022, 41, 101064. [Google Scholar] [CrossRef]
- Oke, T.R.; Mills, G.; Christen, A.; Voogt, J.A. Urban Climates; Cambridge University Press: Cambridge, UK, 2017. [Google Scholar]
- Ren, C.; Ng, E.; Wang, W.; He, Q. Urban climate planning for cities in global south: Bridging the knowledge gap. Urban Clim. 2020, 34, 100684. [Google Scholar]
- Kabisch, N.; Qureshi, S.; Haase, D. Human–environment interactions in urban green spaces—A systematic review of contemporary issues and prospects for future research. Environ. Impact Assess. Rev. 2016, 50, 25–34. [Google Scholar] [CrossRef]
- Wang, Y.; Berardi, U.; Akbari, H. Comparing the effects of urban heat island mitigation strategies for Toronto, Canada. Energy Build. 2020, 229, 110492. [Google Scholar] [CrossRef]
- Zhang, K.; Zhou, W.; Han, L. The cooling effect of urban green vegetation and its variations in different urban spatial patterns: A case study in Beijing, China. Landsc. Urban Plan. 2017, 167, 37–46. [Google Scholar]
- Ng, E.; Chen, L.; Wang, Y.; Yuan, C. A study on the cooling effects of greening in a high-density city: An experience from Hong Kong. Build. Environ. 2012, 47, 256–271. [Google Scholar] [CrossRef]
- Anguelovski, I.; Connolly, J.J.T.; Pearsall, H.; Shokry, G.; Checker, M.; Maantay, J.; Gould, K.; Lewis, T.; Maroko, A.; Roberts, J.T. Why green “climate gentrification” threatens poor and vulnerable populations. Proc. Natl. Acad. Sci. USA 2020, 117, 22049–22055. [Google Scholar] [CrossRef]
Disclaimer/Publisher’s Note: The statements, opinions and data contained in all publications are solely those of the individual author(s) and contributor(s) and not of MDPI and/or the editor(s). MDPI and/or the editor(s) disclaim responsibility for any injury to people or property resulting from any ideas, methods, instructions or products referred to in the content. |
© 2025 by the authors. Licensee MDPI, Basel, Switzerland. This article is an open access article distributed under the terms and conditions of the Creative Commons Attribution (CC BY) license (https://creativecommons.org/licenses/by/4.0/).